Modeling footing resting on anisotropic sand using material point method
Liu Go,Dong Lio,Pin-Qing Mo
a School of Mechanics and Civil Engineering,China University of Mining and Technology,Xuzhou,221116,China
b School of Civil and Hydraulic Engineering,Huazhong University of Science and Technology,Wuhan,430074,China
Keywords:Material point method (MPM)Footing Constitutive model Anisotropy Inclined loading
ABSTRACT Sand typically exhibits anisotropic internal structure which may significantly influence its mechanical behavior.The material point method (MPM) can eliminate mesh distortion and thus is suitable for investigating geotechnical problems with large deformation.In this study,an advanced anisotropic critical state theory (ACST)-based soil model is implemented in MPM to study the response of strip footing resting on anisotropic sand.The capability of the model is verified by simulating several element tests and strip footing tests with different soil densities and fabric bedding plane orientations.For the footing problem with a vertical load,as the fabric bedding plane orientation increases,the bearing capacity decreases and its corresponding settlement increases.The failure pattern becomes asymmetrical when the bedding plane orientation or the loading direction is inclined.A comparison between the simulation results predicted by the anisotropic and isotropic models is made,which demonstrates that neglecting the fabric anisotropy may lead to the overestimation of the bearing capacity.
1.Introduction
The material point method(MPM)was first proposed by Sulsky et al.(1994) to avoid the mesh distortion issue that commonly exists in conventional finite element method (FEM) analysis.To enhance the numerical stability of the MPM,the generalized interpolation material point method (GIMP) was proposed by Bardenhagen and Kober (2004) to ease the stress jump that arises when material point crosses from one cell to another.Sadeghirad et al.(2011) developed an algorithm in which the particle domain may change with material motion.By doing so,the instability in extension,which is a common shortcoming of most particle methods,is eliminated.After decades of development,MPM combines the advantages of both mesh-and particle-based methods and has increasingly been used in modeling large-deformation geotechnical problems,including long run-out landslides (Soga et al.,2016;Tran and Sołowski,2019),pipe-soil interactions (Li et al.,2021),and multiscale problems (Liang and Zhao,2019).Similar to that in the FEM,the stress-strain relation in the MPM is described by constitutive model.To better reflect realistic soil behavior and give reasonable simulation results for geotechnical problems,the proper selection of the soil model is critical.Known soil constitutive models that are employed in the MPM to study geotechnical problems include the Mohr-Coulomb model(Sołowski and Sloan,2015),Norsand model (Martinelli and Pisanò,2022),hypoplastic model (Phuong et al.,2016),and J2-deformation type model (Zhang et al.,2022).
Because of the gravitational sedimentation process,soil deposit usually exhibits an anisotropic fabric structure with a horizontal bedding plane.The internal structure of soil can be characterized by a fabric tensor(Oda,1972;Kanatani,1984),which generally evolves during loading (Fonseca et al.,2013).Yang et al.(2008) used an image analysis-based technique to quantify the fabric anisotropy of granular soils.The anisotropic critical state theory(ACST)proposed by Li and Dafalias (2012) provides an efficient framework to describe the mechanical behavior of anisotropic soil.According to ACST,a normalized deviatoric fabric tensorFijis introduced,and it evolves toward a critical state value during the loading process following a simple evolution law.During the past few decades,many soil models that consider fabric anisotropy have been proposed,and some of them have been implemented into FEM to investigate the effect of fabric anisotropy on geotechnical problems(Sivasithamparam et al.,2015;Gao et al.,2021).Li et al.(2022)used an advanced soil constitutive model to simulate the braced excavation process.Zhang et al.(2022)predicted the lining response for twin tunnels constructed in anisotropic clay using machine learning techniques.Chen et al.(2022)quantitatively evaluated the response of slope failure related to the anisotropic spatial variability in soil properties using a random finite difference method(FDM).These studies show that fabric anisotropy plays an important role in the above geotechnical structures.
The design of strip footing is a classical geotechnical problem.The ultimate bearing capacityQultof strip footing can be obtained via the limit equilibrium method(Terzaghi,1943;Meyerhof,1951),stress characteristics method (Kumar,2009),upper-and lowerbound limit analyses (Chakraborty,2016),and FEM (Loukidis et al.,2008).However,the aforementioned studies are generally based on the assumption that the soil is isotropic.To investigate the effect of fabric anisotropy on the footing problem,Kimura et al.(1985) conducted several centrifuge tests of strip footing on dry Toyoura sand,considering the variations in relative density and fabric bedding plane orientation.Azami et al.(2010) conducted several small-scale footing tests on transversely isotropic crushed limestone.They all found thatQultincreases when the deposition direction of the soil is more aligned with the loading direction.Other studies based on 1gmodel tests(Oda and Koishikawa,1979;Kawamura and Miura,2014) present similar observations.By incorporating advanced constitutive models for anisotropic soil,numerical methods have been utilized to investigate this problem.The SANISAND-FR model (Papadimitriou et al.,2019) was implemented in the FDM by Chaloulos et al.(2019) to analyze the influence of fabric anisotropy onQultand the failure mechanism of the strip footing.Gao et al.(2021) and Liao and Yang (2021)employed other versions of ACST-based constitutive models to investigate a similar problem.Liang et al.(2021) and Guo et al.(2022) used the multiscale method to reveal the relationship between the macroscopic and microscopic responses of the footing resting on anisotropic soil.
All of the above studies focus on the case in which the loading direction of the footing is vertical downwards.In practice,rigid footings are usually subjected to inclined loads due to wind,water,or other horizontal loads.Meyerhof (1963) and Hansen (1970)produced a series of model tests to propose empirical and semiempirical inclination factors to estimate the effect of the inclination angle of loading onQult.Loukidis et al.(2008),Krabbenhoft et al.(2014) and Tang et al.(2015) used numerical analyses to calculate theQultof footing on sandy soil with eccentric and inclined loads.From these numerical results,it can be concluded thatQultis significantly influenced by the load inclination angle.
Table 1 summarizes the development of numerical modeling techniques for the footing problem.It can be seen that the combined influence of inclined load and fabric anisotropy on the response of footing has not yet been investigated.Moreover,to the best of our knowledge,the MPM has never been used in conjunction with anisotropic soil model to investigate the influence of fabric anisotropy on geotechnical problems.In fact,most constitutive models employed in the previous MPM studies are very simple,and hence they can give only qualitative simulation results.Since soil anisotropy widely exists in practical engineering,research on its effect on large-deformation problems is meaningful.In this paper,the anisotropic critical state soil model proposed by Li and Dafalias (2012) is implemented in the MPM to study the response of the strip footing resting on anisotropic sand under vertical and inclined loads.Numerical simulations of element tests and strip footing tests under different relative densities (Dr) and initial fabric bedding plane orientations are conducted to verify the capability of the model.The coupled effect of the inclination loading and initial fabric bedding plane orientation on the failure pattern,load-settlement curve,and local response of the footing is analyzed.A comparison of footings resting on isotropic and anisotropic soils with an inclined load is conducted.
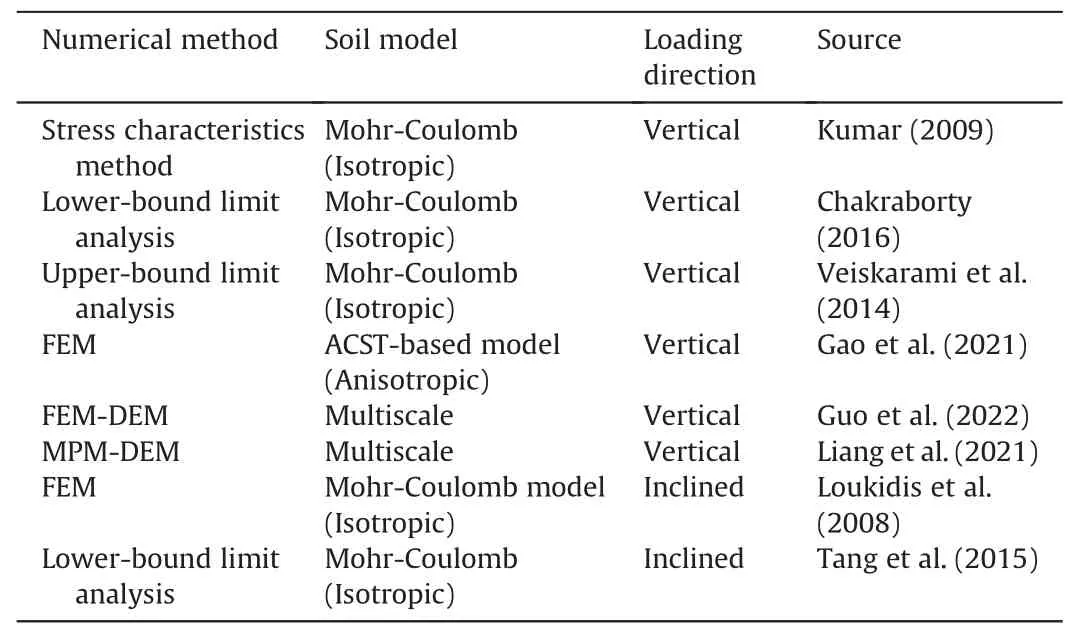
Table 1Development of numerical modeling techniques to solve footing problem.
2.MPM
The MPM discretizes a body into a cluster of material points that carry mass,stress and velocity,which are initialized at the beginning of the computation.Then,the information is mapped from the particles to the grid nodes in the following manner:
wheremiandmpdenote the node mass and particle mass,respectively;and viand vpdenote the node velocity and particle velocity,respectively;andSipis a weighting function that interpolates particle information to the grid nodes.
The internal forces at grid nodes are calculated as
whereVpdenotes the particle domain volume,and σpis the particle stress tensor.Combining the internal grid force with any external forces,the grid accelerationsaiare then computed as
The grid node velocity is updated by
Velocity gradients are calculated at the particle positions as follows:
These velocity gradients are then used to update the particle deformation gradientFpand further calculate the particle stress tensor using a constitutive model.
Then,the particles are advected using
Finally,the velocities of the material points are updated by the grid node velocities,and the deformed grid is discarded and set as the initial grid for the next step.By discarding the deformed grid at the end of each time step,the mesh distortion problem in the FEM can be avoided;thus,the MPM is quite suitable for dealing with problems with large deformation.
2.1.B2GIMP
The initial MPM formulation uses the gradient of aC0weighting function to map the particle stress to the grid,and the discontinuity of the weight function gradient causes a sudden stress change when the material point crosses from one cell to another.To solve this problem,several advanced MPM formulations have been proposed,including the GIMP (Bardenhagen and Kober,2004),the MPM using the B-spline shape function (Steffen et al.,2008),and the dual domain MPM(DDMP) (Zhang et al.,2011).
GIMP interpolates updated grid information to a particle using the gradient of a weighting functionSpi(x)constructed as a convolution of the FEM shape functionsNi(x)with the particle characteristic functionχp(x):
Characteristic functionsχp(x)are defined for each particle,and when it is set as the Dirac delta function,the conventional MPM formulation is recovered exactly.In this paper,the particle domains are assumed to be uniform as initial for all times,and the grid shape functionNi(x)is a quadratic spline function.This MPM formulation is called B2GIMP.
2.2.XPIC(m) method
When updating the velocity and position of a material point,two methods are currently available,i.e.particle in cell (PIC) and fluid implicit particle(FLIP).Although stable,the PIC method filters velocities that can lead to overdamping of kinetic energy in dynamic problems.In contrast,the FLIP method was developed by Brackbill et al.(1988)to reduce dissipation by eliminating velocity filtering,but it may simultaneously introduce noise that eventually reduces stability.The original MPM (Sulsky et al.,1994) uses the FLIP method and remains the standard MPM particle update method.Tran et al.(2020) proposed a converted particle least squares interpolation to remove the null space of the interpolation matrix in the FLIP method.Hammerquist and Nairn (2017) proposed an updated formulation referred to as XPIC(m)with ordermranging from 1 to+∞.
The matrix S,whose component isSpi(x),maps information from the grid to the particles,but the MPM also needs to map information from the particles to the grid.The matrix that maps information from the particles to the grid is denoted as S+.The current MPM implementation (Sulsky et al.,1994) uses S+,whose component is
wherempis the particle mass.
XPIC(m) proposes the following map relation from the grid acceleration vector aito the particle acceleration vector ap,which is used to update the particle velocity and position:
where vpis the velocity vector on particles,I denotes the secondorder unit matrix,Δtis the time step,andmis the order of the XPIC update.
XPIC(1) is identical to current PIC methods,which overfilter velocities and may dissipate kinetic energy.Asm→+∞,XPIC(m)asymptotically approaches a modified FLIP update that removes all noise associated with the null space of the extrapolation matrix.The value ofmis set as 4 in this paper,because it can maintain a good balance between numerical stability and energy dissipation.Note that not every step is updated by the XPIC(m) method;instead,we set 20 FLIP time steps between each XPIC(m)time step to further reduce energy dissipation.
The damping scheme proposed by Nairn (2015) is adopted in this paper,and the damping factor is set as 0.5 s-1for all the simulations conducted in the following sections.
3.Soil model accounting for fabric anisotropy
The constitutive model employed in this study is the ACST-based model proposed by Li and Dafalias(2012).A deviatoric fabric tensor is used to describe the internal structure of anisotropic sand,and the fabric evolution and its influence on the sand behavior are properly considered.To enable the MPM simulation,in this section,the model originally formulated in triaxial stress space is further extended to multiaxial stress space following a similar approach in Liao et al.(2021).A brief introduction of this model is provided in this section.
3.1.Elastic modulus
The following isotropic pressure-sensitive elastic relation is adopted to calculate the elastic deviatoric and volumetric strain incrementsand:
whereGandKdenote the elastic shear and bulk moduli,respectively,which can be expressed as (Richart et al.,1970):
whereG0is a material constant;v is the Poisson’s ratio;eis the current void ratio;andpandpa=101 kPa are the current mean and atmospheric pressures,respectively.
3.2.Yield function
The yield function can be expressed as
The termg(θ)in Eq.(14) is an interpolation function based on the Lode angleθ(Li,2002):
wherec=Me/Mcis the ratio between the critical state stress ratio in triaxial extension and that in compression.
3.3.Dilatancy
The following fabric-dependent dilatancy relation is used in the model:
whered1andmare two model constants;and dand ddenote the plastic volumetric and shear strain increments,respectively;andζis the dilatancy state parameter defined as follows:
whereeAis a model parameter;andψ=e-ecis the state parameter proposed by Been and Jefferies (1985),whereeis the current void ratio andecis the critical state void ratio corresponding to the current mean stressp.In the present work,the critical state line in thee-pplane is given by(Li and Wang,1998):
whereeΓ,λcandξare three material constants.
Eq.(17) includes a fabric anisotropy variableAin the dilatancy state parameter,which is defined by the following joint invariant of fabric tensorFijand the loading direction tensornij:
whereFijis a symmetric deviatoric tensor whose normrepresents the degree of fabric anisotropy and whose critical state value equalsFc=1.For an initially cross-anisotropic sample with the isotropic plane being thex-yplane and the deposition direction aligning with thez-axis,Fijcan be expressed as follows:
whereF0is the initial degree of fabric anisotropy.The deviatoric unit loading direction tensornijin Eq.(19) is defined as follows:
withNij=∂/∂rij,where=R/g(θ),whose detailed formulation can be found in Gao et al.(2014).
The evolution law forFijcan be expressed as
whereLis the plastic loading index;kfis a material constant that controls the evolution speed of the fabric tensor;and 〈·〉 is the Macauley bracket,with〈L〉=LforL>0 and〈L〉=0 for anyL≤0.
3.4.Plastic modulus
The plastic modulus of the model is given as
whereh1,h2andnare three model parameters.A significant advantage of this formulation is the consideration of the combined influence of density,confining pressure,and fabric anisotropy on the hardening property of the soil model.
The above soil model is implemented in the open-source software NairnMPM using the C++language.A substepping explicit integration scheme (Sloan,1987) is adopted to update the stress and the other state variables.All the cases in the following sections are simulated on a desktop PC.
4.Single element test
In this section,both plane strain and triaxial element tests are simulated using the MPM to verify the validity of the model and its implementation.For the plane strain test,the element size is set as 1 m×1 m,and a sole material point is located at the center of the element,as shown in Fig.1.Symmetry boundary conditions are applied to the left and bottom sides,and an initial confining pressure ofp0is applied to the top and right sides.Subsequently,a rigid boundary condition with a velocity of 0.01 m/s is applied on the top of the model to compress the material point.For triaxial compression tests,a 3D cubic grid with dimensions of 1 m × 1 m × 1 m is used.Toyoura sand has a mean diameter ofd50=0.17 mm and maximum and minimum void ratios ofemax=0.977 andemin=0.597,respectively,such that the relative density can be calculated byDr=(emax-e)/(emax-emin).The model parameters calibrated for Toyoura sand are listed in Table 2,and the calibration procedure can be found in Li and Dafalias (2012).The definition of fabric bedding plane orientationαis shown in Fig.1.The horizontal and vertical fabric bedding plane orientations correspond toα=0°and 90°,respectively.
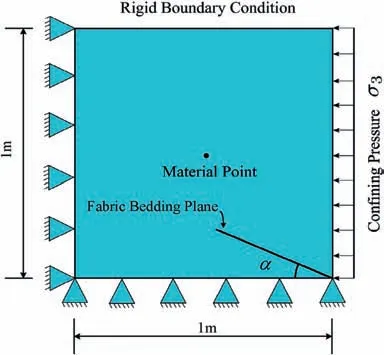
Fig.1.Plane strain test model.
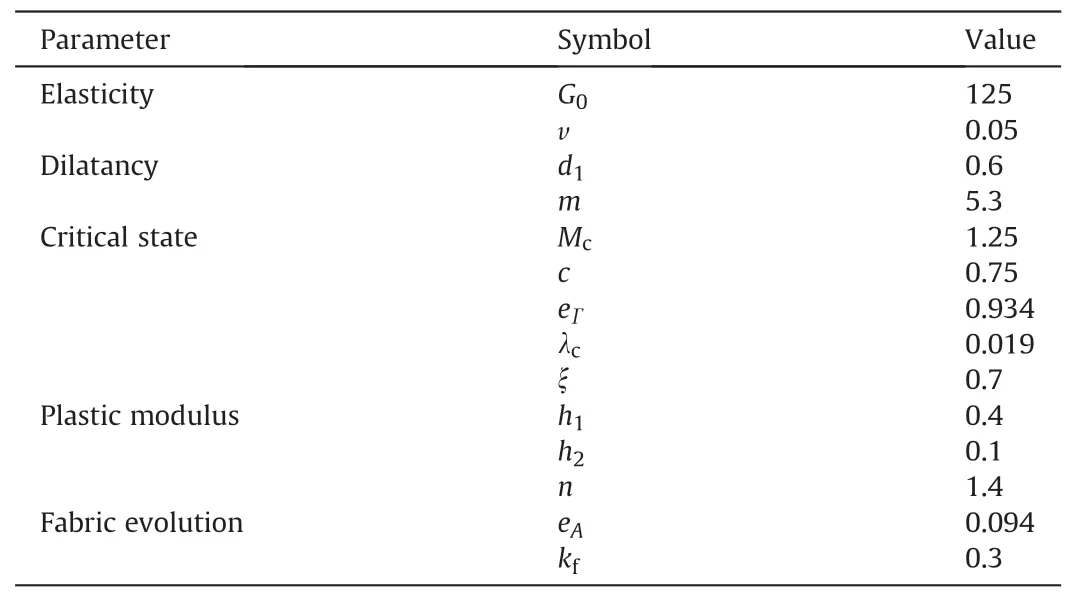
Table 2Model parameters for Toyoura sand (anisotropic model).
Fig.2 shows the simulation results of the plane strain tests on dense Toyoura sand atα=0°and 90°.The initial void ratioe0is 0.66,corresponding to a relative density ofDr=83.4%.Fig.2a and b and Fig.2c and d are the results for tests withp0=50 kPa and 200 kPa,respectively.In general,the sample withα=0°exhibits higher shear strength and stiffness and a more dilative volumetric response than that withα=90°.Fig.3 presents model simulations for the drained triaxial compression tests on Toyoura sand withα=0°and various confining pressures (p0=50-400 kPa) and densities(Dr=73.9%-83.9%for dense sand andDr=37.4%-38.9%for loose sand).The comparison indicates that the model can simulate the sand behavior under a wide range of densities and confining pressures with satisfactory performance,although the volumetric response is slightly underestimated.Note that the plane strain tests in Fig.2 exhibit strain localization,manifested by the strong strain-softening response.According to Oda et al.(1978),Gao and Zhao (2013),and Liao et al.(2021),the stress-strain relation after strain localization cannot be treated as the real element response of the soil sample and hence should not be compared with the model predictions.
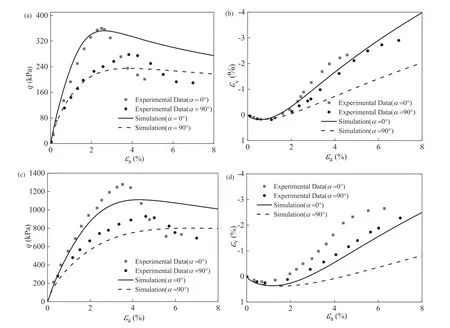
Fig.2.Comparison of experimental data(Fukushima and Tatsuoka,1984)and simulation results for drained triaxial compression tests on Toyoura sand:(a,b)p0=50 kPa,and(c,d)p0=200 kPa.
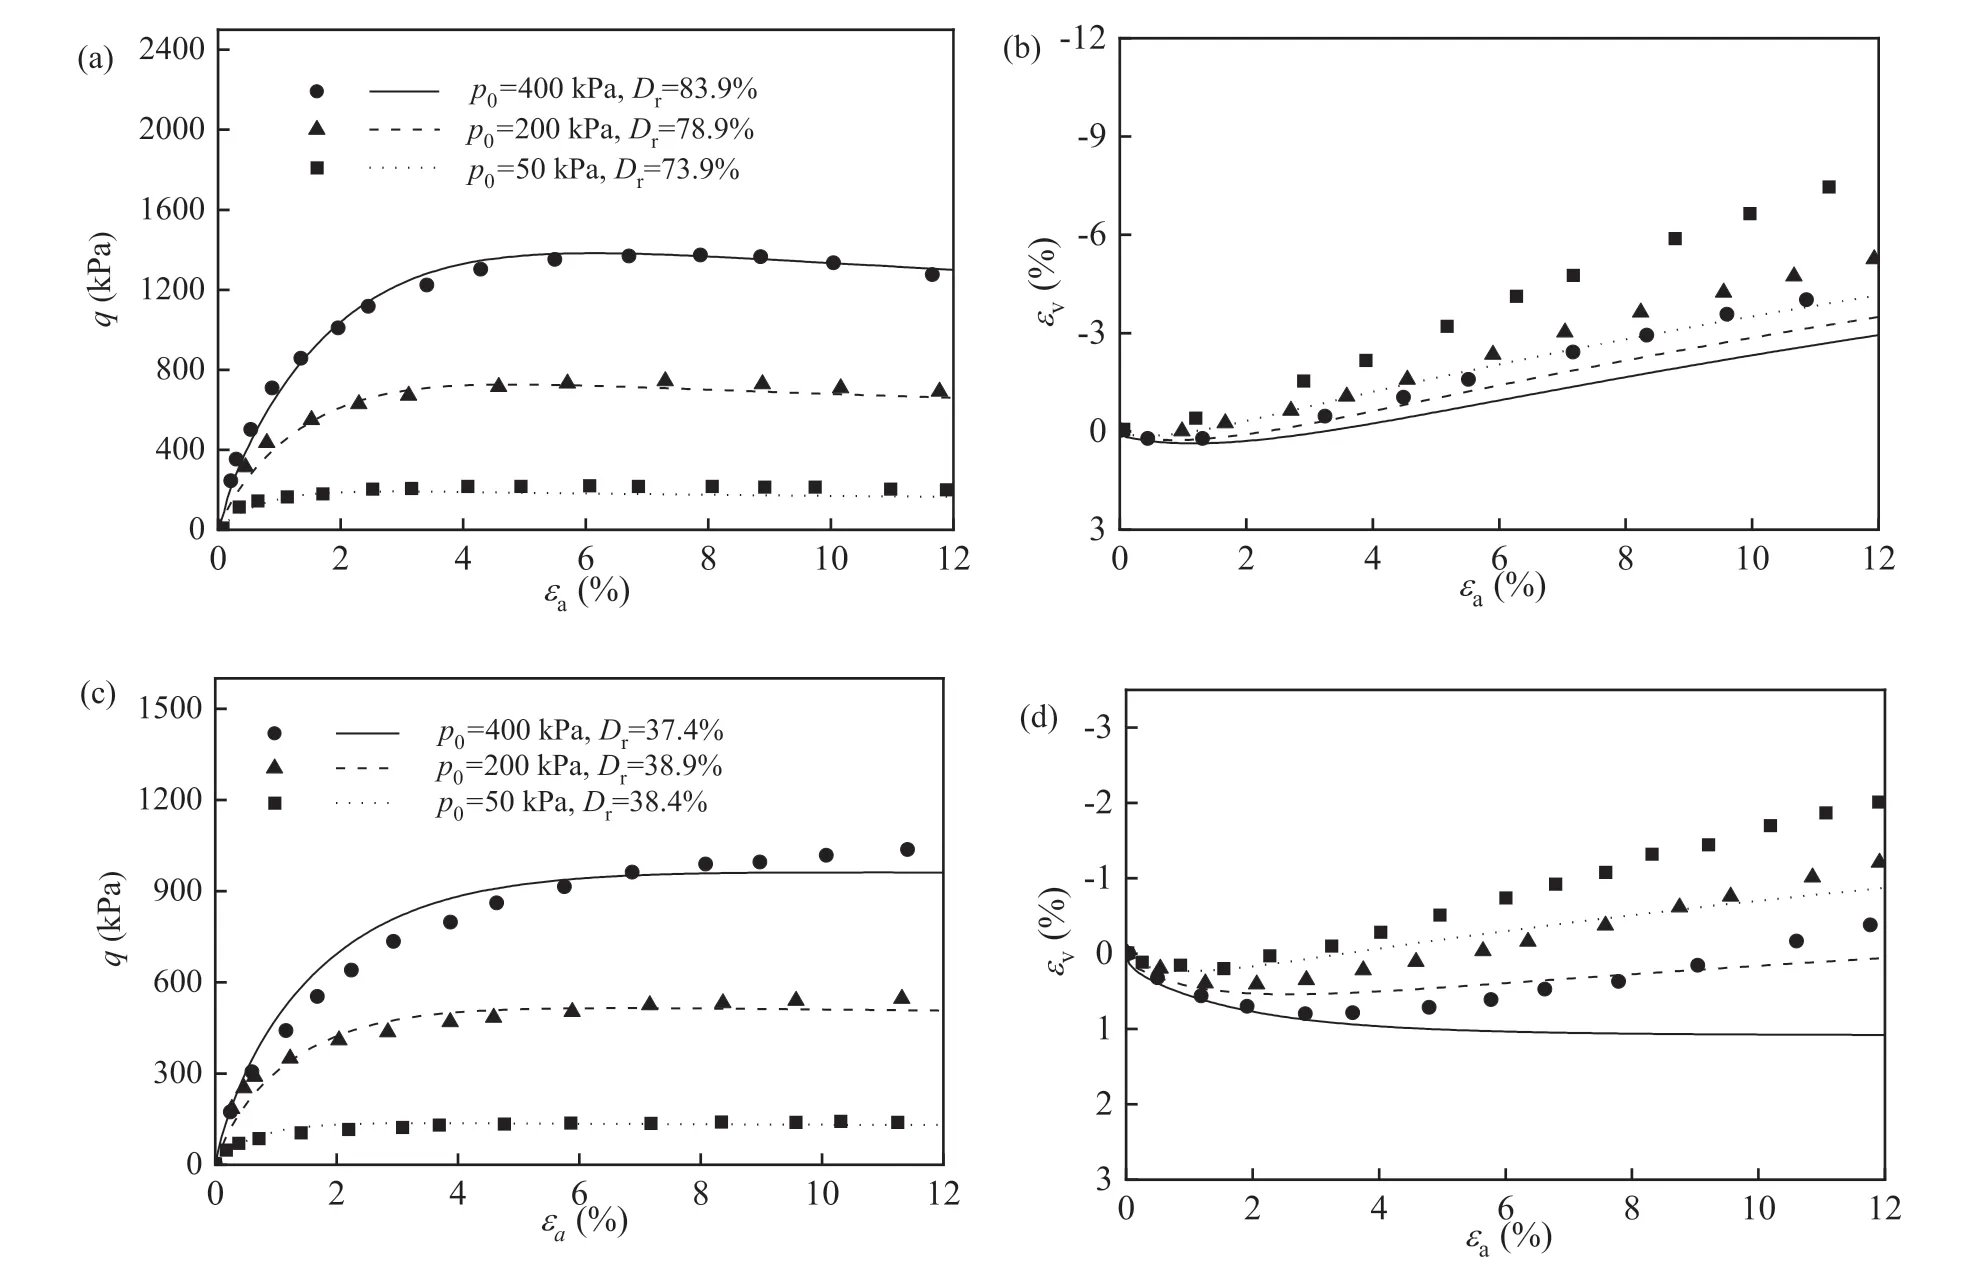
Fig.3.Comparison of experimental data(Fukushima and Tatsuoka,1984)and simulation results for drained triaxial compression tests on Toyoura sand:(a,b)Dense sand,and(c,d)Loose sand.
5.Numerical model for footing
This section presents the MPM simulation process of the centrifuge tests conducted by Kimura et al.(1985),which refer to the vertical loading of strip footings on dry Toyoura sand layers with different relative densitiesDrand initial fabric bedding plane orientationsα.The tests were performed under a centrifugal acceleration of 30g,with a strip footing width of 30 mm,corresponding toB=0.9 m in the prototype.
5.1.Numerical model
The model setup of the footing problem is illustrated in Fig.4.A rough rigid foundation with widthB=0.9 m is initially set at the top middle of the soil,which is the same as the prototype size converted from the model scale in the centrifuge tests (Kimura et al.,1985).As the size of the soil box used in the centrifuge tests is not reported in Kimura et al.(1985),the height and width of the soil body are assumed to be 6.3 m and 12.6 m (at the prototype scale),respectively,which are large enough to eliminate the boundary effect on the footing response,and this will be further discussed in Section 6.4.Rigid walls are set at the left,right and bottom boundaries of the soil to constrain its movements.A square plane strain element with dimensions of 0.09 m × 0.09 m is used,and each element is assigned one material point.The unit mass density is set as 1600 kg/m3according to Kimura et al.(1985).A constant,uniform surcharge ofp=1 kPa is applied on the ground surface except for the resting area of the footing to enhance the numerical stability of the model.The initial stress state is generated by applying a gravity of 9.8 m/s2with an initial lateral earth pressure coefficientk0=0.4.Then,to model the footing penetration,a vertical downward velocity of 0.045 m/s is applied to the bearing area while its horizontal displacement is fixed.
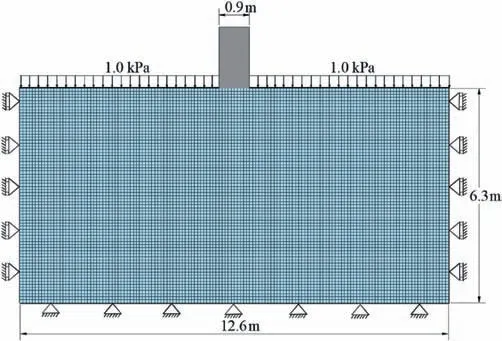
Fig.4.Model setup for the strip footing test.
Finite element analysis involving materials with softening behavior may suffer from nonuniqueness of the solution,as evidenced by the nonconvergence of the solution.Both FEM studies(Gao et al.,2020;Liao and Yang,2021)and FDM studies(Chaloulos et al.,2019)encounter this problem,and the MPM also suffers from this issue.Chaloulos et al.(2019)noted that the most efficient way to address these numerical pitfalls and obtain reasonable results is to calibrate the mesh against a known case rather than continuously refine it.Therefore,in this paper,the mesh is calibrated to render the bearing capacity that fit best with the three groups of centrifugal tests reported by Kimura et al.(1985).Another approach to solving this problem is to implement nonlocal theory into the MPM (Burghardt et al.,2012).
5.2.Comparison with experimental results
Fig.5 presents the simulation results of the load-displacement curves in the strip footing tests with different densities and bedding plane orientations in comparison with experimental data from Kimura et al.(1985).The two most important properties of the load-displacement curves are the ultimate bearing capacityQultand its arrival settlementSult.Fig.5a,c and e illustrate the effect of the relative densityDron the load-settlement curve atα=0°.Qultdecreases significantly asDrdecreases,and this conclusion also holds for the cases withα=90°,as shown in Fig.5b,d and f.Moreover,the load-settlement curves forα=0°exhibit largerQultand smallerSultvalues than those forα=90°.For the experimental results,the slope of the load-settlement curve during the hardening stage is obviously affected by the bedding plane orientation:the slope forα=0°is significantly greater than that forα=90°.However,for the numerical results,this difference is significantly smaller.The numerical results of the softening stage after failure are less stable because when material softening occurs,plastic deformation often localizes into a discrete region,which has been shown to result in a loss of hyperbolicity and ill-posedness of the governing equations.
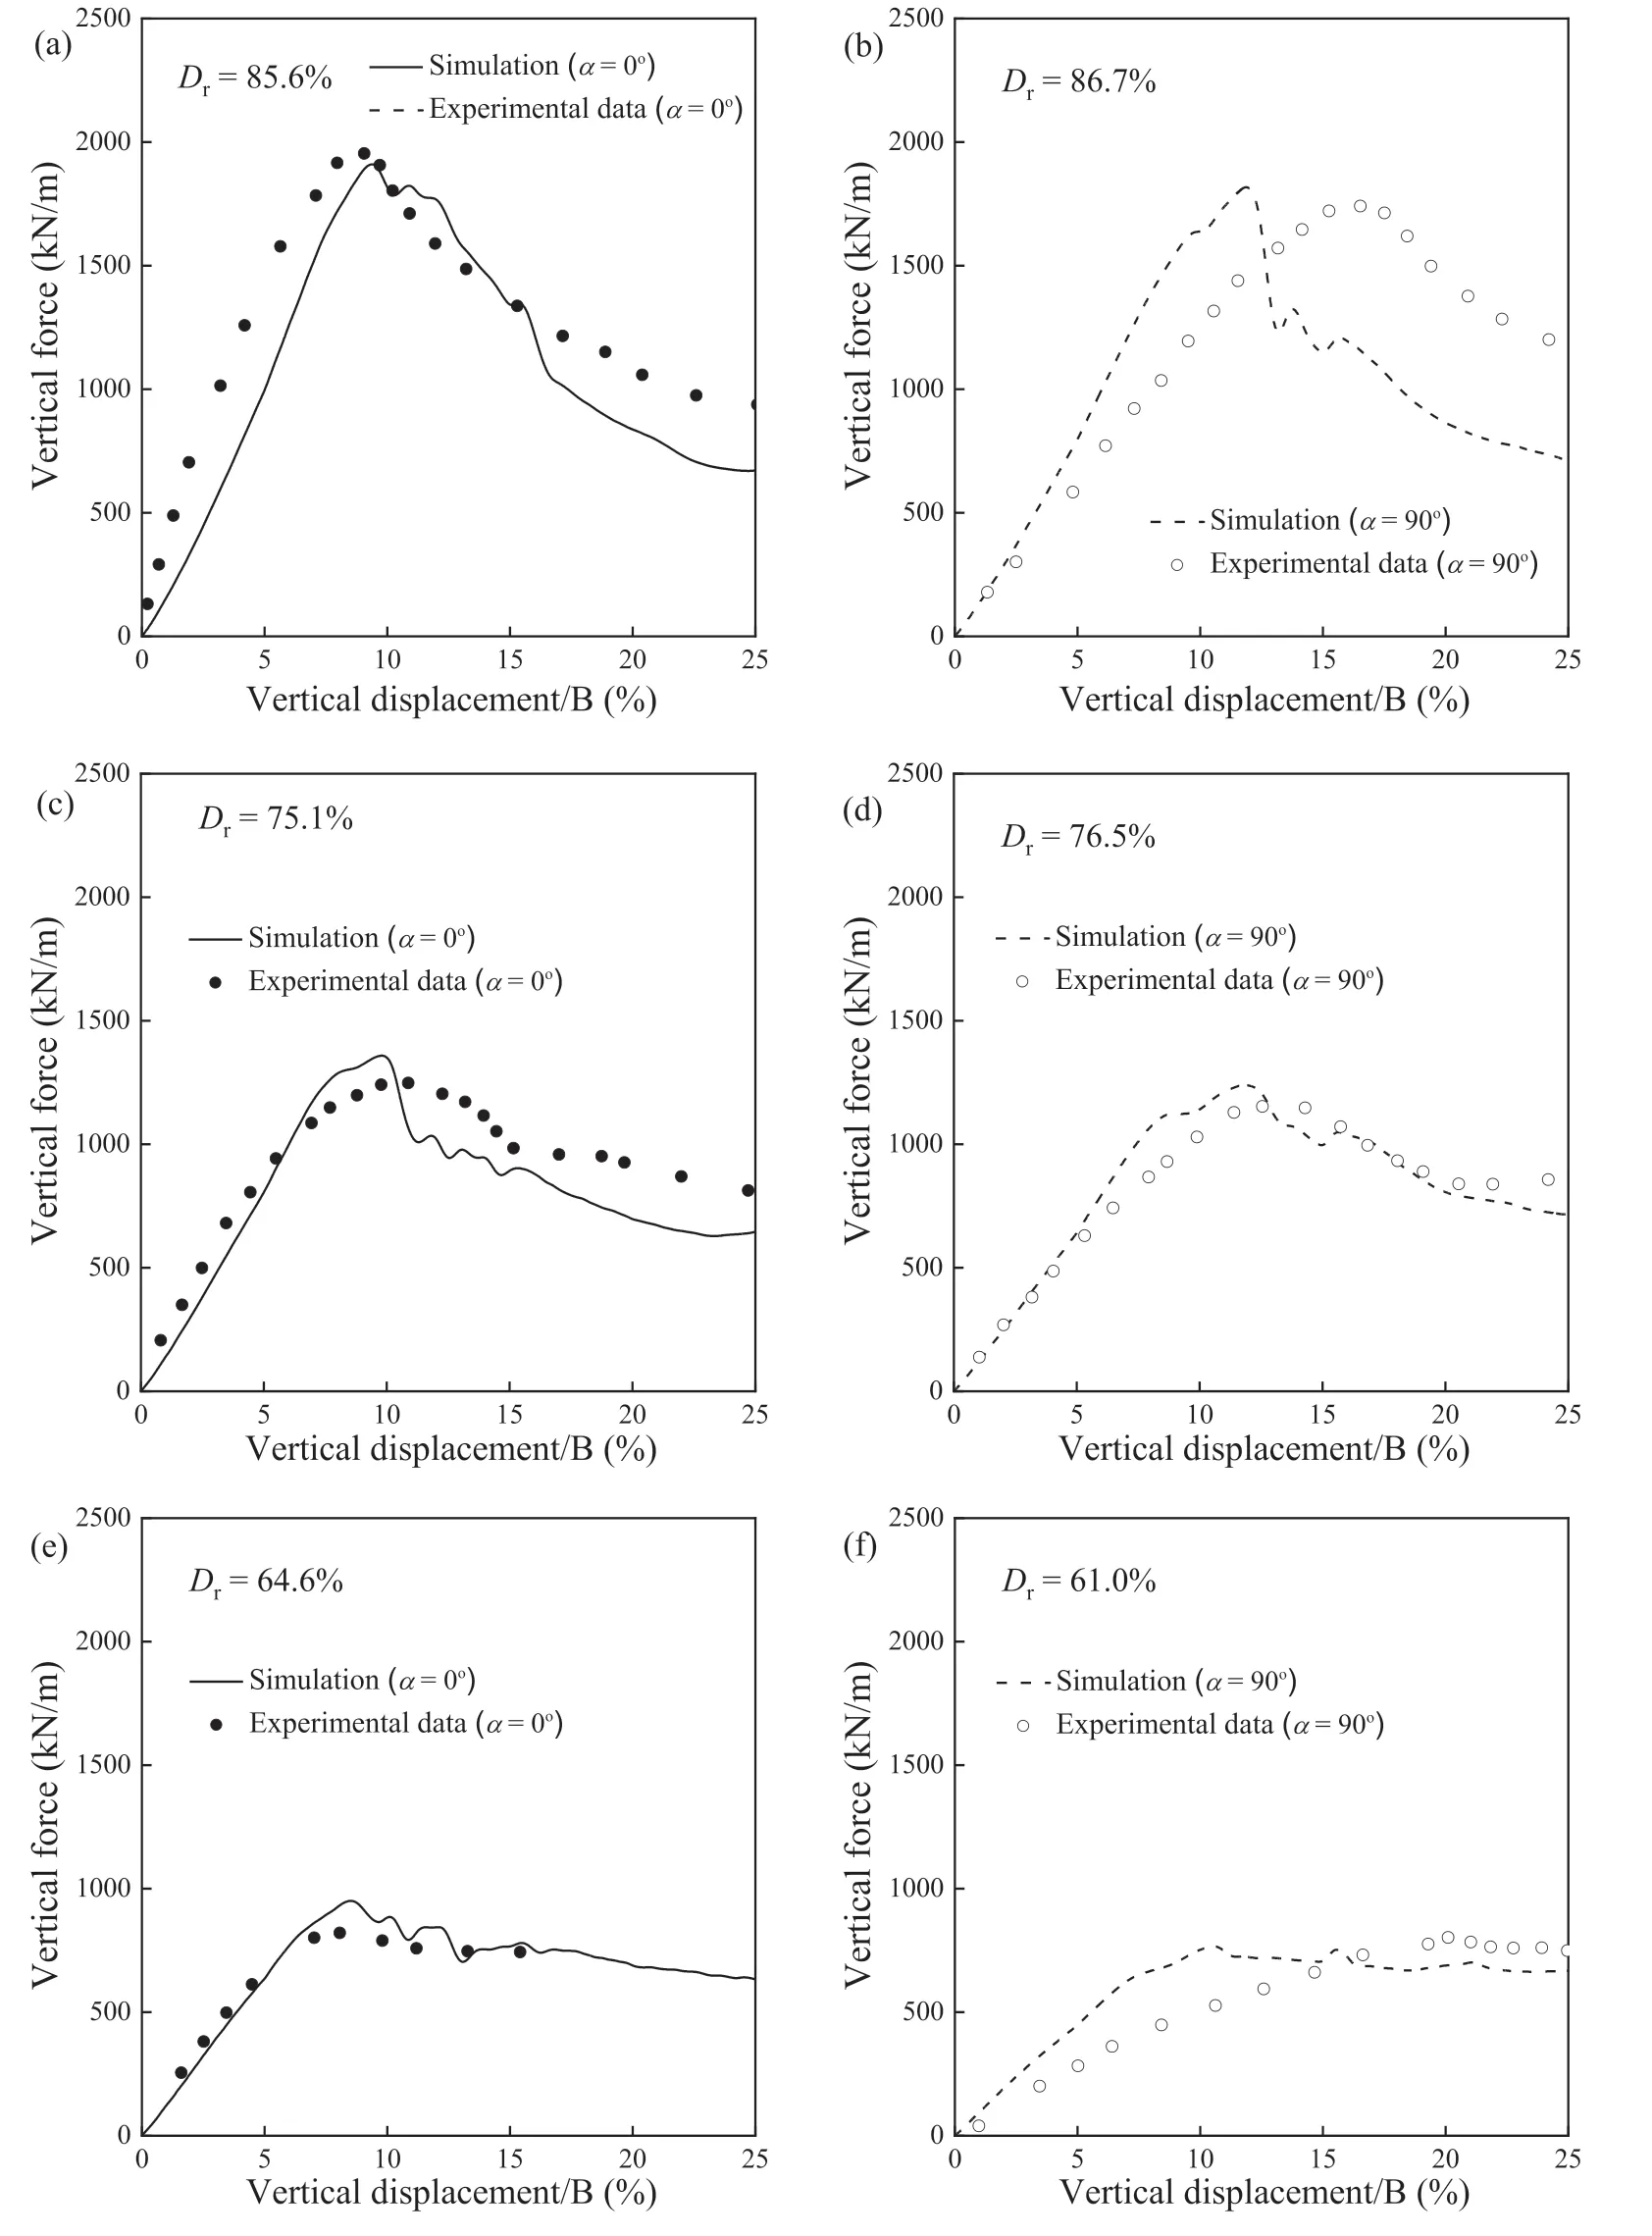
Fig.5.Comparison between the experimental data (Kimura et al.,1985) and simulation results of load-settlement curves for tests with different densities and bedding plane orientations.
Overall,the MPM simulation results predicted by the ACST model can broadly capture the load-settlement behavior measured in footing tests with varying densities and fabric bedding plane orientations of the sand mass.
5.3.Boundary effect in footing problem
The boundary constraint may restrict the displacement of the soil body,hence it has a significant influence on the failure mode and bearing capacity of the strip footing.However,as mentioned above,the exact size of the soil box used in the centrifuge tests is not reported in Kimura et al.(1985).Therefore,to analyze the boundary effect on the footing response,the strip footing test withDr=85.6% andα=0°is resimulated with different soil body geometries.
All the geometrical parameters remain the same as those in Section 5.1 except for the soil widthL.Fig.6 shows the shear strain contours forL=10.8 m,12.6 m and 14.4 m at a penetration depth ofS=0.5B,at which the failure pattern is fully formed.The failure modes forL=12.6 m and 14.4 m are similar but differ significantly from these forL=10.8 m.In particular,compared with that in theL=12.6 m and 14.4 m cases,the active wedge in theL=10.8 m case is sharper,and its passive zone is larger.Fig.7 shows the loadsettlement curves in these three cases.It can be observed thatLhas little influence on the ultimate bearing capacityQultand the corresponding footing settlementSultbut may significantly affect the residual forceQres,especially whenLis not large enough.This phenomenon could be attributed to the larger failure zone in theL=10.8 m case,which leads to a higherQres,as will be demonstrated in following section.

Fig.6.Shear strain contours in footing tests with different soil widths L of (a) 10.8 m,(b) 12.6 m,and (c) 14.4 m.
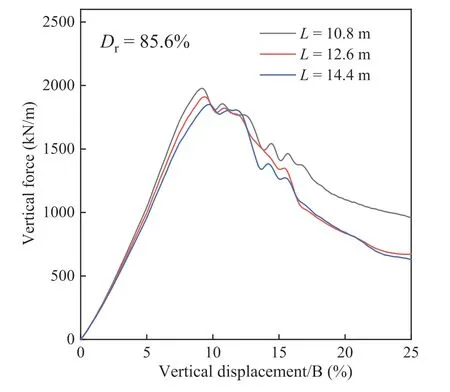
Fig.7.Load-settlement curves in footing tests with different soil widths L.
6.Numerical simulation of footing resting on anisotropic soil with vertical loading
6.1.Failure pattern
To further investigate the effect of fabric anisotropy on the macroscopic failure pattern of the strip footing,Fig.8 presents the MPM simulation results in terms of the shear strain contours for tests withDr≈86%and differentαvalues at settlementS/B=0.5.As shown in Fig.8a,the failure pattern consists of an active triangular wedge,a fan section at its side and a passive wedge that reaches the ground surface.The shear strain contours show that the failure pattern in theα=0°or 90°case is symmetrical,while it is slightly asymmetrical in theα=45°case and significantly asymmetrical in theα=20°and 70°cases.For the asymmetrical patterns atα=20°,45°and 70°,the passive wedge on the left side is larger than that on the right side.Compared with other FEM studies(Chaloulos et al.,2019;Gao et al.,2020;Liao and Yang,2021),the results in Fig.8 are more consistent with the experimental data reported by Kimura et al.(1985),as these studies underestimate the influence of fabric anisotropy on the failure mode of the strip footing.
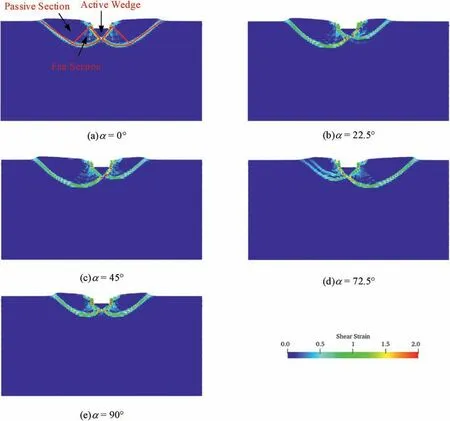
Fig.8.Shear strain contours in footing tests with different α values and Dr=85.6%.
Fig.9 plots the load-settlement curves for differentαvalues.The increase inαmay lead to a lowerQultbut higherSult.In contrast,the bedding plane orientation has little influence on the residual bearing capacityQres.
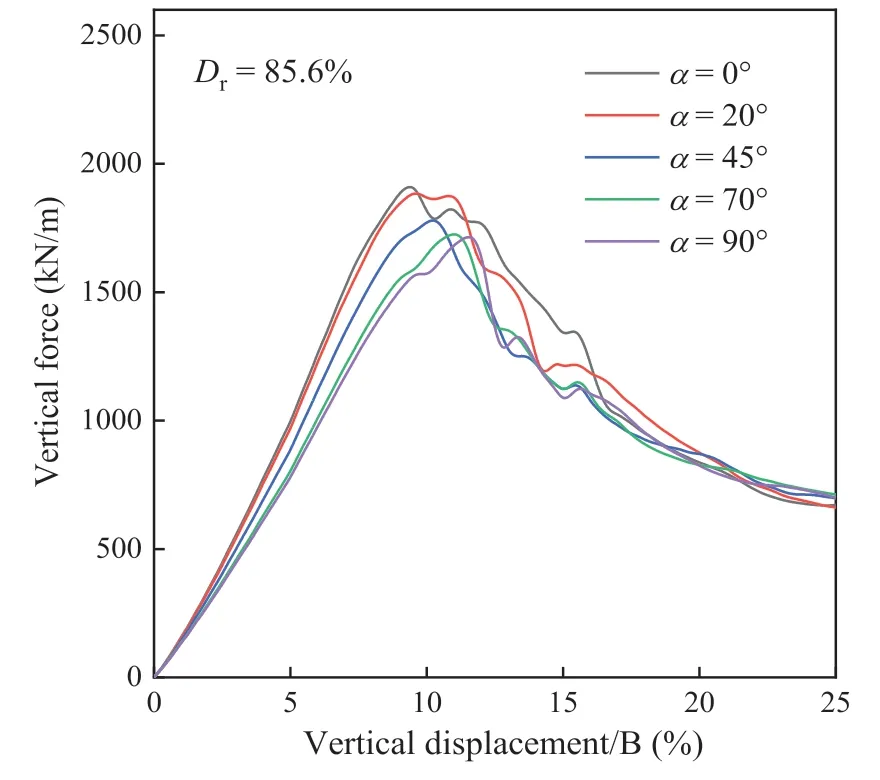
Fig.9.Load-settlement curves for different α values with Dr=85.6%.
Fig.10 presents the shear strain contours for the test withα=0°whenQreaches its peak value (S=Sult=0.095B).The general failure pattern is characterized by a fully developed shear band that originates from the tip of the active wedge and extends to the ground surface.Conventional footing design calculations generally relateQultto the full formulation of the general failure mechanism.It can clearly be observed from Fig.8 that whenQultis reached,the general failure is only partially developed,consistent with the centrifuge test result (Aiban and Znidarčić,1995) and FDM result(Chaloulos et al.,2019).The MPM results in Fig.8a indicate that the general failure mechanism is fully formed whenS/B=0.5.In contrast,the FDM results obtained by Chaloulos et al.(2019) indicate that the general failure mechanism is only partially developed,even whenS/B=0.52,while the centrifuge test results by Aiban and Znidarčić (1995) show that the general failure mechanism is fully formed whenS/Bis slightly smaller than 0.4.Overall,the above numerical and experimental results show that the formulation of the general failure mechanism is delayed to the arrival ofQult.
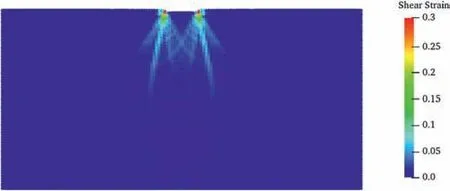
Fig.10.Shear strain contours in footing test with Dr=85.6% at Sult.
Fig.11 shows the displacement contours in tests withDr=85.6% and differentαvalues.The displacement mainly occurs in three sections,i.e.the active triangular wedge,the fan section,and the passive wedge,which are surrounded by shear bands.The triangular wedge below the strip footing is compressed downwards vertically due to penetration,pushing the fan section on its side and forcing the soil mass in the passive wedge to move upwards.Similar to the contour of the shear strain in Fig.8,the mobilization mass at both sides is symmetrical in theα=0°and 90°cases.While in theα=20°,45°and 70°cases,the mobilization area on the right side is larger than on the left side.
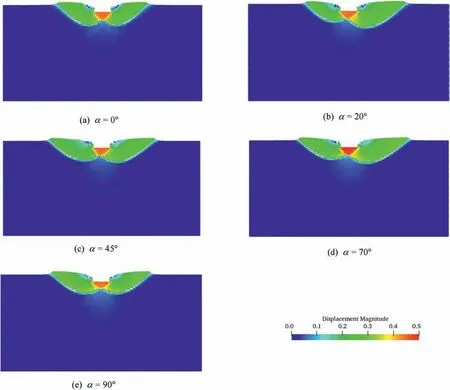
Fig.11.Displacement contours in footing tests with different α values and Dr=85.6%.
6.2.Local analysis and distribution of variables associated with fabric
To better understand the effect of fabric anisotropy on the macroscopic footing response described above,this section analyzes the local response and the distribution of variables associated with fabric.
Fig.12 depicts the contours ofN=for tests with differentαvalues atS/B=0.0125,which is very small,thus they reflect the distribution ofNat the initial stage of loading.In theα=0°case,N0>0.9 holds below the footing,implying that the fabric directionis close to the loading directionnij.Asαincreases,the distribution ofNshows an asymmetrical pattern,and the value ofNon the left side below the footing is larger than that on the right side.In the test withα=90°,the value ofNin the vicinity of the footing is larger than that below,contrary to theα=0°case.
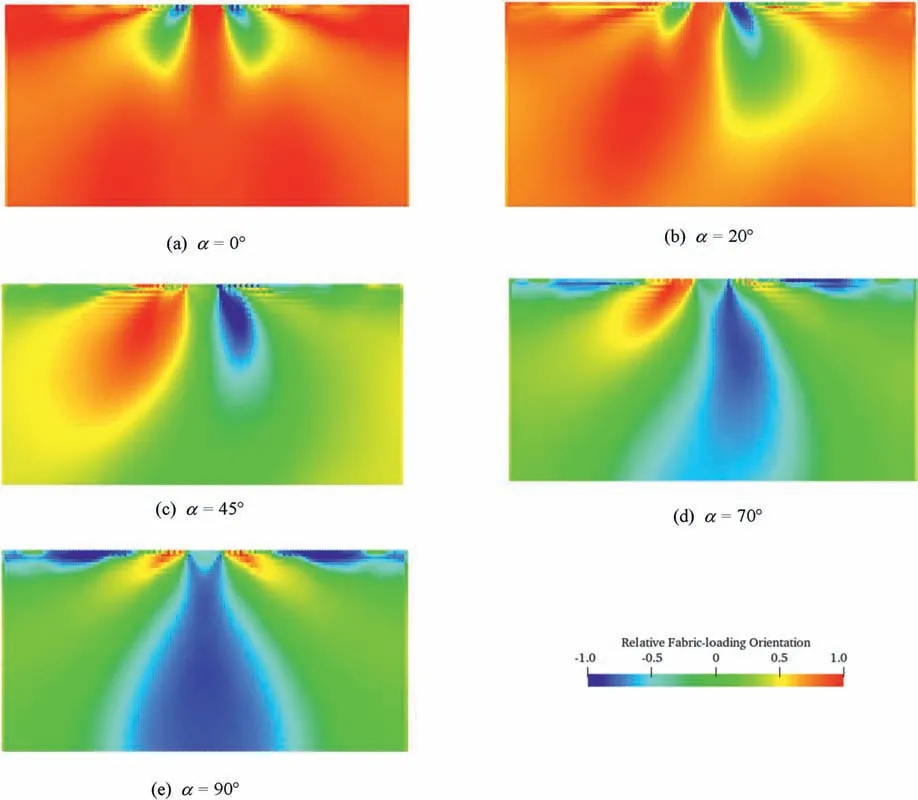
Fig.12.Relative fabric-loading orientation N for different α values at S/B=0.0125.
As shown in Fig.13,for the purpose of illustration,the two shear bands that surround the active wedge are labeled shear bands I and II,respectively,and the outer shear bands that surround the left and right passive sections are labeled shear bands III and IV,respectively.Local pointsA,BandC,which are located in the middle of shear bands I,II and III,respectively,are selected for the following local response analysis.
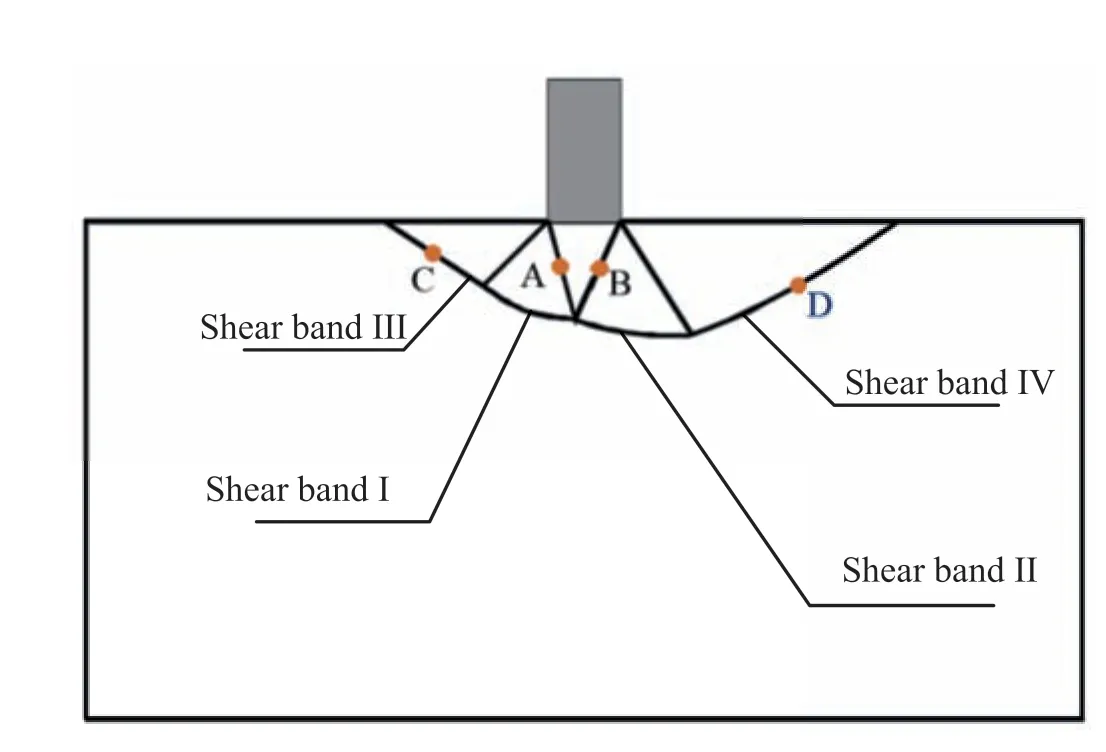
Fig.13.Points A,B and C in the shear band during the footing loading process.
Fig.14 depicts the contour of the fabric normFin tests with differentαatS/B=0.5,and Fig.15b and d presents the evolution ofFat pointsAandC.Owing to the significant strain localization,the fabric evolution is concentrated within the shear band.As shown in Fig.12a,for theα=0°case,the values ofN>0.8 are observed at pointsAandB,indicating that the fabric direction is close to the loading direction.Therefore,Fkeeps increasing during the footing process,as shown in Fig.14b.In contrast,the value ofNis smaller than 0 at pointC,which leads to a gradual adjustment of the fabric direction toward the loading direction,accompanied by a reduction inF(Fig.15d).Consequently,in the test withα=0°,the value ofFbelow the footing is larger than that in the vicinity,as shown in Fig.14a.The opposite tendency is observed in the test withα=90°.For theα=20°,45°and 70°cases,the distribution ofFis no longer symmetrical.As shown in Fig.15b and d,with the increase inα,the value ofFdeceases at pointAbut increases at pointC.
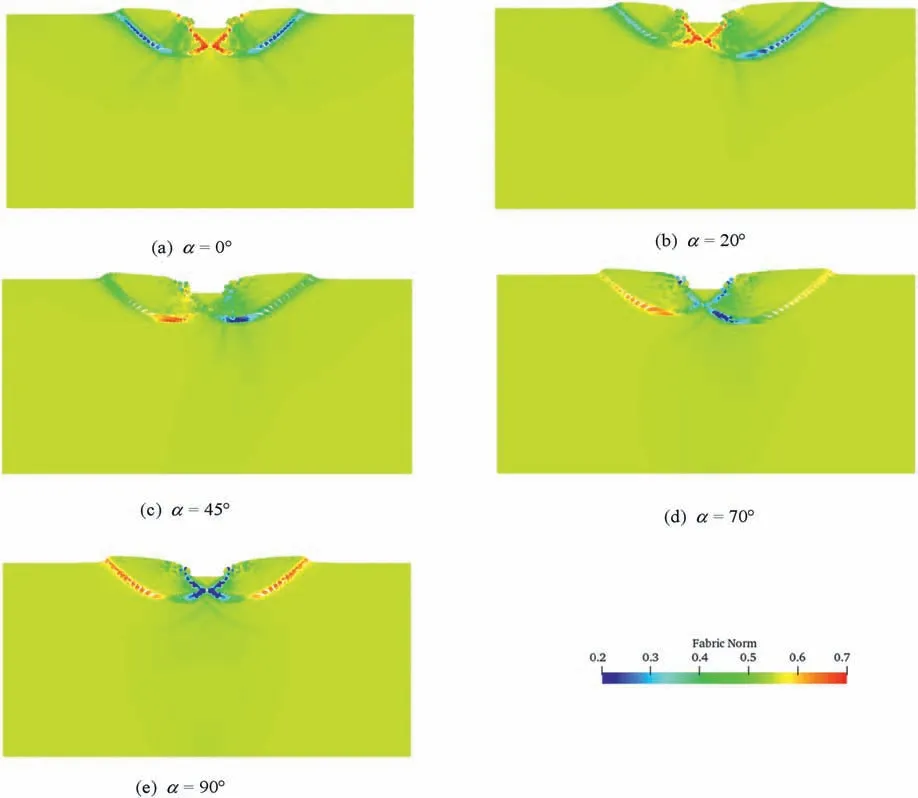
Fig.14.Fabric norm contours in footing tests with different α values and Dr=85.6%.
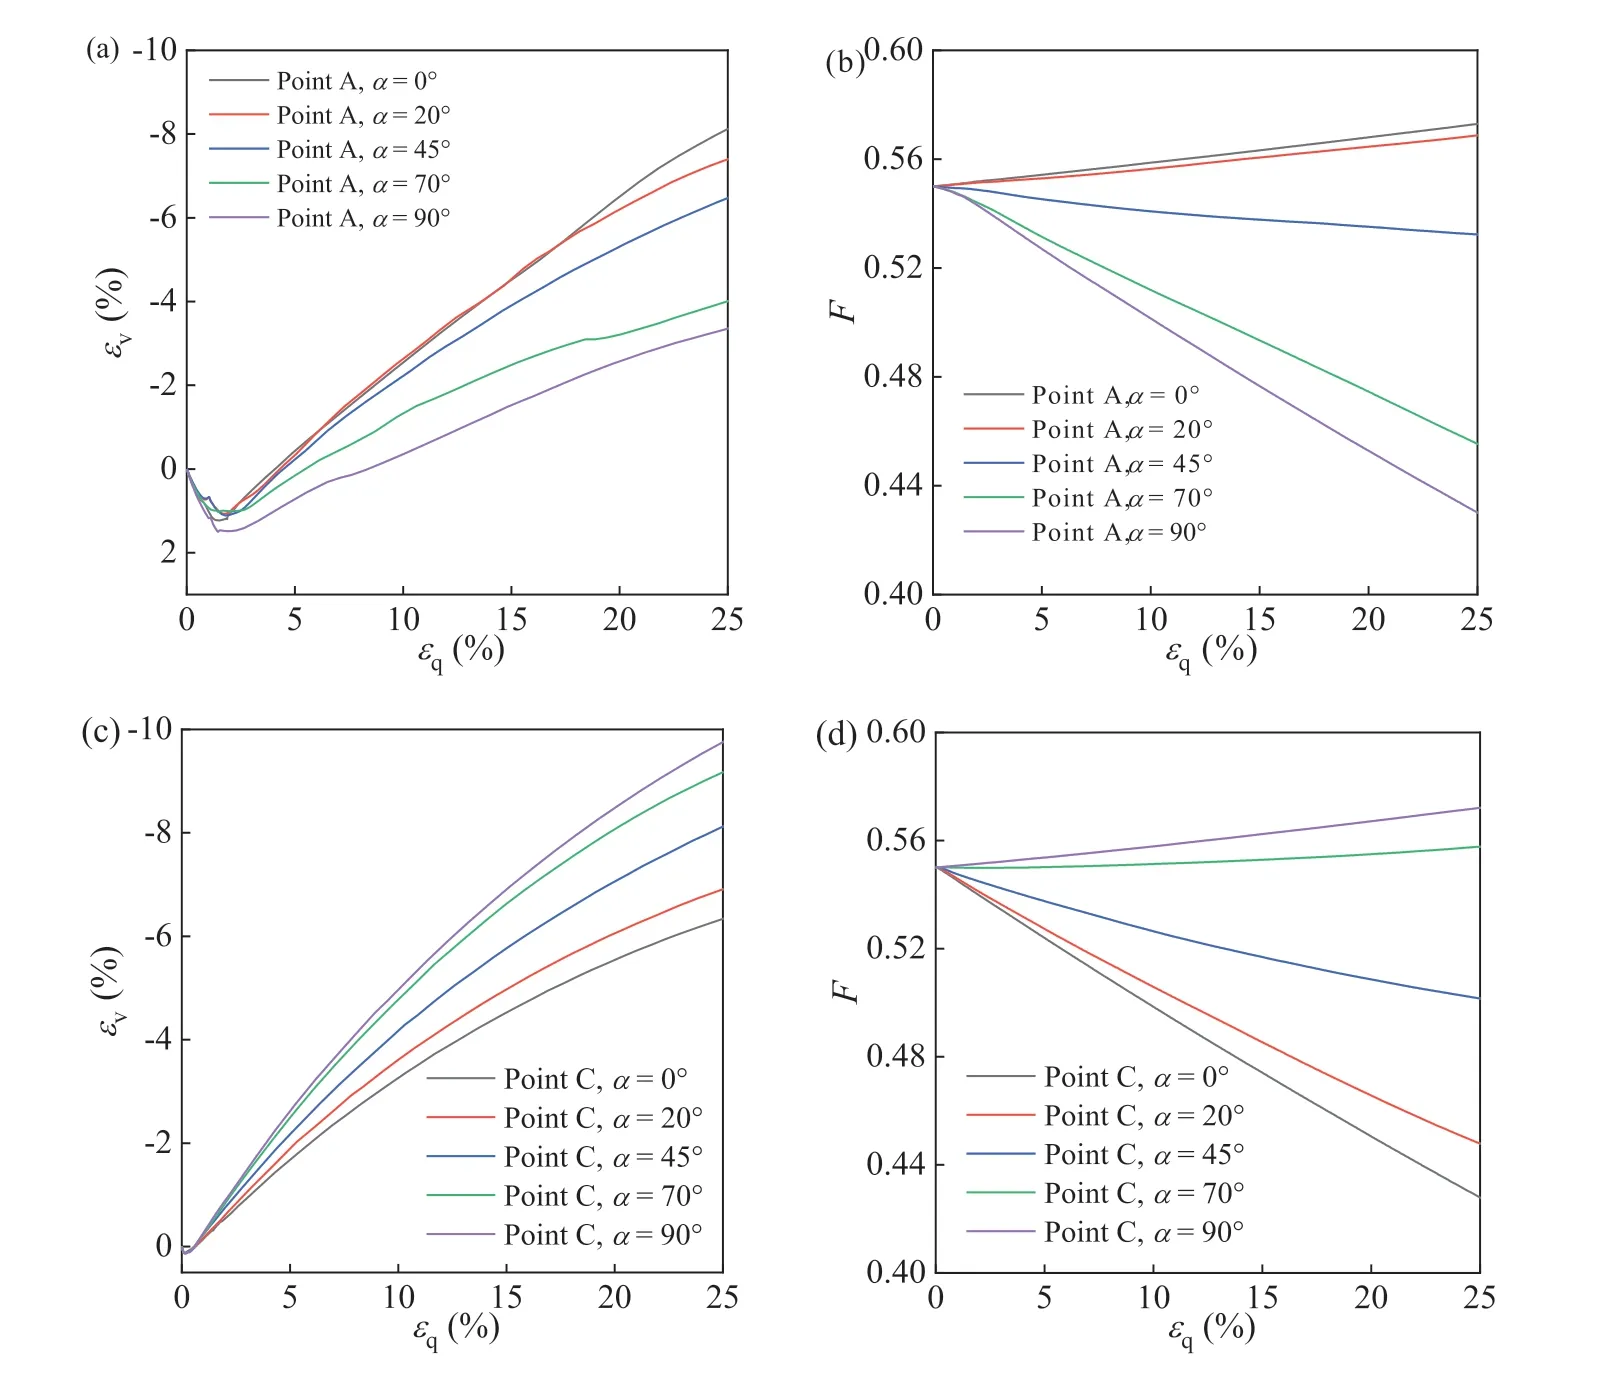
Fig.15.Local responses at (a,b) point A and (c,d) point C for different α values.
Fig.15a and c depicts the effect ofαon the volumetric strain at pointsAandC,respectively.The sand exhibits a more dilative response when its fabric is more aligned with the loading direction.Therefore,at pointA,Ndecreases with the increase ofα,which results in a lower volumetric strain,and an opposite trend is observed at pointC.
Fig.16 compares the local responses of pointsAandBin tests with different values ofα.PointsAandBare symmetrical about the vertical axis of the model and should present the same local response if the soil is isotropic.In tests withα=0°and 90°,the responses at pointsAandBare identical,similar to the failure pattern shown in Fig.8a and e.Compared with that of pointA,the shear strength of pointBis larger in theα=20°or 70°case but smaller in theα=45°case.Fig.12 shows that the value ofNat pointsAandBboth decreases withαand becomes smaller than zero for theα=45°and 70°cases.Consequently,during the loading process,the values ofFat these two points increase in theα=20°case but decrease in theα=45°and 70°cases (Fig.16f,i and l).Moreover,as shown in Fig.16e,h and k,pointAshows a more dilative volumetric response than pointBin theα=20°,45°and 70°cases because the value ofNat pointAis larger than that at point B (Fig.12).
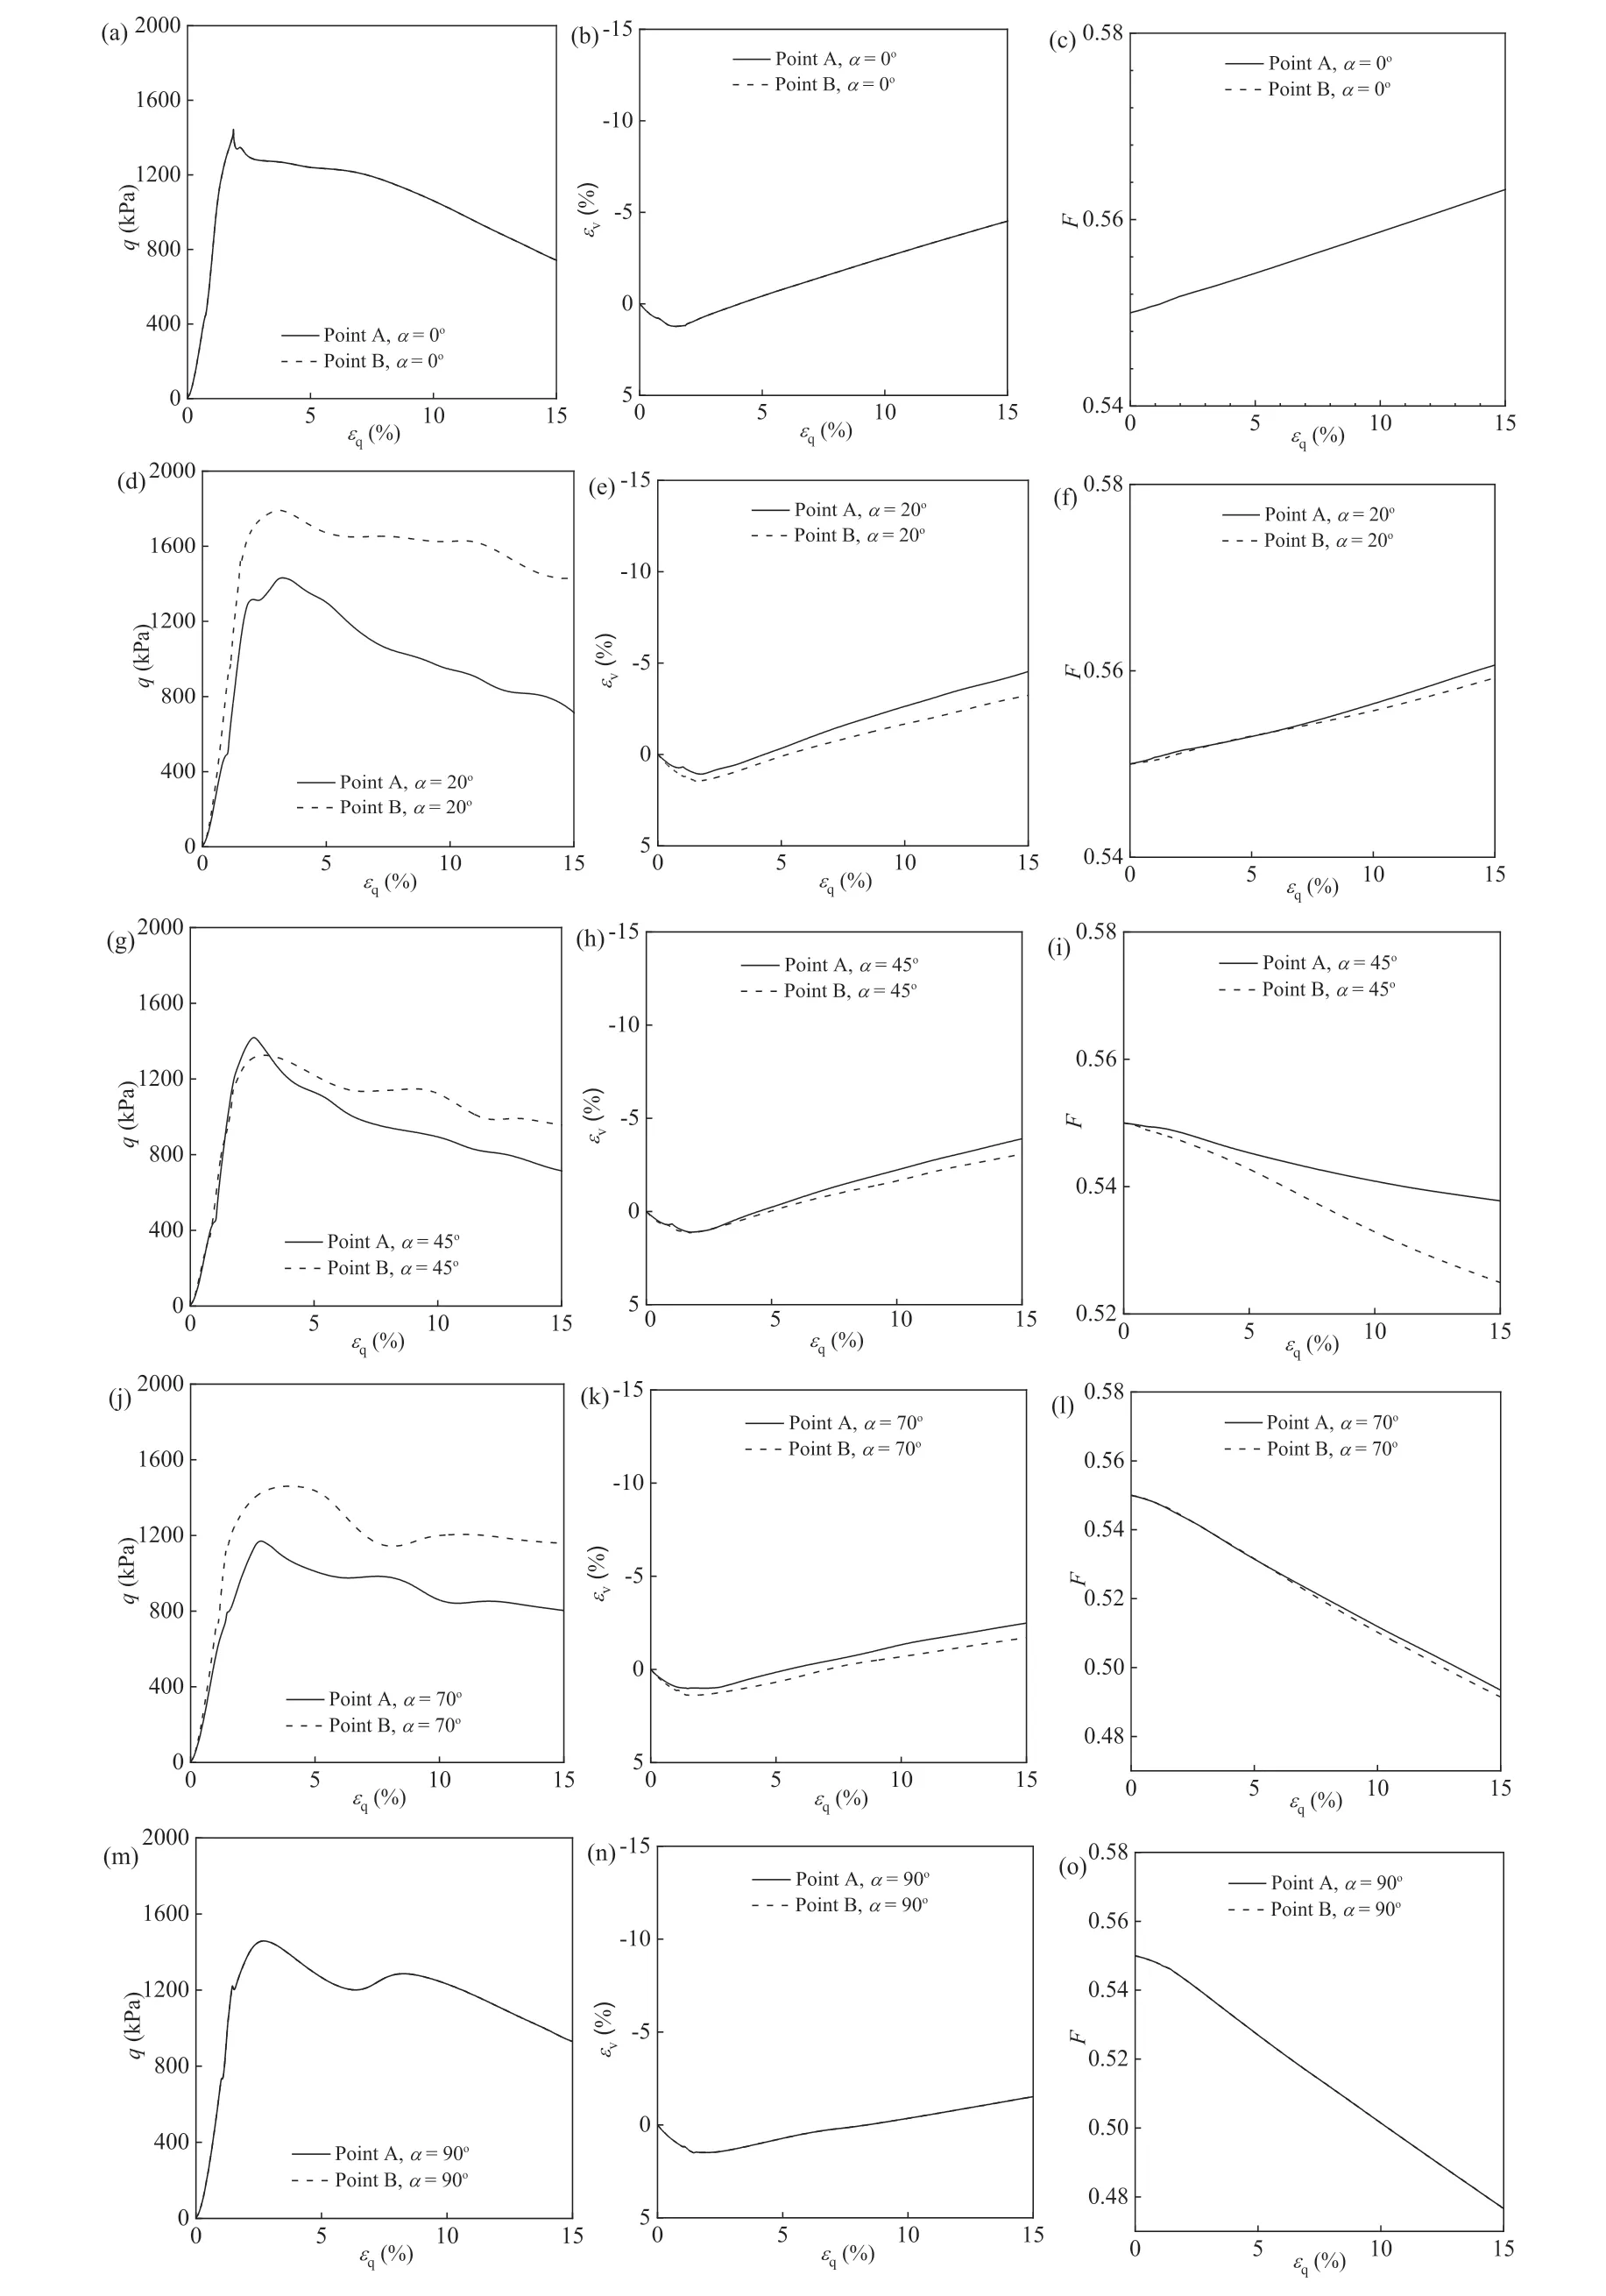
Fig.16.Comparison of local responses at points A and B for different α values.
7.Numerical analysis of footing on anisotropic soil under inclined loading
This section studies the response of footing with inclined loading resting on anisotropic soil.All the model geometry and soil parameters,mesh and boundary conditions are the same as those in Section 5.1 except that the loading direction has a clockwise deviation angleβwith respect to the vertical direction,as shown in Fig.17.The relative density of the soil is set asDr=85.6%.
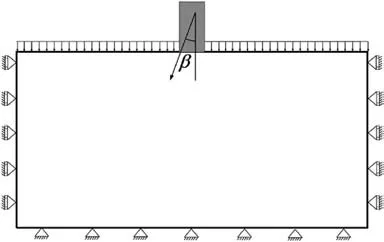
Fig.17.Model setup for a footing with an inclined loading direction.
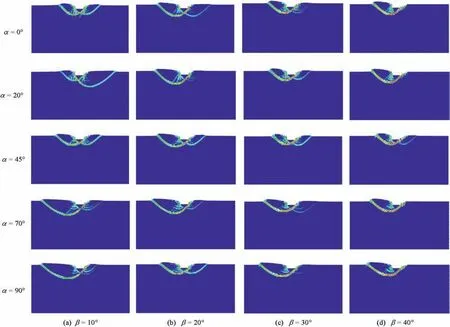
Fig.18.Shear strain contours in footing tests with different bedding plane orientations α and inclined loading angles β.
7.1.Failure pattern
The combined influence of fabric orientationαand inclined loading angleβon the contours of the shear strain and displacement of the strip footing is presented in Figs.18 and 19,respectively.In the cases ofα=0°,the failure zone area on the left side is larger than that on the right because of the inclined loading,and this difference becomes more significant asβincreases.Whenβis large enough,specifically 40°,the failure zone develops at the left side only.In theβ=10°case,the failure shape is greatly affected byα.Asβincreases,the influence ofαon the failure pattern becomes less significant.Meanwhile,the displacement of the fan and passive sections increases on the left side but decreases on the right side(Fig.19).
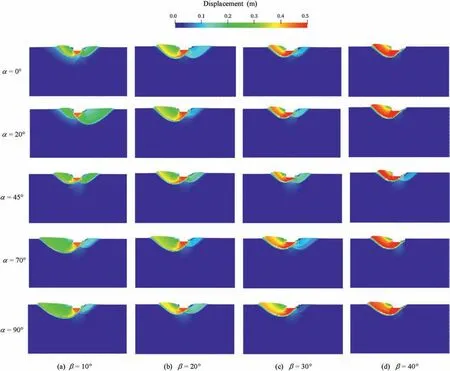
Fig.19.Displacement contours in footing tests with different bedding plane orientations α and inclined loading angles β.
7.2.Load-settlement curve
Fig.20 depicts the load-settlement curves in footing tests with differentαandβvalues.Each subplot presents the load-settlement curves of footings under a specificαvalue but different inclined loading anglesβ.It can be seen thatQultdecreases asβincreases regardless of the values ofα.Moreover,the ultimate bearing capacity is reached at a smaller footing settlement in the test with higherβ,and this phenomenon becomes more prominent asαincreases.
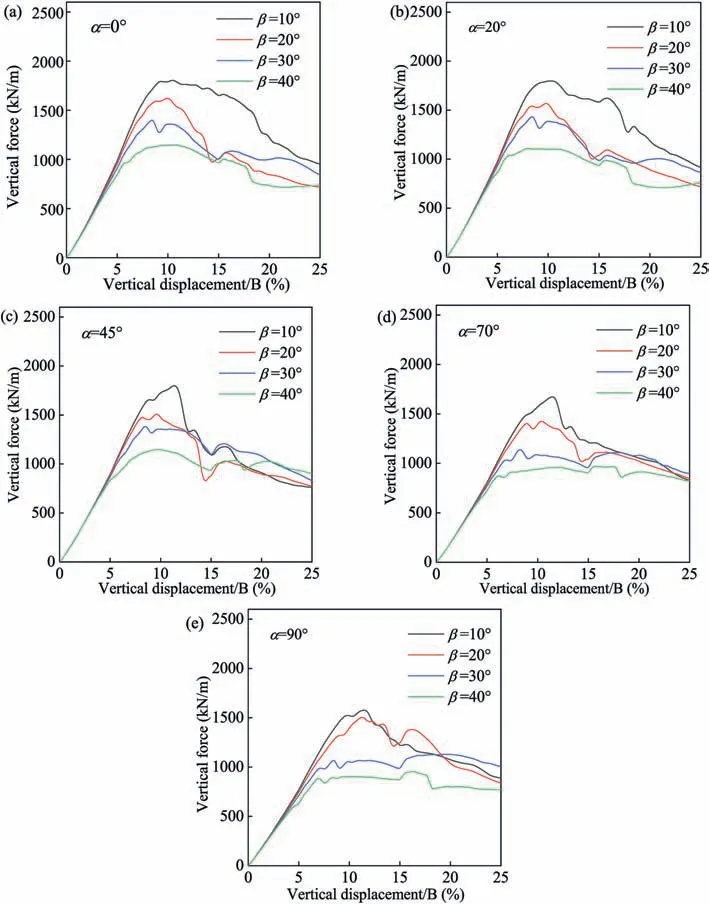
Fig.20.Load-settlement curves for different bedding plane orientations α and inclined loading angles β.
7.3.Local response
To further explore the footing response under inclined load with differentβvalues,Fig.21 shows the evolution of shear stressqand volumetric response strain εvat pointsAandB(Fig.11) during footing penetration.The value ofqat pointBis larger than that at pointA,and they all decreases asβincreases.In fact,the shear band I,in which pointAis located,is not fully formed even whenS/B=0.5,as shown in Fig.18.In all cases,the volumetric response at pointBis more dilative than that at pointA,while this difference is quite small for theβ=40°case.
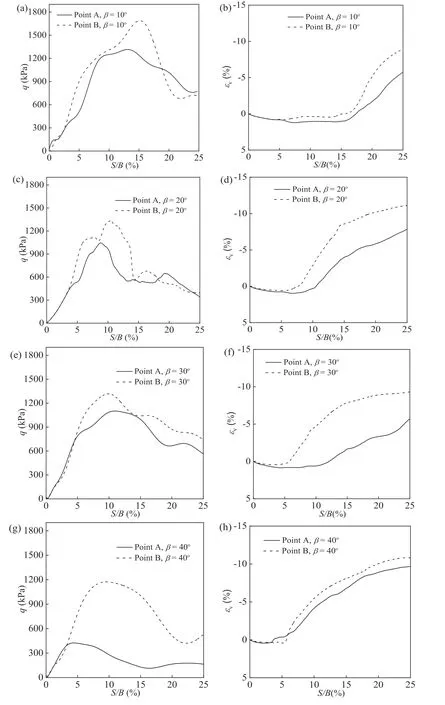
Fig.21.Local responses for points A and B in footing tests with different inclined loading angles β.
7.4.Comparison with the isotropic model
Most of the constitutive models employed in geotechnical engineering practice are isotropic and do not consider the influence of fabric anisotropy.Therefore,it is instructive to study the simulation results predicted by the isotropic model and compare them with the anisotropic model.By setting the model parameters associated with the fabric (F0,eAandkf) to zero,the anisotropic soil model introduced in Section 3 is reduced to the isotropic version.The parameters for the isotropic model are calibrated using planestrain compression tests on sand withα=0°reported by Oda et al.(1978),as listed in Table 3,and the simulation results are presented in Fig.22.The model could well predict the shear strength,but its performance on the softening part is less satisfactory.This may be attributed to the strain localization occurs within the soil sample,which results in a dramatic decrease in deviatoric stress (Gao et al.,2020).
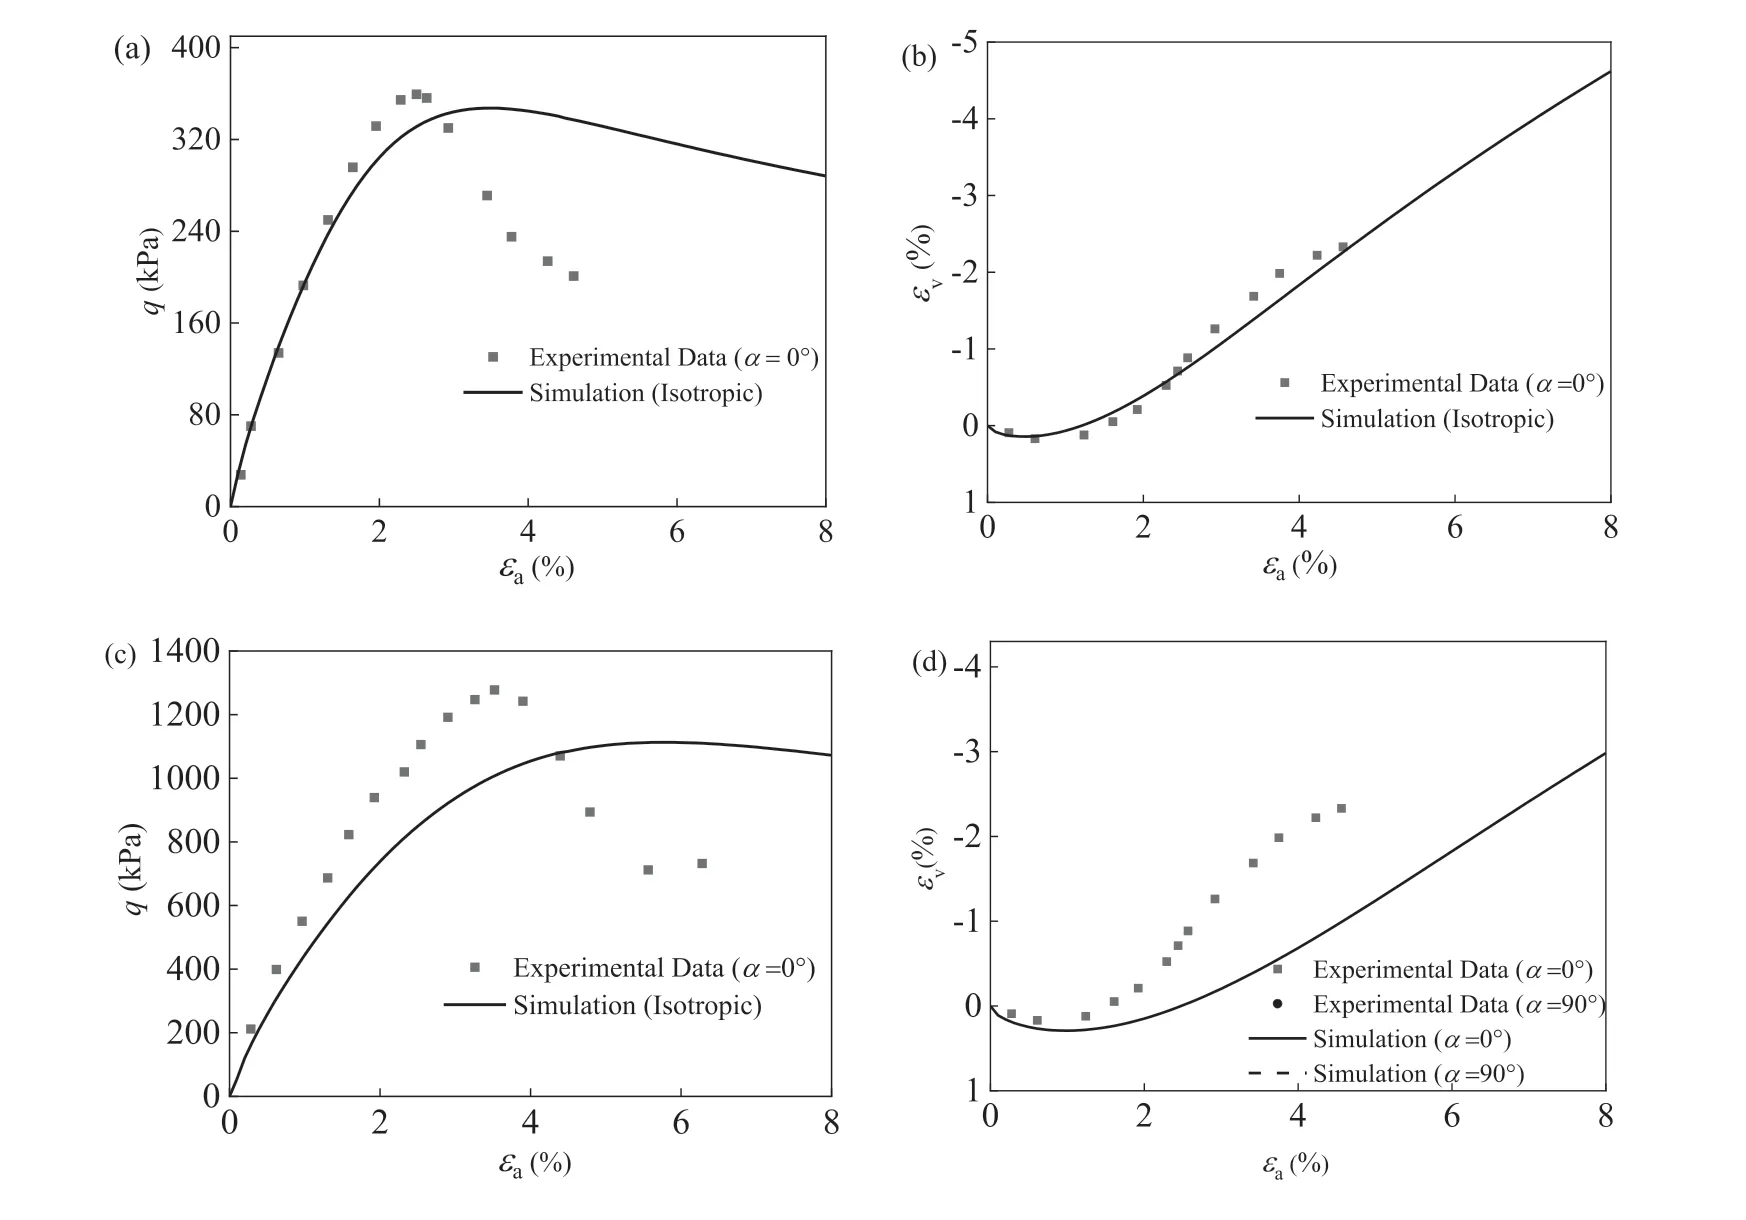
Fig.22.Comparison of experimental data (Oda et al.,1978) and simulation results predicted by an isotropic model for plane-strain tests: (a,b) σ3=50 kPa,and (c,d) σ3=200 kPa.
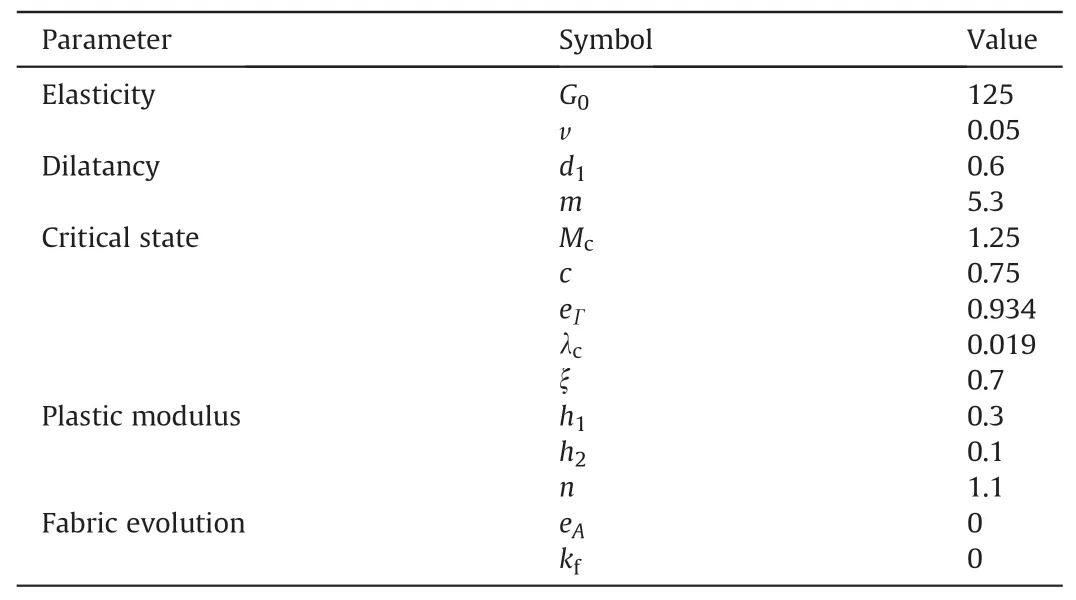
Table 3Model parameters for Toyoura sand (isotropic model).
Fig.23 compares the shear strain contours simulated by the isotropic and anisotropic models in tests with differentβvalues atS/B=0.25.For both isotropic and anisotropic soils,the failure zone on the left side is larger than that on the right side,and this difference becomes more prominent asβincreases.For a givenβvalue,the difference between the failure pattern on the left and right sides predicted by the anisotropic model is less significant than that predicted by the isotropic soil.Fig.24 compares the corresponding load-settlement curves for the above cases.For cases withβ=10°,20°and 30°,the isotropic model overestimates the bearing capacity by approximately 48.7%,44.8% and 45.1%,respectively.The above phenomenon implies that neglecting the influence of fabric anisotropy may cause serve overestimation of the bearing capacity.
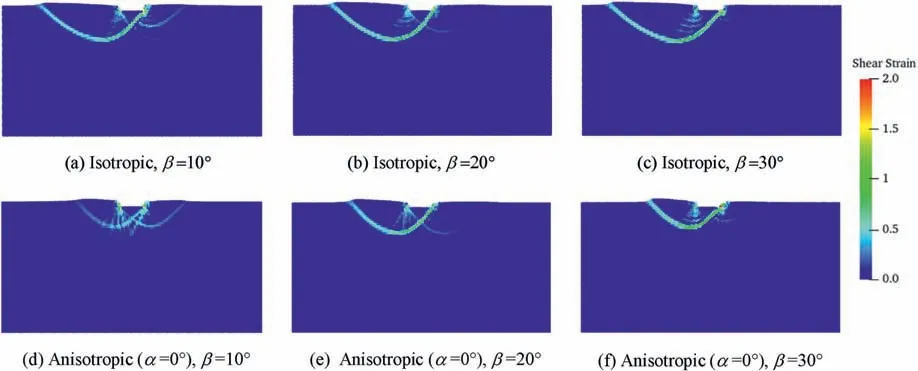
Fig.23.Shear strain contours of isotropic and anisotropic soil deposits in footing tests with different inclined loading angles β at S/B=0.25.
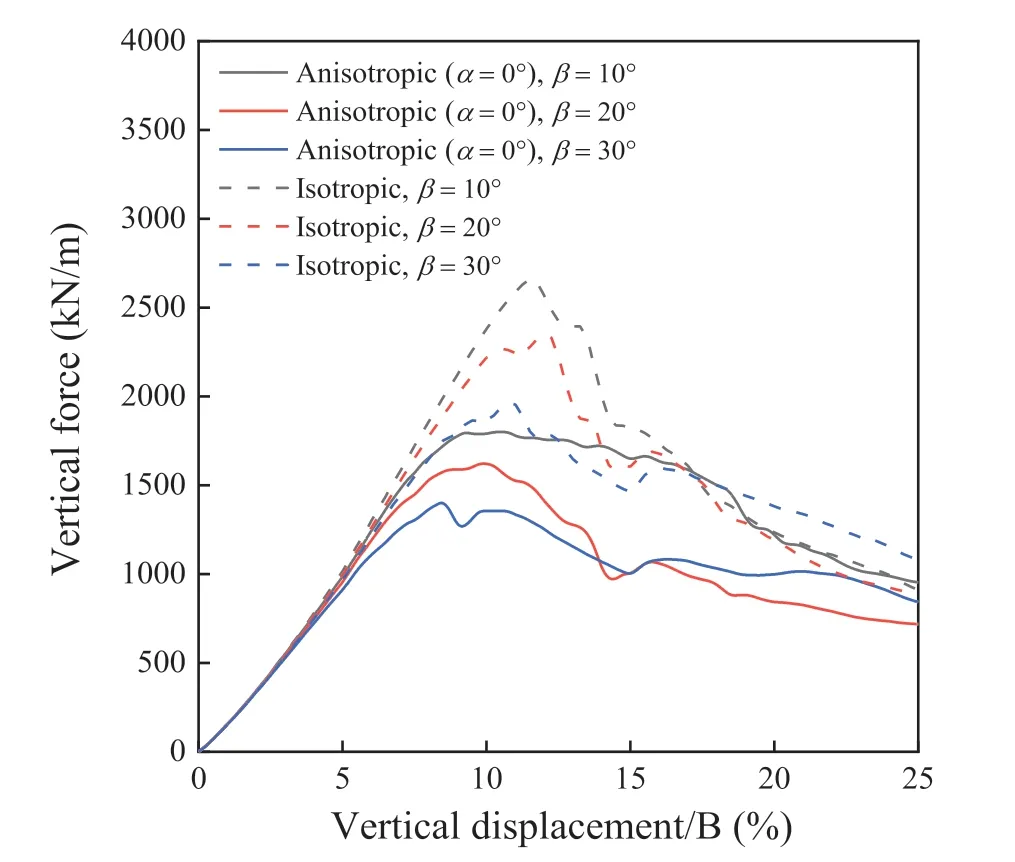
Fig.24.Load-settlement curves of isotropic and anisotropic soil deposits in footings tests with different inclined loading angles β.
8.Conclusions
The response of the strip footing resting on anisotropic sand with both vertical and inclined loads is studied using the MPM.The following conclusions are drawn:
(1) By comparing the simulation results with the experimental data,it is seen that the MPM incorporated with the advanced ACST model can well capture the effect of relative densityDrand bedding plane orientationαon the footing response.
(2) For footing problem with a vertical load,the failure pattern becomes asymmetrical whenαis not equal to 0°or 90°.With the increase ofα,the ultimate bearing capacityQultdecreases and its correspondingSultincreases.The width of the soil mass has a slight influence onQultbut significantly influences onQres.
(3) For the footing problem with an inclined load,the failure pattern is greatly affected by both the inclined loading angleβandα.Asβincreases,the failure patterns corresponding to differentαvalues become more similar.The failure zone on the left side is larger than that on the right side,and this difference becomes more significant asβincreases.
(4) The simulation results of both element tests and strip footing tests predicted by the isotropic model are presented and compared with those predicted by the anisotropic model.It is observed that although the isotropic model can well simulate the stress-strain relationship of the soil sample in element tests,it significantly overestimates the bearing capacity of the strip footing.Such phenomenon demonstrates the necessity of inclusion of fabric anisotropy in the analysis of geotechnical engineering problem.
Due to the strain-softening,the result predicted by the proposed model is mesh-dependent when simulating the real boundary value problems.Therefore,further work will be focused on the implementation of nonlocal theory in the MPM to eliminate this shortcoming.Additionally,a soil anisotropic factoriαthat modifies the existing bearing capacity equation has significant application potential.The numerical model established in this paper can help to establish such a factor.Moreover,few studies have been conducted to investigate the effect of fabric anisotropy on geotechnical engineering with large deformation.Therefore,the MPM with an advanced ACST-based soil model has broad prospects for application in problems such as slope failure and pile installation.
Data availability statement
All data,models,or code generated or used during the study are available from the corresponding author upon request.
Declaration of competing interest
The authors declare that they have no known competing financial interests or personal relationships that could have appeared to influence the work reported in this paper.
Acknowledgments
The study was financially supported by the National Natural Science Foundation of China (Grant No.52108359).
 Journal of Rock Mechanics and Geotechnical Engineering2023年12期
- Journal of Rock Mechanics and Geotechnical Engineering的其它文章
- Advances in joint roughness coefficient (JRC) and its engineering applications
- Preliminary estimation of rock-fall lateral dispersion by laboratory test
- Triaxial tension and compression tests on saturated lime-treated plastic clay upon consolidated undrained conditions
- Strain localization of Mohr-Coulomb soils with non-associated plasticity based on micropolar continuum theory
- Rapid testing and prediction of soil-water characteristic curve of subgrade soils considering stress state and degree of compaction
- Performance assessment of borehole arrangements for the design of rectangular shallow foundation systems
