Permeability evolution mechanism and the optimum permeability determination of uranium leaching from low-permeability sandstone treated with low-frequency vibration
Yong Zho, Xiqi Li, Lin Lei, Ling Chen, Zhiping Luo
a School of Resource Environment and Safety Engineering, University of South China, Hengyang, 421001, China
b Department of Nuclear Safety, China Institute of Atomic Energy, Beijing,102413, China
Keywords:
ABSTRACT Low-frequency vibrations can effectively improve natural sandstone permeability, and higher vibration frequency is associated with larger permeability.However, the optimum permeability and permeability evolution mechanism for uranium leaching and the relationship between permeability and the change of chemical reactive rate affecting uranium leaching have not been determined.To solve the above problems, in this study, identical homogeneous sandstone samples were selected to simulate lowpermeability sandstone; a permeability evolution model considering the combined action of vibration stress,pore water pressure,water flow impact force,and chemical erosion was established;and vibration leaching experiments were performed to test the model accuracy.Both the permeability and chemical reactions were found to simultaneously restrict U6+ leaching, and the vibration treatment increased the permeability,causing the U6+leaching reaction to no longer be diffusion-constrained but to be primarily controlled by the reaction rate.Changes of the model calculation parameters were further analyzed to determine the permeability evolution mechanism under the influence of vibration and chemical erosion,to prove the correctness of the mechanism according to the experimental results, and to develop a new method for determining the optimum permeability in uranium leaching.The uranium leaching was found to primarily follow a process consisting of (1) a permeability control stage, (2) achieving the optimum permeability, (3) a chemical reactive rate control stage, and (4) a channel flow stage.The resolution of these problems is of great significance for facilitating the application and promotion of lowfrequency vibration in the CO2 + O2 leaching process.
1.Introduction
Low-permeability sandstone is characterized by both low porosity and low permeability,which limit the leaching of uranium resources.Increasing the porosity of low-permeability uraniumbearing sandstone is therefore of great economic significance to effectively increase its permeability and uranium-leaching amount;however,the increase in the porosity is necessarily caused by strain changes.Sandstone undergoes physical and chemical erosions during the in situ leaching of uranium using CO2+ O2.The percolation of the leaching solution erodes and physically strains the sandstone pores, and the continuous reaction of the solution with the inner pore surfaces causes chemical erosion strain and alters the porosity.Even though understanding the mechanism of low-permeability sandstone permeability changes during the leaching process is critical to improve the uranium leaching efficiency, this topic remains poorly studied.
Methods for enhancing the permeability of low-permeability porous media consist primarily of hydrofracturing, high-energy gas fracturing, blasting, surfactants, and vibration waves.Hydrofracturing fractures rock by pushing a high-viscosity fracturing fluid or water into ore layers.This method is primarily used in lowpermeability reservoirs (Wang et al., 2013; Guo et al., 2015, 2021),shale (Taghichian et al., 2014; Li et al., 2016; Guo et al., 2022), and coal seams (Jia et al., 2016; Wang et al., 2017; Song et al., 2019).High-energy gas fracturing uses high-temperature high-pressure gas to produce cracks and is primarily applied to low-permeability reservoirs(Pu et al.,2010,2012)and unconventional gas reservoirs(Bai et al., 2020).Blasting uses shock waves and stress waves to crush rock and form cracks(Xu et al.,2013;He et al.,2018;Li et al.,2022).This method has been applied to low-permeability sandstone-type uranium deposits by Wang et al.(2016a)and Yuan et al.(2018) to study the blasting enhanced permeability mechanism.Surfactants are utilized in uranium leaching (Cai et al., 2013; Du et al., 2019) to improve the permeability of leaching solution in the sandstone (Tan et al., 2014) by reducing the surface tension of the solution(Pan et al.,2020a)and increasing the wettability of the sandstone (Hou et al.,2015; Sofla et al., 2016), making it easier for the solution to enter small pores and fractures.Vibration waves include primarily low-frequency mechanical vibrations and ultrasonic vibrations, which can effectively improve the uranium leaching rate.At present, the application of low-frequency vibration to uranium leaching has been reported in a single study by Makaryuk (2009); however, this study cannot directly explain the effective improvement of natural sandstone permeability owing to vibration during the CO2+O2leaching process.Ultrasonic leaching uranium studies have primarily focused on powder particles(Avvaru et al.,2006,2008;Ladola et al.,2014;Anjum F et al.,2015)and do not prove that ultrasonic vibration is effective for lowpermeability sandstone blocks.A further study indicated that low-frequency vibration could effectively improve the natural sandstone permeability,with the leaching effects of low-frequency vibration on low-permeability sandstone being better than those of ultrasonic vibration and higher vibration frequency being associated with larger permeability (Zhao et al., 2021, 2022).However,the optimum permeability,the permeability evolution mechanism for uranium leaching, and the relationship between the permeability and the change of chemical reactive rate affecting uranium leaching have not yet been determined.The resolution of these problems will facilitate the application and promotion of lowfrequency vibration in the CO2+ O2leaching process.Therefore,research needs to be initiated on the above problems.
In this study,to obtain the permeability evolution mechanism in low-permeability sandstone, identical homogeneous sandstone samples were selected to simulate low-permeability sandstone.Permeability evolution and the relationship between permeability and the change of chemical reactive rate affecting uranium leaching were innovatively analyzed under the influence of low-frequency vibration in the process of CO2+ O2leaching.First, a permeability evolution model was established.Then, low-frequency vibration leaching experiments were performed and the test results were analyzed.Subsequently, the proposed model was tested and verified.Finally, the permeability evolution mechanism and the optimum permeability of sandstone were determined in the vibration leaching process.This study provides a theoretical basis for the application and promotion of CO2+ O2in situ leaching of uranium from low-permeability sandstone under low-frequency vibration conditions.
2.Sandstone permeability evolution model
2.1.Physical and chemical analyses
2.1.1.Stress analysis
During the CO2+ O2leaching process, the low-frequency vibration propagates in the form of a stress wave.The continuous vibration loosens the sandstone and causes physical damage,which leads to a small physical vibrational strain.The sandstone in solution is simultaneously affected by the water pressure,water impact,and chemical erosion.The sandstone surface is subjected to an extrusion pressure as a result of the water pressure, which causes the pores to close and produces a water pressure extrusion strain.The vibration causes the water flow to continuously impact the sandstone skeleton,which results in an impact strain.The CO2and O2dissolve in the water to produce HCO-3, which reacts with the sandstone, resulting in an erosion strain and altering the porosity.During the entire process,the sandstone is affected by the physical vibration stress,water pressure extrusion stress,and water impact force.
A section a-a with an area S can be selected along the sandstone interior, and its stress distribution is shown in Fig.1.The force balance equation between the sandstone particles in the section can be expressed as
where σmis the support force produced by the compression between the sandstone particles (N); (1-φ)S is the sum of the sandstone particle contact areas(m);φ is the porosity of the sandstone under vibration; ρlis the solution density (kg/m3); g is the acceleration of gravity,and g=9.8 m/s2;h is the depth from the solution surface to the section(m);pcis the injection pressure of the liquid injection pump(Pa);σiis the external vibration stress(N);msis the mass of the sandstone affected by the stress wave (kg); mlis the mass of the leaching solution affected by the stress wave(kg);and σm(1-φ) is the effective support force of the sandstone skeleton.
The average effective stress of the sandstone section is equal to the effective support force in the opposite direction, which can be expressed as (Wu et al., 2020):
where σ′is the effective stress of the sandstone(N).Substituting Eq.(2) into Eq.(1), the following expression can be obtained:
During the vibration leaching process, the stress wave propagates in the form of a sine wave.When the sandstone is not treated with vibration action,the stress acting on the sandstone is zero and the mean stress in a given half-cycle is equal to that in a single cycle.The propagation of stress σfin the rock mass at time t can then be expressed as
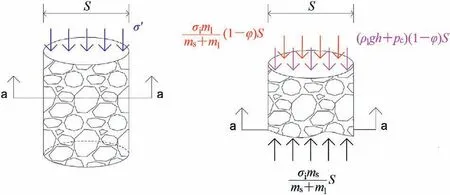
Fig.1.Diagram of the sandstone stress distribution.σiml(1 - φ)S/(ms + ml) describes the water impact forces on the sandstone, σimsS/(ms + ml) denotes the physical vibration stress on the sandstone, and (ρlgh + pc)(1 - φ)S indicates the water pressure extrusion stress on the sandstone.
where ω is the frequency of the vibration source(Hz),F0is the force amplitude when the vibration force propagates within the sandstone (N), Tzis the vibration period (s), and t is the vibration time(s).
The stress waves are constantly attenuated during the propagation process, and the vibration stress σiacting on the sandstone can be expressed as (Wan et al., 2008):
where x is the vibration propagation distance in the sandstone(m),and η is the attenuation rate of the stress wave.
The vibration stress σjon each unit volume of sandstone can be expressed as
where Vsis the sandstone volume (m3), and ρsis the apparent sandstone density (kg/m3).
Eq.(6) indicates that the maximum stress σj,maxon each unit volume of sandstone is the integral value corresponding to the attenuation rate η = 0, which can be expressed as
The attenuation rate of the stress wave can be expressed as(He and Ahrens, 1994; Zeng et al., 2018; Miao et al., 2020; Pan et al.,2020b):
where uDis the stress wave propagation speed in damaged sandstone (m/s), u is the stress wave propagation speed in a homogeneous sandstone (m/s), and D is the damage degree.
The expression of the vibration stress with the damage degree can be obtained by substituting Eq.(8) into Eq.(5):
2.1.2.Analysis of the chemical erosion volume
During the CO2+ O2leaching process, the leaching solution is weakly acidic to nearly neutral and the reaction is primarily that of uranium leaching.The pore volume change caused by the increased concentrations of Ca2+and Mg2+in the solution is primarily due to the dissolution of CaCO3and CaMg(CO3)2.The specific chemical reactions are as follows(Liddell and Bautista,1994;Kim et al.,2014;Rao et al., 2014; Wang et al., 2014, 2020; Sreenivas and Chakravartty, 2016):
Eqs.(11) and (12) indicate that calcium ions can be produced from CaMg(CO3)2and CaCO3.The secondary pore volume generated by the dissolution of UO2, CaCO3, and CaMg(CO3)2can be expressed as follows:
where Vchis the pore volume induced by the chemical erosion(m3),Vch-ais the secondary pore volume induced by the dissolution of CaMg(CO3)2(m3),Vris the solution volume after the reaction(m3),cais the concentration of Mg2+in the solution after the reaction(mol/L),Mrais the molecular weight of CaMg(CO3)2,ρais the density of CaMg(CO3)2(kg/m3),Vch-bis the secondary pore volume induced by the dissolution of CaCO3(m3),cbis the concentration of Ca2+in the solution after the reaction(mol/L),Mrbis the molecular weight of CaCO3,ρbis the density of CaCO3(kg/m3),Vch-cis the secondary pore volume induced by the dissolution of UO2(m3), ccis the concentration of U6+in the solution after the reaction(mol/L),Mrcis the molecular weight of UO2,and ρcis the density of UO2(kg/m3).
2.2.Damage analysis
Sandstone is damaged under the combined action of physical vibration and chemical erosion.The damage degree D can be expressed as (Chen and Cui, 2002; Liu et al., 2015; Zhang et al.,2020):
wheretvis the volumetric strain of sandstone at time t,σd,maxis the peak stress of damaged sandstone (N),d,maxis the peak strain of damaged sandstone,D0is the initial damage of sandstone,and E is the initial elastic modulus of sandstone (Pa).
The peak stress and strain of damaged sandstone cannot be directly measured during the vibration process.Therefore, the maximum stress and strain are used instead to describe the sandstone damage variation.The maximum stress of damaged sandstone can be calculated using Eq.(7).The strain reflects the sum of strain values from the physical vibration,water pressure extrusion,water impact,and chemical erosion,of which the physical vibration strain and water impact strain are caused by the vibrational stress.The maximum strain of the sandstone can be determined by considering that the vibrational stress acts entirely on the sandstone and that the maximum water pressure subjected by the sandstone acts on the entire side of the immersed sandstone.The acting force σw,maxinduced by the maximum water pressure on the sandstone unit volume can therefore be expressed as
where hs,maxis the maximum depth of the sandstone in the solution (m), and Ssis the lateral surface area of the sandstone immersed in the solution (m2).The water pressure on the unit volume of sandstone in the solution can be expressed as
where h0is the depth of the sandstone top below the liquid level(m), and hsis the depth of the sandstone bottom below the liquid level(m).The maximum strain for the unit volume of sandstone in the solution can be expressed as
wherech,maxis the maximum value on chemical strain of the unit volume,j,maxis the maximum value on vibrational strain of the unit volume,w,maxis the maximum value on water pressure extrusion strain for the unit volume of the soaked sandstone,Evis the bulk modulus of the sandstone (Pa), ν is the Poisson’s ratio of sandstone, and VCis the total volume of the sandstone that participates in the reaction (m3).
To obtain the expression for the damage degree, the sandstone and solution are regarded as a whole and the propagating stress σfin the rock mass at time t is considered to be the stress without attenuation applied on the sandstone.Thevolumetric strain of the sandstone at time t can then be expressed as
wherechis the chemical strain at time t,fis the vibrational strain at time t, andwis the water pressure extrusion strain for the soaked sandstone at time t.
The maximum stress σd,maxof the damaged sandstone in the solution can be expressed as
Substituting Eqs.(15),(16)and(19)-(21)into Eq.(14)yields an expression for the sandstone damage degree under the combined action of physical and chemical erosions as follows:
2.3.Permeability evolution model
2.3.1.Analysis of the volumetric strain
Sandstone undergoes strain during the vibration leaching process as a result of erosion driven by physical and chemical factors under the joint action of physical vibration, water pressure extrusion stress, and water impact force.The relationship between the effective stress and the volumetric strain of sandstone can be expressed as
wherevis the volumetric strain.
The substitution of Eqs.(9) and (23) into Eq.(3) yields
From the definition of porosity, the following equation can be obtained(Kassab and Weller,2011;Tao et al.,2012;Li et al.,2014):
where φ0is the initial porosity, ΔVSis the volume change of sandstone skeleton(m3),and VS0is the initial volume of sandstone skeleton (m3).
The strain of sandstone skeletonsunder vibration leaching can be expressed as
Substituting Eqs.(25) and (26) into Eq.(24), the volumetric strain of sandstone under vibration leaching can be obtained as
Eq.(27) is a monadic quadratic equation, and the volumetric strain of sandstone considering damage can be obtained by substituting Eq.(22) into Eq.(27).
2.3.2.Permeability analysis
From the definition of strain, the following equation can be obtained:
where ΔVpis the change in the sandstone pore volume(m3)and VB0is the initial total volume of the sandstone (m3).Substituting Eq.(28) into the definition of porosity, we have
where VP0is the initial pore volume of sandstone(m3),and VBis the total volume of sandstone at time t (m3).
The volumetric strain can also be expressed as
Eq.(30) can be rewritten as
Substituting Eq.(31) into Eq.(29), we have
The relationship between the permeability and the porosity can be expressed as (Carlos et al., 2004; Li et al., 2019):
where k is the permeability of sandstone(mD),and k0is the initial sandstone permeability (mD).
The relationship between the volumetric strain and the permeability can be obtained by substituting Eq.(32)into Eq.(33):
2.3.3.Permeability evolution model
Simultaneously considering Eqs.(22), (27) and (34), the permeability evolution model under vibration leaching conditions can be obtained:
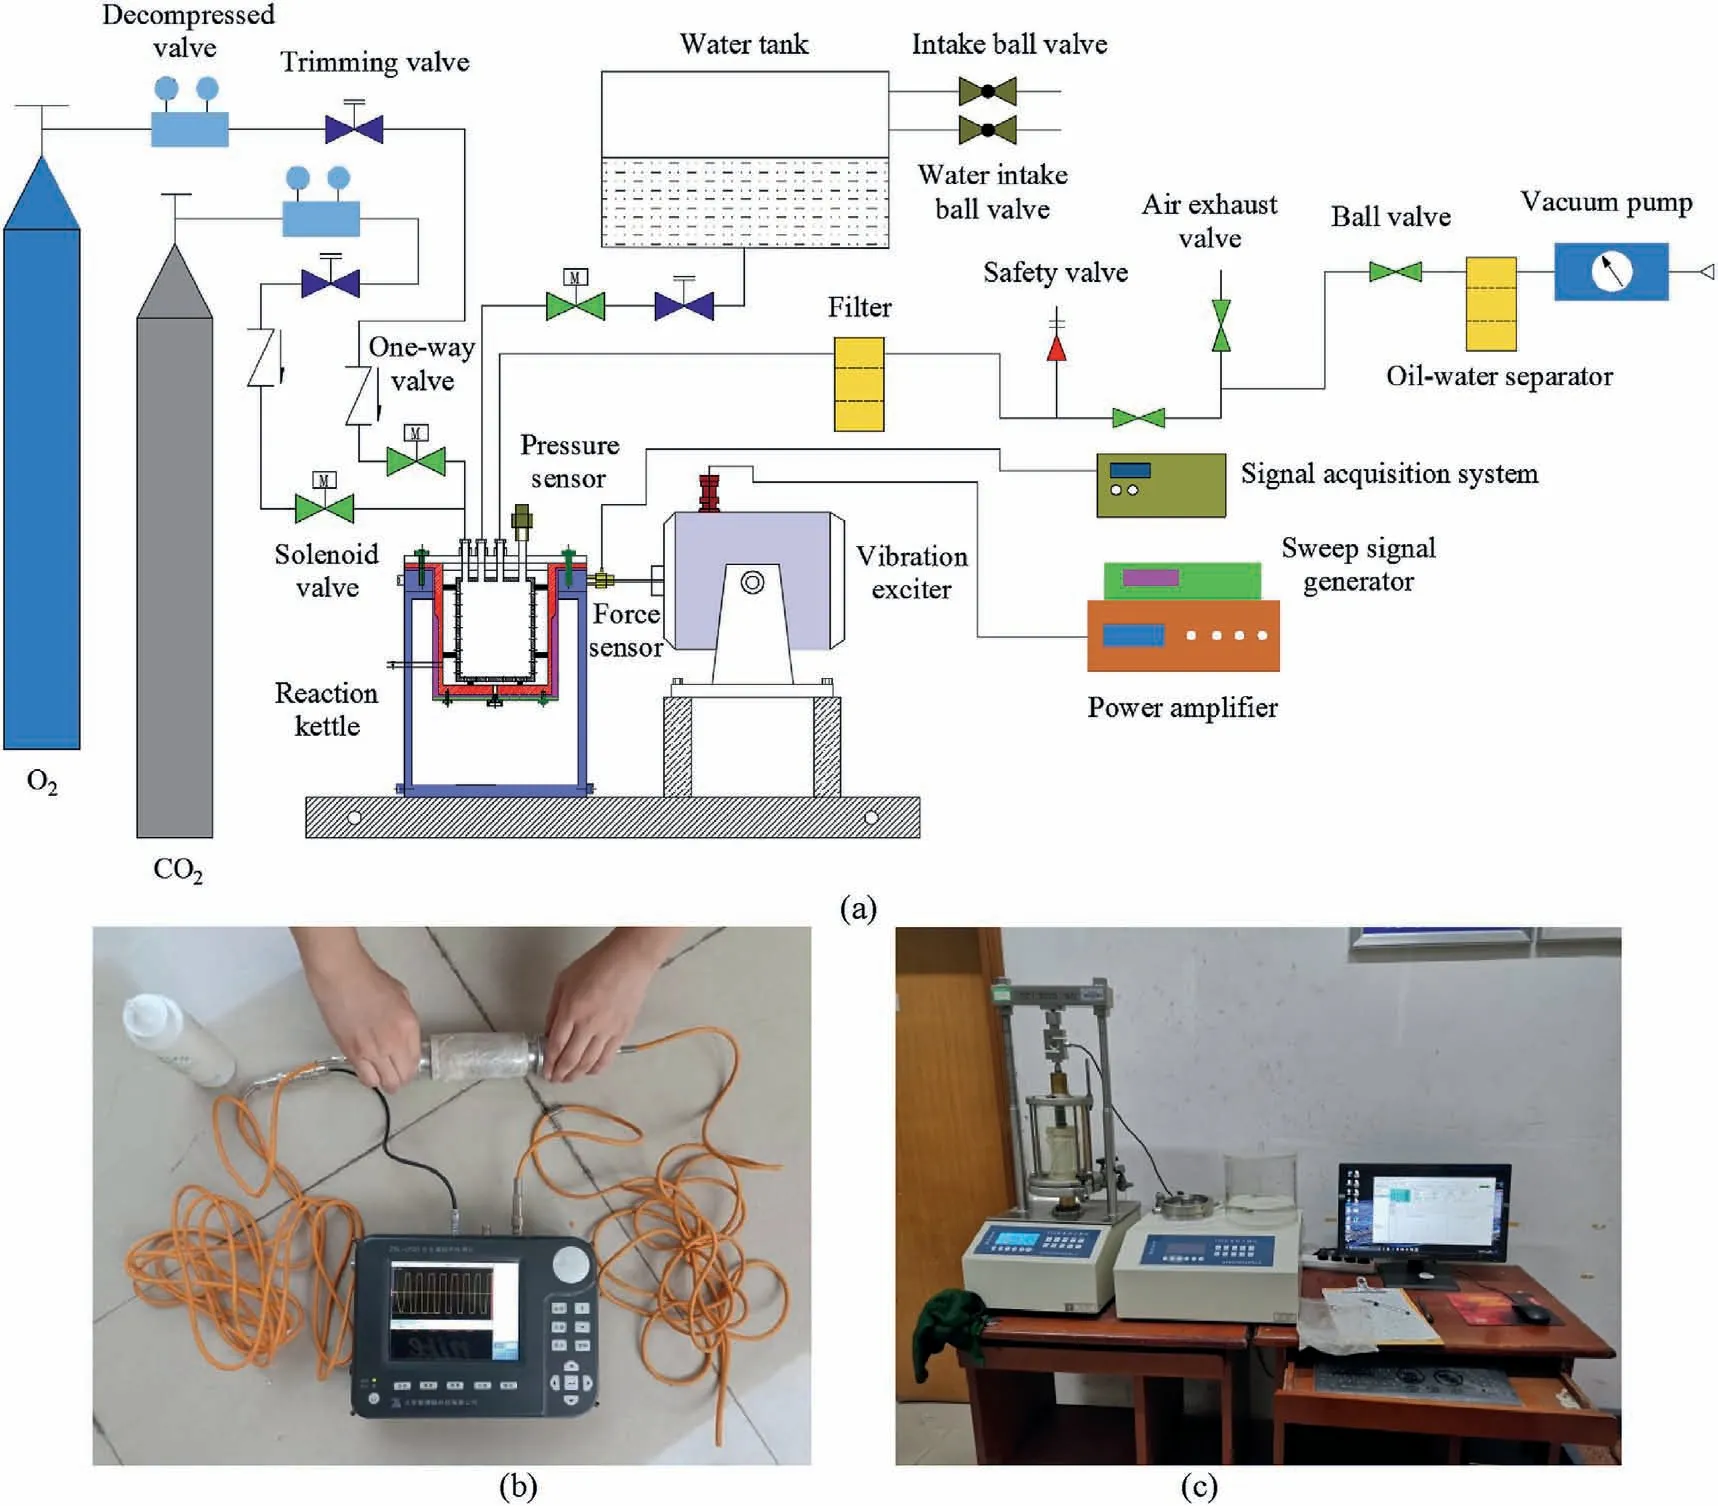
Fig.2.(a) Vibration-leaching experimental system; (b) Nonmetal ultrasonic detector; and (c) Fully automatic triaxial apparatus.
The sandstone volumetric strain, damage degree, chemical corrosion volume,porosity,and permeability can be analyzed using this model, allowing the permeability evolution mechanism and the optimum permeability to be obtained.
3.Permeability evolution experiments
3.1.Experiments
3.1.1.Experimental protocol
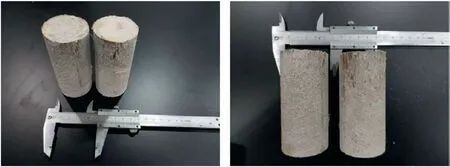
Fig.3.Experimental samples.
Uranium bearing sandstone ore, water, and calcite were uniformly mixed and pressed to obtain low-permeability sandstone samples.To eliminate any interference from initial sample differences, identical sandstone samples were used to demonstrate the variation in the sandstone permeability after vibration.Raw sandstone ore was drilled from different boreholes, crushed, and screened into different mesh sizes.Similar mesh particles were selected and uniformly mixed to obtain a certain quality of sandstone particles of a given mesh.The obtained sandstone particles were then homogeneously mixed at specific ratios and pressed into samples for testing.The obtained samples were therefore identical owing to the uniformity of the mesh particles and the identical mixing ratio.
3.1.2.Equipment and sample preparation
The main experimental devices included a sieve shaker, servo press, self-made vibration leaching experimental system (Fig.2a),permeameter, nonmetal ultrasonic detector (Fig.2b), and fully automatic triaxial apparatus(Fig.2c).The sieve shaker was used toscreen the sandstone particles, the servo press was used to press the samples,the vibration leaching experimental system was used for the vibration leaching reactions, the permeameter was used to measure the effect of vibration leaching on the sample permeability, the nonmetal ultrasonic detector was used to measure the sample damage after vibration leaching, and the fully automatic triaxial apparatus was used to measure the sample compressive strength.

Table 1 Ratio of sandstone particles.
The sample preparation process was completed as follows.The original sandstone ore was crushed and particles of a specific mesh range were screened using the sieve shaker.The sandstone particles were primarily in a mesh size range of 30-100.Particles with different mesh numbers were selected from the screened 30-100 mesh particles in a specific proportion and then uniformly mixed with 114 g of calcite (800 mesh size) and 20 g of distilled water.Cylindrical samples with a diameter of 50 mm and height of 100 mm(Fig.3)were prepared using the servo press at a pressure of 204 kN for 20 min.The selected ratio of sandstone particles is given in Table 1, and the mineral compositions of the sandstone samples is given in Table 2.
3.1.3.Experimental process
The experimental process was as follows: (1) determine the initial sample permeability; (2) apply the vibration leaching reaction; (3) determine the sample permeability after vibration (an identical method is used in steps (1) and (3)); (4) determine the U6+, Ca2+, Mg2+, Fe2+, and Fe3+concentrations in the leaching solution;and(5)determine the damage and compressive strength of the air-dried sample after vibration.
To determine the sample permeability,the pressures at the front and rear ends of the core holder, the pump flow rate, and the experimental temperature were recorded, and then the permeability was calculated using Darcy’s law as follows (Tanikawa and Shimamoto, 2009; Wang et al., 2016b; Glowacki and Selvadurai,2017; Heap et al.,2018):
where Q is the water flow rate(mL/s);μ is the water viscosity at the experimental temperature(mPa s);L is the sample length(cm);A is the cross-sectional area of the sample(cm2);P1and P2are the front and rear end pressures of the core holder(MPa),respectively;and α is the adjusted unit coefficient, which is equal to 100.
In the vibration leaching reaction,1700 mL of distilled water was injected into the kettle and the kettle temperature was held constant at 30°C.After an oxygen pressure of 1 MPa was reached in the kettle, carbon dioxide was added until the pressure increased to 2 MPa.The sample was then vibrated at a fixed force amplitude for a specific period of time.To compare experimental results, frequencies of 0 Hz,10 Hz,20 Hz,and 30 Hz were used.
To determine the damage and compressive strength after vibration, the samples were air-dried, the sample ultrasonic wave velocity was determined between the top and bottom of the sample,and the damage degree was calculated using Eq.(8).Finally,the peak compressive strength of the sample was determined under a confining pressure of 120 kPa.
3.2.Experimental results and analysis
3.2.1.Permeability results
The initial permeability of the samples was determined to be 0.6823 mD, which was consistent with that of a typical lowpermeability sandstone (Wang et al., 2018).The permeability values between 8 h and 22 h are shown in Fig.4a.The results indicate that the permeability ranges in 0.689-0.7 mD at 0 Hz,0.826-1.705 mD at 10 Hz, 0.901-1.987 mD at 20 Hz, and 0.999-2.495 mD at 30 Hz.Curve fitting was conducted for the experimental results following an exponential form of y = ea+bx+cx2,with coefficients of determination (R2) of 0.945, 0.981, 0.979, and 0.989 at 0 Hz,10 Hz, 20 Hz, and 30 Hz, respectively.At a fixed vibration frequency, the permeability increases with increasing vibration time.At a fixed vibration time, the greater the vibration frequency, the greater the permeability.
The pH value of the solution varied from 6.72 to 7.18 throughout the experiments.When the vibration frequency was 0 Hz, the sample was only subjected to a hydrostatic pressure, under which the molecular diffusion at the interface between the sample and the solution primarily depends on the concentration difference.With increasing time,the sample permeability increases only when the inner fine particles of the sample migrate and an effective porosity is achieved.However,a long time is likely required to drive this process in low-permeability sandstone.The variation in the permeability measured at 0 Hz is therefore very small (Fig.4a).
3.2.2.Ion concentrations
The concentrations of U6+, Fe2+, and Fe3+in the solution after the reaction are shown in Fig.4b-d, respectively.The results indicate that the U6+concentration increases with the permeability and that the slopes of the curves at lower frequencies are greater.For a given vibration time, higher vibration frequencies were associated with higher permeability values and smaller curve slopes, indicating that the permeability increase is not directly proportional to the increase in the U6+concentration.The permeability and chemical reaction simultaneously restrict the U6+leaching.Fig.4c and d demonstrates that, with the vibration time,the Fe3+concentration decreases and the Fe2+concentration increases,which indicates that Fe3+oxidizes U4+to U6+and that Fe3+is transformed into Fe2+,such that the changes in the Fe2+and Fe3+concentrations can correctly indicate the change trend in the U6+concentration.
3.2.3.Damage degree and compressive strength
The compressive strength of a sample can indirectly reflect the damage change.The sample damage and peak compressive strength are shown in Fig.4e and f, respectively.The results show that the peak compressive strength of the samples has a trend with increasing time of rapid decline, slow decline, and then rapid decline.However,the damage degree increases exponentially with increasing time and higher vibration frequencies are associated with larger damage degrees and smaller peak compressive strengths.This indicates that the peak compressive strength does not rapidly decline until the sample damage has accumulated to a certain value.
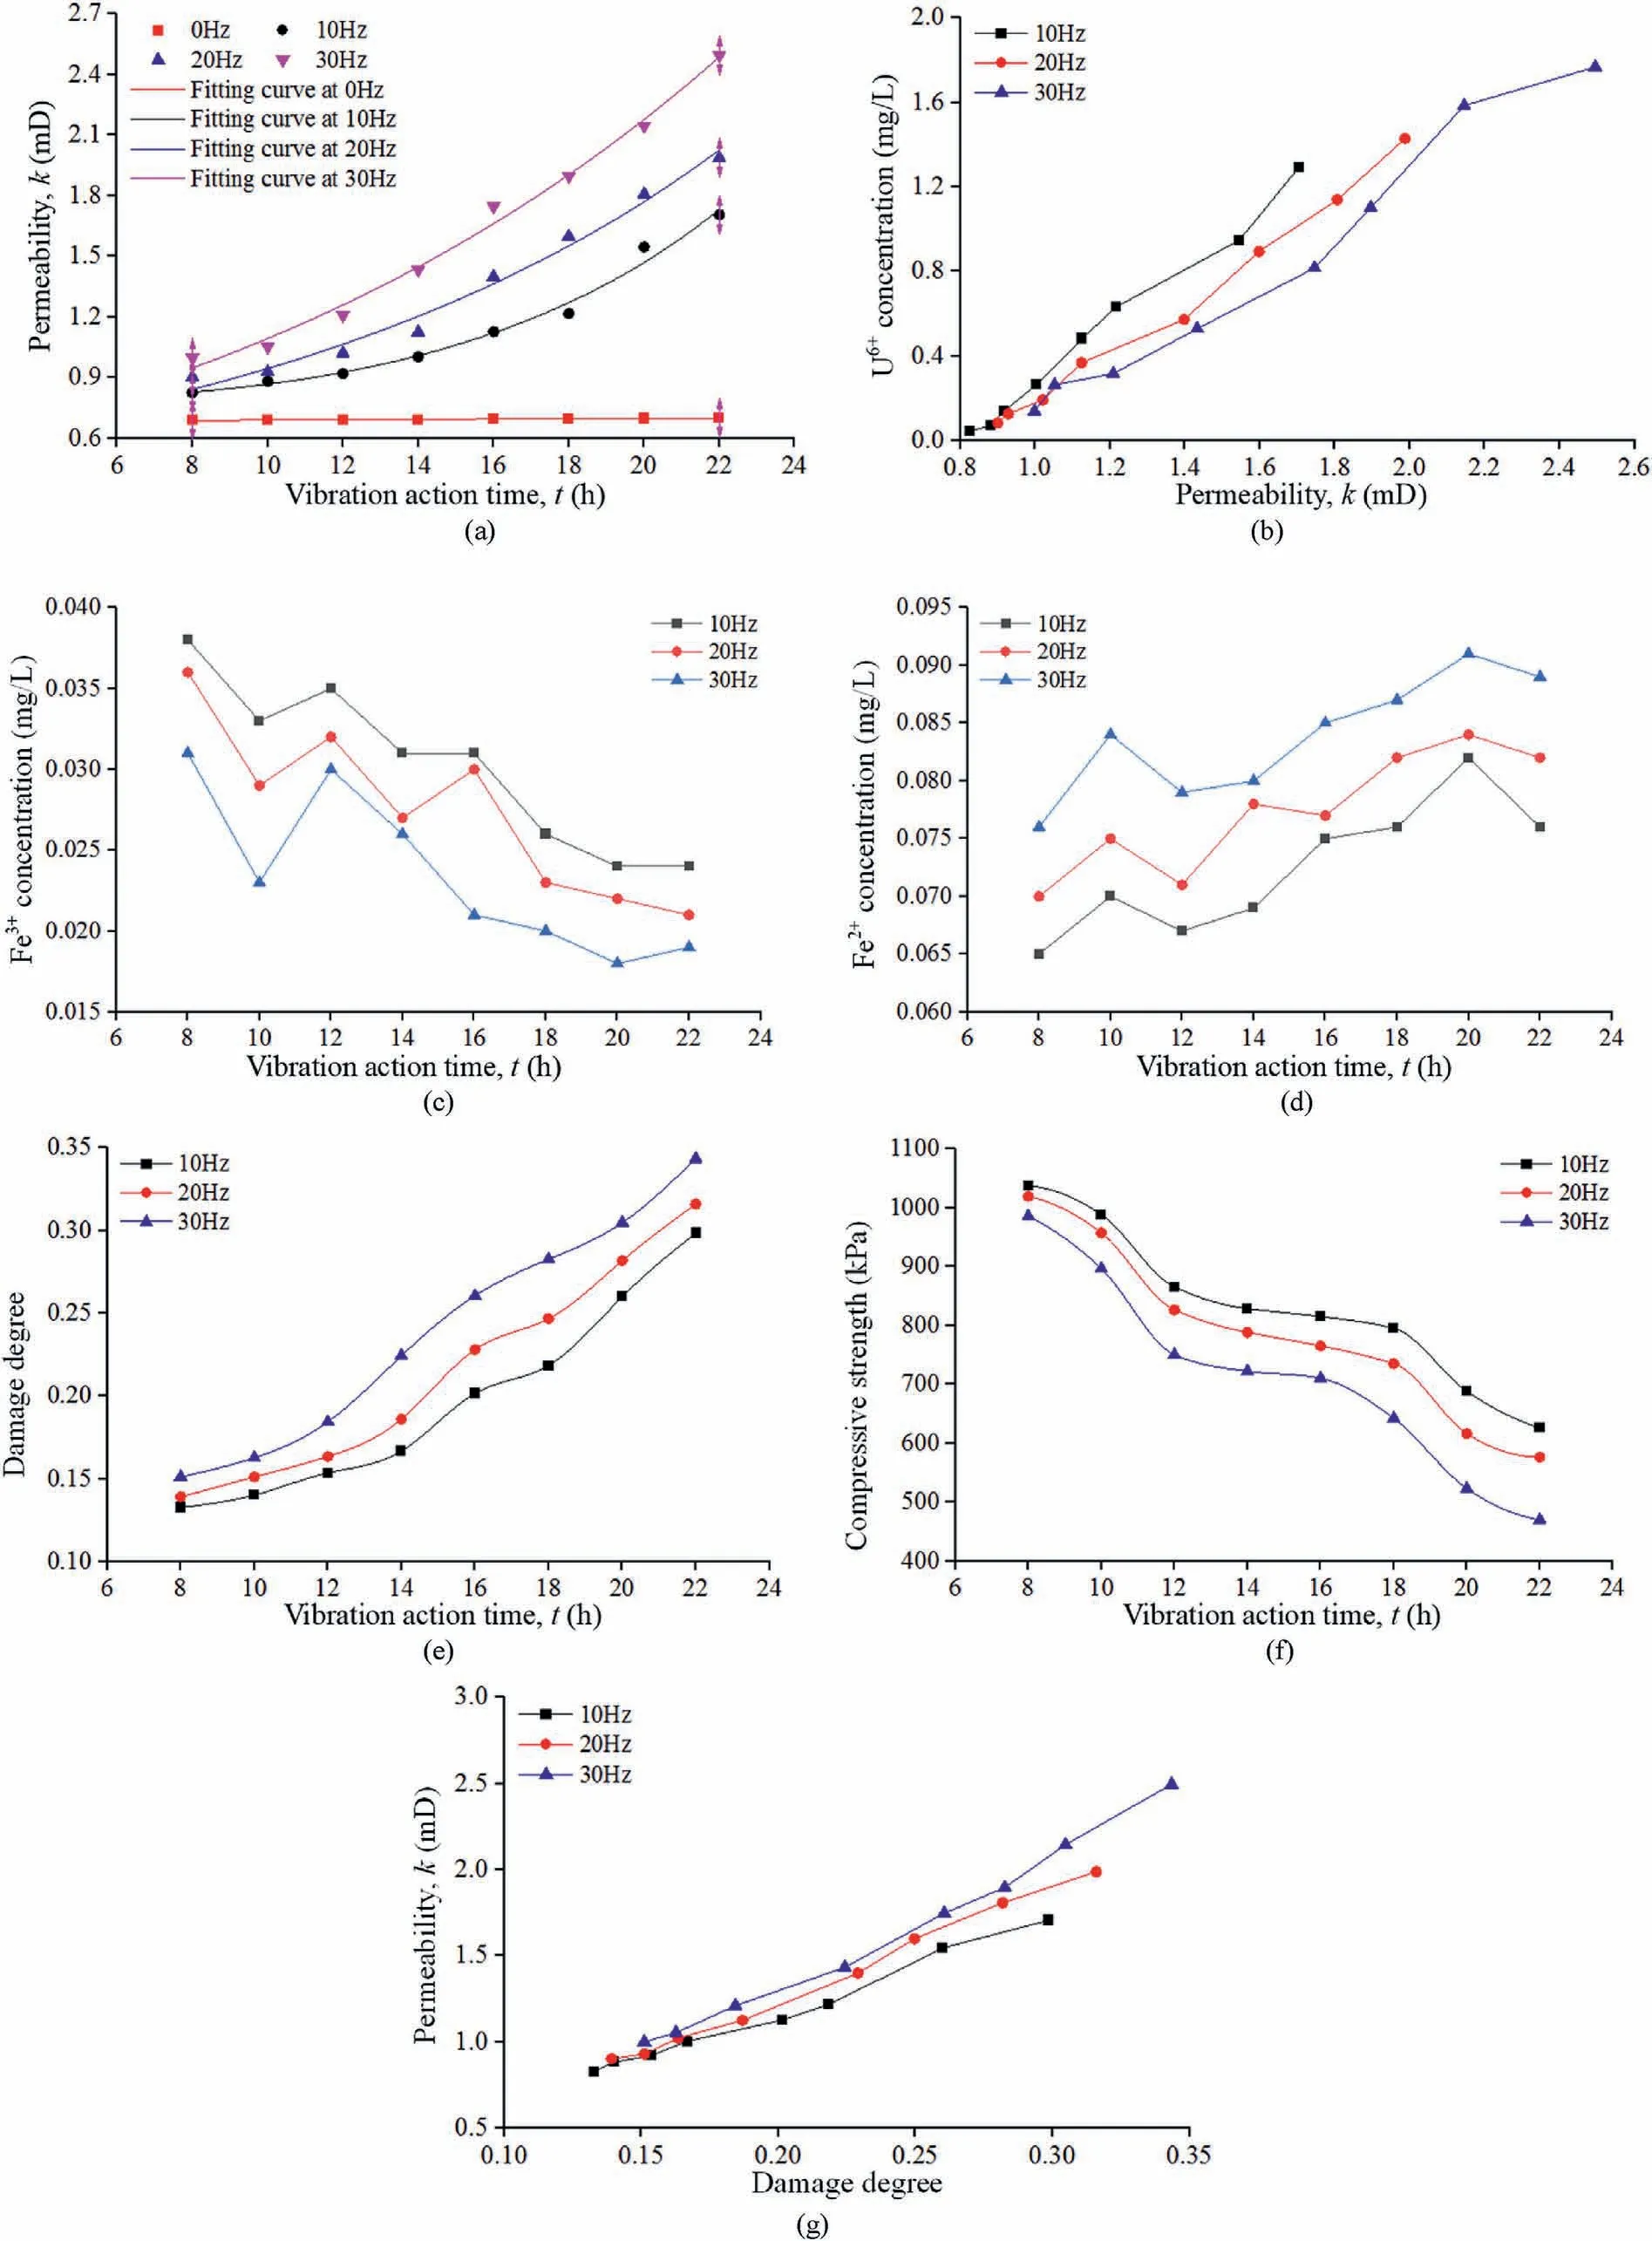
Fig.4.(a) Incremental change in the sandstone permeability; (b-d) Ion concentrations in solution versus the permeability; (e) Damage degree versus the vibration time; (f)Compressive strength versus the vibration time; and (g) Permeability change versus damage degree under low-frequency vibration.
The sample damage is closely related to the permeability, as shown in Fig.4g.The curves in the figure show that the permeability increases almost linearly with increasing damage degree and that higher vibration frequencies are associated with larger damage degrees and permeabilities.According to Fig.4, we can tentatively conclude that vibration causes sandstone damage in the vibration leaching process and that the damage degree increases with increasing time,which leads to permeability increase and is conducive to chemical reactions,subsequently increasing the U6+concentration.
3.2.4.Analysis of U6+leaching kinetics
U6+leaching is a chemical reaction process.In general, U6+leaching is primarily restricted by the seepage and diffusion of a leaching solution in low-permeability sandstone.Because the sandstone has low permeability, both the chemical reactants and reaction products have difficulty in spreading and migrating,which hinders the chemical reaction.Vibration can improve the sandstone permeability,and thus accelerate the diffusion and migration of the leaching solution and intensify the ion diffusion in the solution.However, to determine whether vibration causes the U6+leaching reaction to no longer be diffusion-constrained but to be primarily controlled by the reaction rate,we need to further analyze the U6+leaching kinetics.
The common shrinking core model was used to determine the rate control and kinetic parameters of the U6+leaching process and to describe the reaction between the sample and the leaching solution(Ghorbani et al.,2011).When a chemical reaction process is controlled by the chemical reaction rate, the reaction rate is expressed as (Hou et al., 2010; Chen et al., 2020):
where β is the uranium leaching rate,and KCis the surface chemical rate constant.When the reaction process is controlled by diffusion,the reaction rate is expressed as
where KDis the pore diffusion rate constant.
The measured uranium content of the ore was 0.028%, and the mass of the uranium ore in the sample was 266 g.The results obtained by substituting the data in Fig.4b into Eqs.(37)and(38)are shown in Fig.5 andTable 3.
The R2values in Table 3 indicate that Eq.(37)produces a better fit to the test data than Eq.(38).The vibration treatment therefore increases the permeability,which causes the U6+leaching reaction to no longer be diffusion-constrained and instead to be primarily controlled by the reaction rate.

Table 3 Fitting parameters.
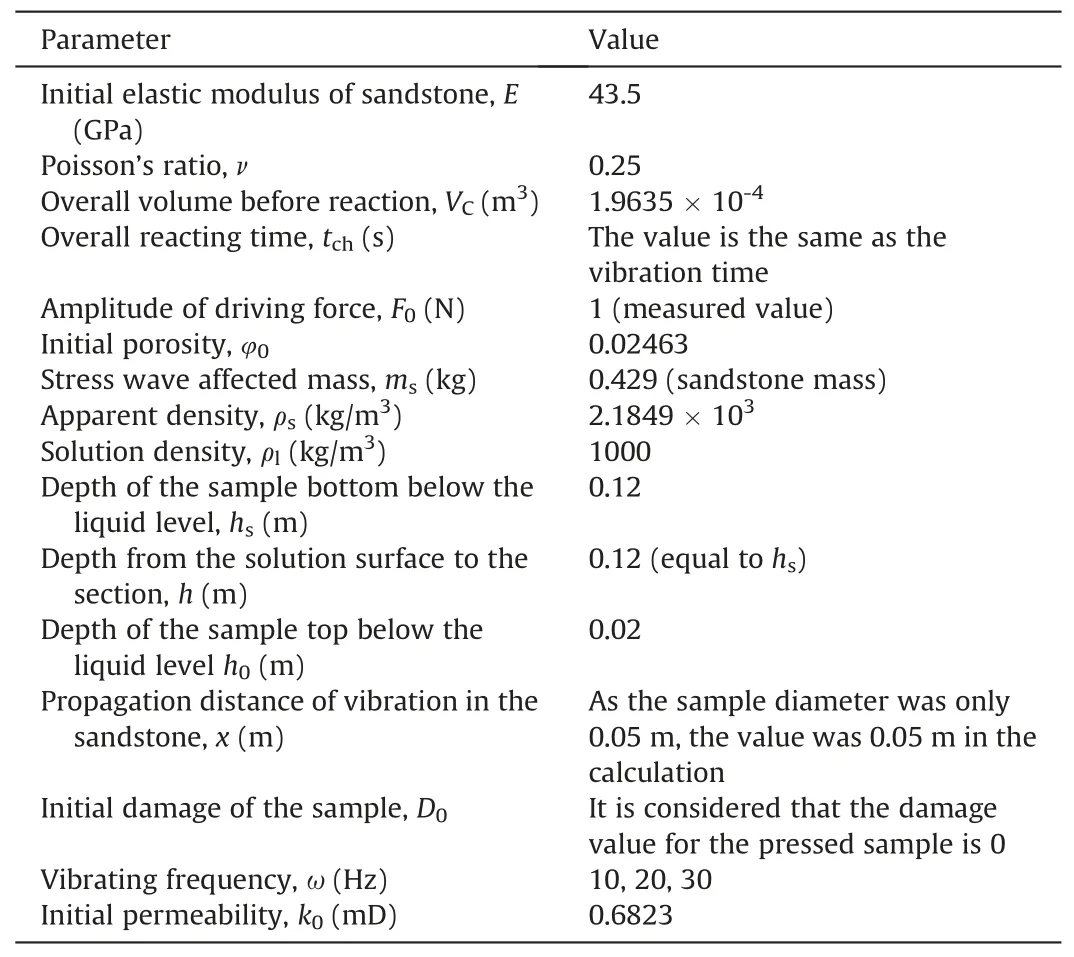
Table 4 Experimental parameters.
4.Model calculations
4.1.Calculation parameters
To analyze the consistency and trends of the calculated and measured permeability values, the experimental parameters need to be substituted into the calculation model.The stress and strain values for the sample treated at 30 Hz for 22 h correspond to the maximum stress and strain values used in the experiment,respectively.The experimental parameters are listed in Table 4.The Ca2+and Mg2+concentrations are listed in Tables 5 and 6,respectively.

Fig.5.Changes in (a) 1 - (1 - β)1/3 and (b) 1 +2(1 - β) - 3(1 - β)2/3 with time during the uranium leaching process.
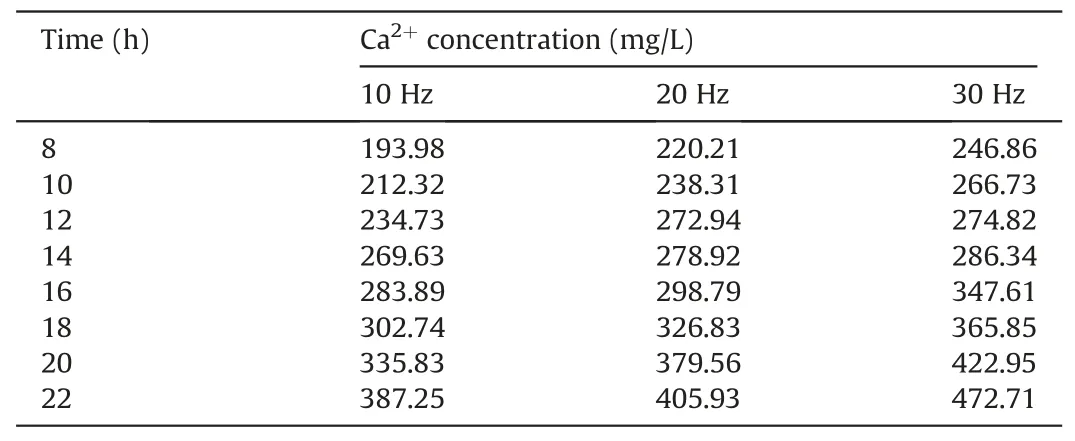
Time (h) Ca2+ concentration (mg/L)10 Hz 20 Hz 30 Hz 8 193.98 220.21 246.86 10 212.32 238.31 266.73 12 234.73 272.94 274.82 14 269.63 278.92 286.34 16 283.89 298.79 347.61 18 302.74 326.83 365.85 20 335.83 379.56 422.95 22 387.25 405.93 472.71
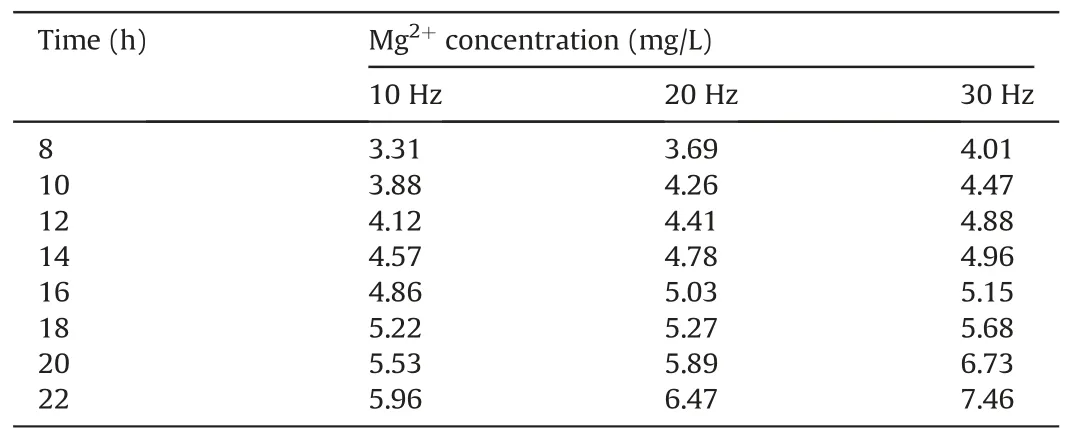
Table 6 Mg2+ concentration.
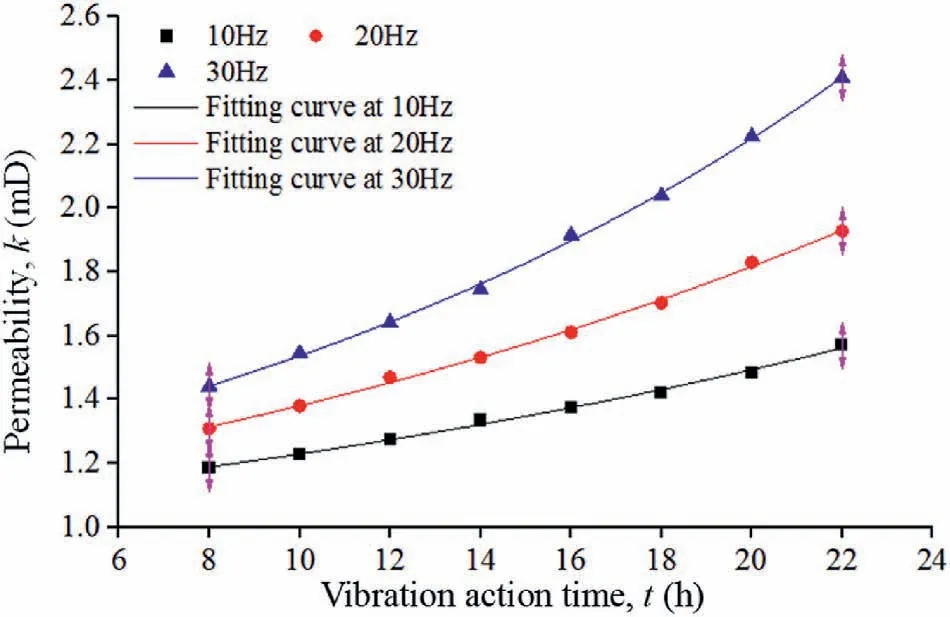
Fig.6.Sandstone permeability curves determined by the model calculation.
4.2.Analysis of the calculation results
In the actual leaching process,natural sandstone is subjected to head pressure and injection pressure induced by the liquid injection pump.Conversely, the samples in the experimental reaction kettle were affected by the water pressure and the gas pressure.The expansion pressure in the kettle was 2 MPa.After vibration,the gas in the kettle could not be completely dissolved and a certain residual pressure remained.Therefore, in addition to the water pressure,the residual gas pressure in the reaction kettle needed to be considered during the experiments.This residual pressure ranged from 0.8 MPa to 1.2 MPa within the vibration time of 8-22 h.The gas pressure in the calculation was set to the average residual pressure of 1 MPa to reduce errors caused by pressure fluctuations during the vibration process.
The data in Tables 4-6 and the U6+concentration in Fig.4b were substituted into Eq.(35)to calculate the variation in the sandstone permeability, as shown in Fig.6.This figure shows that the permeability changes from 1.186 mD to 1.57 mD at 10 Hz, from 1.309 mD to 1.928 mD at 20 Hz,and from 1.441 mD to 2.408 mD at 30 Hz.To obtain the change trend of the permeability,curve fitting was performed based on the data in Fig.6 using an exponential function of y = ea+bx+cx2.The R2values of the fitting curves are 0.995 at 10 Hz, 0.997 at 20 Hz, and 0.998 at 30 Hz.
A comparison of Figs.4a and 6 shows the consistency between the variations in the experimental and calculated permeabilities,both of which follow the formula y = ea+bx+cx2.Meanwhile, the variation ranges of the measured and calculated permeabilities are essentially consistent.
5.Permeability evolution mechanism
5.1.Mechanism analysis
The relationships between the damage degree, permeability,and U6+concentration were preliminarily obtained under the experimental conditions.To further determine the low-frequency vibration improvement mechanism for the permeability of lowpermeability sandstone, other model parameters need to be analyzed to obtain the relationships between the parameters calculated using the model.
The relationships of the porosity φ versus the damage degree D,the chemical erosion volume Vchversus the porosity φ, the volumetric strainvversus the chemical erosion volume Vch, the skeleton strainsversus the volumetric strainv,and the permeability k versus the porosity φ are shown in Fig.7.
Fig.7a indicates that the porosity φ increases linearly with increasing damage degree D and that, when the vibration time is the same, higher vibration frequencies are associated with larger damage degrees and porosities.Fig.7b shows that the chemical erosion volume Vchhas a linearly increasing trend with increasing porosity φ and that more time is required to obtain the same porosity for lower vibration frequencies, which can result in a larger chemical erosion volume, indicating that the chemical erosion volume is influenced not only by the porosity but also by the chemical reaction time.This conclusion is consistent with that in Fig.4b.In Fig.7c, we see that the volumetric strainvincreases linearly with increasing chemical erosion volume Vch.In addition,when the vibration time is the same, higher vibration frequencies are associated with larger chemical erosion volumes and volumetric strains and the sandstone volume becomes increasingly smaller.Fig.7d illustrates that when the vibration time is the same,higher vibration frequencies are associated with larger volumetric strainsvand skeleton strainss.In addition, the volumetric and skeleton strains are negative.When the vibration frequencies are the same, the variation of the skeleton strain is much larger than that of the volumetric strain.This indicates that the sandstone skeleton and volume are both reduced, and the shrinkage level of the skeleton is higher than that of the volume, which means that the sandstone porosity becomes increasingly larger, and the permeability increases in turn, as shown in Fig.7e.
Fig.7 indicates that vibration causes increased damage to the low-permeability sandstone and thus increases the porosity,which result in further contact between the leaching solution and sandstone pores, such that the chemical erosion volume increases and the volumetric strain and skeleton strain of the sandstone become large.The sandstone volume and skeleton shrink, since the shrinkage level of the skeleton is greater than that of the sandstone volume, the porosity becomes larger and the damage increases.Meanwhile,the vibration further increases the sandstone damage,such that the cycle continues, leading to the gradual increase of permeability.
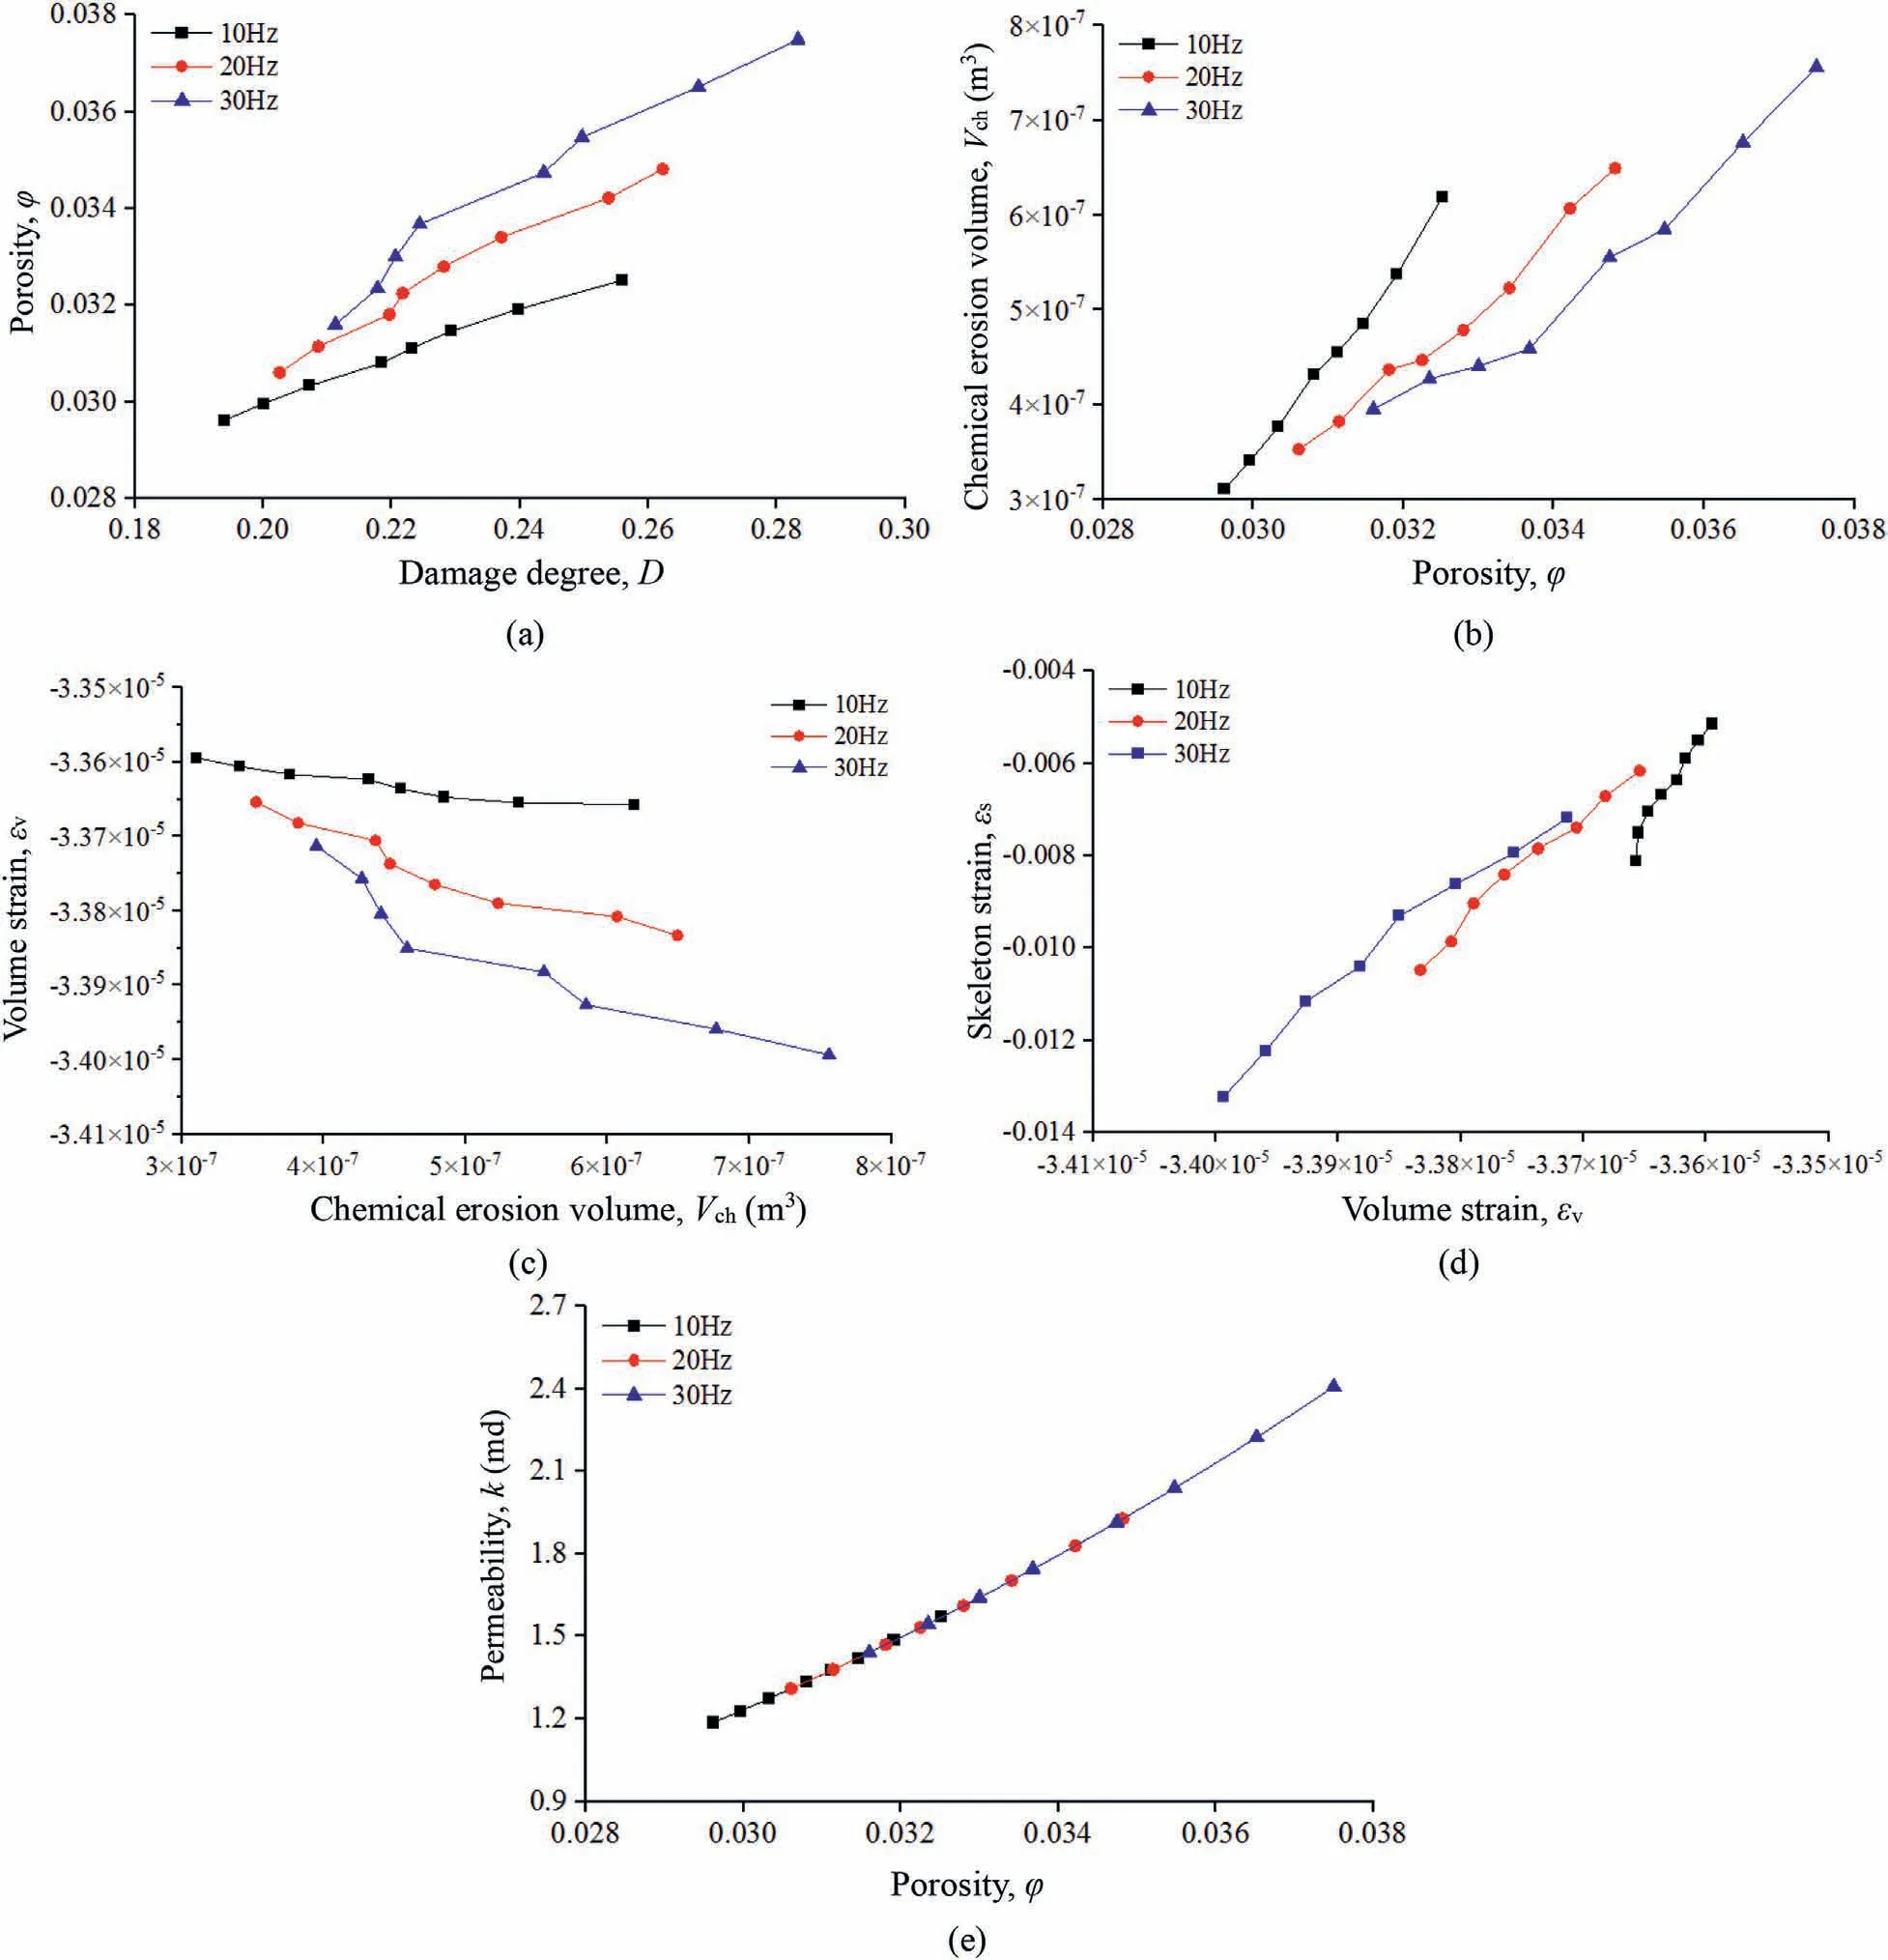
Fig.7.Relationships between the model parameters:(a)The porosity φ versus the damage degree D;(b)The chemical erosion volume Vch versus the porosity φ;(c)The volumetric strain v versus the chemical erosion volume Vch; (d) The skeleton strain s versus the volumetric strain v; and (e) The permeability k versus the porosity φ.
The permeability evolution mechanism obtained using the established model is consistent with the preliminary conclusion concerning the permeability change obtained by the experiments,which further supports the preliminary experimental conclusion and indicates that the permeability evolution mechanism obtained by the model is correct.
5.2.Optimum permeability analysis
When the vibration time is the same, a greater vibration frequency leads to greater damage,porosity,chemical erosion volume,volumetric strain,skeleton strain,more shrinkage of the sandstone volume and skeleton, and greater permeability.However, a larger vibration frequency is not necessarily better for the uranium leaching process.When the vibration time is the same, a larger vibration frequency is applied with a lower compressive strength and thus the sandstone is more easily damaged and ultimately turns to powder.Then, the channeling effect forms inside the sandstone and the chemical reaction does not have time to take place.The leaching solution flows through the sandstone, and the chemical reactive rate changes from a certain value to zero, such that the maximum permeability value that can be measured occurs at the moment before the sandstone breaks.However,this value is not the optimum permeability value because a chemical reactive rate exists.The optimum permeability can be obtained as
where Kkis the optimum permeability corresponding to the maximal ratio, and keis the permeability obtained from the experiment.
In Eq.(38), the Ca2+concentration can represent the chemical reactive rate because the sample contains high amounts of calcium carbonate.The ratio of cb/kechanging with time is represented in Fig.8.
Fig.8 indicates that the time that the optimum permeability occurs is 14 h at 10 Hz,12 h at 20 Hz,and 10 h at 30 Hz.The ratio is 268.9 at 14 h for 10 Hz,267.31 at 12 h for 20 Hz,and 253.46 at 10 h for 30 Hz.The optimum permeability is 1 mD at 10 Hz,1.02 mD at 20 Hz,and 1.05 mD at 30 Hz.This new method for determining the optimum permeability can be used for in situ CO2+ O2leaching.Therefore, uranium leaching from low-permeability sandstone treated with low-frequency vibration primarily follows a process consisting of (1) a permeability control stage, (2) achieving the optimum permeability, (3) a chemical reactive rate control stage,and(4)a channel flow stage.Prior to the formation of channel flow,the permeability increases constantly with time and the chemical reactive rate is some change value.After the formation of channel flow, the permeability is infinite and the chemical reactive rate tends to zero.
6.Conclusions
The evolution of permeability and its relationship with the chemical reactive rate affecting uranium leaching were innovatively analyzed under the influence of low-frequency vibration during the process of CO2+O2leaching.The permeability evolution mechanism was obtained, and a new method for determining the optimum permeability was proposed.The conclusions of the study are summarized below:
(1) A sandstone permeability evolution model was established under vibration leaching conditions.The model can accurately reflect the effect of low-frequency vibration and chemical erosion on the permeability of sandstone during CO2+O2leaching and can accurately reflect the permeability evolution mechanism.
(2) The low-frequency vibration leaching experimental results indicate that the permeability and chemical reaction both simultaneously restrict U6+leaching during uranium leaching and that the vibration treatment increases the permeability, which cause the U6+leaching to not be diffusionconstrained but rather to be primarily controlled by the reaction rate.
(3) The permeability evolution mechanism is such that vibration causes damage to the low-permeability sandstone and increases the porosity.This results in further contact between the leaching solution and the sandstone pores.As a result,the volume of chemical erosion increases,further increasing the porosity and the damage.This process continues, gradually leading to the permeability increase.
(4) A new method for determining the optimum permeability was proposed,and the uranium leaching primarily follows a process with a permeability control stage, achieving the optimum permeability,a chemical reactive rate control stage,and a channel flow stage.
Declaration of competing interest
The authors declare that they have no known competing financial interests or personal relationships that could have appeared to influence the work reported in this paper.
Acknowledgments
This study was financially supported by the National Natural Science Foundation of China (Grant No.11705086), the National Science Foundation of Hunan Province, China (Grant No.2018JJ3424),and the Foundation of Hunan Educational Committee(Grant No.16C1387).The authors appreciate the comments of two anonymous reviewers that improved the quality of the manuscript.
List of symbols
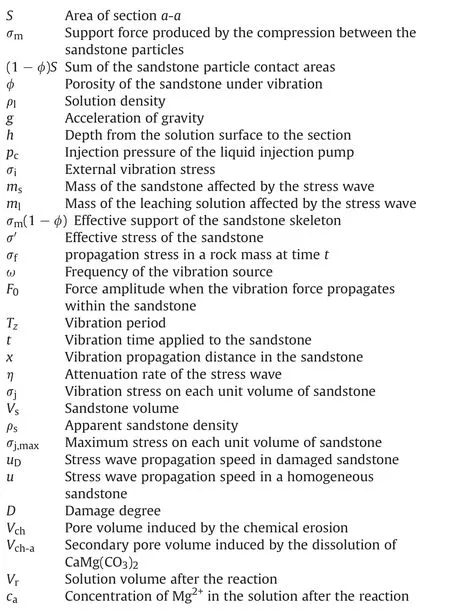
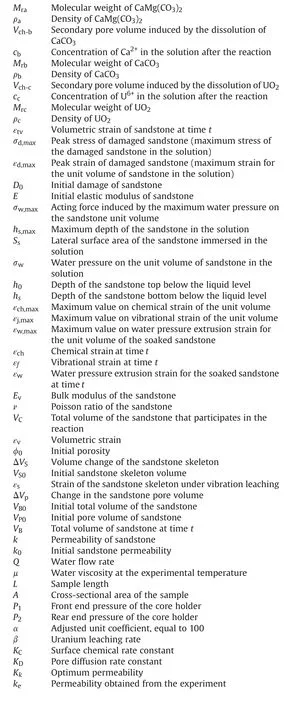
 Journal of Rock Mechanics and Geotechnical Engineering2023年10期
- Journal of Rock Mechanics and Geotechnical Engineering的其它文章
- A true triaxial strength criterion for rocks by gene expression programming
- Key issues in water sealing performance of underground oil storage caverns: Advances and perspectives
- Wetting-drying-freezing-thawing cycle effect on the hydro-mechanical behaviour of Yanji swelling mudstone
- Capability of discrete element method to investigate the macro-micro mechanical behaviours of granular soils considering different stress conditions and morphological gene mutation
- Numerical analysis of bending property of bi-modulus materials and a new method for measurement of tensile elastic modulus
- Analysis of rockburst mechanism and warning based on microseismic moment tensors and dynamic Bayesian networks
