Analysis of rockburst mechanism and warning based on microseismic moment tensors and dynamic Bayesian networks
Hoyu Mo, Nuwen Xu,*, Xing Li, Bio Li, Peiwei Xio, Yonghong Li, Peng Li
a State Key Laboratory of Hydraulics and Mountain River Engineering, College of Water Resource and Hydropower, Sichuan University, Chengdu, 610065, China
b School of Geoscience and Technology, Southwest Petroleum University, Chengdu, 610500, China
c PowerChina Chengdu Engineering Corporation Limited, Chengdu, 610072, China
d Sichuan Dadu River Shuangjiangkou Hydropower Development Corporation Limited, Maerkang, 624011, China
Keywords:
ABSTRACT One of the major factors inhibiting the construction of deep underground projects is the risk posed by rockbursts.A study was conducted on the access tunnel of the Shuangjiangkou hydropower station to determine the evolutionary mechanism of microfractures within the surrounding rock mass during rockburst development and develop a rockburst warning model.The study area was chosen through the combination of field studies with an analysis of the spatial and temporal distribution of microseismic(MS) events.The moment tensor inversion method was adopted to study rockburst mechanism, and a dynamic Bayesian network (DBN) was applied to investigating the sensitivity of MS source parameters for rockburst warnings.A MS multivariable rockburst warning model was proposed and validated using two case studies.The results indicate that fractures in the surrounding rock mass during the development of strain-structure rockbursts initially show shear failure and are then followed by tensile failure.The effectiveness of the DBN-based rockburst warning model was demonstrated using self-validation and K-fold cross-validation.Moment magnitude and source radius are the most sensitive factors based on an investigation of the influence on the parent and child nodes in the model, which can serve as important standards for rockburst warnings.The proposed rockburst warning model was found to be effective when applied to two actual projects.
1.Introduction
With China’s rapid social and economic development, the demand for clean energy has increased dramatically, and many new hydropower projects have been implemented in Southwest China,including Wudongde (Li et al.,2020a), Houziyan (Sun et al.,2021),Dagangshan (Liu et al., 2017), and Shuangjiangkou (Liang et al.,2020a).Southwest China contains high mountains and canyons with complex geological conditions and high ground stresses.The large-scale excavations of underground caverns will result in a series of problems, such as rockbursts, owing to the instability of the surrounding rock,which will severely impede the construction progress (Cai et al., 2018; Keneti and Sainsbury, 2018; Xu et al.,2018a; Afraei et al., 2019; Qiu et al., 2020; Duan et al., 2021; Ma et al., 2021).Therefore, understanding the mechanism of mass failure in the surrounding rock and developing rockburst warning methods are of enormous scientific and engineering value.
As an advanced method of geotechnical construction safety monitoring, microseismic (MS) monitoring technology allows for detecting microfractures in the surrounding rock mass within a reasonable range and permits analysis of the mechanism that causes rockbursts while providing warnings for future disasters(Xu et al., 2011a).MS monitoring was first applied in the 1910s to monitor earthquakes within mines.By the 1940s, mine MS monitoring became popularized and scholars began to study internal fracturing of the surrounding rock mass.Subsequently, after the 1980s, MS monitoring technology developed rapidly; it was not only used to monitor mine safety(Young et al.,1989,2004)but also widely used in other engineering fields, such as civil engineering,oil and gas, and hydraulic engineering (Sasaki, 1998; Tezuka and Niitsuma, 2000; Rutledge and Phillips, 2003; Grechka et al., 2010;Maxwell et al., 2010).This indicated it as an important safety monitoring approach in the field of rock mechanics and engineering and also led to outstanding achievements in engineering management and scientific research.For instance, Young et al.(2004) detailed the engineering applications of MS monitoring systems in deep mines and defined the MS parameters in the seismology of MS monitoring systems.Based on Big Bell Mine in Australia, Hudyma and Potvin (2009, 2010) constructed an MS monitoring system,proposed risk assessment standards for mining and construction, and formulated project specific construction management methods that included disaster identification and analysis.Oye et al.(2013) and Stork et al.(2014) built an MS monitoring system based on the CO2storage project in the In Salah area of Algeria and studied the correlation function between injection velocity and wellhead pressure using MS monitoring data.Lu et al.(2013) introduced the Polish SOS MS monitoring system and successfully completed the construction of the system in several coal mines.They investigated the parameters such as MS event activity rate and energy, and successfully predicted several low-pressure impact disasters in mines, which prevented huge engineering and economic losses.MS monitoring was originally applied to the field of hydropower engineering by Xu et al.(2011a),and has since seen rapid development in the field of hydropower engineering monitoring(Xu et al.,2012,2014,2015a,b,2018b;Dai et al., 2016, 2017; Hu et al., 2020; Li et al., 2018, 2019a, b, 2020b,2022;Huang et al.,2022;Xiao et al.,2022).In hydropower projects such as Jinping II and Baihetan,Chen et al.(2014),Feng et al.(2015,2016) and Dai et al.(2018) successfully establish MS monitoring systems, conducted in-depth research on engineering problems such as rockbursts,clarified the rock fracture mechanism,proposed numerous warning indicators for rockbursts, and promoted the growth of geotechnical engineering disciplines.
The mechanism behind rock failure has been studied for a long time (Wu et al., 2022), and moment tensor inversion is a crucial analytical method for studying the rock fracture mechanism in natural earthquakes (Backus and Mulcahy, 1976; Vavryˇcuk, 2001;Dai et al., 2016).In addition, from the perspective of fracture mechanics, the mechanism is essentially the same in both natural earthquakes and MS events induced by engineering practices, and the moment tensor theory in seismology is equally applicable in the field of MS events(Feignier and Young,1992;Ming et al.,2013;Wu et al.,2016;Dai et al.,2018;Zhao et al.,2020).Therefore,to uncover the rock fracture mechanism in rockbursts and provide guidance on site support, this work applies the moment tensor approach to invert and analyze the MS events that occurred during the rockburst in the access tunnel of the Shuangjiangkou hydropower station.
Accurate warnings enable appropriate countermeasures to be implemented before the occurrence of rockbursts,thus reducing the loss of field personnel and equipment.A series of theoretical approaches has been presented and improved in the extensive research on rockburst warnings conducted by scholars around the world(Hoek and Brown,1997;Cai et al.,2016;Afraei et al.,2019;Xue et al.,2020a,b;Zhou et al.,2021).As scholars from various countries have studied the issue, it has become increasingly apparent that there is a strong nonlinear relationship between the frequency of rockbursts and the factors that influence them (Pu et al., 2019).Artificial intelligence (AI) provides special advantages in solving nonlinear problems(Zhou et al.,2012,2018).Therefore,AI has been applied in the field of rockburst warnings and has achieved marked progress.By utilizing an improved back propagation(BP)algorithm,Sun et al.(2009) suggested a risk warning model for rockbursts based on a fuzzy neural network (FNN).To improve the prediction accuracy given incomplete data samples, Pu et al.(2018) used the decision tree technique for rockburst warnings.As part of their investigation into the evolutionary prediction of MS parameters using deep learning techniques, Zhang et al.(2021) suggested univariate and multivariate MS event warning models based on various MS parameters.Liang et al.(2020b)selected multiple MS parameters as evaluation indicators for rockburst warnings using integrated learning methods such as random forest(RF)and adaptive boosting.Yin et al.(2021) suggested a tree-based approach to automatically detect precursor MS sequences and predict the intensity of rockbursts in real time.Many scholars have brought the Bayesian network(BN),a widely used method in the field of AI,to the field of geotechnical engineering (Jimenez-Rodriguez and Sitar, 2006;Medina-Cetina and Nadim,2008;Xu et al.,2011b;Song et al.,2012;Feng and Jimenez,2015),but few studies have been conducted in the area of rockburst warnings (Li et al., 2017, 2021).A BN cannot accurately represent the dynamic relationship between process parameters because it is static.However, as MS events are timevarying, a dynamic Bayesian network (DBN) can be created by incorporating the influence of the"time"dimension into a static BN.
This study investigated the mechanism and warning of rockbursts occurred in the access tunnel of the Shuangjiangkou hydropower station, Southwest China.Section 2 briefly describes the general situation of the access tunnel.Section 3 presents the MS monitoring system and the spatiotemporal distribution characteristics of MS events.Rockburst mechanism analysis based on the MS moment tensor is discussed in Section 4.Section 5 introduces the DBN and adopted it to rockburst warning.Therefore,the mechanism of surrounding rock mass fractures during the occurrence of rockburst was revealed.A real-time early-warning model of rockburst was established and the early identification of rockburst was realized.
2.Project background
2.1.Project overview
The Shuangjiangkou hydropower station is located in the Ngawa Tibetan and Qiang Autonomous Prefecture, Sichuan Province,China.It is one of the key projects in the cascade development of hydropower stations in the Dadu River Basin.The reservoir has a total capacity of 2.897 billion m3and a regulating capacity of 1.917 billion m3,with a normal storage level of 2500 m.The hydropower station has an installed capacity of 2000 MW and a capacity to generate 7.707 billion kWh of electricity annually.The pivot project comprises a dam, a flood control structure, and a water diversion and power generation system.The earth core rockfill dam is the tallest in the world, with a maximum height of 314 m.The water diversion and power generation system is located on the left bank,and the underground powerhouse is used for power generation,as shown in Fig.1.
2.2.Geology of the access tunnel
To validate the probabilistic parameters of the DBN,the strength of parameter influence was analyzed, as shown in Table 1, which includes the mean values, maximum values, and weights of the child nodes.The weight of the moment magnitude and the source radius are 59.88% and 48.55%, respectively, which have a greater influence on rockburst events.
Theboat came safely across the reef to land; but the evil thoughtremained in his heart, and roused up every little fibre ofbitterness which he remembered between himself and Martin since they had known each other
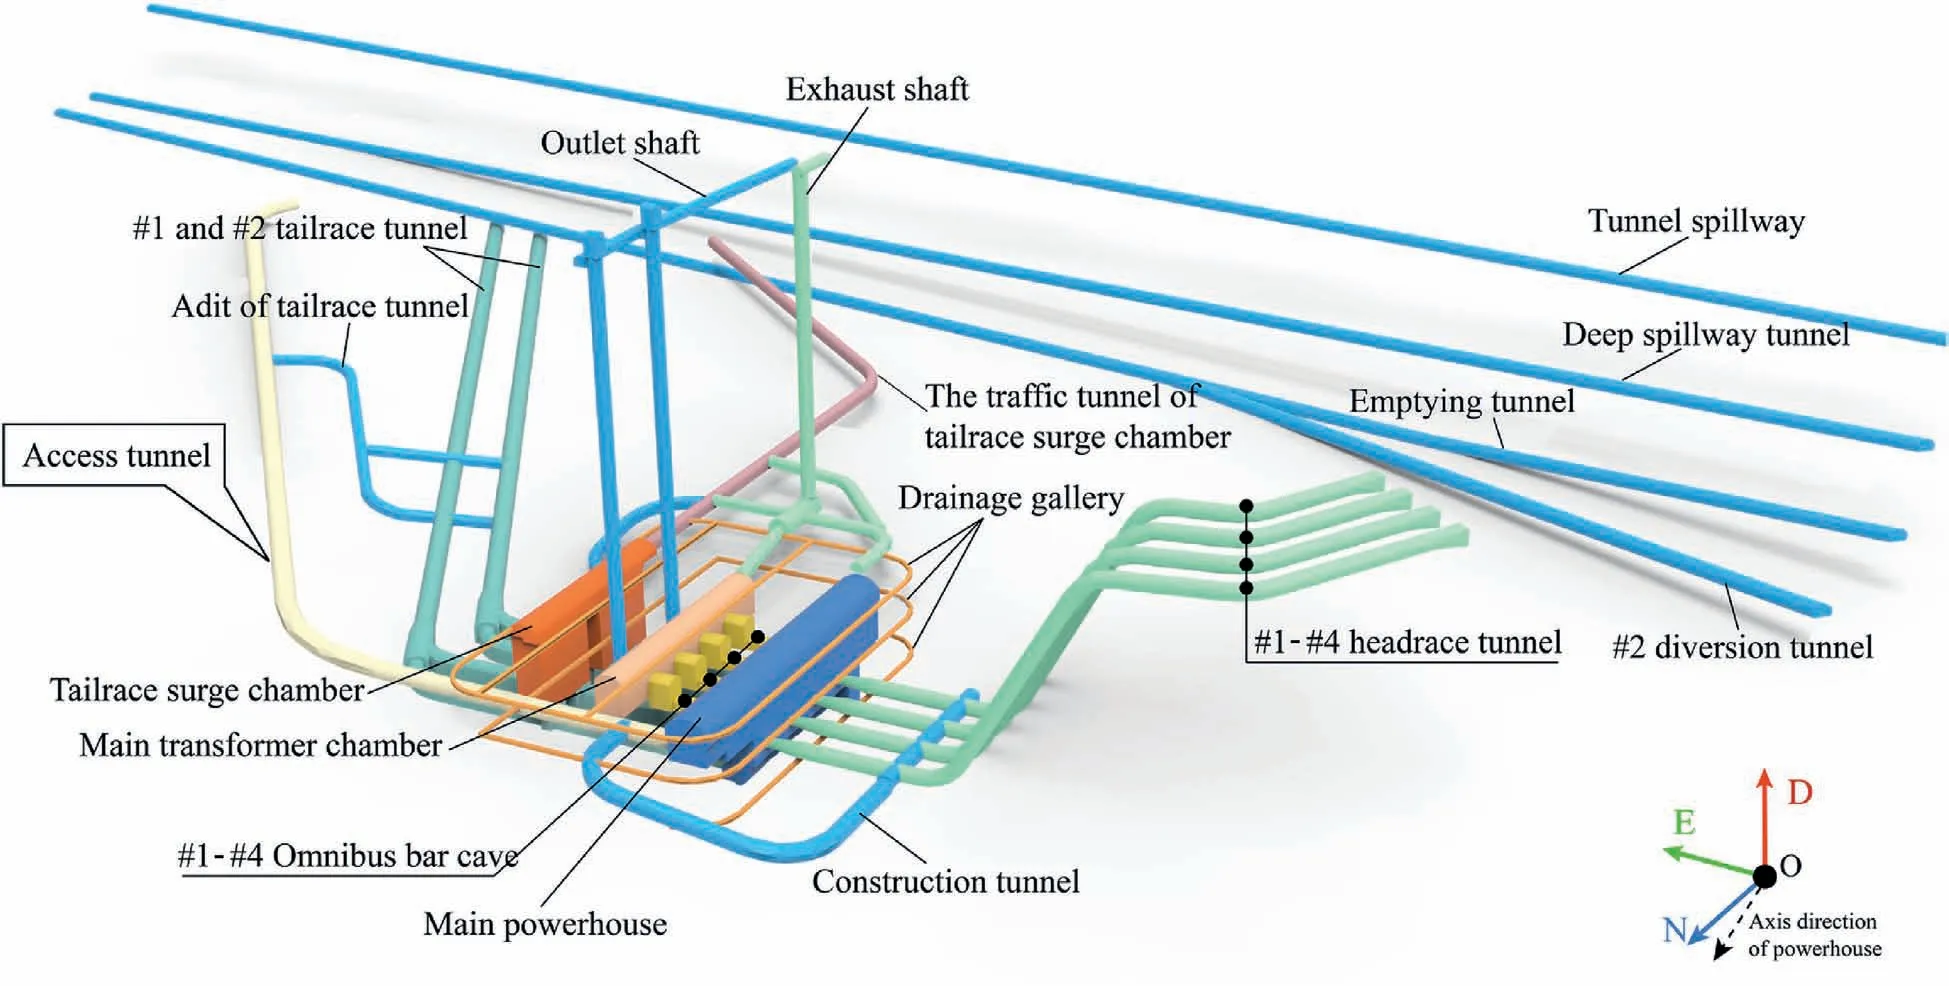
Fig.1.Overall layout of the underground powerhouse caverns on the left bank of the Shuangjiangkou hydropower station (Ding et al., 2022).
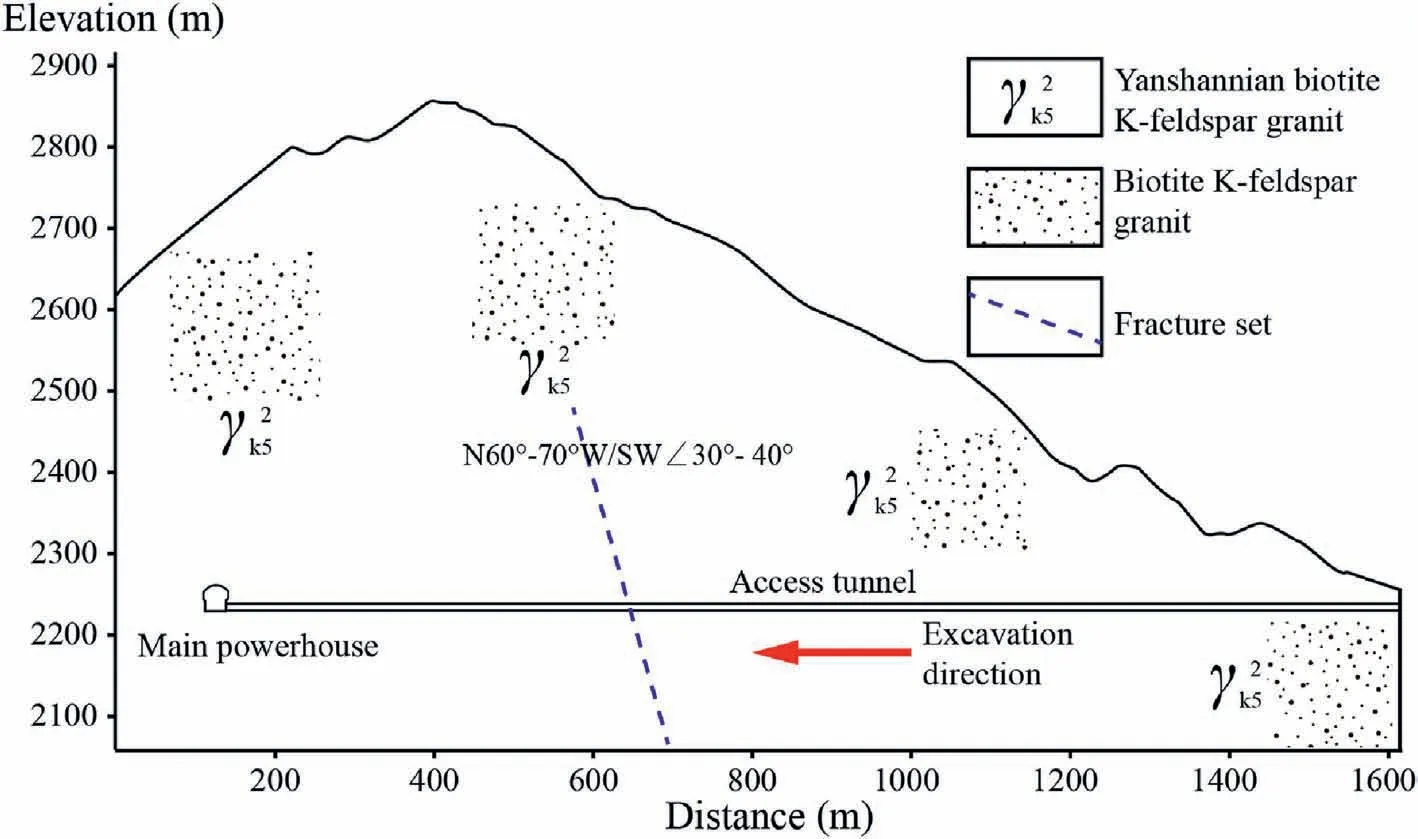
Fig.2.Geological profile of the access tunnel.
3.MS monitoring
3.1.Establishment of the MS monitoring system
MS monitoring, a high-precision geotechnical engineering safety monitoring tool that overcomes the limitations of traditional monitoring, has been rapidly developed in the hydropower engineering industry in recent years.The MS monitoring system was introduced into the access tunnel of the Shuangjiangkou hydropower station to monitor the microfracture evolution characteristics of the surrounding rock and then reveal the mechanism causing fractures and instability in that rock.On September 1, 2017, the monitoring system was successfully implemented to allow continuous 24-h monitoring and provide valuable information for the safe construction of the access tunnel of the project.
The hardware-and-software-based MS monitoring system produced by ESG Solutions was adopted.In particular, the hardware consists of six uniaxial acceleration sensors, a Paladin data acquisition system,and a Hyperion data processing system.A total of 10 uniaxial acceleration sensors were used to pick up signals, with a sensitivity of 25 V/g, a frequency response ranges from 50 Hz to 5000 Hz, and a dynamic range of 100 dB.The software consists of the Hyperion network acquisition system (HNAS) program for signal acquisition and recording,WaveVis for waveform processing and analysis, and SeisVis for three-dimensional (3D) visualization of MS information.
Steve Smith and Carmen Ruiz-Perez, both now 42, fell in love 17 years ago when she was a foreign exchange student in southwest England, and got engaged after only a year together.
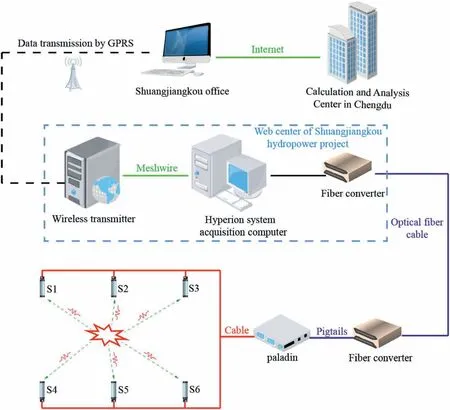
Fig.3.Spatial topology of the MS monitoring system.
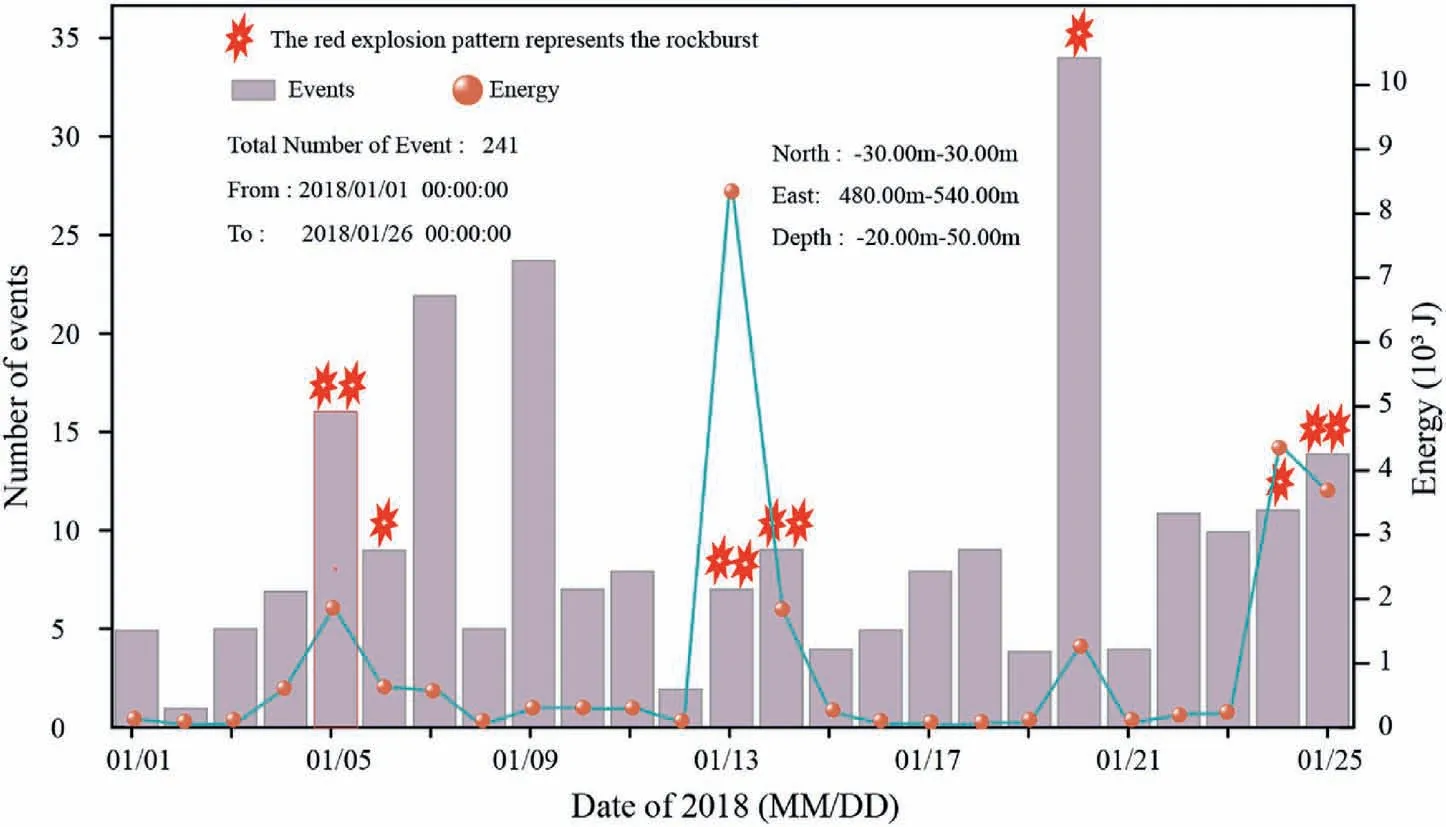
Fig.4.Temporal distribution of MS events and the corresponding released energy.
Fig.3 shows the spatial topology of the MS monitoring system of the access tunnel.The six sensors enable continuous 24-h monitoring of the microfractures close to the tunnel face during excavation of the access tunnel.When a microfracture occurs, the sensor detects the elastic wave and converts it into an electrical signal, which is then sent over the cable to the connected Paladin acquisition substation.The electrical signal is converted to a digital signal, and the converted digital signal is then transmitted over fibre optic cables to the Hyperion signal processing system for initial processing.Following initial processing,the signal is sent via the network to the analysis center for further noise reduction,waveform recognition, source localization and source parameter analysis.
3.2.Microseismic characteristics of the access tunnel
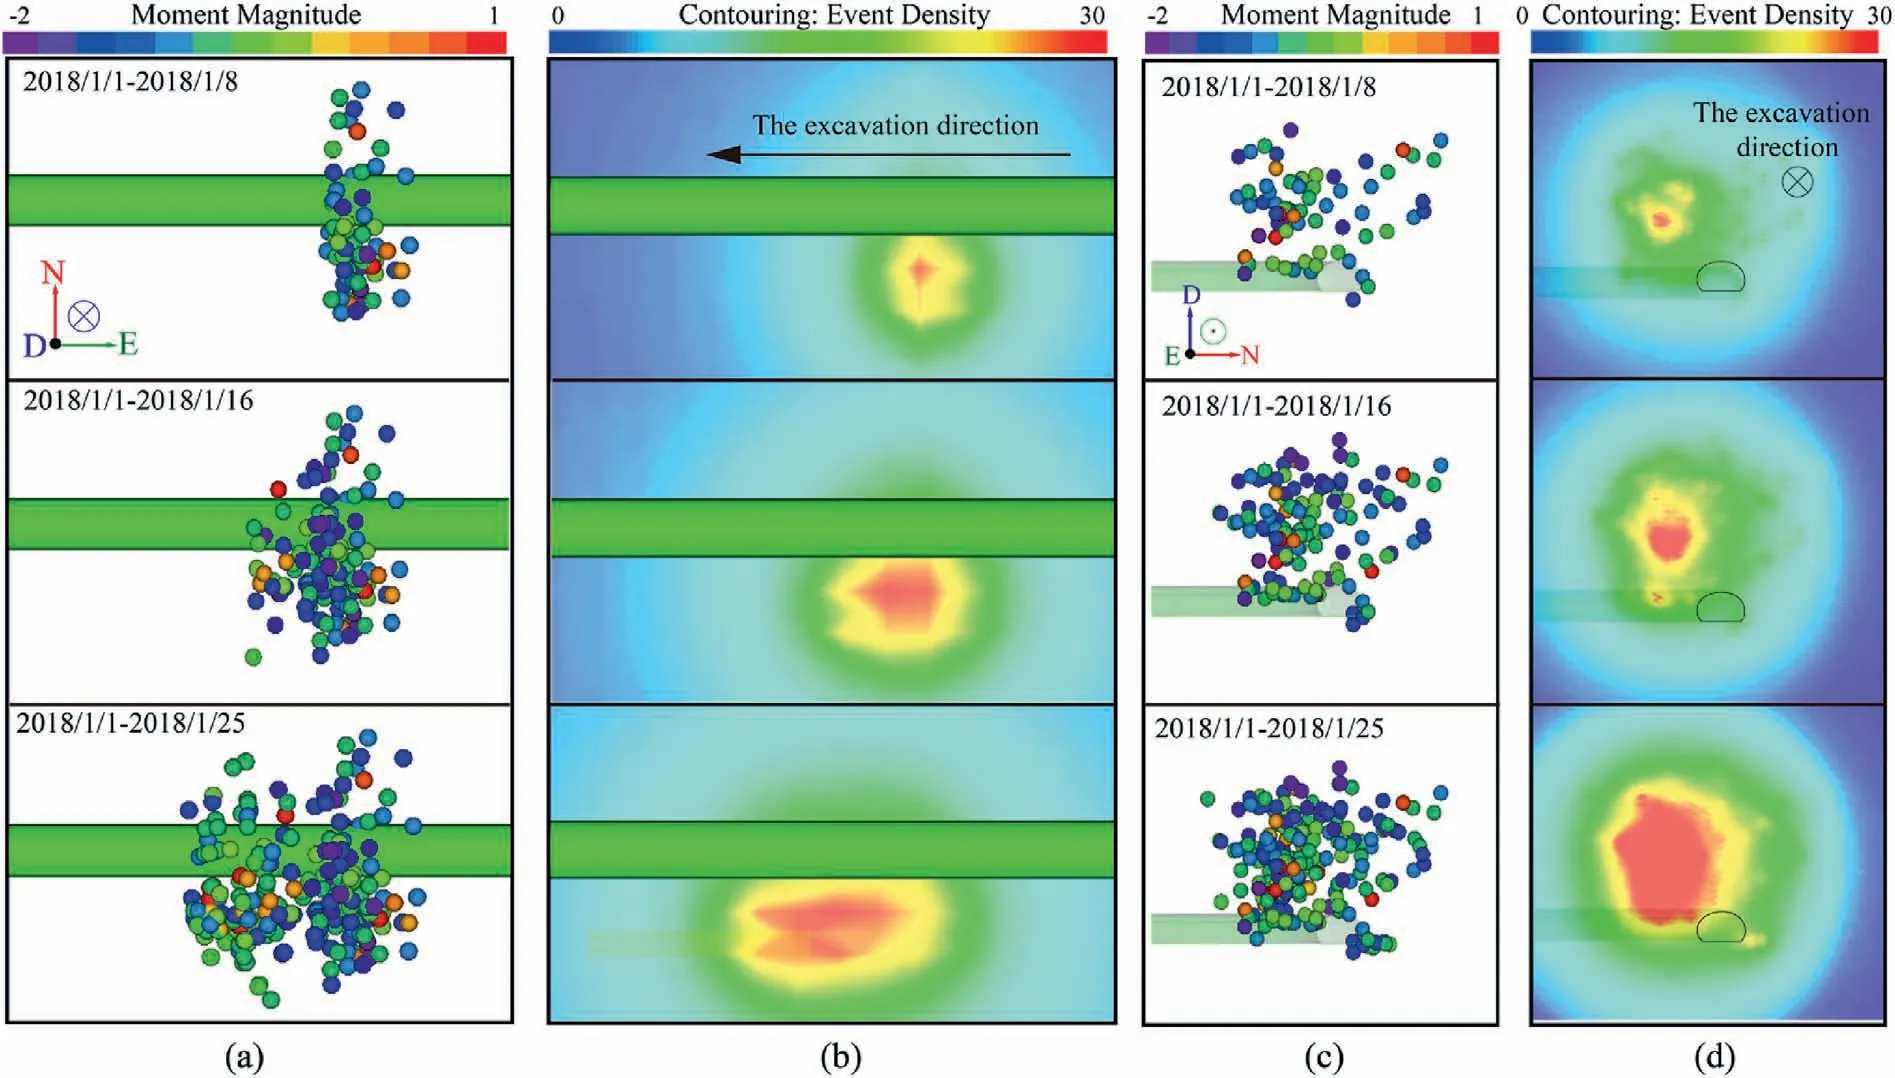
Fig.5.Spatial distribution of MS events: (a) Vertical view and (c) front view of MS events.(b) and (d) depict the density contours of MS events corresponding to (a) and (c),respectively.
where P(Ds|D1,…,Ds-1,G)indicates the prediction accuracy of G on Ds,given that D1,…,Ds-1is averaged over the parameters.log can be thought of as the utility function of prediction.Thus, under the log utility function,the scoring criterion rates the accuracy of G as a sequential predictor of D.This means that the scoring criterion summarizes not only how well the model fits the learning data but also how well it generalizes to the unknown data.To avoid overfitting and ensure that the unknown probability distribution of the time component of the generated learning data can be sufficiently approximated,it is critical to rate the generalization capacity of the model.
4.Analysis of the rockburst mechanism
The MS monitoring results of the Jinping II hydropower station in Southwest China were used as a base for rockburst studies,where rockbursts in its construction drainage tunnel were selected to validate the warning model (Xu et al., 2015b).The construction drainage tunnel was installed with the advanced MS monitoring system produced by ESG Solutions on June 24, 2009.However, it was not until August 20 that the sensors were deployed, and the first batch of valid data was collected because of the constrained area of the drainage tunnel construction site, complex environment, and difficult geological conditions.The rockburst precursor analysis started on September 23 after nearly a month of sensor layout adjustment, cable layout optimization, system parameter adjustment,and accuracy debugging.A total of 772 MS events were observed from September 23 to November 28, 2009.There were typically 12 MS events each day,mostly above the sidewalls of the tunnel.Fig.18 shows the daily MS events and the spatial distribution characteristics of the 772 MS events during this period.Each colored blob represents an MS event, and its color and size represent the seismic energy and moment magnitude of that MS event,respectively, while each red explosion pattern represents a rockburst (Xu et al., 2015b).
4.1.Moment tensor-related theory
The propagation of the elastic wave from the source of the rock fracture to the sensor location in field MS monitoring is governed by the wave equation and Green function for elastic media.The final moment tensor results can be obtained using the vibration data from the MS sensor and the Green function characteristics of the propagating medium.The displacement field function in a system was derived by Aki and Richards (1980) as follows.
where vpand vsrepresent the P- and S-wave velocities, respectively; ρ is the rock density; R is the distance between the sensor and the source point; ri, rpand rqare the direction cosines of the direction vectors between the source and the sensor and the coordinate axes; δpqis the Dirac function; τ is the convolution time variable; and Mpqis the moment tensor component.
In Eq.(1), five displacement terms make up the displacement field.The first term,often known as the near-field term,is the order of magnitude of R-4.The second and third terms, known as the intermediate terms of the displacement fields of the P- and Swaves, respectively, are the order of magnitude of R-2.The fourth and fifth terms, expressed as the far-field displacement components of the P- and S-waves, respectively, are the order of magnitude of R-1and have the slowest decay rate.The far-field displacement components are frequently employed as an approximation of the displacement field in MS monitoring.Additionally,since uniaxial acceleration sensors are commonly used in MS monitoring, the P-wave displacement is dominant, and the first arrivals of P- and S-waves frequently overlap due to the proximity of the source and the sensor, making it challenging to distinguish between them.Therefore,the far-field displacement component of the P-wave is often used to perform the moment tensor inversion,and the displacement field is roughly represented by the following equation:
In the moment tensor inversion of natural earthquakes, the source is typically located below the sensor; however, there are instances in which the MS event is located above the sensor in MS monitoring, thus the relative relationship between the MS sensor and the event location needs to be taken into account (Rafael and Stephanie, 2021; Wojtecki et al., 2022).The displacement field can be represented as follows after correction:
Ohtsu (1991) and Ming et al.(2013) further simplified the relationship between the moment tensor and the displacement field for uniaxial sensors into a system of linear equations:
where u is the displacement value function of the sensor array and G is the simplified Green function matrix.
By combining the aforementioned equations, it is possible to construct the following matrix representation of the MS moment tensor based on the initial motion of P-waves:
4.2.Moment tensor decomposition
As the failure type and characteristics of the rock mass cannot be directly represented by the MS source moment tensor obtained from Section 4.1, a fair decomposition of the moment tensor is required to determine the relationship between the source moment tensor and the source fracture mechanism.The Ohtsu model (Ohtsu,1991), in which the moment tensor eigenvalues are decomposed into pure double-couple (DC), compensated linear vector dipole (CLVD), and isotropic (ISO) components, is now the most widely used moment tensor decomposition model:
In the Ohtsu model,the physical meaning of DC is interpreted as a pure shear crack (SC), while the physical meaning of CLVD is unclear.As a result,Ohtsu combined CLVD with ISO and interpreted them as tensile cracks (TCs).To address the problem of unclear physical meaning of the CLVD in the Ohtsu model,Shah and Labuz(1995)decomposed the moment tensor eigenvalues into SC,TC and ISO components:
The failure type of the MS events can be identified by calculating the ratio of each component in the total moment tensor based on the decomposition results of the moment tensor.In the Shah-Labuz model, the MSC component represents pure SCs physically.It is used to determine the proportion of the SC component by calculating the percentage of MSC, and the failure type is then determined using this proportion:
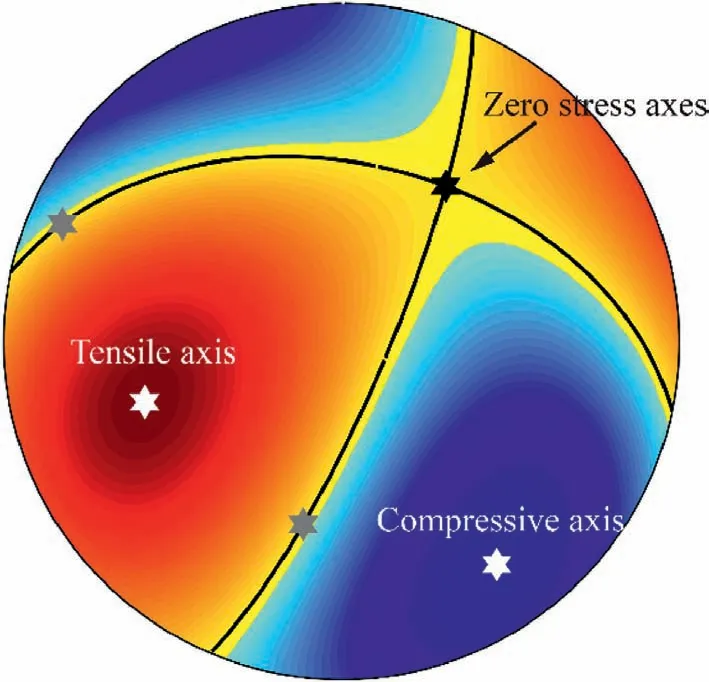
Fig.6.Beach ball plot.
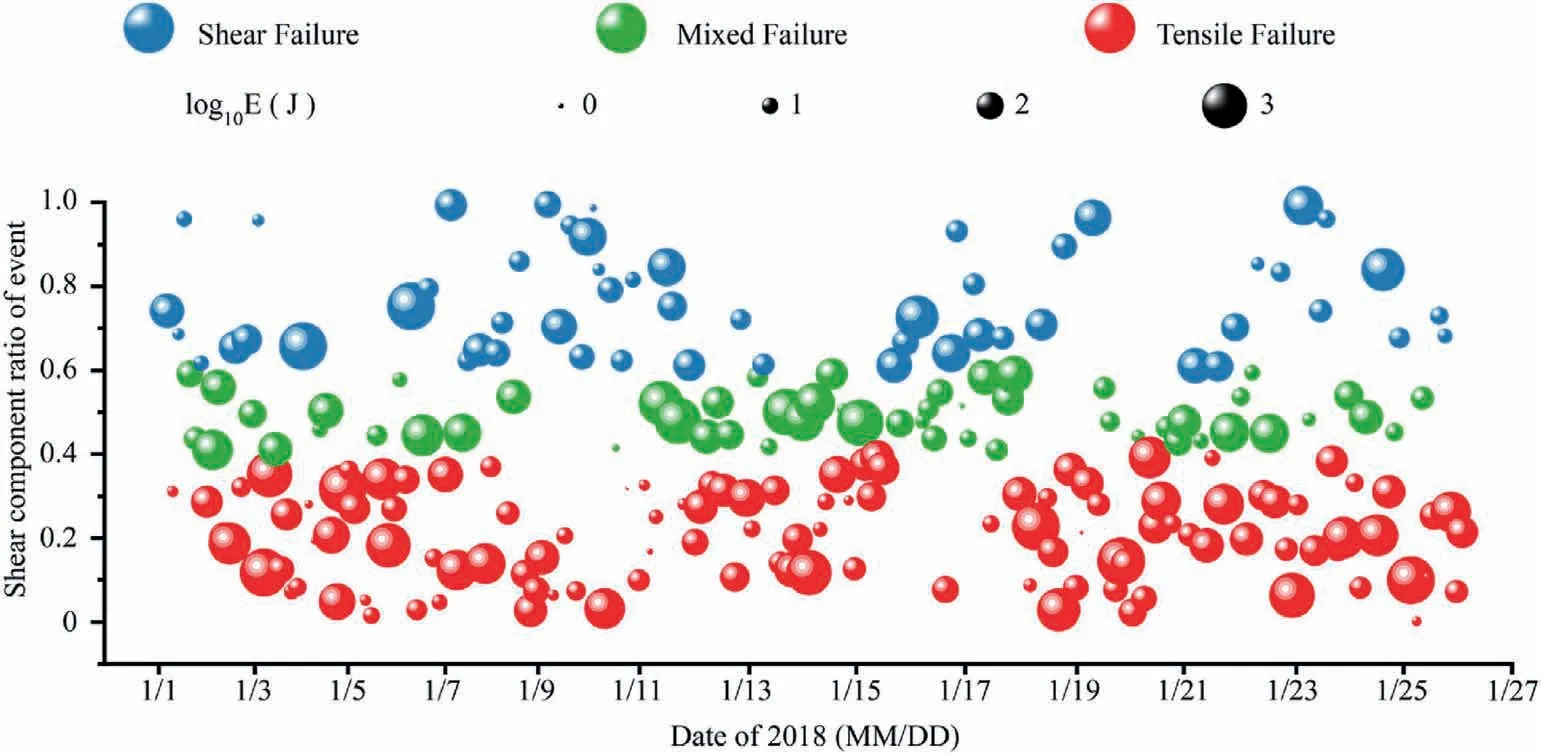
Fig.7.Shear ratio of MS events during the study period.
Many scholars have introduced graphical representations to visualize the moment tensor inversion results(Hudson et al.,1989;Riedesel and Jordan, 1989; Tape and Tape, 2012), including the Hudson plot and the beach ball plot.In this paper, the beach ball plot was employed to represent the moment tensor results, as shown in Fig.6.
He cleared his throat—he could hardly breathe—and held up the terry cloth robe, but the clerk behind the counter was laughing, telling a joke, and she did not notice him. When he cleared his throat again she glanced at him, annoyed, then nodded at her customer, now holding three thin packages of stockings like giant playing cards in her hand.
4.3.The source fracture mechanism
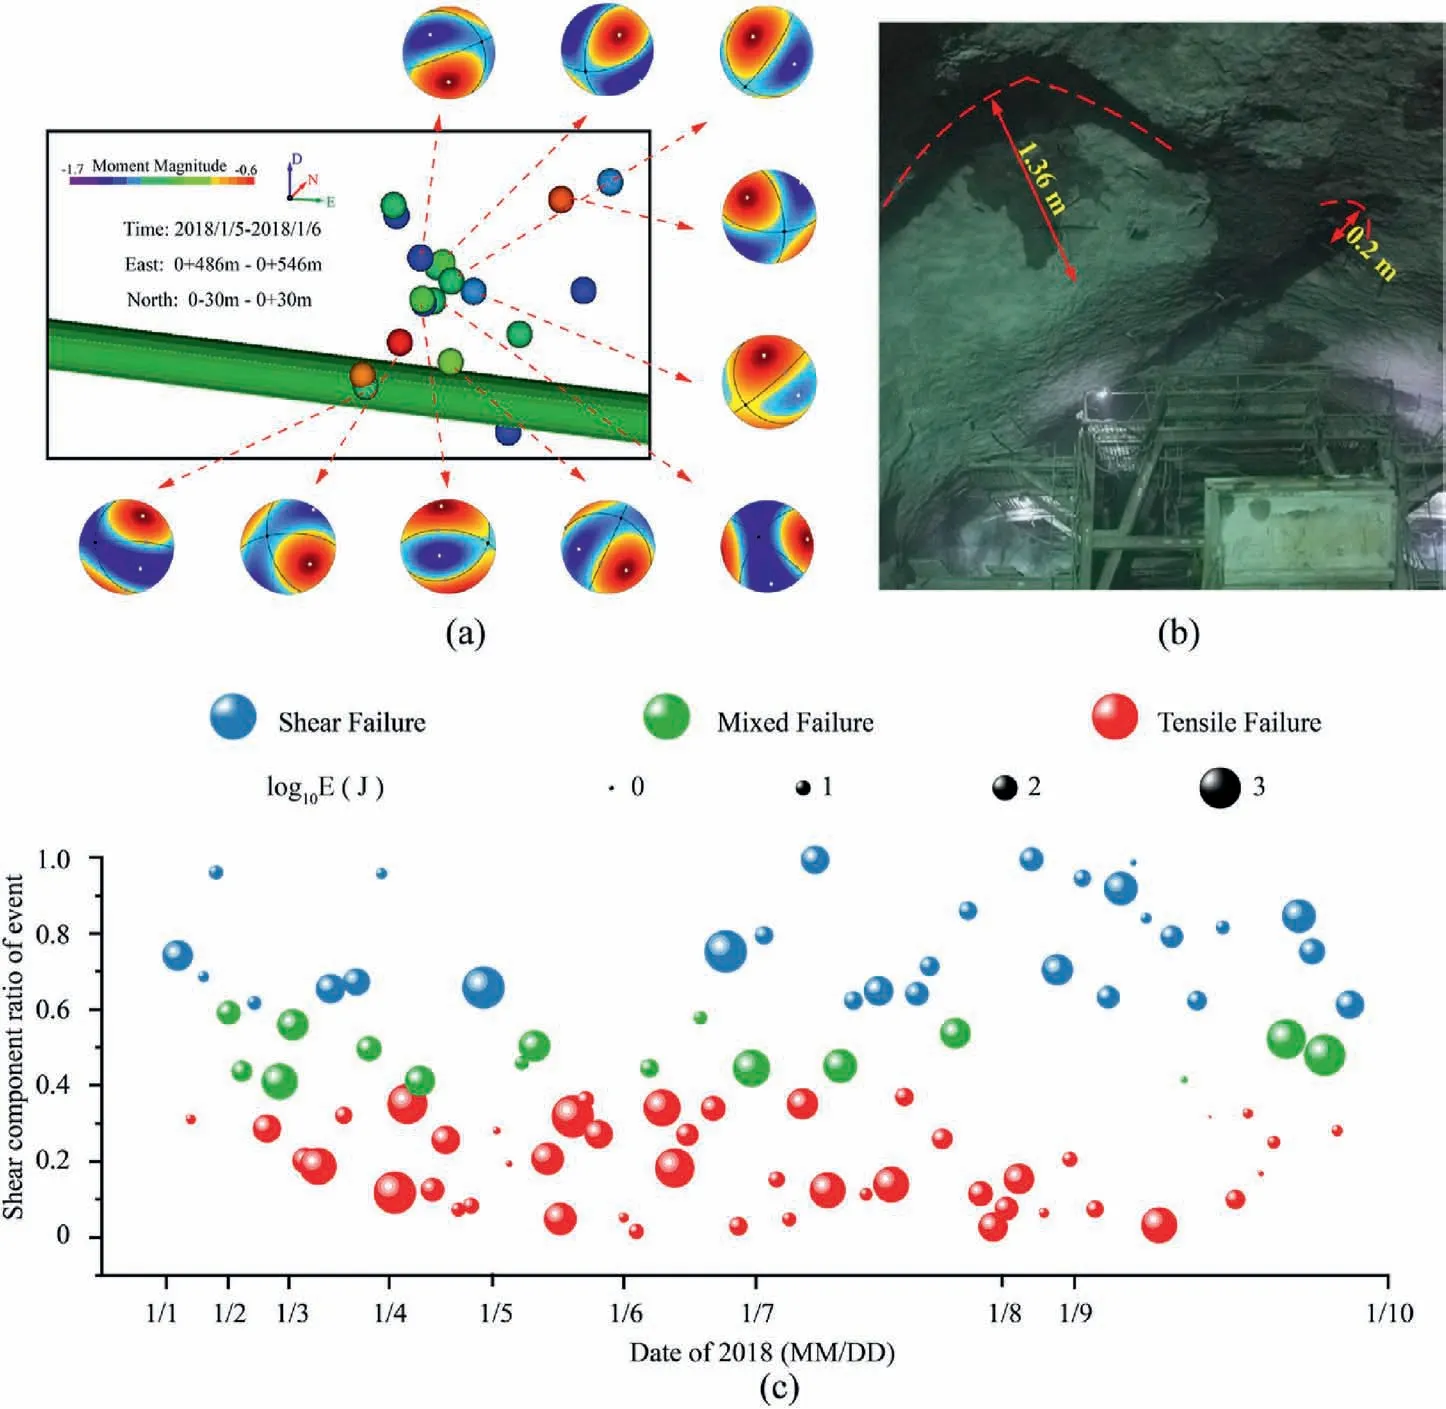
Fig.8.Moment tensor inversion results during period I:(a)Moment tensor results for large-magnitude events on the day of rockburst,(b)Photo of the rockburst on January 6(Xue et al., 2020a), and (c) Shear component ratio.
In this section,a total of 241 MS events data obtained from the access tunnel from January 1 to 25,2018,were chosen for analysis of the MS source parameters.The moment tensor parameters of each MS event were derived using the moment tensor decomposition and parameter solution methods described in Sections 4.1 and 4.2.The results of the moment tensor inversion were then expressed as beach ball plots to reveal the mechanism of rockbursts based on the ratio of moment tensor components.
When he tried to follow her through aisles25 dense17 with racks of slips and brassieres and panties, all glimmering softly, a sales clerk in a navy blue dress with a white collar stopped him, smiling, to ask if she could help
My family had come here from Poland specifically so that I could get treatment, because my country didn t have the technology to help me. I missed some school, especially second grade, for a series of surgeries at the Los Angeles Shriners Hospital to lengthen4 my forearms. I had to work hard to keep up academically. Luckily, my parents were always there for me. They d go with me and talk to the counselors5, about what I needed. They d carry my books for me.
A total of 11 rockbursts occurred during the study period, and they were concentrated in four periods,i.e.January 1 to 9(period I),January 10 to 16(period II),January 17 to 21(period III),and January 22 to 25 (period IV).Figs.8-11 show the results of the moment tensor inversion for the large-magnitude events in the four time periods and the variation regularity of the shear ratio in the days leading up to and following the rockburst.It can be seen from the site survey and the failure shown in Figs.8b, 9b and 10b and 11b that the failure area is relatively large, and a small number of structural planes control the boundary of the crater, which is a typical strain-structure rockburst (Feng et al., 2019).
Fig.8a shows the moment tensor inversion results during period I.Three rockbursts occurred during this period, two on January 5 and one on January 6,as shown in Fig.8b.It is clear from Fig.8c that before the first rockburst that occurred on January 5,tensile failure was more prevalent and was accompanied by shear failure and mixed failure.The ratio of shear failure and mixed failure decreased dramatically after the rockburst.Tensile failure events accounted for more than 70%of the total failures on January 5 and January 6,and the majority of these were high-energy events.After January 6,the tensile failure events gradually decreased, and the percentage of shear failure events gradually increased.
Fig.9a shows the moment tensor inversion results during period II.Four rockbursts occurred during this period, two on January 13 and two on January 14.The failure characteristics of the surrounding rock on site after rockburst are shown in Fig.9b,and the depth of the rockburst failure reached 1.8 m.Fig.9c shows that the shear component ratio of MS events changed more slowly throughout this time and that tensile failure and mixed failure of the surrounding rock were the primary failure modes preceding the rockburst on January 13.On January 13 and 14,there were no shear failure events.Rather,mixed failure and tensile failure events were most prominent, although there were somewhat more tensile failure events.However, there was a considerable increase in the energy of MS events, followed by a steady decrease in energy, a progressive decline in the ratio of tensile failure and mixed failure,and an increase in the number of shear failure events.
The boy jerked about and then made a sound that I will never forget for as long as I live. It was the sound like a whale makes when it has been harpooned1 and knows that it is about to die. I fired all four of my arrows at the two bullies2 as they ran away laughing about what they had done.
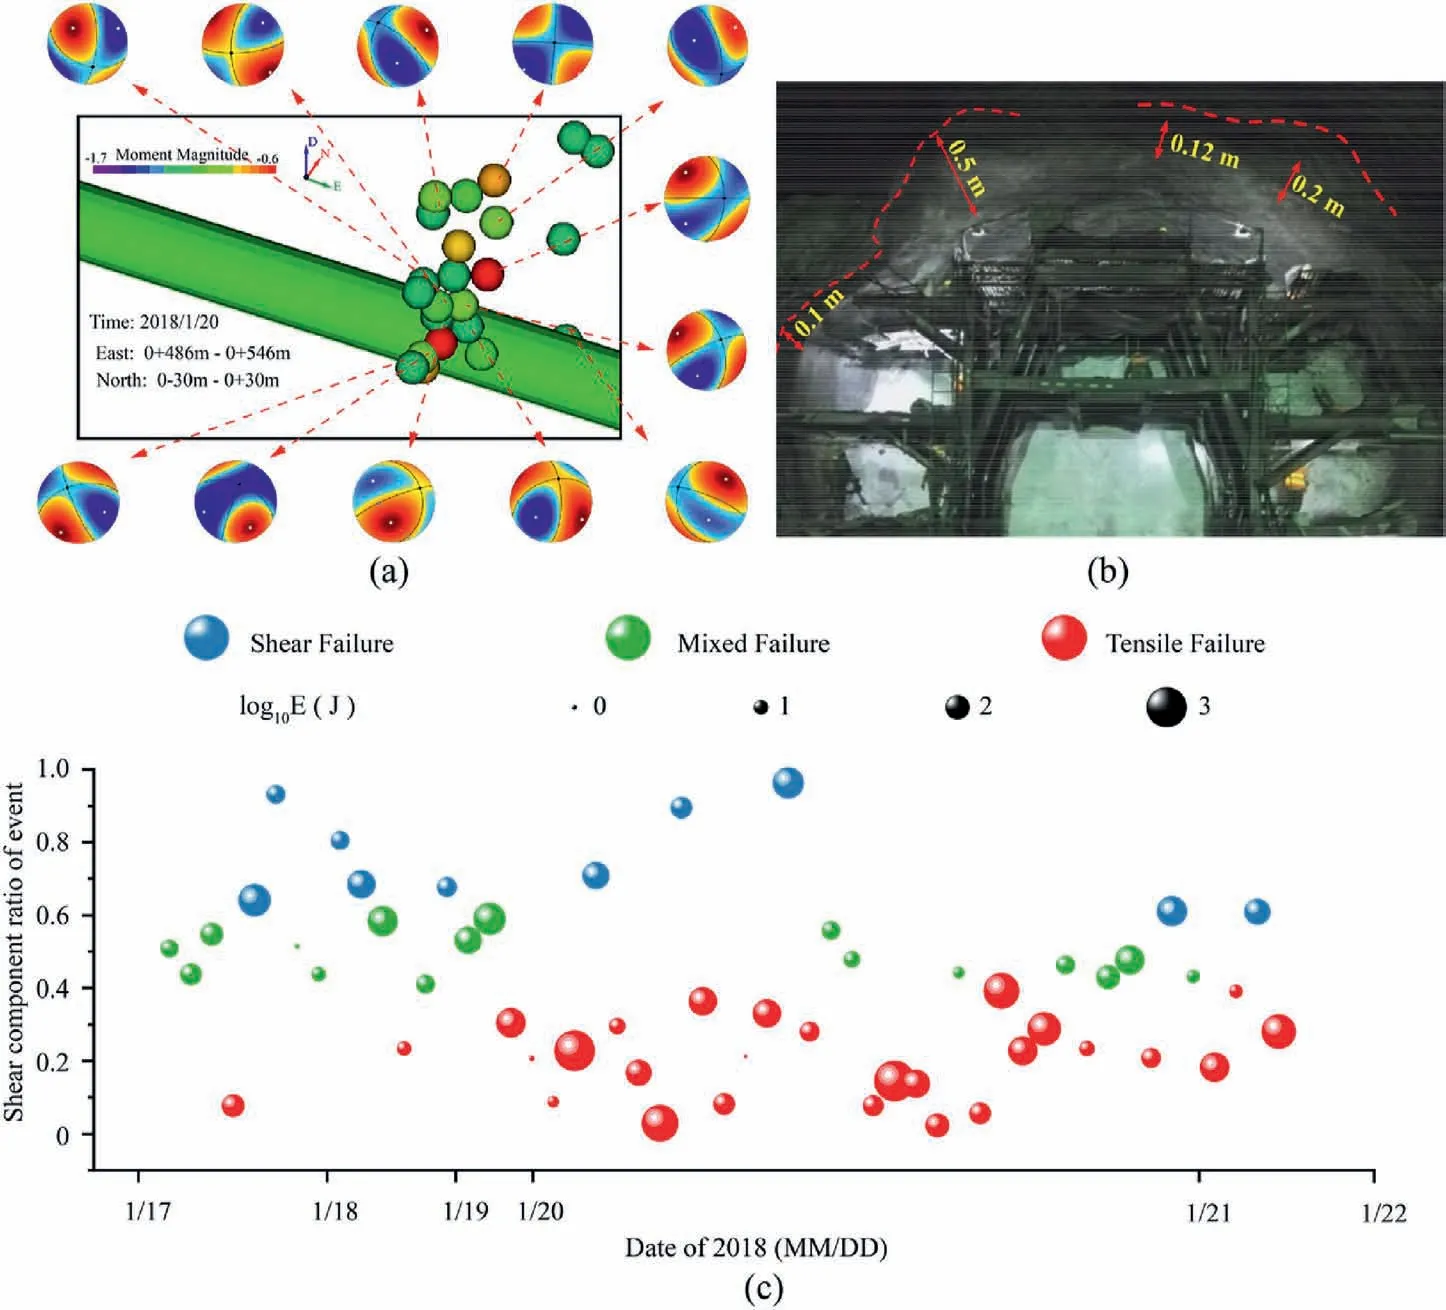
Fig.10.Moment tensor inversion results for period III:(a)moment tensor results for large-magnitude events on the day of rockburst,(b)photo of the rockburst(Xue et al.,2020a),and (c) shear component ratio.
Fig.10a shows the moment tensor inversion results during period III.Only one rockburst occurred in this period on January 20,and the damage to the surrounding rock caused by the rockburst is shown in Fig.10b.Fig.10c shows that the change in the shear component ratio of MS events in period III is similar to that in period I.Before the rockburst that occurred on January 20, there were three failure modes coexisting in the surrounding rock:shear failure, tensile failure and mixed failure.On January 20, the day of the rockburst,the number of MS events and MS energy showed an increase, while the ratio of the shear and mixed failure decreased drastically.This failure mode gradually evolved into one that was primarily a tensile failure with traces of shear and mixed failure.The energy of the MS event steadily decreased after the rockburst,and the three failure modes coexisted instead of the tensile failure made being dominant.
Fig.11a shows the moment tensor inversion results during period IV.Three rockbursts occurred during this time, one on January 24 and two on January 25.The surrounding rock mass damaged by the rockburst was reinforced on site, as shown in Fig.11b.From Fig.11c, tensile failure dominated the failure modes in period IV.However, the three failure modes, i.e.shear failure,tensile failure,and mixed failure,coexisted in the surrounding rock before the rockburst occurred on January 24.On January 24 and 25,shear failure steadily diminished, as tensile failure became the predominant mode along, though shear failure remained, and MS energy increased.
Analysis of the moment tensor results of the MS events preceding and following rockburst occurrence during the aforementioned four periods revealed that multiple failure modes coexisted before the rockbursts (tensile failure predominated over shear failure and mixed failure); the day of the rockburst was characterized by a sharp decline in the ratio of shear failure and an increase in tensile failure; and tensile failure gradually evolved to allow for the coexistence of multiple failure modes after the rockburst.The tunnel was excavated during the study period and small structural planes were exposed, which are typical features of strain-structure rockbursts caused by the combined effect of strain and structural planes.The rock fractures in strain-structure rockbursts in the access tunnel showed shear failure occurred first,followed by tensile failure.
5.The DBN-based rockburst warning
5.1.DBN parameter selection and data description
5.1.1.DBN parameter input
This has become such a habit with me that I don t think I could break myself of it; and, of course, if I got rid of the guitar I could never bring her back to life again
MS monitoring technology allows for the detection of microfractures before large areas of rock destabilize, which offers a distinct advantage over traditional monitoring methods.It can effectively guide site construction when combined with appropriate analysis.In this study,the MS source parameters obtained by the MS monitoring system were entered for the DBN.The source parameters of the MS events specify various mechanical details of the evolution of rock fractures.For example, MS energy indicates stress release, the moment magnitude indicates inelastic deformation, and dynamic stress drop indicates stress adjustment.The mechanical effect of the rock mass can be measured using the source radius in the tensor form in addition to the scalar form of the source parameters.Therefore,five parameters were entered for the DBN:moment magnitude, seismic energy, source radius, apparent stress, and dynamic stress drop.
5.1.2.Description of the database
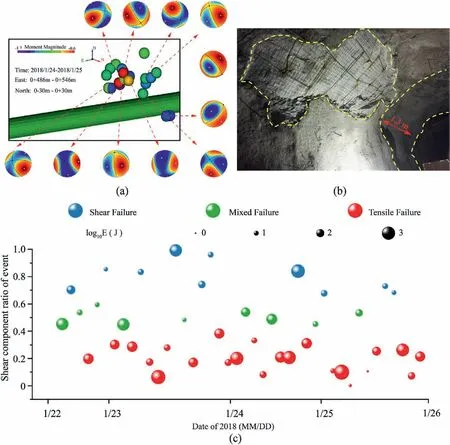
Fig.11.Moment tensor inversion results during period IV:(a)Moment tensor results for large-magnitude events on the day of the rockburst,(b)Photo of the rockburst on January 24 and 25 (Liang et al., 2020c), and (c) Shear component ratio.
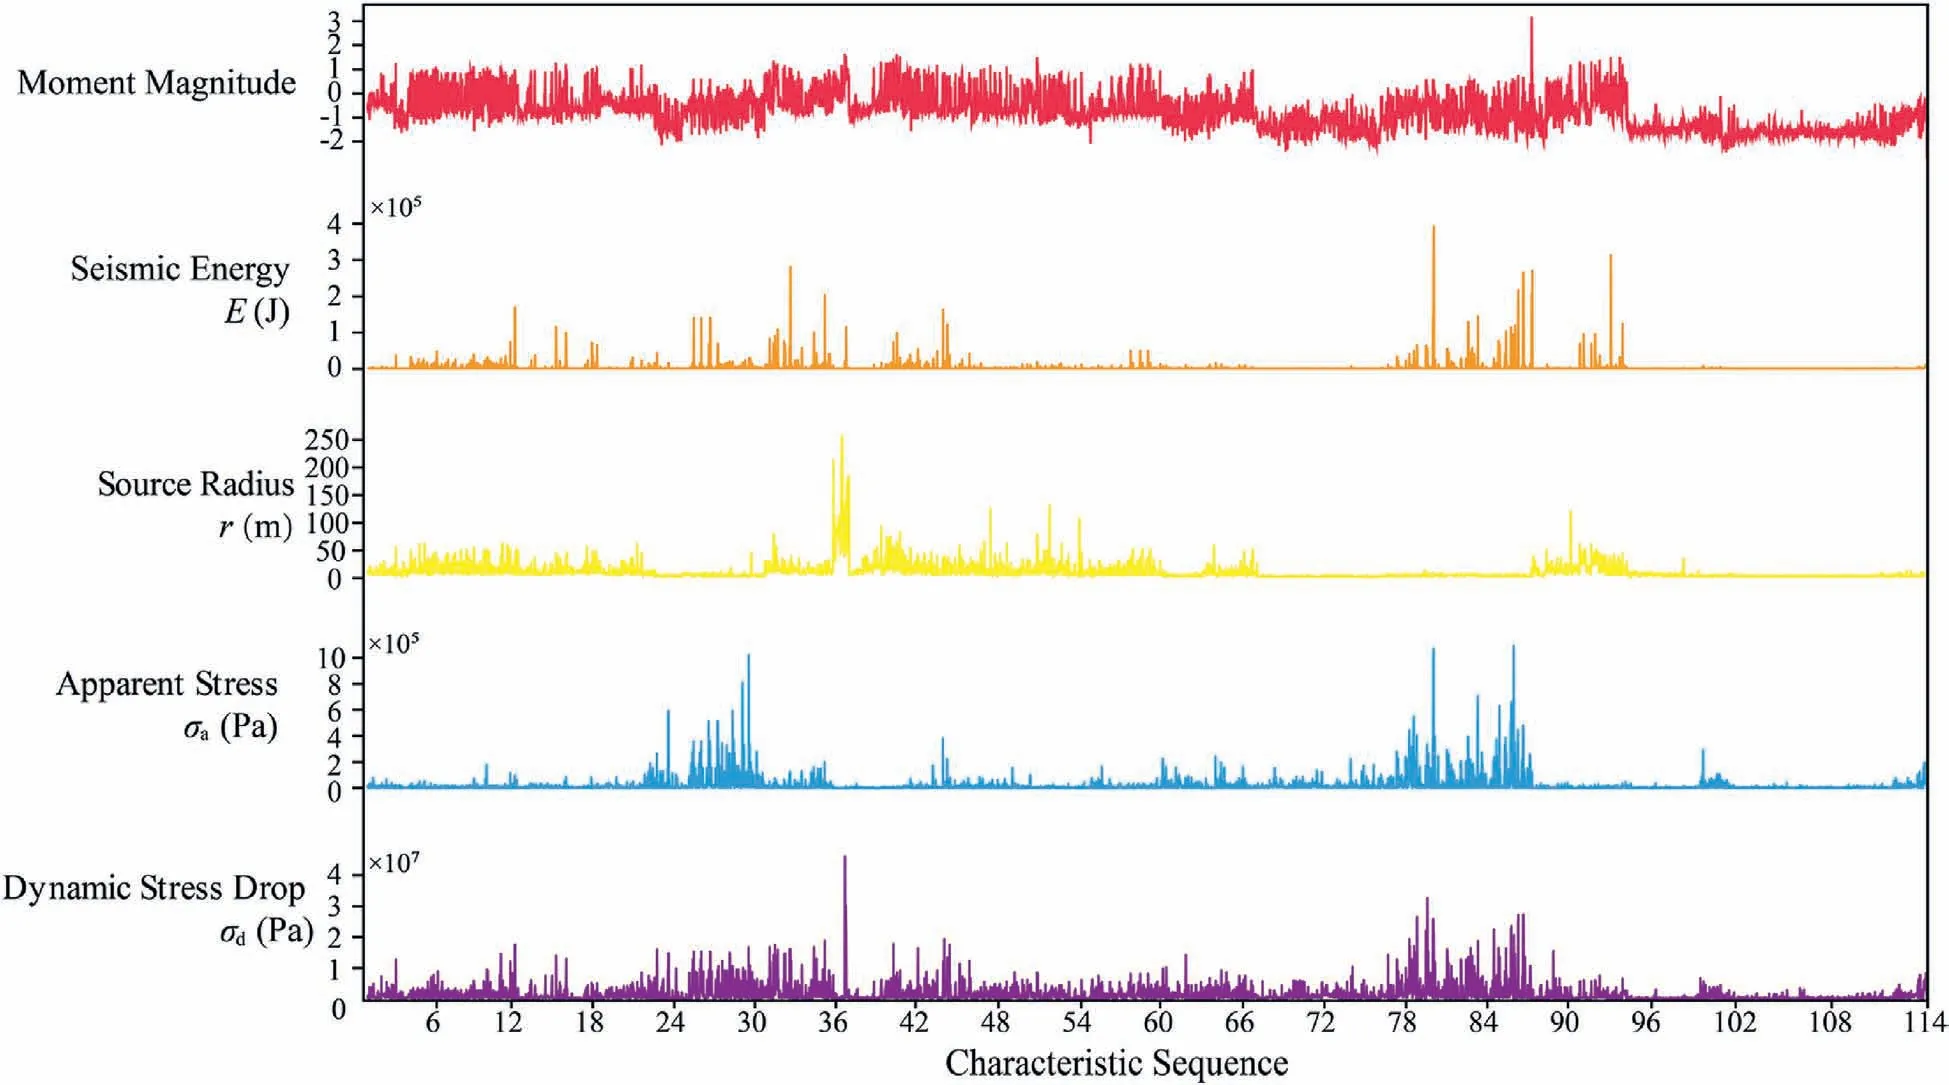
Fig.12.Multivariate source CSs before a rockburst.
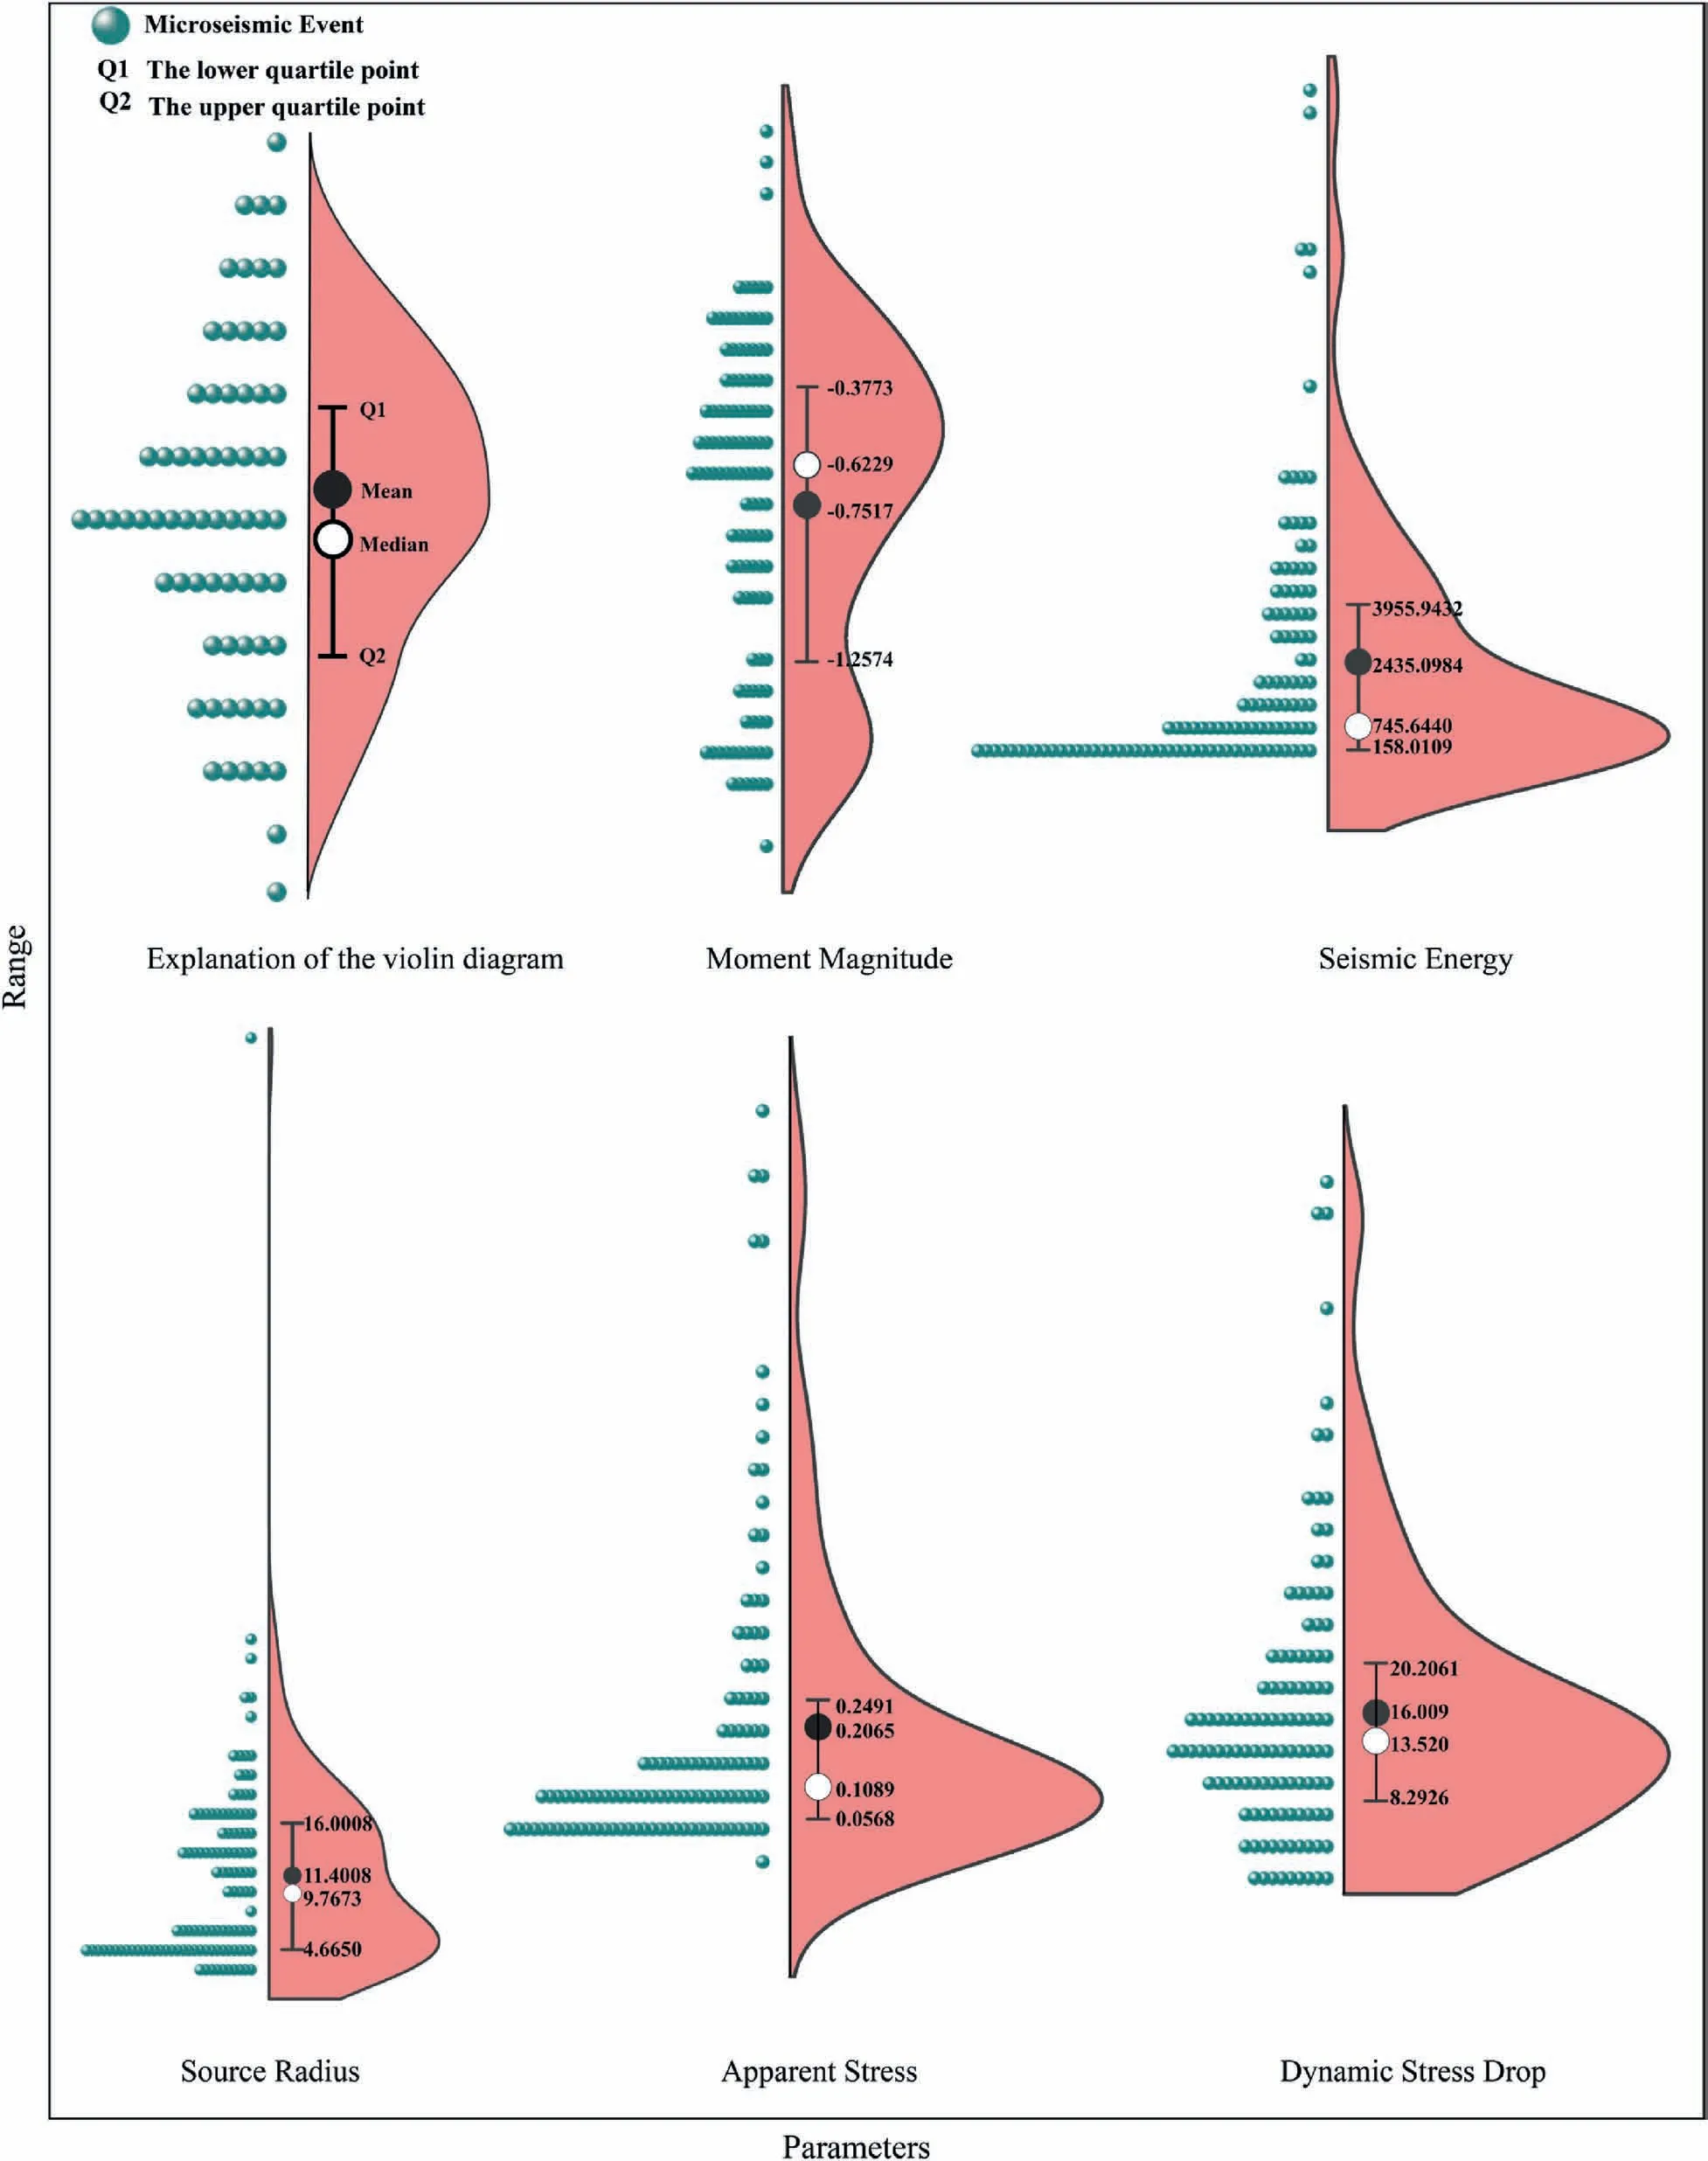
Fig.13.Violin-shaped distribution of source parameters.
The rockburst database was primarily derived from the access tunnel of the Shuangjiangkou hydropower station.The source parameter data were preprocessed for MS monitoring.First,all data of the required five parameters were selected.Second,the time of a rockburst was identified and 50 consecutive MS events occurring 3 h before that time were chosen.For example, if a rockburst occurred at 23:20,the parameters for the 50 consecutive MS events occurring before 20:20 would be chosen.Each parameter can form a time series segment, or characteristic sequence (CS), before the occurrence of each rockburst.These CSs were obtained from the MS monitoring system, minimizing the need for empirical judgement in manual data processing.A total of 83 rockburst events and 31 nonrockburst events were chosen out of consideration for the complex MS monitoring environment and due to substantial data corruption.Figs.12 and 13 show the 114 CSs of the five parameters and the violin-shaped distribution of each parameter.
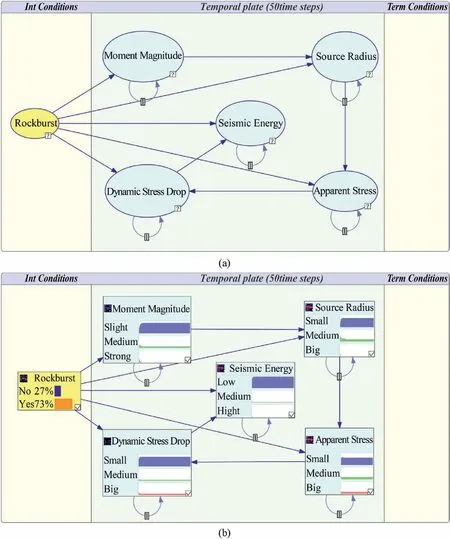
Fig.14.Rockburst early-warning model based on DBN: (a) Structure of DBN warning model, and (b) Results of the DBN model.
5.2.DBN-based rockburst warning model
5.2.1.DBN training
The goal of training a DBN model from data is to determine the most accurate representation of the unknown probability distribution underlying the time component using a random sample with a finite size (i.e.the learning data).The model was evaluated by scoring criteria.Let D = {D1,D2,…,DS} indicate the learning data, which consists of S independent and uniformly distributed time series.Each DSwas assigned a value X0,…,XTsfor random variables.The Bayesian scoring criterion is probably the most used.Given learning data D,the value of the scoring criterion for Model G was defined as follows (Pena et al., 2005):
Typically, P(G) is thought to be homogeneous for the sake of simplicity.Therefore, the Bayesian scoring criterion is equal to log10P(D|G).The probability that G has produced D is therefore scored by the scoring criterion.The scoring criterion can also be understood as follows considering the chain rule of probability(Pena et al., 2005):
The MS monitoring system of the access tunnel captured a total of 241 valid MS events from January 1 to January 25,2018,with an average of 9 events per day.This high frequency of MS events indicates frequent microfractures inside the surrounding rock.Fig.4 shows the temporal distribution of MS events and the energy released.Overall, the number of MS events increased progressively from the beginning of January, peaking on January 9,after which they began to occur less frequently.On January 20,the number of MS event increased sharply to 34, then decreased to 4 the following day, before rising again.Specifically, rockbursts mostly occurred on January 5 and 6 (period I), January 13 and 14(period II), January 9 (period III), and January 24 and 25 (period IV), all of which were preceded by precursor data.Before a rockburst occurred in period I, there was an increase in MS events;in period II,there was a rise in MS events and a significant increase in the energy released.In particular, the MS energy released on January 13 exceeded 8000 J, accounting for more than 30% of the total energy for the entire study period.Before the occurrence of a rockburst in period III, the number of MS events rose sharply,peaking at 34 on January 20.Prior to rockburst occurrence in period IV, both the number and energy of MS events showed an increasing trend, with the energy increase being especially pronounced.According to a comprehensive analysis, the rise in MS events and the increase in MS energy are crucial rockburst precursors.Additionally, there is a “quiet period” with fewer MS events or less MS energy released before the occurrence of rockbursts.Fig.5 shows the spatial distribution of MS events.MS events gradually cluster around the tunnel face in the vertical view as the access tunnel is continuously excavated (from left to right), and their spatial distribution is asymmetrical.From the front view, the left sidewall of the access tunnel has experienced more MS events than its right side.This shows that excavation and unloading activities have caused continuous microfractures to develop and penetrate in the surrounding rock on the left side and that the surrounding rock suffers from poor stability since MS events are frequent and intenser at this time.
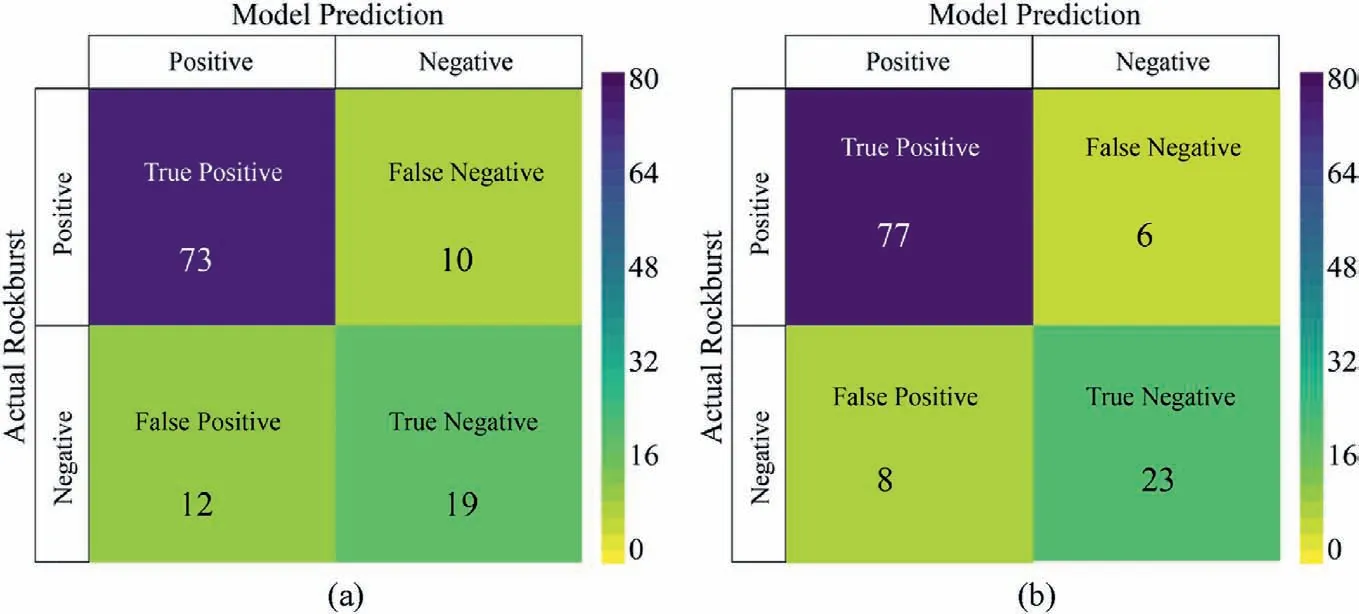
Fig.15.Confusion matrix of the DBN model: (a) Self-validation, and (b) 6-fold cross-validation.
GeNIe software was used to establish the DBN structure for this paper,and Fig.14a shows the finished DBN structure.The Rockburst node is the only parent node of the remaining five nodes in the DBN model,which are connected by directed arrows.The arc and value under each node show the correlation between the node and itself as well as the number of intervals between the node and itself,respectively.Since the MS monitoring system can collect data in real time, the collected data are all temporally correlated.If the interval between nodes and themselves is 1, it means that the parameters collected at adjacent moments are closely related.
The key point of building DBN model is parameter learning based on the fully understood DBN structure.The parameter learning process of the DBN model involves calculating the conditional probability distribution for each node in the network model under the guidance of the dataset and network structure.The maximum likelihood estimation (MLE, also known as expectation maximization or EM) and Bayesian estimation are the two most widely used parameter training algorithms.Such CSs represent incomplete data due to severe deviations during acquisition causing some data to be removed from the total collected by the MS system; therefore, in the case of incomplete observations, the EM algorithm was chosen because its parameter learning for incomplete data is more analytically accurate.The rockburst data were imported into GeNIe software, and the EM algorithm was chosen for parameter learning.
Fig.14b shows the conditional probability of various intervals indirectly under each parameter due to the massive amount of data after parameter learning.Although the five parameters chosen for this study were discretized, their value ranges were divided into three groups,each of which has a color to indicate the conditional probability value.For instance, the values of moment magnitude were divided into slight,medium and strong,and their conditional probability values are represented in purple, green and pink,respectively.These values were generated by a smooth histogram that combined the conditional probability values of their 50 consecutive moment states.
5.2.2.DBN inference
Fig.7 shows the shear component ratio of MS events from January 1 to 25, 2018.The shear component ratio was not distributed uniformly throughout the study period and exhibited large fluctuations.Overall, there were 124 MS events with a shear ratio less than 40%,accounting for 51.5%of all events,and 60 MS events with a shear ratio greater than 60%,accounting for 24.9%.Based on the shear ratio in Section 4.2,it was determined that the MS events during this period were dominated by tensile failure and accompanied by shear failure.
DBN inference is similar to computing and observing the impact of certain variables on the probability distribution of other variables.The fact that the posterior probability distribution and the evidence are both time-indexed adds another level of complexity.DBN inference,also known as belief updating(Korb and Nicholson,2010), is an analytical and computational process that aims at the posterior probability distribution of a given observation(evidence)after obtaining a CPT.Rockburst warning analysis aims to determine the posterior probability of a rockburst based on the given data.In the worst case, belief updating algorithms are nondeterministic polynomial time (NP) problems (Buntine, 1996).Pearl(1988) developed a simple method, often known as a messagepassing method, which focuses on updating the probability distribution of all nodes in a DBN with fewer observed values.However,several scholars have devised a powerful junction tree(JT)method,also known as the junction tree algorithm(Dawid,1992).First,this algorithm converts the DBN model into a tree model, where the"trunk" represents the parent node, the "branches" represent the directed arrows (arcs), and the "leaves" represent the child nodes.Finally, a flawless tree is shown to everyone after being pruned(probabilistic inference)using some mathematical properties(akin to a pair of "scissors").Therefore,the JT algorithm is a reliable and effective inference algorithm.
5.2.3.DBN model validation
With that, the man darted7 across the floor and out the door, leaving the lady in much bewilderment. He finally realized that he had already found his dream girl, and she was... the Vancouver girl all along! The drunken lady had said something that awoken him.
Following the learning of parameters,belief updates were carried out using the JT algorithm to obtain fresh data regarding the input vectors.Moreover,the trained DBN was used to test the learning of the risk of rockbursts,which is a self-validation process.MS events with a probability of occurrence of more than 50%were classified as rockbursts, and those with a chance of occurrence of less than 50%were classified as nonrockbursts.Fig.15a shows the self-validated confusion matrix for all 114 cases.False positives and false negatives are represented by the diagonal line on the opposite side of the main diagonal line, which reflects the number of accurate predictions.The accuracy here is 91.22%.K-fold cross-validation was employed to validate the model and check the accuracy of the DBN model.The learning database contains 114 cases, which can be randomly sorted into 6 sets.One was used as the test set, and the other five were used as the training set for DBN learning.Then,the probability of occurrence of rockbursts(belief updates)was analyzed in primary sets to compare the actual situation with the predicted results.Fig.15b shows the confusion matrix after 6-fold crossvalidation.When K-fold cross-validation was used in the original learning set,the accuracy dropped to 87.72%,which was considered acceptable in practical engineering.
Alas! yes, madam, she answered, and if you will but cure him, you may take me back to the farm, or bring the Green Giant to life again, and you shall see how obedient I will be
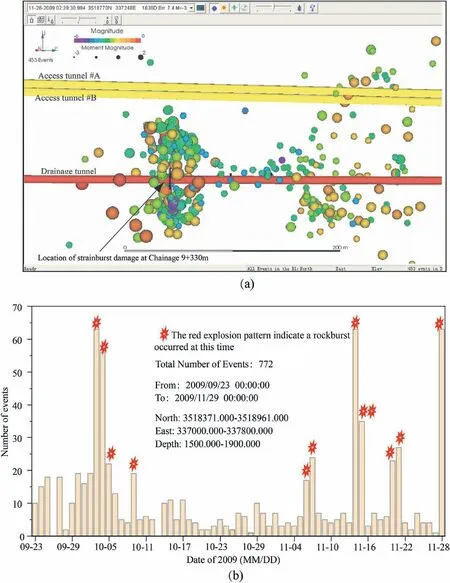
Fig.18.Spatial and temporal distribution of MS events during the excavation of the construction drainage tunnel(from September 23 to 28,2009):(a)The spatial distribution,and(b) Daily MS frequency and occurrence of rockbursts (reproduced from Xu et al.(2015a)).
The receiver operating characteristic(ROC)curve was also used as a data presentation to confirm the accuracy of the DBN structural model.The closer the area under the ROC curve(AUC)approaches 1,the better the model is.Fig.16 shows the ROC curves for selfvalidation and 6-fold cross-validation of the DBN model, and all the AUCs are close to 1, which means that the DBN model is acceptable.
Then the three Bears thought it necessary that they should make further search; so they went upstairs into their bed-chamber.19 Now Goldilocks had pulled the pillow of the Great, Huge Bear out of its place.
The access tunnel is located on the left bank and measures 1473.31 m in length, 2253 m at its deepest point, and 11.24 m in width by 8.7 m in height.Fig.2 shows the geological profile of the tunnel.According to China’s engineering rock classification standard, the surrounding rock is mostly class IIIa, and the tunnel surrounding rock is generally stable.With a maximum vertical burial depth of 600 m, the deep tunnel section is subject to high ground stresses.The maximum principal stress σ1is high and ranges from 15.98 MPa to 37.82 MPa, according to ground stress measurement data from the adit SPD9(a tunnel constructed for exploration before the construction of the underground caverns, with an elevation of 2267.6 m at the entrance).At horizontal depths ranging from 100 m to 400 m, the maximum principal stress increases and reaches 37.82 MPa at 400 m, along with rising ground stresses.At depths greater than 400 m, the maximum principal stress is between 20 MPa and 30 MPa,along with relatively stable ground stresses.
5.3.Case studies
For this study,the MS events that occurred in the access tunnel from January 1 to 25, 2018, were chosen.A total of 11 rockbursts were observed in this period,and Figs.4 and 5 show the spatial and temporal distribution of daily MS events during this period.
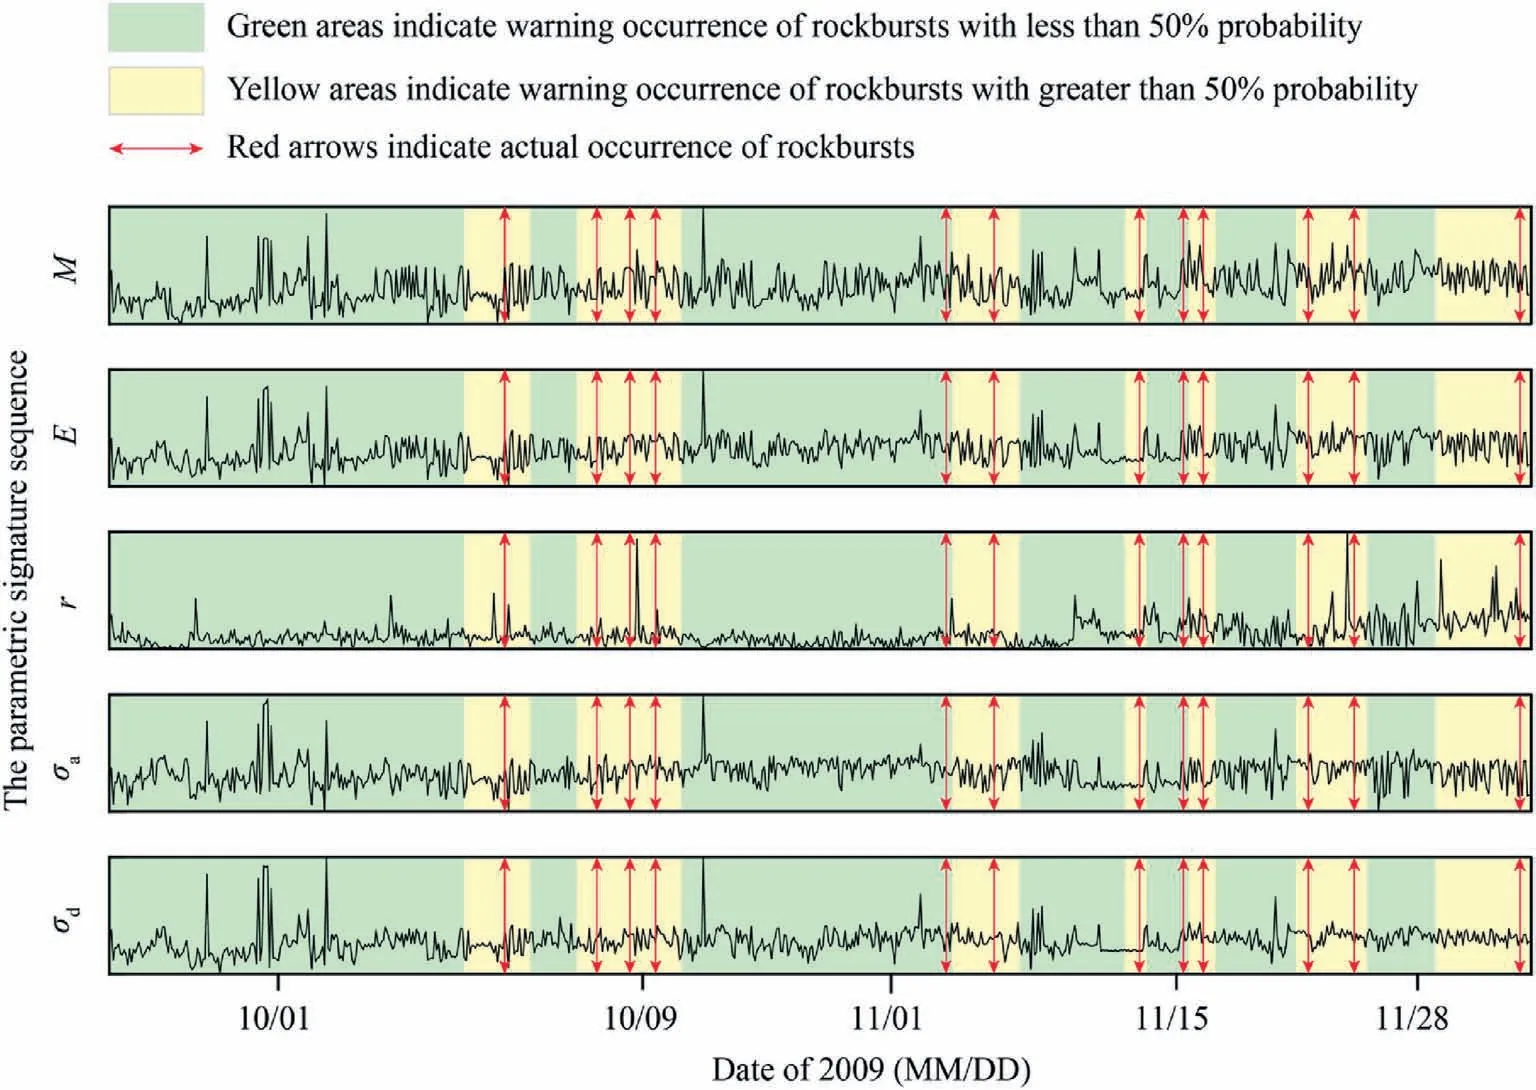
Fig.19.Comparison between rockburst warning results and actual situation for the construction drainage tunnel (from September 23 to November 28, 2009).
Fig.17 shows the results of the rockburst warning analysis on the access tunnel.The warning model can perform warning analysis whenever an MS event is generated, thus the warning results are synchronized with the generated MS events and are presented in the form of segments.In Fig.17,the yellow area indicates a high probability of rockbursts (greater than 50%), the green area indicates a low probability of rockbursts (less than or equal to 50%),and the two-way red arrows indicate the moment of the rockburst.Fig.17 shows that the warning results are acceptable, with an accuracy of 81.82%(9/11).The warning model failed to give a warning for the first rockburst that occurred on January 5 but gave a helpful warning for the second rockburst less than 1 h later.Two rockbursts occurred on January 13, 2018, and the warning model successfully gave a warning for the first one but failed to give a warning for the second one.These two rockbursts occurred within a short period,and fewer MS events occurred during this period,leading to the low accuracy of the warning model.For the two rockbursts on January 13,there were only 7 MS events in total.Additionally,the number of MS events on the previous days was also relatively low and had low moment magnitudes,except for the individual MS events with high seismic energy.However, the warning model provided useful warnings for the rockbursts that occurred on February 24 and 25.
Analysis of the rock fracture mechanism is a significant area of research in the field of rock mechanics.A thorough comprehension of the physical properties of the surrounding rock during continuous excavation and unloading is essential to ensuring project safety.Only with a thorough understanding of the formation mechanism of rock microfractures and the corresponding form of support can we prevent the occurrence of rockbursts and other disasters.
The CSs of the MS event parameters collected by the MS monitoring system of the construction drainage tunnel were imported into the warning model,and Fig.19 shows the results of the rockburst warning analysis.The horizontal coordinates show the number of MS events generated in chronological order, and the vertical coordinates show five different MS source parameters,which are the moment magnitude, seismic energy, source radius,apparent stress, and dynamic stress drop.The warning result is good, with an accuracy of up to 83.33% (10/12).No warning was given for the two rockbursts that occurred on November 4 and 15,2009.Before the sudden occurrence of the rockburst on October 4,the number of MS events was low for several consecutive days,and the MS activity was minimal for an extended period.Considering that the learning set of the model is deviated from the CS parameters of a few actual rockbursts,this may could cause the model to be less sensitive to the identification of rockbursts.There were two minor rockbursts on November 15.The model failed to identify the valid characteristic information of the first one but gave a valid warning for the second one.Despite its flaws, the model provided excellent warning assessments for the two extremely powerful rockbursts that occurred on October 9 and November 28, 2009.
The actual studies of the two projects mentioned above showed that the warning model is not flawless.It struggles to detect rockbursts that follow a lengthy period of minimal MS activity.The warning capability of the model declines, and the recognition of minor rockbursts is likewise impeded when two rockbursts occur in close succession and there are few MS events in the time surrounding the events.Future work will therefore concentrate on optimizing the warning model and enhancing its capability to provide warnings for rockbursts in a range of contexts.
6.Conclusions
The spatial and temporal distribution characteristics of MS events in the access tunnel of the Shuangjiangkou hydropower station were analyzed.Based on surrounding rock mass rupture signals captured by MS monitoring, moment tensor inversion analysis was carried out to reveal the mechanism of rockbursts.The DBN theory was adopted to investigate rockburst warning and a DBN-based rockburst warning model was put forward.The following conclusions can be drawn:
(1) Moment tensor inversion analysis of the seismic sources that occurred in the study area was performed, and the failure type was defined by the shear component ratio.The observed mechanism of rock mass fracture during the rockburst formation processes is as follows:multiple failure types coexisted before the rockburst occurred.When rockburst occurred, the shear failure ratio dropped sharply and the tensile failure ratio increased.After the rockburst occurred,it gradually evolved into multiple failure types.
In Robin McKinley s novelization of the story, Deerskin confronts her father at his wedding ceremony to a young princess, exposing his crime of rape86 against her.Return to place in story.
The family grew up, and before too many years had passed, the grandchildren came to visit. Grandma and Grandpa still planted their garden every spring. Everyone still enjoyed the good food from the garden and always took some home.
(2) A DBN-based rockburst warning model was proposed.Considering each source parameter with temporal properties,DBN theory was applied.A total of 114 sets of historical rockburst data were imported into the network warning model for parameter learning.The trained DBN model was proven to be effective through self-validation, 6-fold crossvalidation, and ROC curve analysis using the original data.The strength of the influence of parent-child nodes was analyzed to reveal that the moment magnitude and the source radius were the key factors affecting rockbursts.
In a preface to a later collection of his tales, Andersen explained that The Emperor s New Clothes, published in 1837, is of Spanish origin. He went on to say, We owe the amusing idea to Prince Don Manuel, who was born in the late thirteenth century. Andersen also pointed out that Cervantes used the idea in an entr acte. But if the idea of The Emperor s New Clothes was centuries old, it did not become international shorthand for all sorts of conformist behavior until Andersen wrote it his way (Frank and Frank 105).
(3) The rockburst warning model based on the DBN was adopted for two projects.The rockburst warning accuracies reached 81.82% and 83.33%, respectively.It validates that the proposed rockburst warning model is effective and feasible,and could provide some references for similar underground projects with high rockburst frequency.
Declaration of competing interest
The authors declare that they have no known competing financial interests or personal relationships that could have appeared to influence the work reported in this paper.
Acknowledgments
We acknowledge the funding support from the National Natural Science Foundation of China (Grant No.42177143 and 51809221)and the Science Foundation for Distinguished Young Scholars of Sichuan Province, China (Grant No.2020JDJQ0011).The authors would like to thank our colleagues at the Shuangjiangkou hydropower station for their valuable contributions to the project.
 Journal of Rock Mechanics and Geotechnical Engineering2023年10期
- Journal of Rock Mechanics and Geotechnical Engineering的其它文章
- A true triaxial strength criterion for rocks by gene expression programming
- Key issues in water sealing performance of underground oil storage caverns: Advances and perspectives
- Wetting-drying-freezing-thawing cycle effect on the hydro-mechanical behaviour of Yanji swelling mudstone
- Capability of discrete element method to investigate the macro-micro mechanical behaviours of granular soils considering different stress conditions and morphological gene mutation
- Permeability evolution mechanism and the optimum permeability determination of uranium leaching from low-permeability sandstone treated with low-frequency vibration
- Numerical analysis of bending property of bi-modulus materials and a new method for measurement of tensile elastic modulus
