Effect of heterogeneity on mechanical and micro-seismic behaviors of sandstone subjected to multi-level cyclic loading: A discrete element method investigation
Zhengyang Song, Zhen Yang, Min Zhang, Fei Wang, Martin Herst,Heinz Konietzky
a Joint National-Local Engineering Research Centre for Safe and Precise Coal Mining, Anhui University of Science and Technology, Huainan, 232000, China
b Department of Civil Engineering, University of Science and Technology Beijing, Beijing,100083, China
c Geotechnical Institute, TU Bergakademie Freiberg, Freiberg, 09599, Germany
d Key Laboratory of Ministry of Education on Safe Mining of Deep Metal Mines, Northeastern University, Shenyang,110819, China
Keywords:
ABSTRACT In numerical simulation of the mechanical responses and acoustic emission (AE) characteristics of rocks under cyclic loading, the impacts of compositional heterogeneities of mineral grains have barely been considered.This will lead to a poor reproduction of rock’s behaviors in terms of stress-strain relationship and micro-seismic characteristics in numerical simulation.This work aims to analyze and reveal the impact of parameter heterogeneity on the rock’s fatigue and micro-seismic properties based on PFC3D.Two distribution patterns (uniform and Weibull distributions), are implemented to assign four critical parameters (i.e.tensile strength, cohesion, parallel bond stiffness and linear stiffness) for 32 sets of numerical schemes.The results show that the models with high heterogeneity of tensile strength and cohesion can better reproduce the stress-strain relationship as well as the patterns of cumulative AE counts and energy magnitude.The evolution of the proportion of three-level AE events in the laboratory test is consistent with the numerical results when the highly heterogeneous tensile strength and cohesion are distributed.The numerical results can provide practical guidance to the PFC-based modeling of rock heterogeneity when exposed to multi-level cyclic loading and AE monitoring.
1.Introduction
At present, the numerical modeling is an efficient and laborsaving approach extensively utilized to simulate the mechanical responses of various materials.In terms of simulation of brittle materials, the commonly used numerical methods include finite element method (FEM), boundary element method (BEM), finite difference method (FDM), and discrete element method (DEM)(Brady and Lorig, 1988; Beer and Poulsen, 1994; Alehossein and Poulsen, 2010; Stahl et al., 2014; Park and Min, 2015; Li, 2017; Liu et al., 2022).With several decades of development since its proposal by Cundall and Strack(1979),the DEM,which is also termed mesh-less model, has been successfully applied to numerically reproducing the mechanical behaviors of different geomaterials,e.g.soil,rock,mortar,pebble and ballast,when exposed to various types of loads (Groh et al., 2011; Stahl and Konietzky, 2011;Schöpfer and Childs, 2013; Stahl et al., 2014; Zhang et al., 2017;Shang et al., 2018).DEM employs the breaking of the connection(bond)between two contacted elements to mimic the micro-scale damage at grain-scale.This feature in simulation is in a high agreement with the realistic fracturing process occurring at grainscale observed under the scanning electron microscopy (Erarslan,2016; Cerfontaine and Collin, 2018).As one of the most widely used DEM codes,the particle flow code(PFC)is particle-based and has exhibited excellent performance in understanding various mechanical behaviors (e.g.micro-damage, stiffness decay and nonlinear deformation) of rocks (Potyondy and Cundall, 2004;Potyondy, 2007; Yoon, 2007; Song et al., 2019a).To assess the results of numerical simulation on rocks, the stress-strain relationship, fracturing process, and acoustic emission (AE) characteristics are the elementary properties which are of paramount importance to tackle and need to be well reproduced.Compared to the continuum method, PFC has the advantage of characterizing the randomly distributed or user-defined structure defects (e.g.voids,pores, microcracks and macro-joints) in rock mass by assigning different values of joint length, distribution density, orientation,and porosity.In linear parallel bond model(LPBM)of PFC,the bond constructed at each contact can resist the particle’s rotational and translational movements when the local stress is lower than the pre-set strength parameter which adheres to the linear Mohr-Coulomb failure criterion.This indicates that the bond can store certain amount of energy when the bonded state remains active.This part of energy will be removed with the breakage of bond and follows a similar physical mechanism with AE event in laboratory tests(Lockner,1993;Hazzard and Young,2002).Hence the cracking of a bond can be considered as an independent AE event in PFC and can thereby reveal the information of the location and level of the released bond energy (Song et al., 2019a, 2022).This optimally quantifies the magnitude of each AE event, which is similar to AE source location technique adopted in the laboratory test(Ohtsu and Ono,1988; Zhang et al.,2020; Kawasaki et al.,2021).
Normally, the complexity of a numerical model and the computation cost are mutually related and restricted.For example,for fixed-assembly geometry, the number of particles used is inversely proportional to the particle diameter, which means that the smaller the particle size, the more the local contacts and the number of bonds; the interactions of grains in small scale can be simulated in this case.Another factor that can directly impact the model complexity is the heterogeneity of parameters, which implies the assigned microparameters are within a user-defined range by following a specific distribution pattern(Liu et al.,2004)rather than fixed to a constant value in the homogeneous model.The heterogeneity can be applied to strength, stiffness, density and thermal parameters(Li et al.,2019;Wang et al.,2019).Fig.1a shows a microphotograph of sandstone in thin sections under crossed Nicols.Three types of minerals(i.e.quartz,muscovite and feldspar)are indicated.Fig.1b shows the Mohs hardness of 14 rock minerals(Schumann, 2000).It is evident that the hardness of the three minerals vary significantly, which is closely related to the stiffness of rock.This implies that the heterogeneity of stiffness, hardness and strength induced by the inhomogeneity in minerals composition should be considered in the numerical simulation of rock.
In recent decades,many researchers have conducted numerical simulation based on continuum methods (i.e.FDM, and material point method)and DEM model by reconstructing sample via X-ray computerized tomography (CT) technique.These methods can distinguish minerals with various microparameters, and exhibit excellent performances in simulation, especially when there are macro-inclusions (e.g.dirt band or associated mineral band) or aggregates in coal (Zhao et al., 2014, 2021) and concrete samples(Skar˙zyˊnski et al., 2015; Nitka and Tejchman, 2018; Homel et al.,2022; Suchorzewski and Nitka, 2022).The distribution of heterogeneous microparameters based on the grain types in DEM succeeds in reproducing the final failure pattern and cracking path along the boundaries of two mineral grains.The numerical reconstruction of brittle geomaterials implemented in PFC based on CT scanning can deliver a good result in property characterization.Nevertheless, CT scanning and image processing before numerical simulation are labor-intensive and time-consuming, which will greatly restrict the efficiency of numerical modeling.To balance the computation efficiency and mineral characterization, it is of great importance to develop a DEM model which could incorporate the heterogeneity of microparameters directly without CT scanning or minerals grouping.A plethora of recent articles document the research of applications of heterogeneous DEM models:Saadat and Taheri(2019)used the PFC to simulate the microcracking behaviors of Barre granite, the size distribution and constituent of mineral were incorporated in the heterogeneous model.The results show that the heterogeneous model can well reproduce the macrophysical properties and the associated microcracking features, e.g.the progressive development of the stress induced cracks.Bolander et al.(2021)reviewed the features of DEM applied to the modeling of mechanical behavior of concrete,and concluded that the discrete structure in DEM can exhibit stress variation which is regarded as spurious heterogeneity.Thoa and Meng-Chia (2021) utilized the DEM to study the impact of microparameters on the mechanical performance of gravelly soils.They indicated that the shear strength increases with the growth of both friction coefficient and effective modulus in PFC2D.Xue et al.(2020) used heterogeneous DEM model to reproduce the fracture patterns of concrete.The model was created with random distribution of aggregate structures.The results show that the aggregate parameter has a significant impact on the crack propagation pattern.Wu et al.(2021)established the DEM model with Weibull distribution to reveal the effect of model heterogeneity on mechanical properties of cemented sands.The DEM model with a higher heterogeneity index has a lower peak strength and stiffness.Zhou(2021)introduced the randomly placed weak bonds into the PFC to simulate the crushing of rockfill materials.The simulation results indicate that the model can deliver a good prediction on the Weibull’s modulus and size effect of rockfill particles.The above-mentioned literature mainly covers the heterogeneous DEM models of geomaterials exposed to the monotonic loading, however, the mechanical properties of geomaterials subjected to the cyclic stress and its associated AE behaviors are rarely reported up to now.Therefore,the primary motivation of the study is to develop a general heterogeneous model as an efficient numerical approach to achieve a robust and high reproducibility of the mechanical responses of natural rocks observed in multi-level cyclic tests and AE monitoring.
In this work, we developed 32 sets of homogeneous and heterogeneous models by assigning constant and differently distributed stiffness and strength parameters (uniform and Weibull distributions).The objective of this work is twofold:
(1) We strive to analyze and semi-quantitatively reveal the effects of heterogeneous microparameters on macromechanical responses and AE behaviors of rock (a kind of sandstone) under compressive cyclic loading in PFC.The simulation results of different heterogeneous models are presented and calibrated with laboratory data in relation to stress-strain relationship and AE monitoring.
(2) The method used to assign the best set of microparameters(stiffness and strength) is expected to be highlighted which most closely matches and reproduces the results (in the aspect of stress-strain relationship and AE characteristics)from laboratory testing.This method of assignment may potentially apply to a broad range of brittle geomaterials under cyclic loading when subject to the similar sample geometry and particle size.
2.Numerical model set-up
2.1.Heterogeneous characterization
Numerical characterization of the heterogeneous microproperties of rocks are popular in both continuum method and DEM.The implementation of heterogeneous stiffness, grain size,strength, thermal property and joint orientation can facilitate the reproduction of realistic mechanical responses of rocks and simultaneously complicates AE and thermal cracking behaviors when compared with the homogeneous model (Mohammadi and Kaushik, 2005; Zhao, 2016; Wang and Konietzky, 2019; Wang et al., 2019; Song et al., 2023).In this work, we adopted two generally used distribution patterns (uniform and Weibull distributions) to fulfill the heterogeneous micro-properties based on PFC.The introduction of the two heterogeneous numerical models is presented in Sections 2.1.1 (uniform distribution) and 2.1.2(Weibull distribution) in detail.
2.1.1.Uniform distribution-based model
From the view of mathematics, the uniform distribution is a specific pattern where each value holds an identical probability,which indicates that the probability is fixed to constant due to the same likelihood of occurrence.This implies that the range of the parameter is proportional to heterogeneity extent.The implementation of the uniform distribution of a given microparameter is performed via the Eq.(1).The probability density function (PDF)and cumulative distribution function(CDF)for uniform distribution within the range of [δmin, δmax] are shown in Eqs.(2) and (3),respectively.The mean E(x)and variance Var(x)are given by Eqs.(4)and (5), respectively.
where δ is a specific type of microparameter;δminand δmaxare the bottom and top bounds of the parameter, respectively; and xuniis the uniform random variable in the range of [0,1].
2.1.2.Weibull distribution-based model
Weibull distribution is extensively used in statistical representation of microparameters for geomaterials.It is specifically recommended to use in numerical modeling on rocks(Liu et al.,2004;Li et al.,2019;Wu et al.,2021).Liu et al.(2004)and Li et al.(2019)pointed out that Weibull distribution shows a great result in numerically characterizing the statistical variation of the failure strength of rocks.To implement the Weibull distribution of the heterogeneous micro-properties, we used a method formerly introduced by Liu et al.(2004) and Wang et al.(2019) which was originally proposed to characterize heterogeneous microstructural and thermal properties of granitic rocks.To assign the heterogeneous parameters,the constant parameters in homogeneous model were calibrated and determined in advance.Here we assume a microparameter P0determined in the homogeneous model at each contact.The corresponding parameter of a given contact in Weibull distribution is Pi.Then we can have a relation Pi=P0x,where x is the Weibull random variable.The CDF and PDF for Weibull random variable x are expressed as
where xuis the threshold for random variable x; m is the shape parameter, which is also termed homogeneity index determining the range of x; and x0is an expectation related scale parameter(Wang et al., 2019).
According to the suggestion from Vales et al.(1999)and Liu et al.(2004), the threshold xuis assigned to 0.Then Eqs.(6)and (7) can be transferred to a simpler manner(Eq.(8)and(9)).The mean E(x)and variance Var(x)are given in Eqs.(10)and(11),respectively.Γ is the Gamma function and is shown in Eq.(12).
where t is a variable.
According to Wang et al.(2019), the generation of the Weibull random variable x is fulfilled via the solution of the inverse function of Weibull distribution,which is controlled by m and x0(Eq.(8)and(9)).The range of F(x) in Eq.(8) falls between [0,1], which can be expressed by a random number u between [0,1] generated via a universal random number generator.Afterwards, the Weibull distributed random variable is obtained via x=F-1(u),where F-1(u)is inverse function for u.The x and x0can thus be given by
The value of m determines the variation range of the microproperties, a plethora of investigations have been carried out to assess the effect and reliability of Weibull distribution or algorithm on property characterization and other application.These investigations include the Bayesian, least-squares and maximum likelihood methods(Davies,2001;Deng and Jiang,2017;Jia,2020;Kumar and George,2020).However,these methods hold particular flaws,e.g.invalid assumptions and missing of the physical meaning(Davies, 2001; Wang et al., 2019).Another feasible method to determine the parameters of Weibull distribution is via the calibration of the macro-mechanical responses of materials in laboratory tests.According to the suggestions from Liu et al.(2004) and Wang et al.(2019) the parameter x0is thought to be equal to the mean value of a microparameter and thereby the mean of the Weibull random variable can be set to 1,E(x)=1(Wang et al.,2019).Normally,a presumption is usually made that the mean value of all contacts is expected to be equal to the value of homogeneous model(P0) determined after essential calibration.Then the relation between m and x0when E(x)=1 is shown in Eq.(15)and the Var(x)is shown in Eq.(16).
2.1.3.Unidentical P0
As stated in Section 2.1.2,the microparameter of a given contact Piin Weibull distribution model follows a relation Pi=P0x.Once the P0is determined, the value will apply to different cases regardless of the variation of m.However, the fixed P0can incur an underestimated/overestimated macro-strength when m is set to a smaller value(Li et al.,2019).The scatter in strength incurred by m failed to reproduce a strength identity from a macroscopic view.In this work, we assigned moderately different values of P0after calibration with the uniaxial compressive strength(UCS)and aims to reach an approximately identical UCS value amid different cases.
2.2.Introduction of LPBM in PFC3D
The LPBM implemented in PFC has been extensively used by researchers as one of the most popular particle-based models to reproduce and simulate the mechanical behaviors of rocks(Potyondy and Cundall, 2004).Fig.2 schematically illustrates the mechanisms of LPBM, in which we can notice that the manner of bonded particles in PFC (Fig.2a) is highly similar to that of the cemented micro-glass beads(Holt et al.,2005).As shown in Fig.2c,local stress between two particles adheres to a failure envelope jointly determined by three parameters, i.e.tension cutoff (tensile strength),cohesion and friction angle.In Fig.2d,the LPBM has two sets of stiffness parameters(linear and parallel bond group),in both normal (knand k′n) and shear directions (ksand k′s).A parameter termed k-ratio (kn/ks) in LPBM can fix the relation between shear and normal stiffnesses.In this work, the ratio is set to 2.
Reduction in bond diameter D in LPBM (controlled by a timedependent multiplier λ) can weaken the integrity of particle assembly which was originally proposed to simulate a static-fatigue behavior of granitic rocks.The bond diameter decreases in a constant rate γ when the applied constant load exceeds the long-term strength of rock, see Eq.(17).The rate of bond damage (diameter reduction)is controlled by two parameters φ1and φ2,as well as the ratio of applied force level σ to bond strength,σc(Potyondy,2007).
where Δt is time duration since damage occurrence.
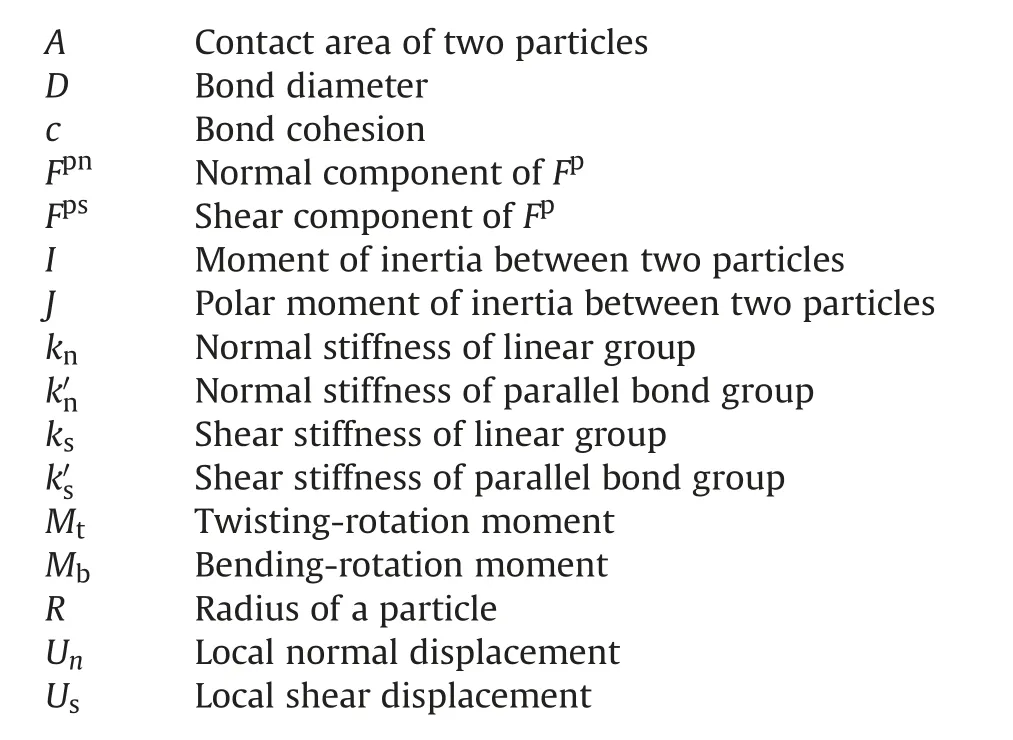
Eq.(18)presents the relations between parallel-bond force F and displacement d in a matrix form.E is the effective stiffness matrix.When the bond diameter D is reduced to βD (0 <β <1), the effective stiffness matrix is decayed due to the reduction in I,J and A while the values for k′nand k′sare still unchanged,(Potyondy,2007).
where Fpnis the normal component of parallel bond force; Fpsis the shear component of parallel bond force; Mtis the twistingrotation moment; Mbis the bend-rotation moment; I, J and A are the moment of inertia, polar moment of inertia, contact area between two particles,respectively;I′,J′and A′are the damage state after bond reduction;Unis the local normal displacement;Usis the local shear displacement; θtis the twisting-rotation between particles; and θbis the bending-rotation between particles.The updated stiffness matrix after bond decease is shown in Eq.(19).
where d′is the displacement matrix after damage.
Accordingly, the local translational and rotational strains exposed to a fixed increase of load and moment are enlarged.Eq.(20) shows the form of matrix by considering loading duration(Song et al., 2019b).the mean value of fatigue load at the first cyclic loading stage(CLS)(25 MPa) was applied prior to multi-level cyclic stress, then the minimum cyclic stress was fixed to 20 MPa and the maximum cyclic stress was set to 30 MPa at the first CLS.The stress wave is in sinusoidal pattern with a specific frequency of 0.1 Hz.At each CLS,ten cycles were applied and, the maximum cyclic stress,σmaxwas raised by 5 MPa and a new CLS started.The sample failed at the peak stress of the first cycle of the 5th CLS(41st cycle)in which the minimum and maximum cyclic stresses are 20 MPa and 50 MPa,respectively.The advanced PCI-II AE apparatus was used to record AE parameters.The level of preamplifier was 40 dB which is same with the AE event threshold.The values of peak definition time(PDT), hit definition time (HDT) and hit lockout time (HLT) were respectively set to 50 μs,200 μs and 300 μs Eight AE sensors were deployed and the layout is shown in Fig.3(Zhang et al.,2020).The maximum frequency domain for the sensors is up to 400 kHz.The AE source location technology was used to reveal the distribution of AE events and is visualized via the coordinates processing.A presumption is made that the velocities of the seismic waves are identical within the whole sample range.The method of locating of an AE event source in Cartesian coordinate system is presented by
where x, y, z denote the three-dimensional (3D) coordinates of an AE event occurred;T is the occurrence time of an AE event;xi,yi,ziare the coordinates of the ith AE sensor; Tiis the arrival time
where U′nis the local normal displacement after damage;U′sis the local shear displacement after damage; θ′t is the twisting-rotation after damage;and θ′b is the bending-rotation after damage.
2.3.Experimental datasets
The laboratory dataset used to calibrate numerical modeling is based on a cylindrical sandstone.A series of rock samples was drilled from the tunnel of a coal mine in Shaanxi province, China(Zhang et al., 2020).The rock is a typical quartz sandstone.The mineral grains are closely packed.The geometrical properties of the sample are shown in Table 1.The sample was subject to the compressive multi-level cyclic loading,and the detailed stress path is presented in Table 2.A linear monotonic loading phase from 0 to detected by sensor;and v is the velocity of the seismic wave(Zhang et al., 2020).The cumulative AE counts and energy were schematically shown in Fig.3.The AE events were sorted into three levels (huge, moderate, small) based on the magnitude of AE energy.Only AE events detected by at least four sensors are visualized.
Fig.4 presents the stress-strain relationship and the cumulative AE counts and energy for sample during laboratory test.These results are the major basis to calibrate the numerical simulation.Eight time points (see Fig.4d, time points ①-⑧) were selected to present the AE source location with the indication of AE energy magnitude.Fig.4b shows that the number of cumulative AE counts is highly dependent on the maximum cyclic stress,the growth rate of cumulative AE counts (slope) rises with the stress level.Particularly for the 4th CLS, the AE counts rapidly grow.The 4th CLS is followed by a spike at the first cycle of the 5th CLS,which indicates the failure of the sample.
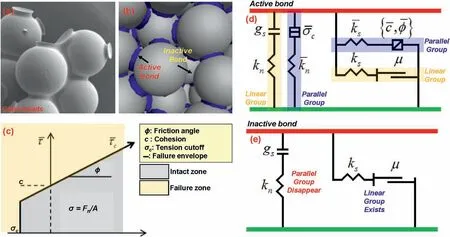
Fig.2.(a)Schematic diagram of cemented glass beads(Holt et al.,2005),(b)Indication of active and inactive bonds in PFC3D,(c)Failure envelope of LPBM,(d)Two sets of stiffness in active bond state, and (e) One set of stiffness parameter left in inactive bond state.Source of subfigures (c-e) are after Itasca Consulting Group Inc.(2014).
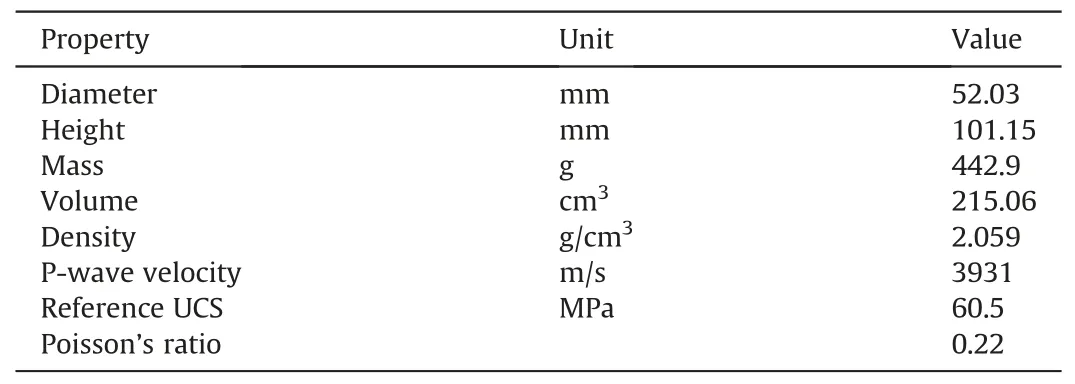
Table 1 Geometrical and physical properties of sandstone sample.

Table 2 Stress path of sandstone sample.
2.4.Loading regime and AE monitoring

Fig.5.Numerical modeling set-up:stress controlled cyclic loading system and vertical stress monitoring.(a)Numerical assembly and contact at two ends,(b)Layout of measuring spheres, and (c) Monitored axial stress.
The laboratory test is performed under a stress-controlled regime, which is an important factor that is needed to be reproduced in the numerical modeling.As documented in our previous work (Song et al., 2019b, 2022, 2023), the clump composed of the densely packed pebbles (overlap is set between pebbles) shows a good performance in simulating the uniaxial compressive stresscontrolled cyclic loading.The similar loading regime is modelled in this work as shown in Fig.5.In our study,the domain applied is a cubical box where all model components are created.The domain boundary condition applied is the“stop”mode.This mode imposes the constraint if the body centroid of any element falls outside of the domain, the velocity and spin of the element are nulled.The fixed boundary is applied at the bottom loading platen (represented by fixed rigid wall), where the force can be transferred between the assembly and wall whereas the displacement of the wall is fixed.The elastic boundary is applied at the top loading platen which is represented by clump, the force and displacement computation at contact between clump and assembly follows the law of motion:the position and velocity of the element are updated according to Newton’s laws of motion using the current time step and the forces calculated during the previous cycle (Itasca Consulting Group Inc.2014).The basic assumptions in numerical model are as follows:(1)The particles are treated as spherical rigid bodies;(2)The wall and clump are unbreakable and rigid,and the rotation is fixed; and (3) Due to the low frequency used in laboratory test(0.1 Hz),the cyclic loading in simulation is in quasi-static mode.The stress propagation is essential to check prior to the cyclic loading, which is important to the accuracy of numerical simulation.For ease of wave programming, a phase (π/2) is shifted in simulation at initiation of cyclic stress.The vertical stress readings monitored in five parts (i.e.inputted value, averaged value of two ends of particle assembly and three measuring spheres) exhibit a clear cyclic pattern which well corroborates the reliability of numerical model in terms of stress transmission.The AE monitoring system is constructed by considering the magnitudes of the released energy between particles at failure,which shares a similar physical mechanism with microseismic activities.
3.Simulation results
3.1.Parameter calibration and numerical schemes
As introduced in Section 2, the uniform and Weibull distributions are used to characterize the heterogeneous microparameters.The reference UCS listed in Table 1 is an important strength parameter.All heterogeneous models are calibrated by reaching a UCS value close to 60.5 MPa under the monotonic loading regime.Table 3 presents the calibrated microparameters under uniform distribution.Scheme A denotes a completely homogeneous model in which all the parameters are set to constant.Schemes B, C, D respectively correspond to the slightly, moderately, highly heterogeneous models.The minimum values (bottom limit) of the microparameters in different uniform distributions are set to 0.25P0, 0.5P0, 0.75P0respectively in Schemes B, C, D, where P0is aspecific parameter determined in the homogeneous model (e.g.when tensile stress, στis 12 MPa in the homogeneous model, the minimum values for Schemes B, C, D are set to 3 MPa, 6 MPa and 9 MPa,respectively).Fig.6 presents the failure envelopes due to the variation of tensile strength and cohesion under the uniform distribution.The heterogeneous models can yield two failure envelopes which correlate to the top and bottom limits of the microparameters, respectively.The similar method also applies to k′nand knwhile the stiffness ratio or variation range for the ratios of k′n/k′sand kn/ksis all along fixed to 2.This demonstrates that for each type of microparameter,four sets of numerical simulation are conducted correlating with the four numerical schemes.
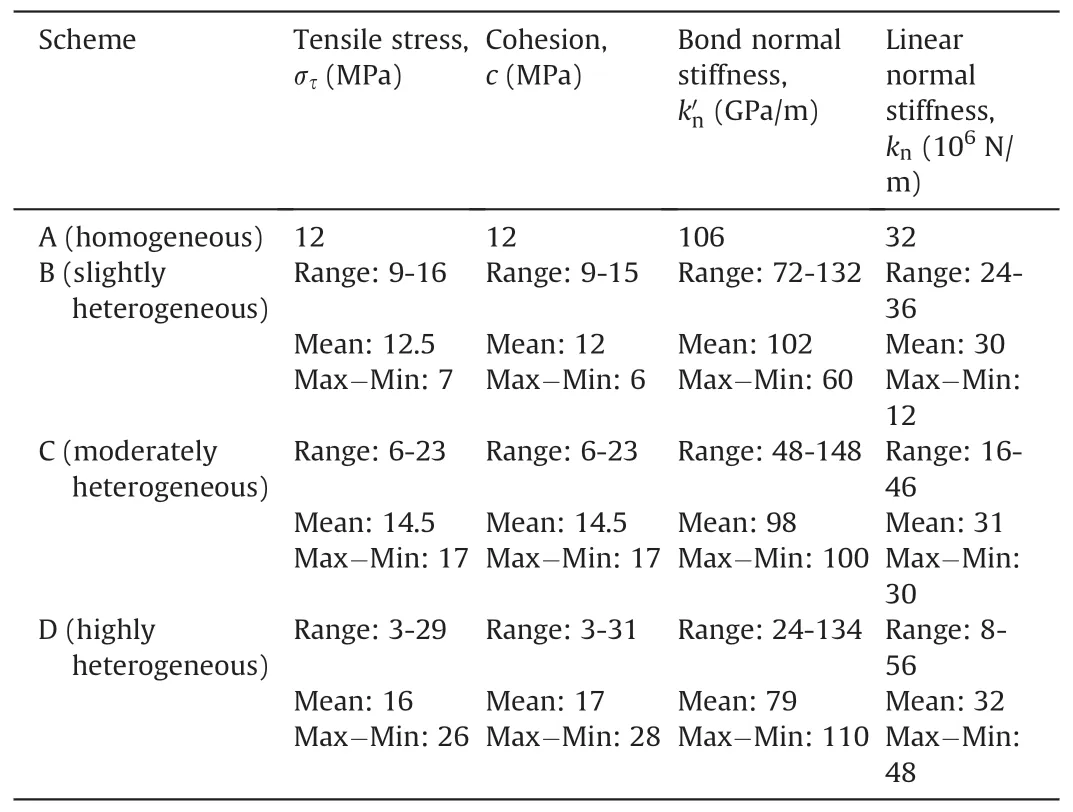
Table 3 Calibrated parameters in uniform distribution.
In this work, four types of microparameters are taken into account: στ(tensile stress) and c (cohesion) are strength-related parameters and k′nand knare stiffness-related parameters.Correspondingly, the calibrated microparameters in Weibull distribution are presented in Table 4.Four levels of the shape parameter m (2.5, 5, 10, 25) are used to characterize differentextents of heterogeneity.According to Eq.(15),the values of x0can be determined when m is assigned.As stated in Section 2, we particularly calibrate the value of P0to guarantee the strength identity in each numerical scheme with the variation of m.Therefore, a slight difference can be observed in different schemes in Table 4.According to the results in the literature(Li et al.,2019),if P0is fixed when subjects to a variable m, a scattered UCS will occur under Weibull distribution,especially when m is less than 5.Hence,the calibration of P0can maximize the identity and reproducibility in sample strength.Fig.7 presents the statistics of the actual microparameters assigned to numerical model in PFC via Python,the black solid lines indicate the theoretical distribution of the parameters and the colorful zones indicate the actual statistical distribution of the parameters in the numerical model.The values of other microparameters are presented in Table 5.
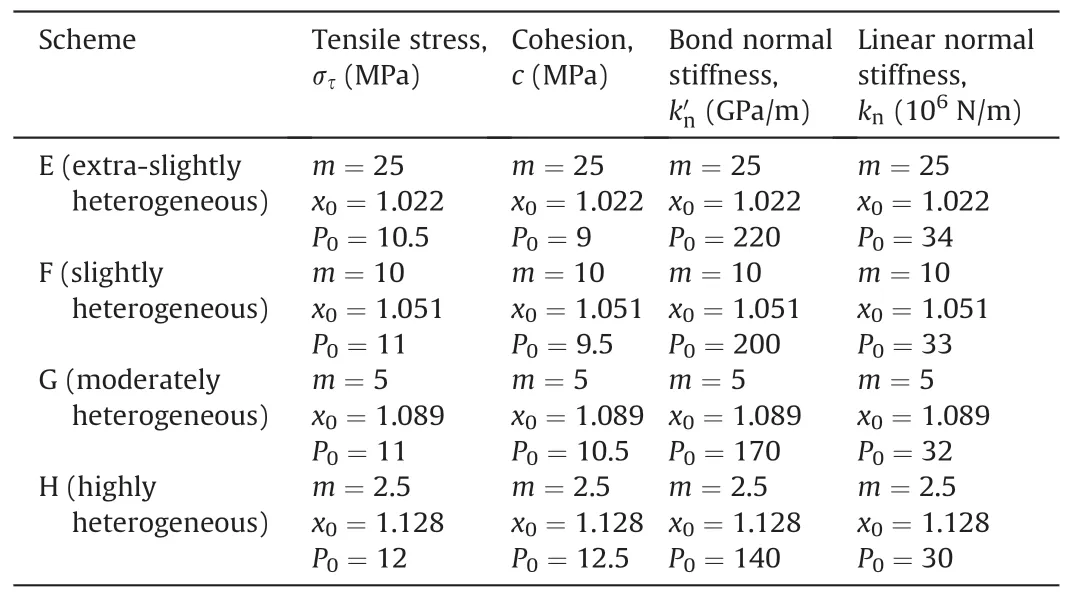
Table 4 Calibrated parameters in Weibull distribution.
3.2.Stress-strain curves and determination of bond multiplier evolution path

Fig.6.Failure envelopes in the uniform distribution with different tensile strengths:(a)Scheme A(homogeneous),(b)Scheme B(slightly heterogeneous),(c)Scheme C(moderately heterogeneous), and (d) Scheme D (highly heterogeneous); Failure envelopes in the uniform distribution with different cohesions: (e) Scheme A (homogeneous), (f) Scheme B(slightly heterogeneous), (g) Scheme C (moderately heterogeneous), and (h) Scheme D (highly heterogeneous).

Fig.7.Statistical characteristics of microparameters implemented in PFC.Uniform distribution: (a)Tensile strength,(b)Cohesion, (c)Bond normal stiffness,and(d)Linear normal stiffness; Weibull distribution: (e) Tensile strength, (f) Cohesion, (g) Bond normal stiffness, and (h) Linear normal stiffness.
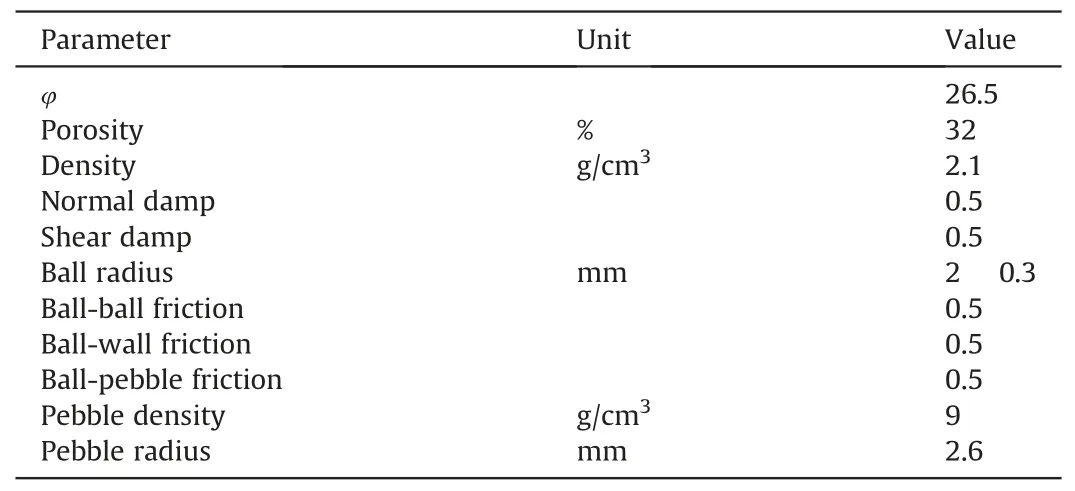
Table 5 Microparameters of numerical model.
The time-dependent evolution of bond diameter multiplier λ is a numerical representative of damage during the cyclic loading in PFC.The different evolution paths of λ can yield distinct mechanical responses in terms of stress-strain relations, also known as the hysteresis loops.In this work,the evolution path of λ is determined via the homogeneous model in which the parameters are fixed to constant.The subsequent sets of numerical simulation based on the heterogeneous models strictly follow the identical path determined in the homogeneous model.The deterministic path of λ is illustrated in Fig.8,where for the 1st to 40th cycles, the λ is fixed to 1,and the value falls to 0.88 at the 41st cycle.The transient drop of λ correlates with the abrupt failure of sample without evident precursory characteristics, e.g.drastic rise of dissipated energy and gradually enlarged hysteresis loop.The comparisons of hysteresis loops between laboratory tests and numerical simulation in the homogeneous model is presented in Fig.9a.The good agreement in numerical and laboratory tests indicates the determined path of λ is optimal for simulating the mechanical responses of the sandstone.Eight time points (A-H) are selected to present the spatial distribution of AE events in simulation which are indicated in Fig.8.
Due to limitations of computing capability and time cost (e.g.several thousands of cycles in laboratory tests), the numerical calibration of stress-strain curves with laboratory tests are always based on partially cycles.To replicate the most important mechanical characteristics, the stress-strain curves at separate CLS in laboratory or numerical data are recommended to shift with corresponding phases (either left or right) to offset irreproducible behaviors or cycle gaps to better and more clearly present simulation results for the ease of indicating some mechanical parameters,i.e.secant modulus and strain growth rate(Song et al.,2019b,2022, 2023).In this work, in light of low cycle numbers, the complete stress-strain relationship remains original(no shift is used)to compare numerical and experimental results.Therefore, the matching could be moderate.The stress-strain relationship (hysteresis loops) for homogeneous and heterogeneous models under two distribution patterns (uniform and Weibull distributions) are presented in Figs.9-12 which correspond to the different schemes listed in Tables 3 and 4 The UCS of each numerical assembly was calibrated with the result of homogeneous model to assure the strength identity in different schemes.Fig.9 shows the results of heterogeneous models with the variation of tensile strength (στ).Fig.9a-d shows the results of uniform distribution and Fig.9e-h shows that of Weibull distribution.The black solid lines indicate the stress-strain curves subject to eight numerical schemes.It is noticed that, for both two types of distributions, the axial strain displays a larger value with the increase of heterogeneity,which is clearly shown via the hysteresis loops at the 4th CLS in Fig.9d and h.This implies that when the UCS and the evolution path of the bond radius multiplier are fixed(calibrated via the uniaxial compressive test), the axial strain during cyclic loading increases with the growth of heterogeneity in tensile strength (στ).The modulus of hysteresis loop is barely impacted by heterogeneity of tensile strength (στ), the moduli of hysteresis loops in Fig.9 are highly consistent with each other and the results in laboratory tests.Fig.10 shows the results of heterogeneous cohesion (c), a similar result with respect to Fig.9 is shown in Fig.10: A higher extent of heterogeneity in terms of cohesion(c)also incurs a larger value of axial strain particularly at the 3rd and 4th CLSs,see the black solid lines in Fig.10d and h.Compared to Fig.9,the impact of heterogeneity in cohesion is slightly less noticeable than tensile strength, which suggests that the growth rate of axial strain is more sensitive to the heterogeneous tensile strength in both uniform and Weibull distributions.
The hysteresis loops exposed to heterogeneous parallel bond stiffness(k′n)are plotted in Fig.11.It is noticed that the distribution pattern of k′nhas an evident impact on the stress-strain relations.Specifically,for the results in uniform distribution,the model with high heterogeneity of k′n(see Fig.11d) exhibits a“wide pattern” of stress-strain loops, which is meanwhile associated with a higher growth rate of axial strain.This implies that a broader range of k′ncan accelerate the growth of axial strain and increase the axial strain at failure when subjected to a similar UCS under cyclic loading.This effect also applies to the Weibull distribution, albeit the obviousness is moderately reduced compared with the uniform distribution.In summary, the heterogeneity of parallel bond stiffness k′nwill accelerate the increase of axial strain,the effect induced by heterogeneous k′nis more predominant for uniform distribution.For the results under Weibull distribution, the implementation of heterogeneous k′ndisplays a noticeable impact on the modulus of the first cycle, which incurs a clear offset observed in Fig.11e-h.The effect of heterogeneity in linear stiffness (kn) on stress-strain relationship is presented in Fig.12.With the increase of heterogeneity in kn,the moduli of hysteresis loops are gradually decayed in both two distribution patterns.This can be evidently revealed via the difference of stiffness between laboratory test and numerical simulation under different extents of heterogeneity.Meanwhile,the growth rate of axial strain is gently raised with the increase of heterogeneity.
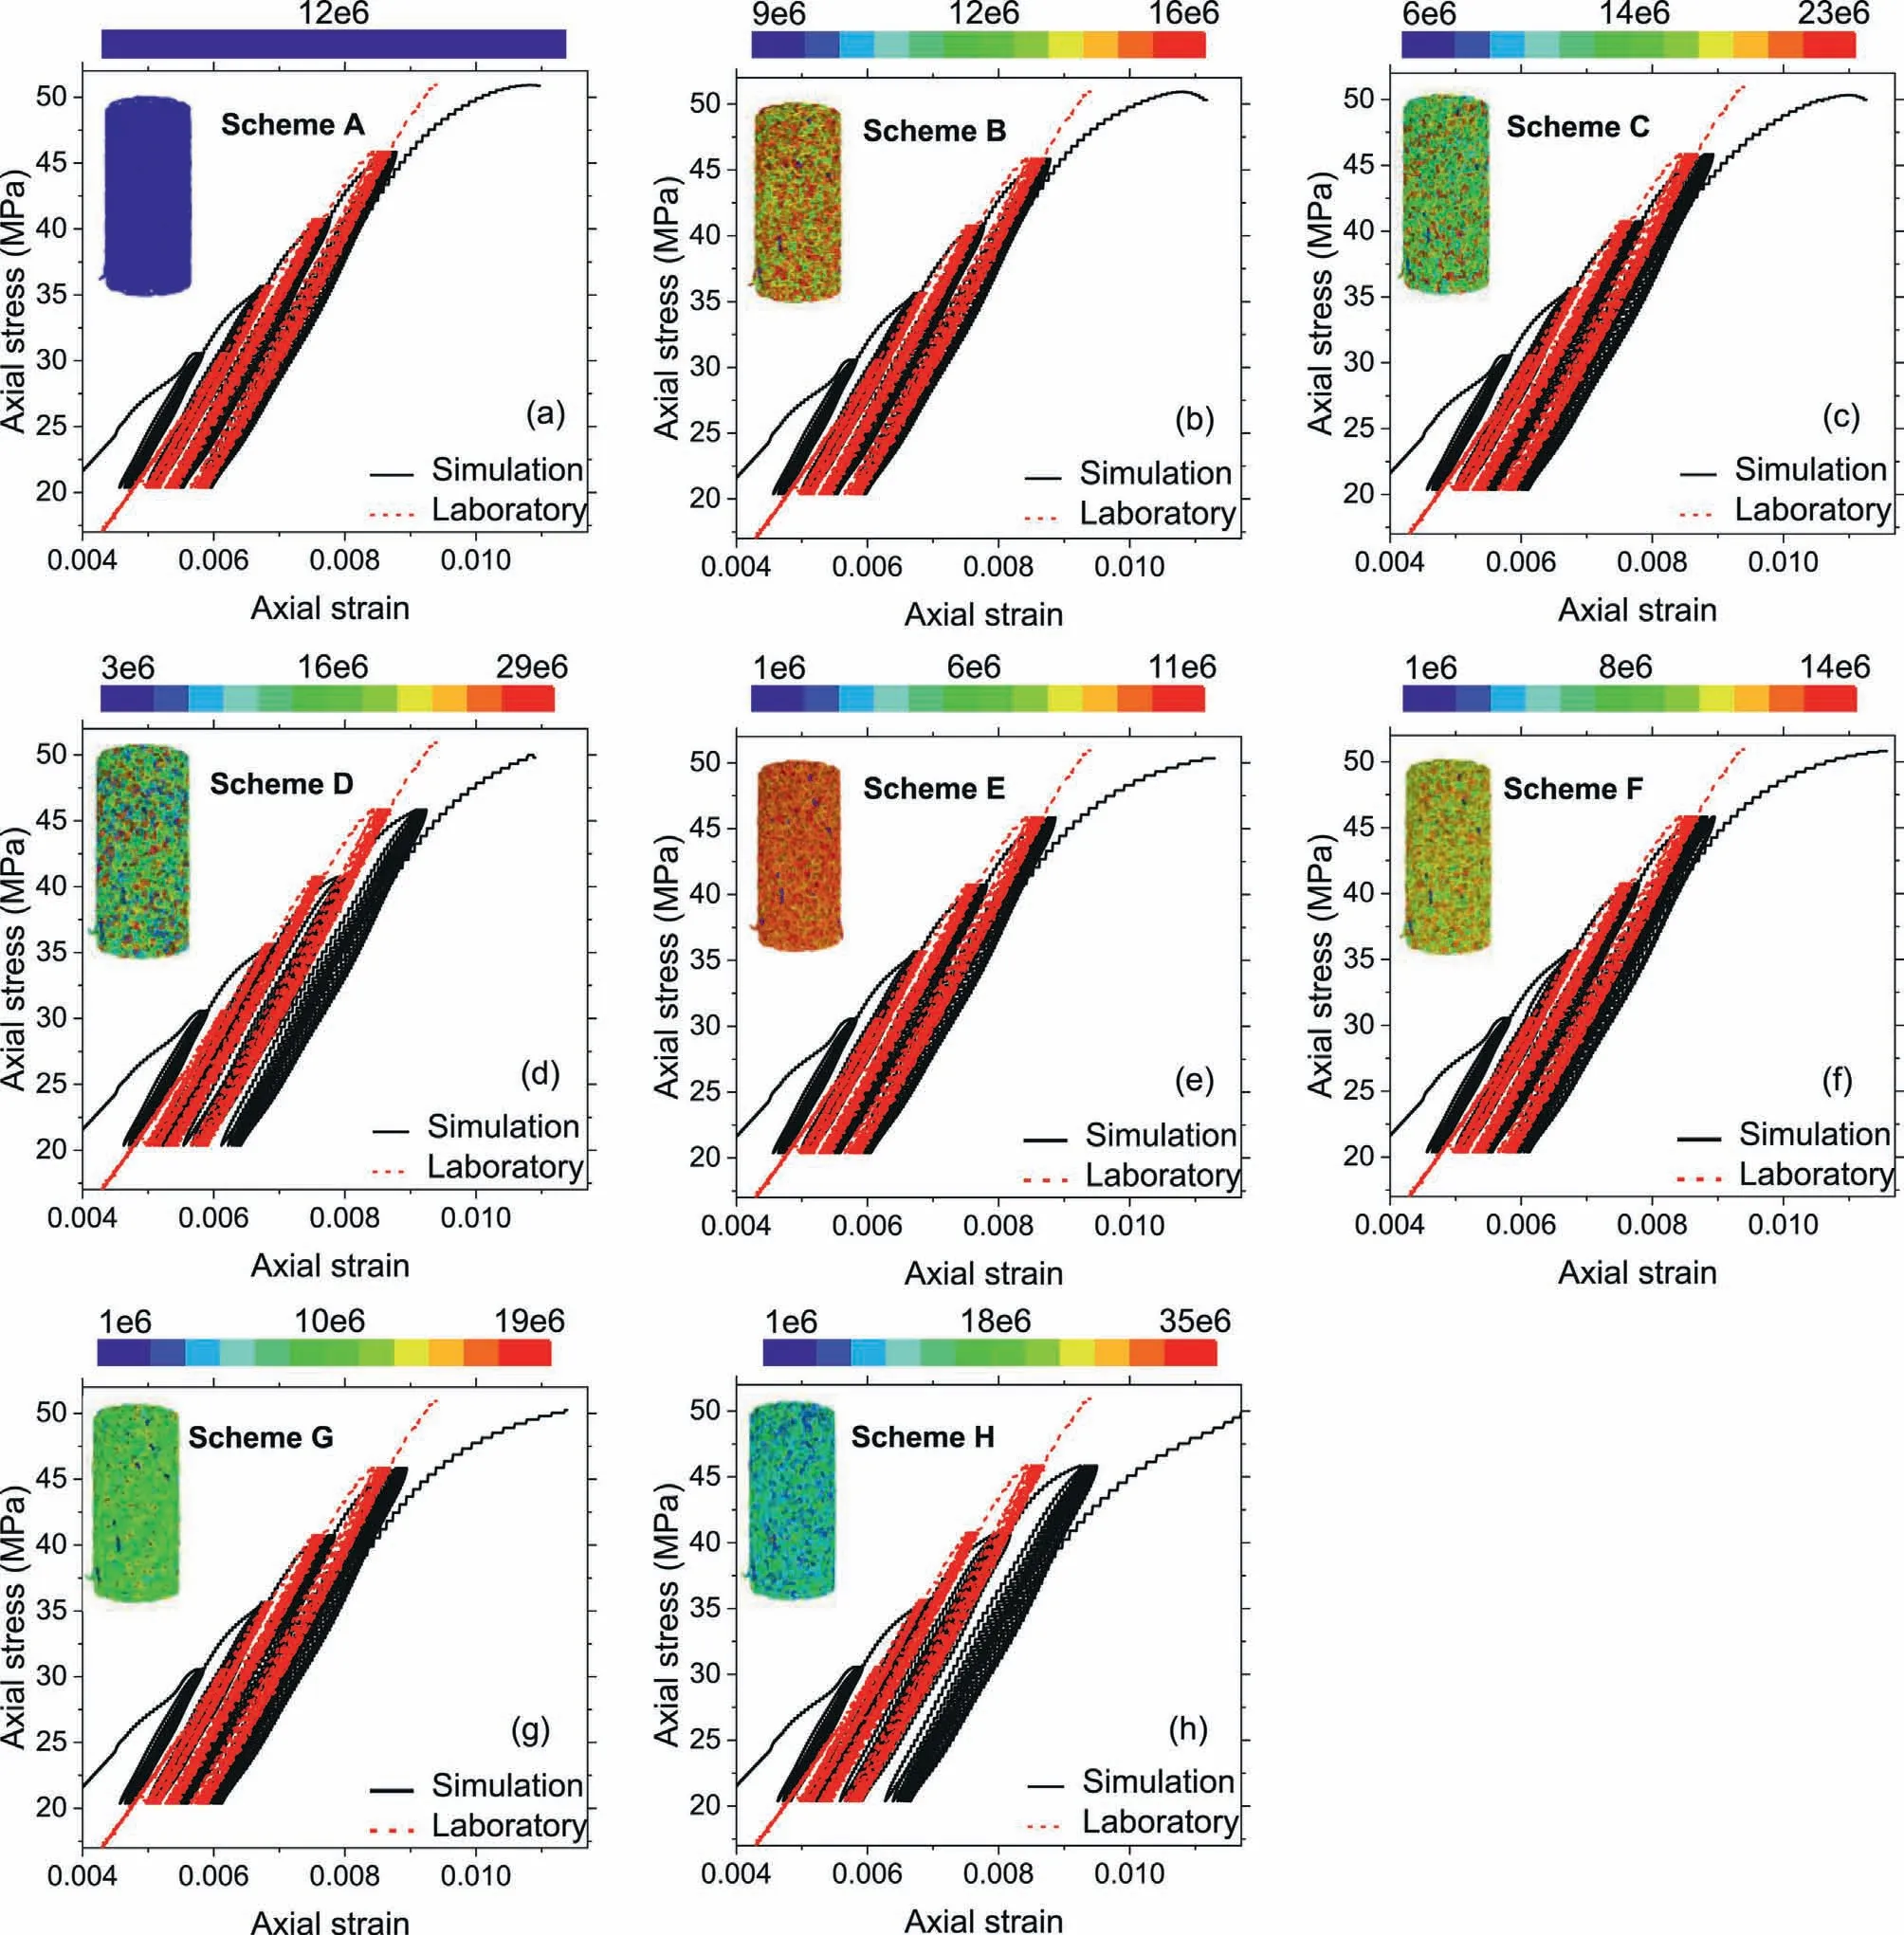
Fig.9.Stress-strain relationship in eight numerical schemes with different values of tensile strength(στ).Uniform distribution:(a)Scheme A(homogeneous),(b)Scheme B(slightly heterogeneous),(c)Scheme C(moderately heterogeneous),and(d)Scheme D(highly heterogeneous);Weibull distribution:(e)Scheme E(extra-slightly heterogeneous,m=25),(f)Scheme F (slightly heterogeneous, m = 10), (g) Scheme G (moderately heterogeneous, m = 5), and (h) Scheme H (highly heterogeneous, m = 2.5).
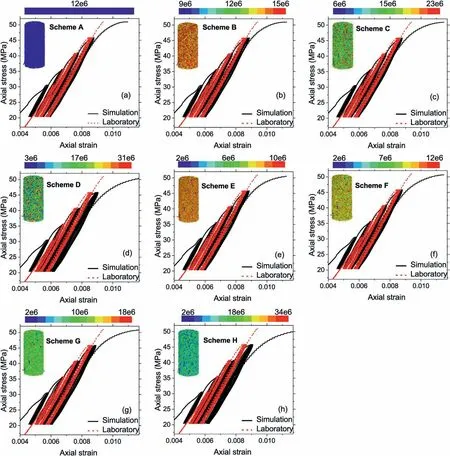
Fig.10.Stress-strain relationship in eight numerical schemes with different values of cohesion (c).Uniform distribution: (a) Scheme A (homogeneous), (b) Scheme B (slightly heterogeneous),(c)Scheme C(moderately heterogeneous),and(d)Scheme D(highly heterogeneous);Weibull distribution:(e)Scheme E(extra-slightly heterogeneous,m=25),(f)Scheme F (slightly heterogeneous, m = 10), (g) Scheme G (moderately heterogeneous, m = 5), and (h) Scheme H (highly heterogeneous, m = 2.5).
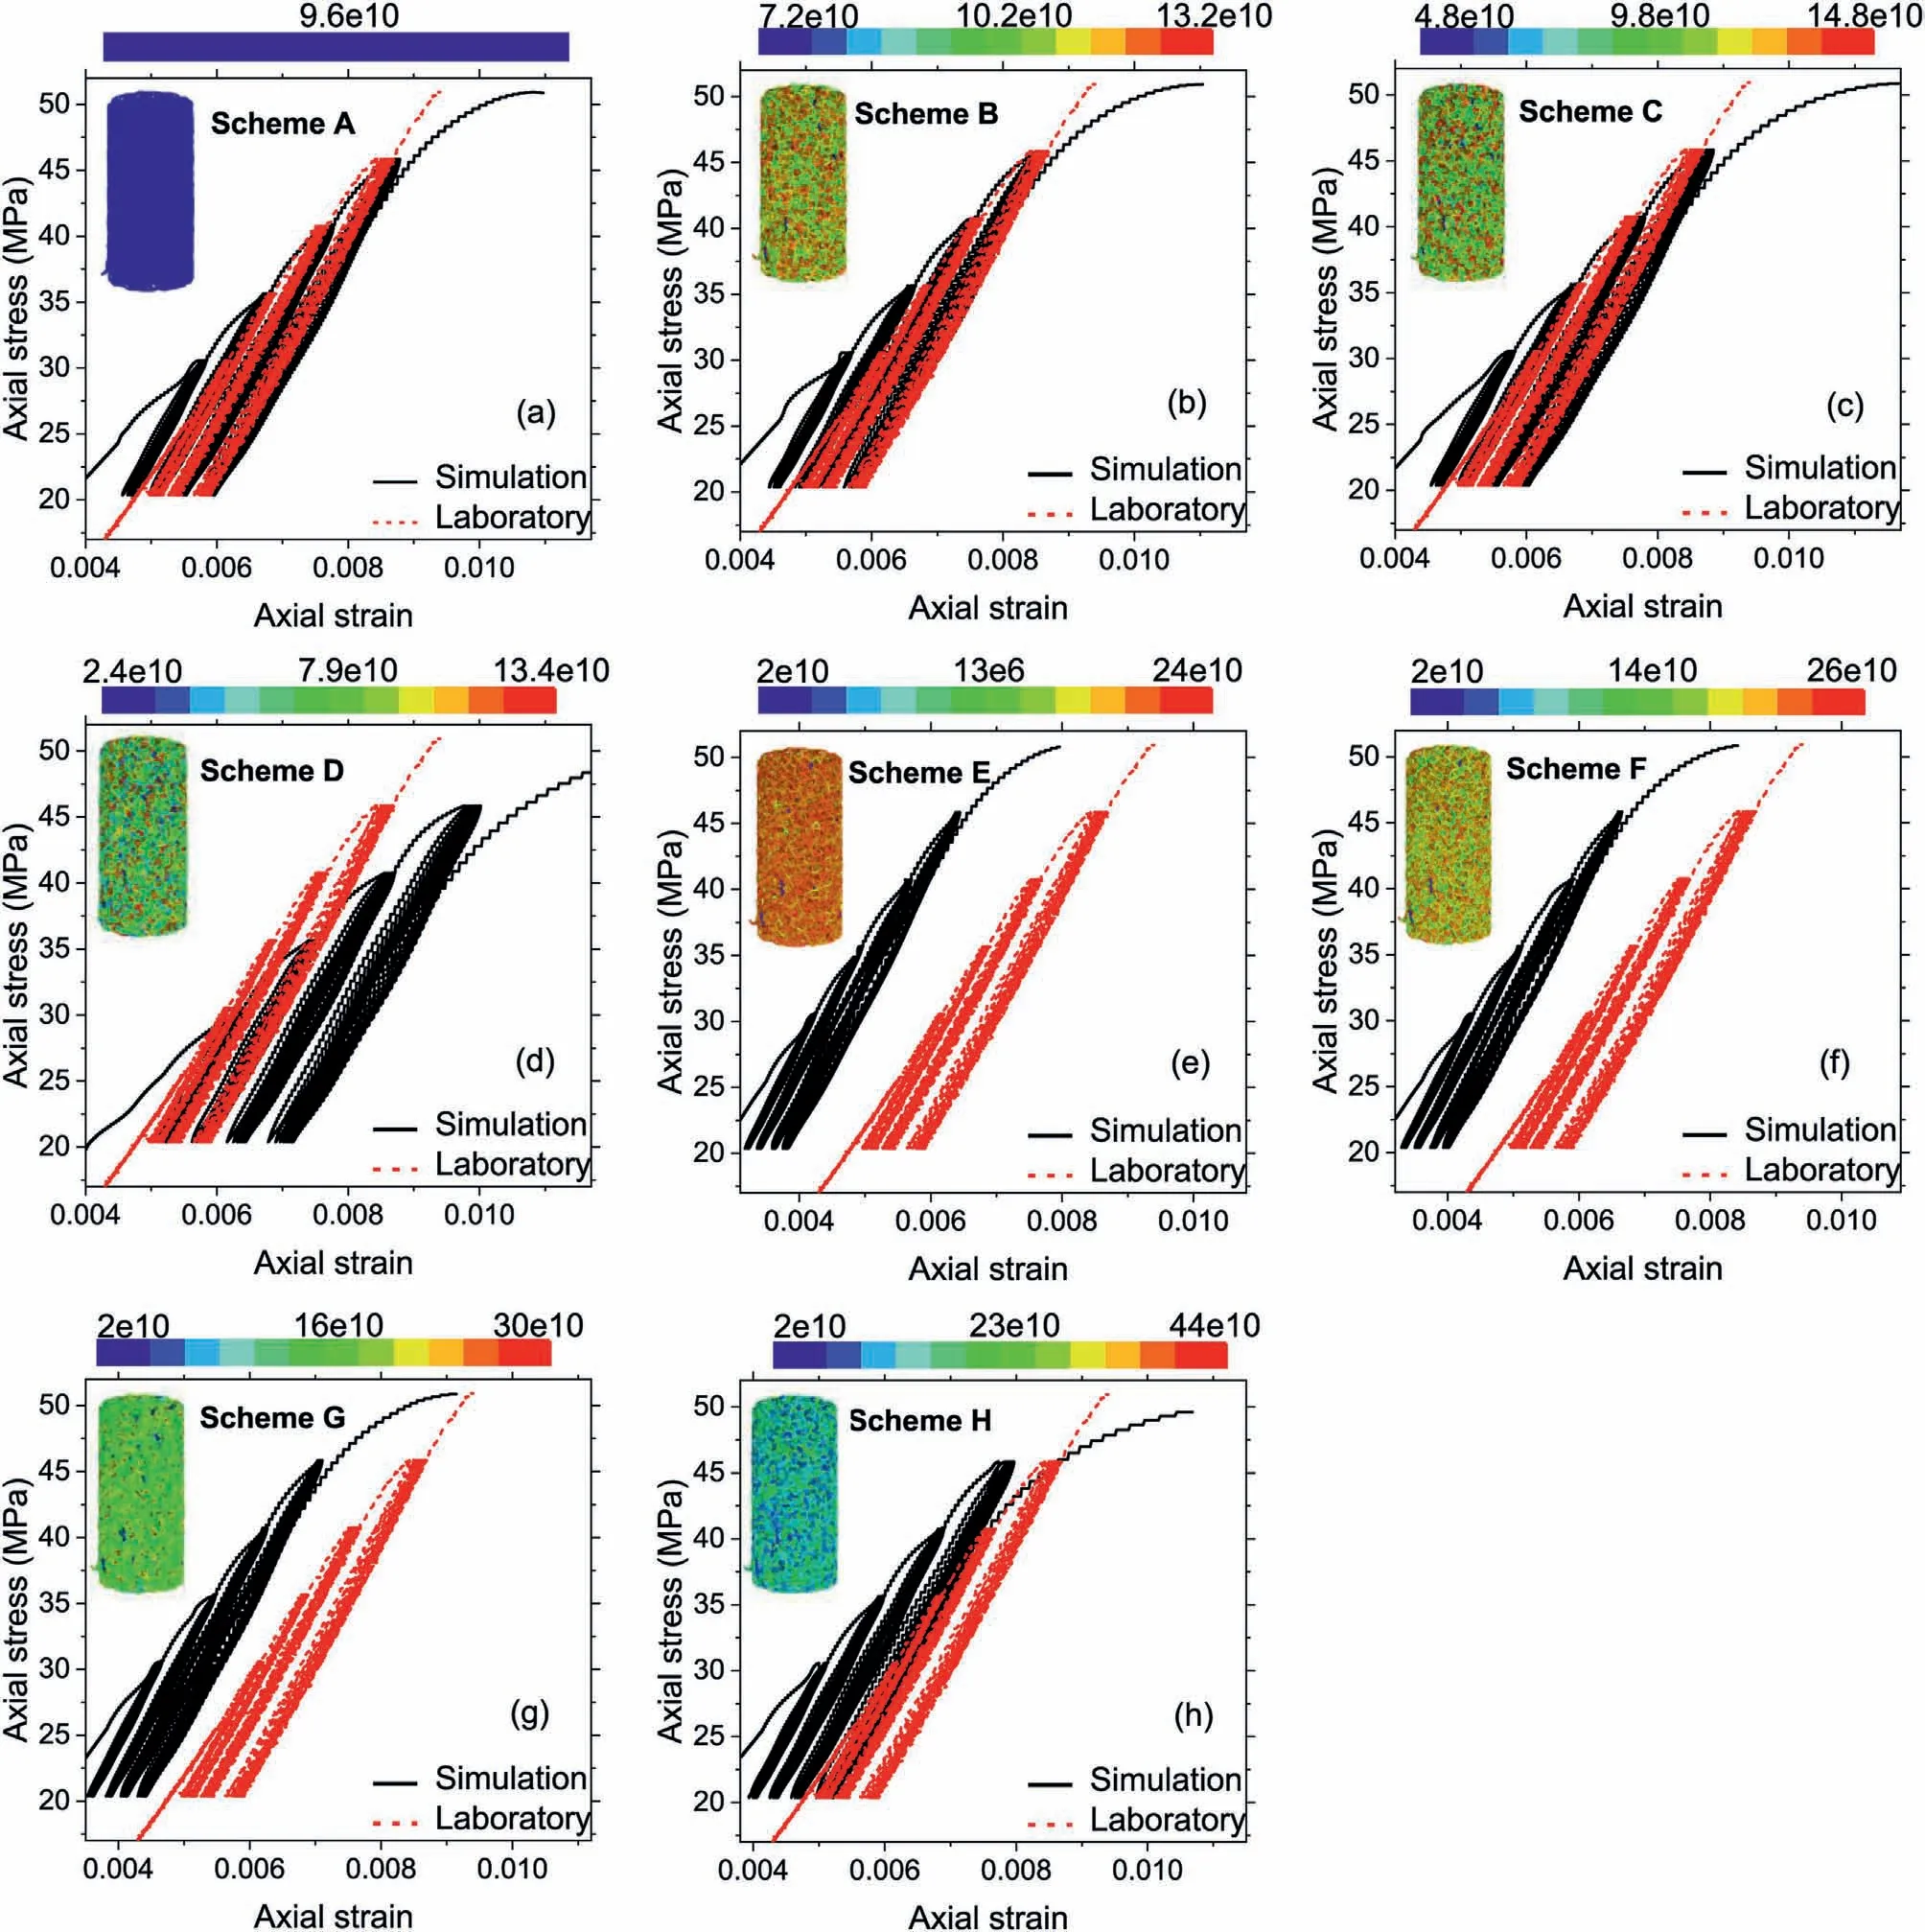
Fig.11.Stress-strain relationship in eight numerical schemes with different values of parallel bond normal stiffness (k′n).Uniform distribution: (a) Scheme A (homogeneous), (b)Scheme B (slightly heterogeneous), (c) Scheme C (moderately heterogeneous), and (d) Scheme D (highly heterogeneous); Weibull distribution: (e) Scheme E (extra-slightly heterogeneous, m = 25), (f) Scheme F (slightly heterogeneous, m = 10), (g) Scheme G (moderately heterogeneous, m = 5), and (h) Scheme H (highly heterogeneous, m = 2.5).
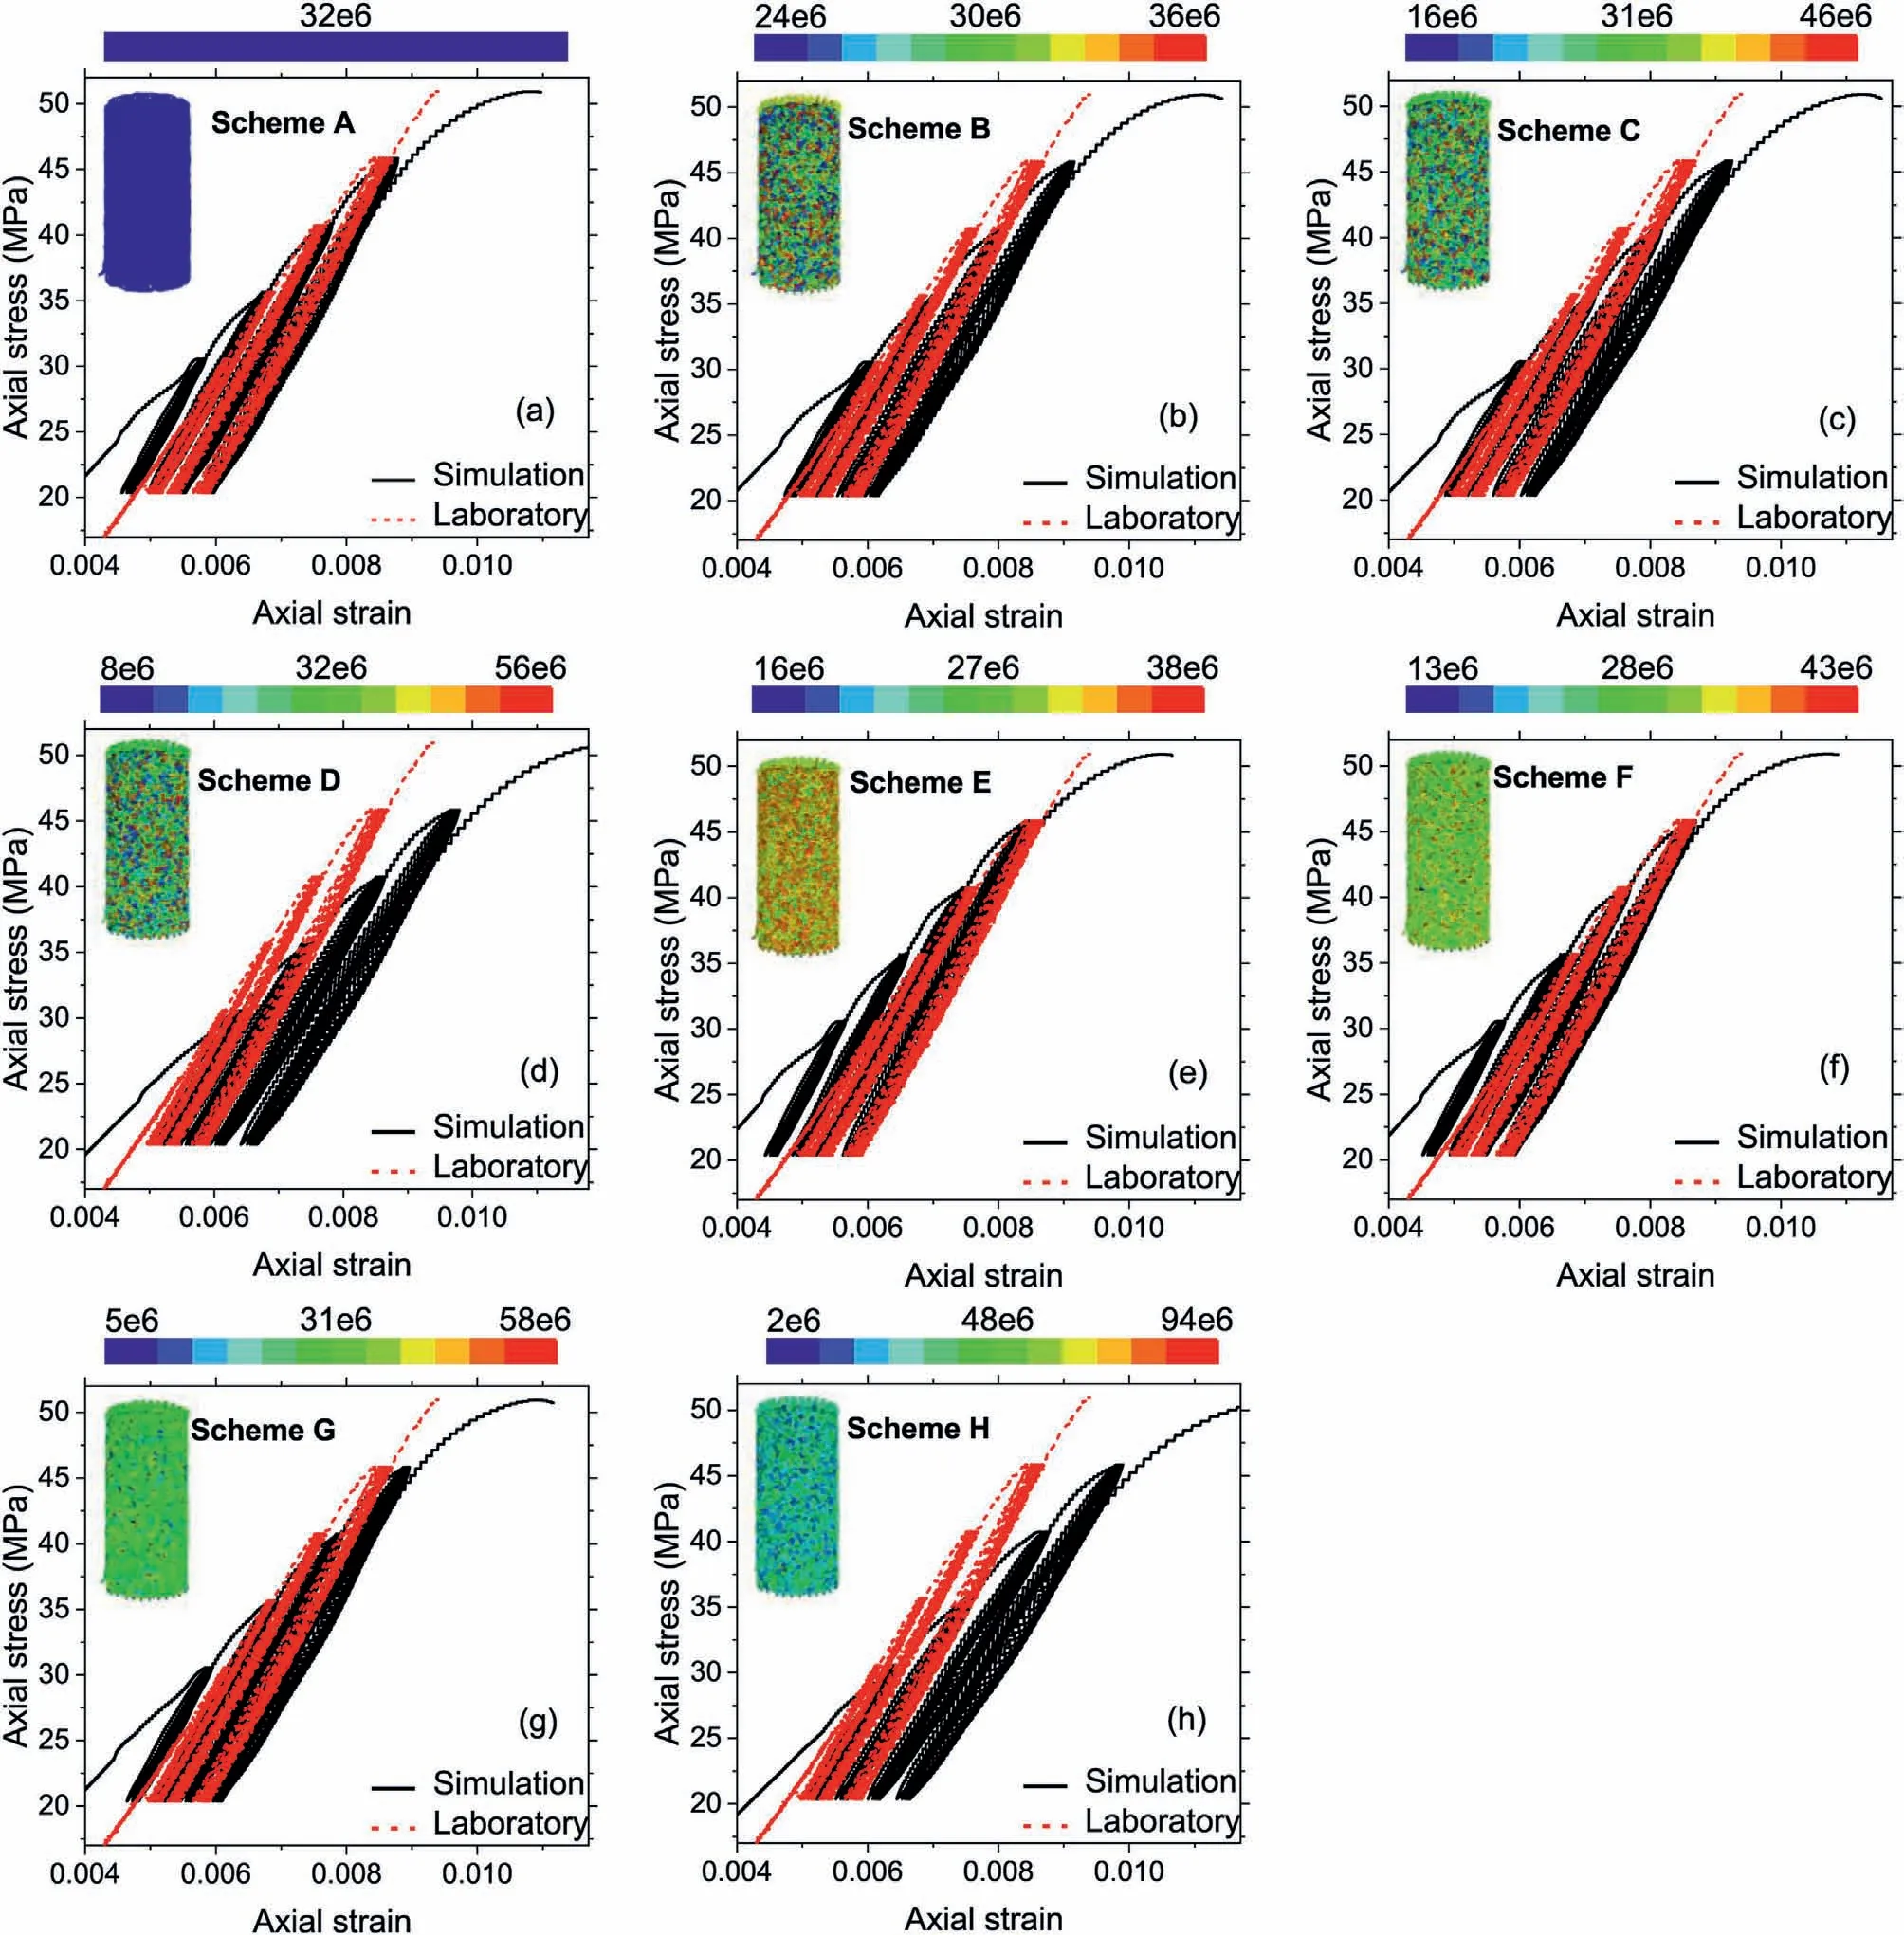
Fig.12.Stress-strain relationship in eight numerical schemes with different values of linear stiffness(kn).Uniform distribution:(a)Scheme A(homogeneous),(b)Scheme B(slightly heterogeneous),(c)Scheme C(moderately heterogeneous),and(d)Scheme D(highly heterogeneous);Weibull distribution:(e)Scheme E(extra-slightly heterogeneous,m=25),(f)Scheme F (slightly heterogeneous, m = 10), (g) Scheme G (moderately heterogeneous, m = 5), and (h) Scheme H (highly heterogeneous, m = 2.5).
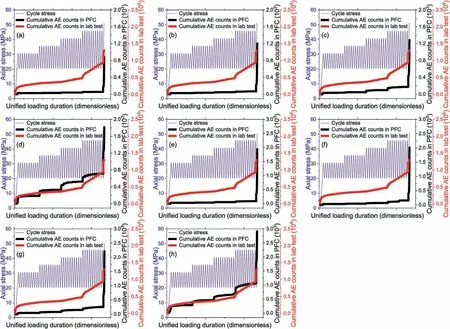
Fig.13.Comparisons of AE events evolution in eight numerical schemes with different values of tensile strength (στ).Uniform distribution: (a) Scheme A (homogeneous), (b)Scheme B (slightly heterogeneous), (c) Scheme C (moderately heterogeneous), and (d) Scheme D (highly heterogeneous); Weibull distribution: (e) Scheme E (extra-slightly heterogeneous, m = 25), (f) Scheme F (slightly heterogeneous, m = 10), (g) Scheme G (moderately heterogeneous, m = 5), and (h) Scheme H (highly heterogeneous, m = 2.5).
Based on the results in Figs.9-12,it is inferred that the strength and stiffness parameters impose different impacts on the stressstrain relations.Overall, the increase of heterogeneity in strength(Figs.9 and 10) and stiffness (Figs.11 and 12) parameters both accelerate the growth rate of axial strain whereas the accelerated extents vary.The moduli of the hysteresis loops at the 1st to 3rd CLSs are highly uniform as shown in Figs.9 and 10.This implies different levels of strength heterogeneity which can induce distinct microcracking behaviors barely impact the evolution of moduli of hysteresis loops.The impact of heterogeneous strength parameters is manifested at the 4th CLS in terms of axial strain at the minimum stress level.For Figs.11 and 12, the implementation of heterogenous stiffness parameters exerts evident impacts on hysteresis loops’ moduli and the impacts in terms of axial strain is less indistinctive even though at the 4th CLS.This signifies the distinct levels of heterogeneous stiffness will not apparently affect the cumulation of irreversible axial strain.Here possible reasons to account for this result are given:
(1) Heterogeneous strength parameters may incur a larger amount of microcracks at failure than the homogenous model, which results in a more severe damage process around the failure.
(2) Heterogeneous stiffness parameters may result in distinct localized contact forces,the force at the bonds with a higher stiffness may be noticeably larger than the counterpart at softer contact.This will yield a specific crack path propagating along the stiffer contacts rather than forming a broad crack zone observed in the homogeneous strength model,therefore the growth rate of axial strain is much lower in the heterogeneous stiffness model.
3.3.AE characteristics: calibration and sensitivity analysis
The AE characteristics are recorded in different numerical schemes,the data of AE in laboratory test are used to calibrate and assess the simulation results.Fig.13 plots the evolution of AE events subject to eight numerical schemes in which tensile strength is the controlled parameter.The red symbols are the laboratory data and the black ones are numerical results.Fig.13 shows that with the growth of heterogeneity in tensile strength in both two distributions, the pattern of cumulative AE counts better matches the laboratory data;the evident increase of AE counts no longer occurs merely at the quite late phase.The pattern of“initial rise”and“step rise”respectively at the early phase of loading and at the moment of stress elevation are well reproduced and characterized in Fig.13d and h, which are the two most heterogeneous models in two distribution patterns.This signifies that the high heterogeneity in tensile strength is favorable to the reproduction of the realistic behavior of cumulative AE counts.The simulation results in Fig.13e and h also succeed in displaying the stress-level dependent growth rate of cumulative AE counts.A higher growth rate of AE counts incurred by a higher stress level is clearly expressed via a steeper slope.Although the discrepancies in stress-strain relationship among the eight schemes are marginal in Fig.9, the simulation results of different schemes can be readily assessed in terms of AE behaviors.The AE behaviors in numerical simulation exposed to different schemes of heterogeneous cohesion are shown in Fig.14.A conclusion can be drawn which resembles the one reported in Fig.13:higher heterogeneity of cohesion can yield a more realistic AE behavior in cumulative AE counts, albeit the simulation results subject to the heterogeneous of cohesion are slightly inferior to the cases of heterogeneous tensile strength in Fig.13.This indicates that, as a strength-related microparameter, the heterogeneity of tensile strength is more sensitive than cohesion in determining the increase of AE counts under multi-level compressive cyclic loading.Based on the simulation results of the two strength-related parameters in Figs.13 and 14, it is obvious that the higher heterogeneity in tensile strength and cohesion is beneficial to match the laboratory results in numerical simulation.In summary, either uniform or Weibull distribution is strongly recommended to adopt to assign the strength parameters in simulating the mechanical behaviors and AE characteristics of sandstones under cyclic loading.
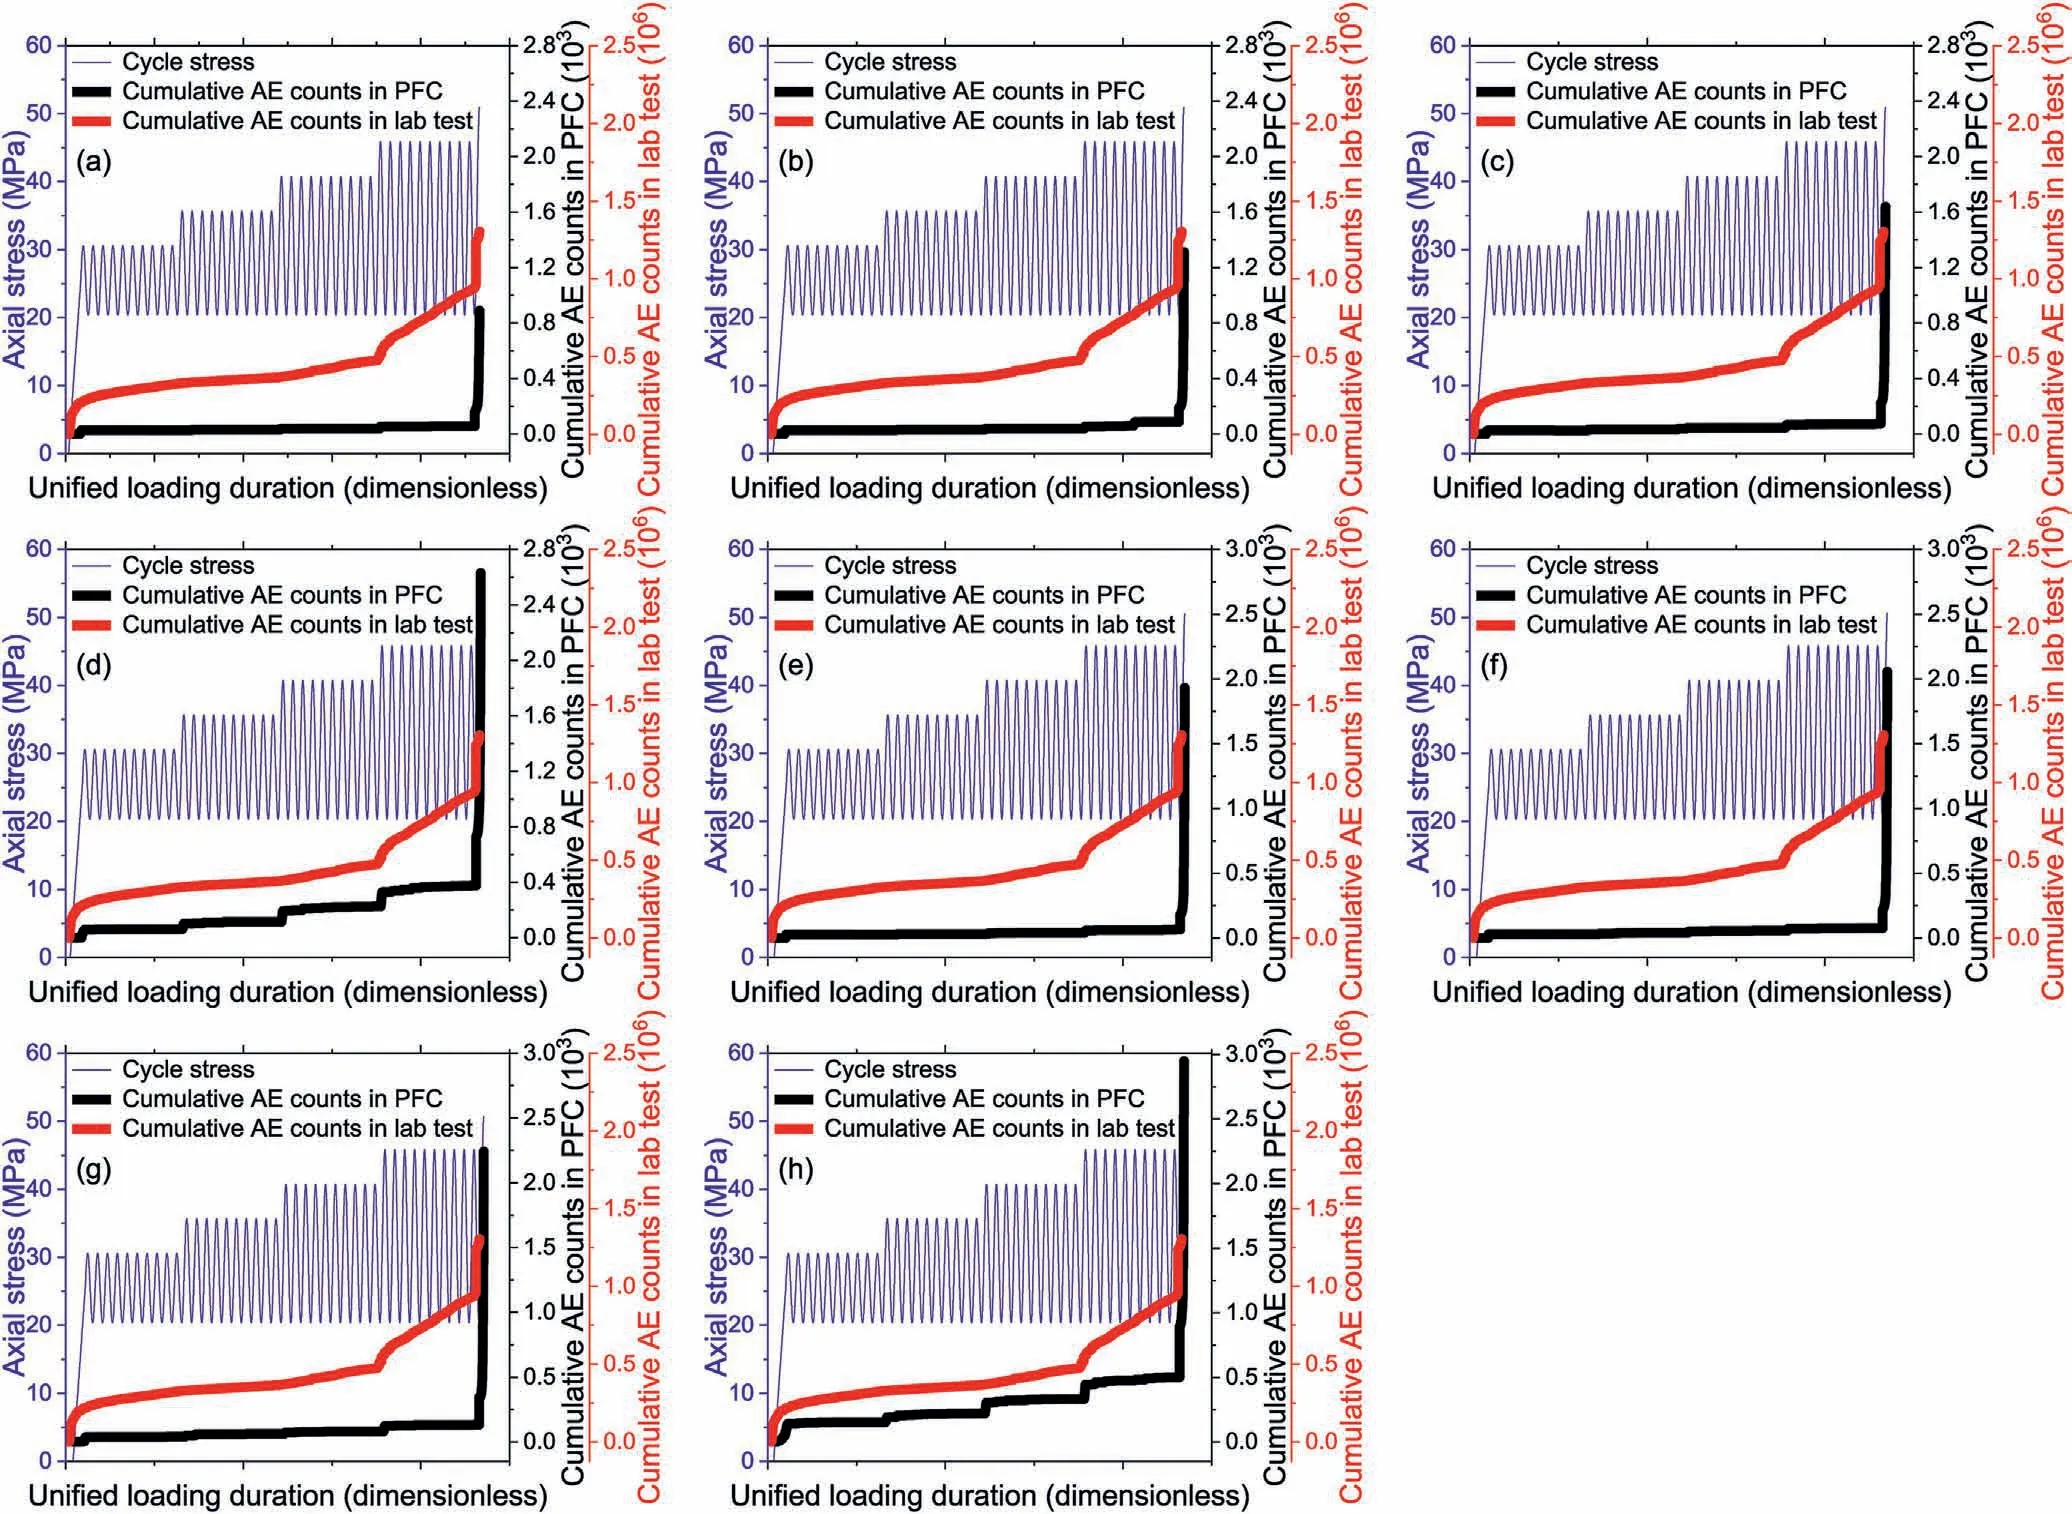
Fig.14.Comparisons of AE events evolution in eight numerical schemes with different values of cohesion (c).Uniform distribution: (a) Scheme A (homogeneous), (b) Scheme B(slightly heterogeneous), (c) Scheme C (moderately heterogeneous), and (d) Scheme D (highly heterogeneous); Weibull distribution: (e) Scheme E (extra-slightly heterogeneous,m = 25), (f) Scheme F (slightly heterogeneous, m = 10), (g) Scheme G (moderately heterogeneous, m = 5), and (h) Scheme H (highly heterogeneous, m = 2.5).
The effect of heterogeneous stiffness parameters on cumulative AE counts are presented in Figs.15 and 16.The heterogeneities of parallel bond normal stiffness and linear stiffness have limited impacts on the evolution pattern of cumulative AE counts, even under the cases of high heterogeneity (e.g.Fig.15d, h and Fig.16d and h).The evident discrepancies are still observed between the laboratory data and numerical results.This implies that when the assembly’s UCS is fixed, the implementation of heterogeneous stiffness parameters has insignificant impacts on AE counts growth and will not apparently impact the evolution pattern of cumulative AE counts.However, the heterogeneity of stiffness parameters has apparent influence on the total AE counts at failure.Specifically,more microcracks will be generated in the case of higher heterogeneity in stiffness.This implies that the heterogeneous stiffness parameters moderately facilitate the generation of microcracks with the step rise of cyclic stress.In brief, the heterogeneous stiffness parameters will incur an intensive cracking behavior shortly preceding the failure which much resembles the homogeneous and deviates from the pattern of cumulative AE counts obtained in laboratory test.The implementation of stiffness heterogeneity is still recommended regardless of limited impacts on cumulative AE counts.The compositional inhomogeneities of minerals in terms of stiffness and hardness can be explicitly characterized via this approach.It can be summarized as follows: in terms of AE characteristics, the ranking of the influence weight of the four parameters are: tensile strength (στ) >cohesion (c) >parallel bond stiffness(k′n)≈linear stiffness(kn).Based on the results revealed by Figs.9-14, Table 6 presents the comparisons of the effects of homogenous and heterogeneous models.

Fig.15.Comparisons of AE events evolution in eight numerical schemes with different values of parallel bond normal stiffness (k′n).Uniform distribution: (a) Scheme A (homogeneous),(b) Scheme B (slightly heterogeneous), (c) Scheme C (moderately heterogeneous), and (d) Scheme D (highly heterogeneous); Weibull distribution: (e) Scheme E (extraslightly heterogeneous,m=25),(f)Scheme F(slightly heterogeneous,m=10),(g)Scheme G(moderately heterogeneous,m=5),and(h)Scheme H(highly heterogeneous,m=2.5).
As shown in Fig.4, three levels of AE events (small, moderate,huge) are classified based on the magnitude of AE energy, the proportions of the three levels of AE events evolve with the variation of stress level.The evolvement of the proportions (percentages)for the three levels of AE events more elaborately unravels the pattern of AE behaviors from the insights of AE energy magnitude.Fig.17 summarizes and presents the evolution of the percentages for three levels of AE events based on the classification used in this work.The result exhibits a “four-phase” characteristic, the pattern for the large and medium events are highly similar whereas the development for the small events displays a quite distinct feature,which almost opposite to the trend for the large and medium events.
The “four-phase” characteristics for the huge and moderate events are as follow:
(1) Initial climb;
(2) Subsequent drop;
(3) Remain almost constant with a marginal decrease; and
(4) Local slight rise prior to failure.
The“four-phase”characteristic for the small events is as follow:
(1) Initial drop;
(2) Subsequent rise;
(3) Almost constant with a marginal increase; and
(4) Local slight fall prior to failure.
Fig.18 shows the evolution of percentage for the three levels of AE events in different numerical schemes of various distributions of tensile strength.The data presented in Fig.18d and h best match the result of laboratory test, the aforementioned “four-phase” characteristic is well reproduced in these two cases which represent the higher extent of heterogeneity.In addition, the corresponding values of the proportion in the third phase shown in Fig.18d and h are quite close to the values documented in Fig.17.This one more time corroborates that the heterogeneity of tensile strength can better replicate the results of AE characteristics not only in terms of cumulative counts but also in the proportion of the three levels of events during cyclic loading.For other cases in Fig.18,the results of low heterogeneity or homogeneous model failed to reproduce the“four-phase” characteristic, especially the missing of the fourth phase,without similar local drop or increase observed,see Fig.18a,b,e and f.Furthermore,the values in the third phase do not match the counterpart in the laboratory test and the slopes for rise and decline are much steeper than those in laboratory test.In summary,the high heterogeneity model in both two distributions have the best performances in reproducing the evolution of the proportions of AE events during cyclic loading.The proportions of three levels of AE events are poorly displayed in the homogeneous and slightly heterogeneous models.The evolution of the event proportion of different schemes for cohesion is illustrated in Fig.19.A similar conclusion with respect to the tensile strength can be drawn: the results corresponding to the highly heterogeneous cohesion model in two distributions yield the greatest simulation performances.More precisely speaking,the result in Fig.19h exposed to the highly heterogeneous model of Weibull distribution is slightly better than that in Fig.19e which adheres to the uniform distribution.This suggests that the highly heterogeneous cohesion model following a Weibull distribution is optimal to reproduce the proportion evolution of different levels of AE events.It is manifest that the heterogeneity and distribution patterns of strength-related parameters are notably influential to the evolution of proportion for the different levels of AE events under cyclic loading.The way of parameter assignment in Schemes D and H is advised to adopt to best match the laboratory results.

Fig.16.Comparisons of AE events evolution in eight numerical schemes with different values of linear stiffness(kn).Uniform distribution:(a)Scheme A(homogeneous),(b)Scheme B(slightly heterogeneous),(c)Scheme C(moderately heterogeneous),and(d)Scheme D(highly heterogeneous);Weibull distribution:(e)Scheme E(extra-slightly heterogeneous,m = 25), (f) Scheme F (slightly heterogeneous, m = 10), (g) Scheme G (moderately heterogeneous, m = 5), and (h) Scheme H (highly heterogeneous, m = 2.5).

Table 6 Comparison of the effects of homogenous and heterogeneous models.
The developments of proportions for three levels of AE events subject to the heterogeneous stiffness parameters (k′nand kn) are plotted in Figs.20 and 21.The results show that the implementation of heterogeneous stiffness parameters leads to the “four-phase”characteristic which is a typical pattern observed in the laboratory test.However, the proportions for the three levels of AE events in different phases are remarkably inconsistent with the values documented in laboratory test.This implies that the assignment of heterogeneous stiffness under fixed strength parameters is not adequately effective to reproduce the results of proportions of three levels of AE events when subjected to the multi-level cyclic loading.The characteristics of AE events from the insights of energy magnitude are barely dependent on stiffness heterogeneity.The marginal discrepancies in AE events proportion between different numerical schemes (Figs.20 and 21) imply that the impact of stiffness heterogeneity on the magnitude of AE energy is insignificant.This conclusion resembles the one drawn based on Figs.13-16.In summary,the heterogeneity of strength-based parameter has a more intensive impact on AE characteristics (cumulative counts,AE energy) than that of stiffness parameter.
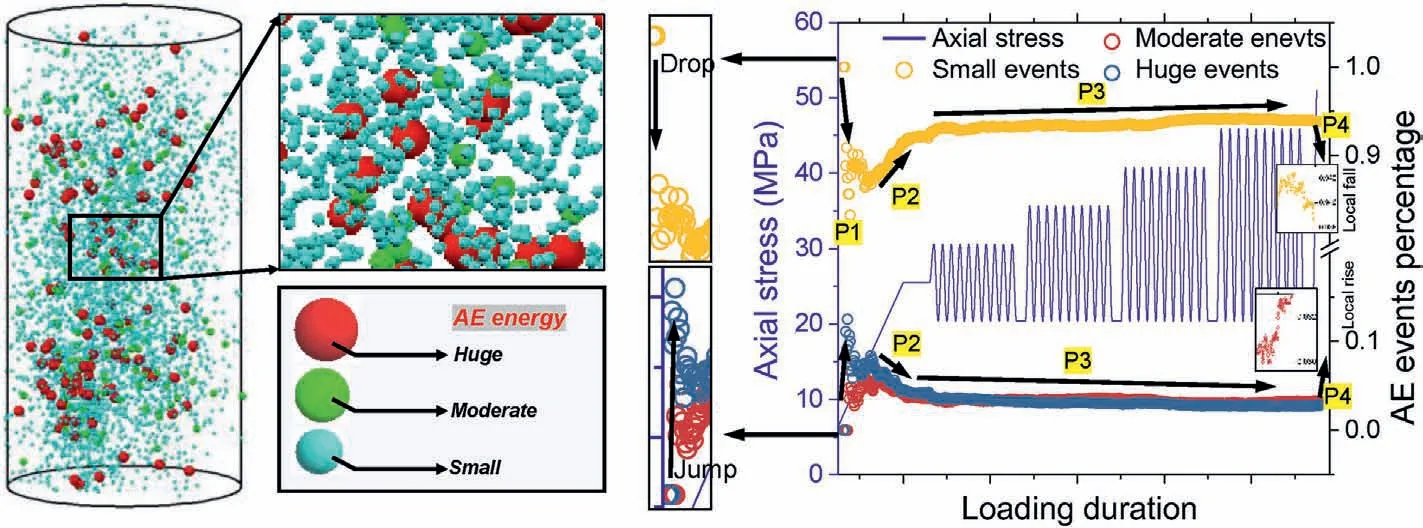
Fig.17.Evolution of the percentage of three levels of AE events (small, moderate and huge events).

Fig.18.Evolution of the percentage of three levels of AE events in eight numerical schemes with different values of tensile strength (στ).Uniform distribution: (a) Scheme A(homogeneous), (b) Scheme B (slightly heterogeneous), (c) Scheme C (moderately heterogeneous), and (d) Scheme D (highly heterogeneous); Weibull distribution: (e) Scheme E(extra-slightly heterogeneous,m=25),(f)Scheme F(slightly heterogeneous,m=10),(g)Scheme G(moderately heterogeneous,m=5),and(h)Scheme H(highly heterogeneous,m = 2.5).

Fig.19.Evolution of the percentage of three levels of AE events in eight numerical schemes with different values of cohesion (c).Uniform distribution: (a) Scheme A (homogeneous), (b) Scheme B (slightly heterogeneous), (c) Scheme C (moderately heterogeneous), and (d) Scheme D (highly heterogeneous); Weibull distribution: (e) Scheme E (extraslightly heterogeneous,m=25),(f)Scheme F(slightly heterogeneous,m=10),(g)Scheme G(moderately heterogeneous,m=5),and(h)Scheme H(highly heterogeneous,m=2.5).
Fig.22 presents the statistic relations between heterogeneity extent and the values of microparameters.Fig.22a-d presents the average values of the parameters versus the heterogeneity extent of model in uniform distribution which is characterized via the ratio of the minimum parameter to the counterpart in the homogeneous model.The results imply that the correlations between strength and stiffness parameters versus the heterogeneity extent follow an opposite pattern.For the strength parameters(tensile strength and cohesion), the average value of the parameter in the model with higher heterogeneity is moderately larger than the counterpart with slightly heterogeneous or homogeneous models.This indicates a moderate increase in strength parameter is essential to adopt to match the similar UCS.Whereas for the stiffness parameters, a lower average value is used in the highly heterogeneous model which holds an opposite tendency with respect to the strength parameter.For Weibull distribution, the heterogeneity of the model is indicated via the shape parameter m and the average value of parameter used in the uniform distribution is replaced by P0which is the value of a microparameter determined in the nominal homogeneous model.The interrelation between P0and m generally coincides with the one revealed in Fig.22a-d,where the strength and stiffness parameters hold the opposite tendency.The findings presented in the Fig.22 can provide a practical guidance to the assignment of heterogeneous microparameters in PFC-based simulation.

Fig.20.Evolution of the percentage of three levels of AE events in eight numerical schemes with different values of parallel bond stiffness(k′n):Uniform distribution:(a)Scheme A(homogeneous), (b) Scheme B (slightly heterogeneous), (c) Scheme C (moderately heterogeneous), and (d) Scheme D (highly heterogeneous); Weibull distribution: (e) Scheme E(extra-slightly heterogeneous,m=25),(f)Scheme F(slightly heterogeneous,m=10),(g)Scheme G(moderately heterogeneous,m=5),and(h)Scheme H(highly heterogeneous,m = 2.5).
Fig.23 shows the spatial distribution of AE events with visualization of different magnitudes of energy at indicated eight selected time points (A-H).The results are presented mainly from the models exposed to the distribution of the two strength-related parameters (i.e.tensile strength and cohesion).The models with the lowest and highest heterogeneity under the two distribution patterns are illustrated together with the laboratory results(Fig.23a).The results in the homogeneous (Fig.23b) and slightly heterogeneous models with Weibull distribution(m=25)failed to reproduce the massive small AE events generated ahead of the 4th time point.The laboratory data clearly show that the small AE events have already occurred intensively since the 2nd time point.This behavior has been partially reproduced in the highly heterogeneous models under both two distribution patterns(Fig.23c,e,g and h).More precisely, the simulation performance in the case of heterogeneous tensile strength is slightly superior to the impact of cohesion heterogeneity due to a better match in terms of AE events.The AE events with the huge energy (red sphere) occurred at the initial phase of the cyclic loading (since the 1st time point) are noticed at the bottom contact between the assembly and loading platen.This behavior also works in the laboratory test,where some huge AE events (red spheres) were observed at the top surface.Even though these huge AE events are noticed at the top and bottom surfaces of the sample respectively, they all are possibly incurred by the friction induced shear stress concentration at the contact between loading platen and rock sample.The localized concentrated stress may result in the large magnitude of energy released at failure.
4.Discussion
The simulation results in our study demonstrate that the highly heterogeneous strength parameters(tensile strength and cohesion)complying with Weibull and uniform distributions both exhibit the good performances in reproducing the laboratory results particularly in terms of AE behaviors.The two most recommended schemes (i.e.Schemes D and H) provide the explicit distribution parameters corresponding to the Weibull and uniform distributions which can be applied to the similar cases in following study.When m = 2.5 in Weibull distribution, a compromise between computational cost and diverse minerals characterization can be reached.The good consistency with respect to the laboratory data in stressstrain relationship and AE behaviors has substantially corroborated the scheme.The similar values of m [2, 4] can be also referred to Wang et al.(2019)where m=3.5 is used in FLAC3Dto characterize the elastic modulus of rocks.Compared with the effect of particle size distribution earlier found in Ding et al.(2014), the investigations of strength and stiffness microparameters exposed to uniform distribution in PFC are still not commonly reported in cyclic loading so far.Our recent study (Song et al., 2023) has revealed preliminary findings.Based on the results in this work,the criterion proposed to choose the best scheme in uniform distribution is to set the lower bound of a given heterogeneous parameter to be equal to the quarter of the value in homogeneous model.In this case,the ratio of δmax/δminfor strength parameter is close to 10 and for stiffness parameter is close to 7 in our study (Table 3).the results presented in Fig.1 show that the minerals in rocks can also hold a similar value in Mohs hardness ratio (e.g.Quartz/Talc = 7).This further verifies the rationality of the criterion of heterogeneous parameter assignment.

Fig.21.Evolution of the percentage of three levels of AE events in eight numerical schemes with different values of linear stiffness (kn).Uniform distribution: (a) Scheme A(homogeneous), (b) Scheme B (slightly heterogeneous), (c) Scheme C (moderately heterogeneous), and (d) Scheme D (highly heterogeneous); Weibull distribution: (e) Scheme E(extra-slightly heterogeneous,m=25),(f)Scheme F(slightly heterogeneous,m=10),(g)Scheme G(moderately heterogeneous,m=5),and(h)Scheme H(highly heterogeneous,m = 2.5).
5.Conclusions
The primary motivation of the work is to numerically reveal the effect of heterogeneous microparameters on rock’s failure and micro-seismic behaviors in PFC.The Weibull and uniform distributions were used to distribute the strength and stiffness microparameters.Thirty-two sets of numerical schemes were modelled by incorporating the different extents of heterogeneity of four critical microparameters (i.e.tensile strength, cohesion, bond normal stiffness and linear stiffness).The simulation results are calibrated with the pattern of hysteresis loop and AE data in laboratory test.The conclusions can be drawn as follows:
(1) An efficient numerical method for modeling rock heterogeneity by implementing the uniform and Weibull distributions is proposed based on PFC3D.It provides a labor-saving solution to the general characterization of compositional inhomogeneities of minerals in the crystal- or grain-scale.
(2) The models with the highly heterogeneous tensile strength and cohesion (i.e.Schemes D and H) are highly recommended due to the excellent match with the laboratory data in terms of stress-strain relationship and AE behaviors.The impact of stiffness heterogeneity shows a less pronounced effect on AE behaviors and the evolution of microcracks.
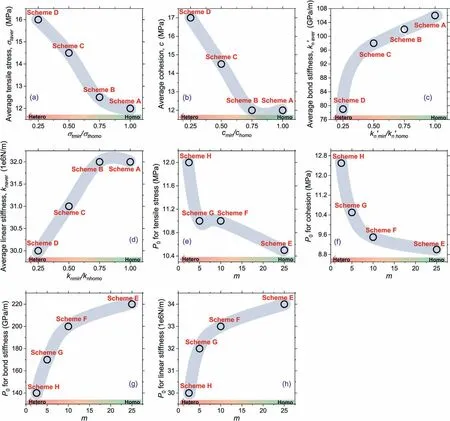
Fig.22.Relations between model heterogeneity and microparameters.Uniform distribution: (a)Average tensile strength versus model heterogeneity,(b)Average cohesion versus model heterogeneity, (c) Average bond stiffness versus model heterogeneity, and (d) Average linear stiffness versus model heterogeneity; Weibull distribution: (e) P0 for tensile strength versus m, (f) P0 for cohesion stress versus m, (g) P0 for bond stiffness versus m, and (h) P0 for linear stiffness versus m.Note: σtmin, cmin, k’nmin, knmin refer to the lower bounds of bond strength,cohesion,parallel bond stiffness and linear stiffness in uniform distribution;and σthomo,chomo,k’homo,khomo refer to the value of bond strength,cohesion,parallel bond stiffness and linear stiffness in homogenous model.
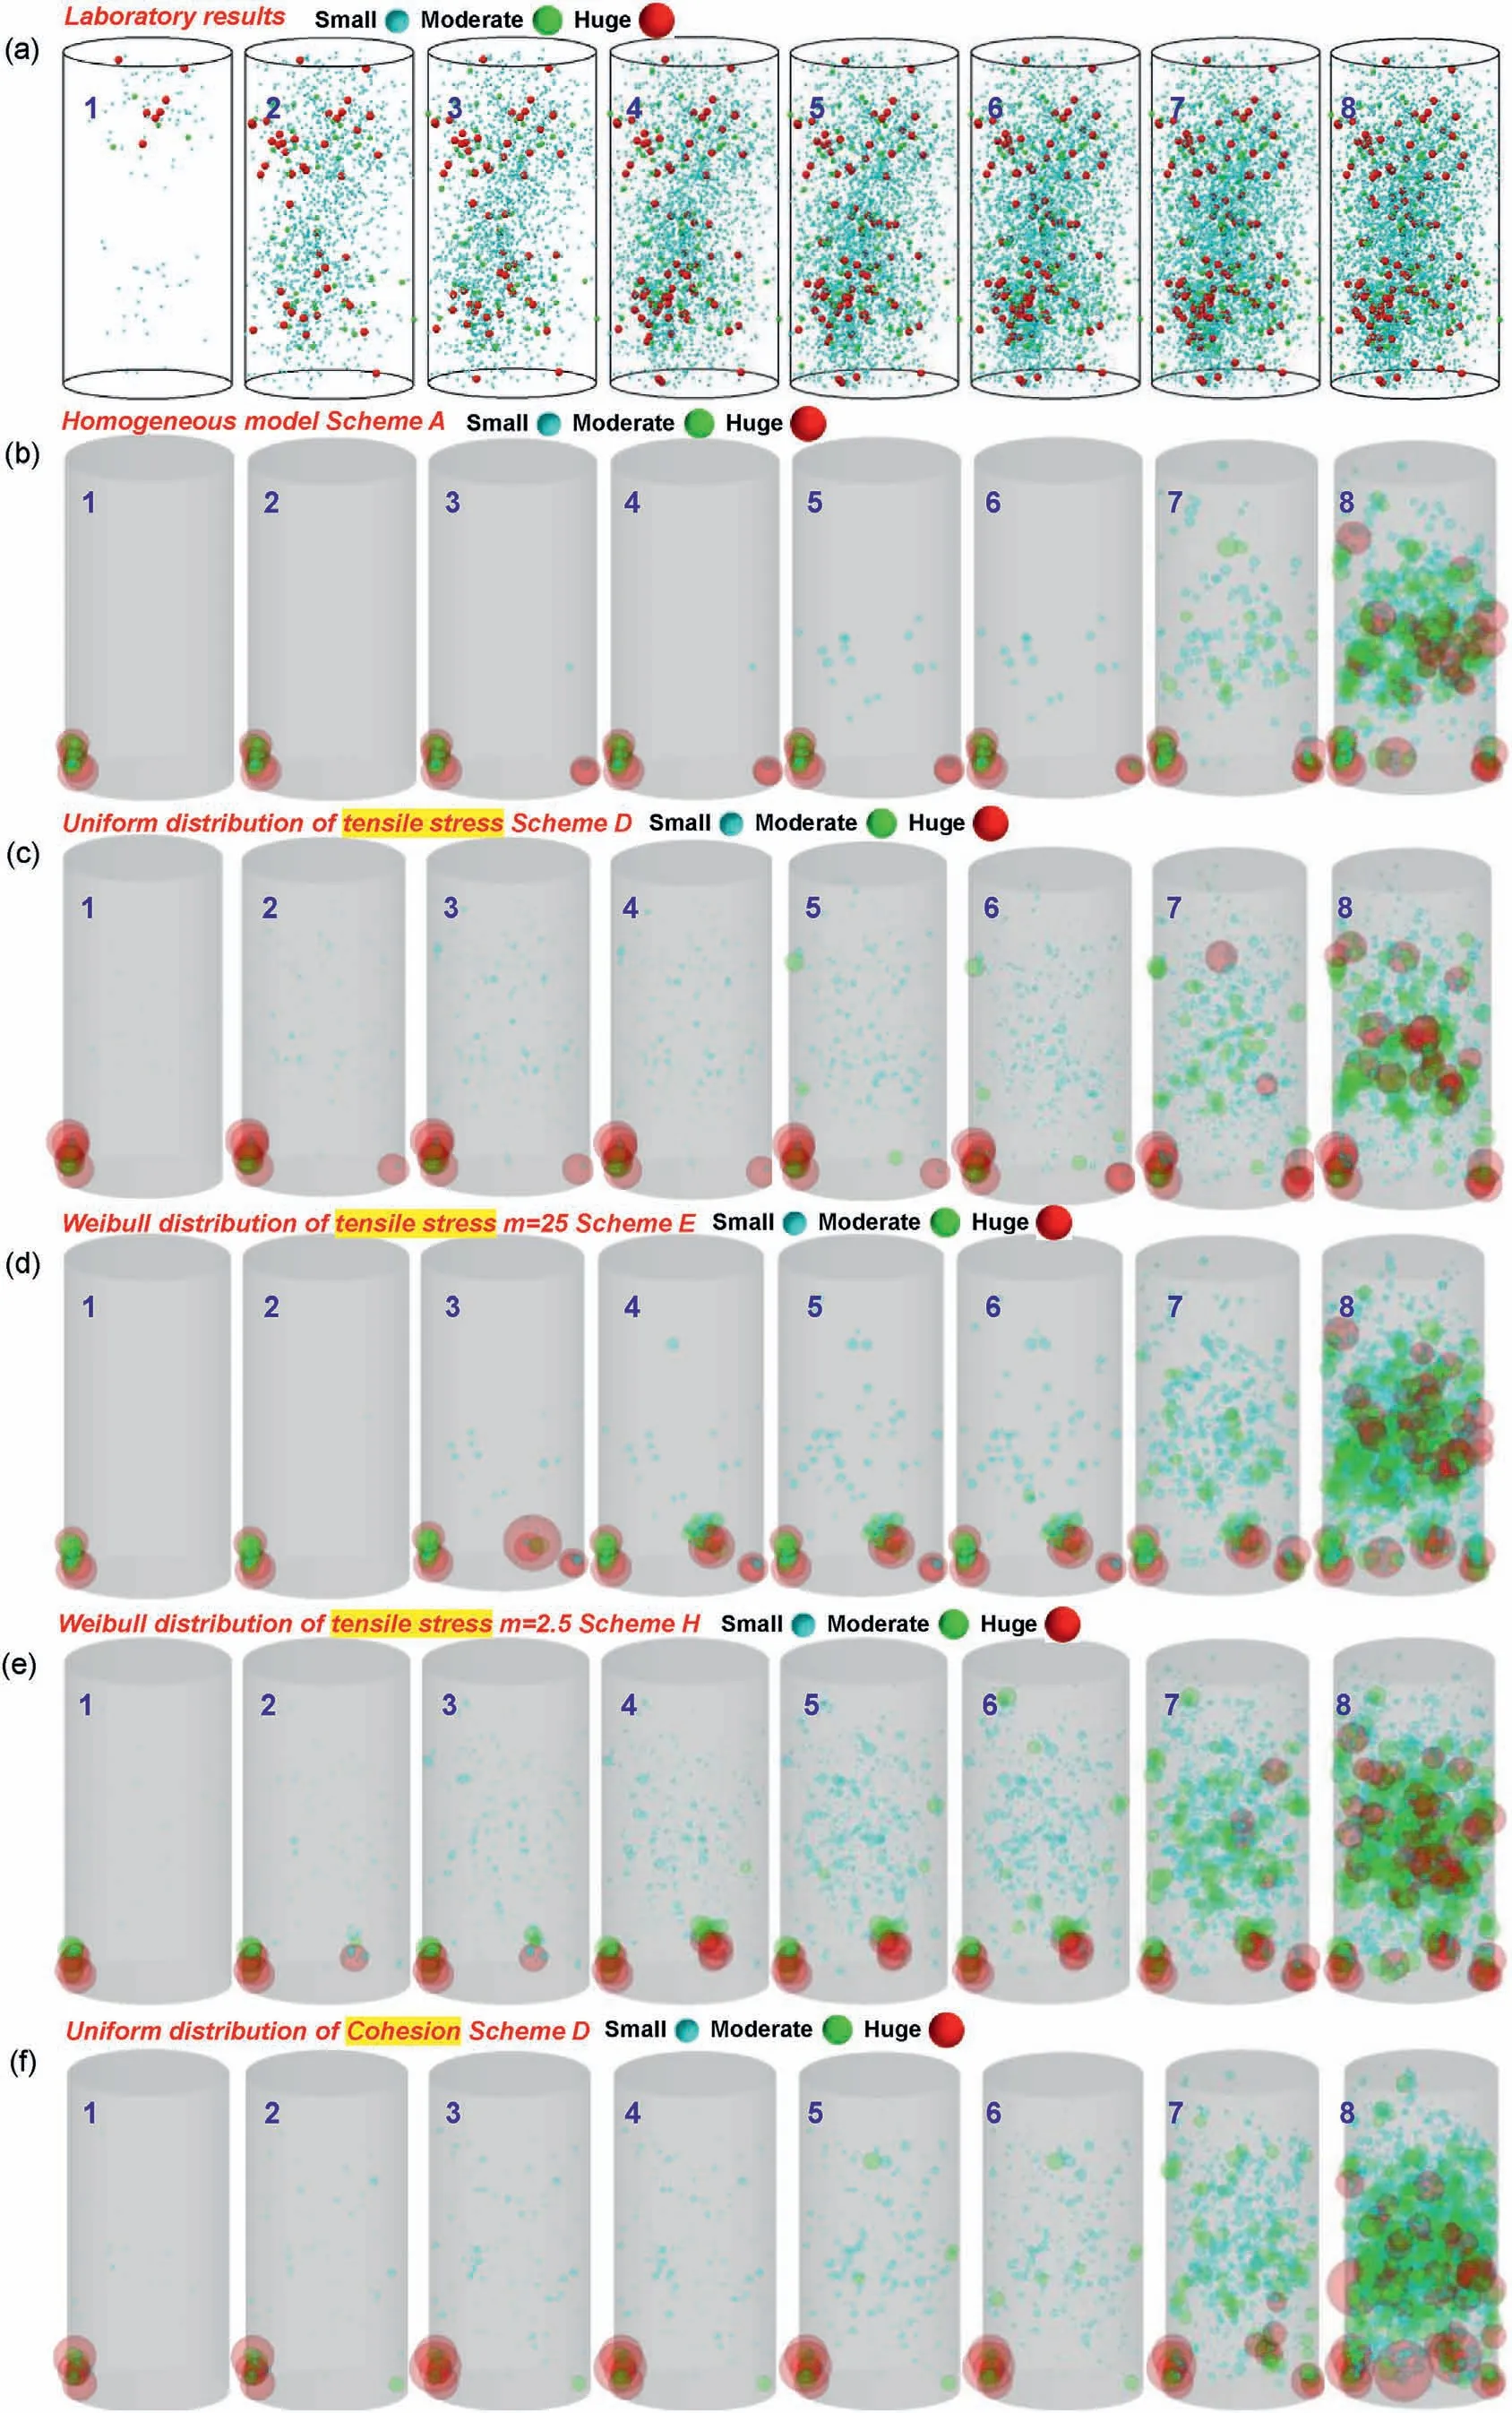
Fig.23.Distributions of three levels of AE events at the eight time points:(a)Laboratory test;(b)Homogeneous model;(c)Uniform distribution of tensile strength,Scheme D;(d)Weibull distribution of tensile strength,Scheme E;(e)Weibull distribution of tensile strength,Scheme H;(f)Uniform distribution of cohesion,Scheme D;(g)Weibull distribution of cohesion, Scheme E; and (h) Weibull distribution of cohesion, Scheme H.
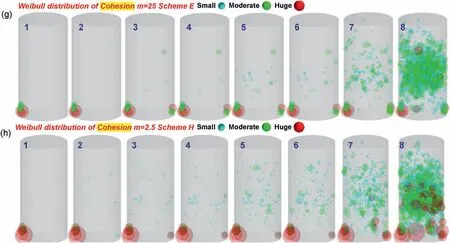
Fig.23.(continued).
(3) For the Weibull distribution, the shape parameter m is suggested to set to 2.5.For the uniform distribution,the bottom limit of the parameter is recommended to set to a quarter of the counterpart determined in the homogeneous model.
(4) For the strength parameters,the average value in the higher heterogeneity model is larger than the one in slightly heterogeneous model.Whereas for stiffness parameters,a lower average value is found in the higher heterogeneous model which displays an opposite tendency.
Declaration of competing interest
The authors declare that they have no known competing financial interests or personal relationships that could have appeared to influence the work reported in this paper.
Acknowledgement
This article is funded by the Funds from Joint National-Local Engineering Research Center for Safe and Precise Coal Mining(Grant No.EC2021004).
List of symbols

 Journal of Rock Mechanics and Geotechnical Engineering2023年10期
- Journal of Rock Mechanics and Geotechnical Engineering的其它文章
- A true triaxial strength criterion for rocks by gene expression programming
- Key issues in water sealing performance of underground oil storage caverns: Advances and perspectives
- Wetting-drying-freezing-thawing cycle effect on the hydro-mechanical behaviour of Yanji swelling mudstone
- Capability of discrete element method to investigate the macro-micro mechanical behaviours of granular soils considering different stress conditions and morphological gene mutation
- Permeability evolution mechanism and the optimum permeability determination of uranium leaching from low-permeability sandstone treated with low-frequency vibration
- Numerical analysis of bending property of bi-modulus materials and a new method for measurement of tensile elastic modulus
