Deformation mechanism,orientation evolution and mechanical properties of annealed cross-rolled Mg-Zn-Zr-Y-Gd sheet during tension
Xia Lin,Zhiyong Chen,Jianbo Shao,Jiangying Xiong,Zhang Hu,Chuming Liu
School of Materials Science and Engineering,Central South University,Changsha 410083,China
Abstract Mg-6.75Zn-0.57Zr-0.4Y-0.18Gd (wt.%) sheet with typical basal texture was produced by cross rolling and annealing.Room temperature tensile tests were subsequently conducted along rolling direction (RD),transverse direction (TD),and diagonal direction (RD45).Deformation mechanism and orientation evolution during the tension were investigated by quasi-in-situ electron backscatter diffraction observation and in-grain misorientation axis analysis.The results indicate that the activation of deformation mechanism mainly depends on the initial grain orientation.For RD sample,prismatic slip plays an important role in the deformation of grains with <0001> axis nearly perpendicular to the RD.With the <0001> axis gradually tilted towards the RD,basal slip becomes the dominant deformation mode.After the tensile fracture,the initial concentrically distributed {0001} pole is split into double peaks extending perpendicular to the RD,and the randomly distributed {100} pole becomes parallel to the RD.The evolution in {0001} and {100} poles during tension is related to the lattice rotation induced by basal slip and prismatic slip,respectively.TD and RD45 samples exhibit similar deformation mechanism and orientation evolution as the RD sample,which results in the nearly isotropic mechanical properties in the annealed cross-rolled sheet.
Keywords: Magnesium alloys;Deformation mechanism;Orientation evolution;Mechanical properties.
1.Introduction
As the lightest metallic structural materials,magnesium(Mg) and its alloys have attracted extensive interest for their potential weight-saving applications in the automotive,electronics,and aerospace industries [1–3].However,due to the limited available slip system provided by hexagonal crystal packed (hcp) structure,Mg alloys generally exhibit poor formability at room temperature,which restricts their practical applications [4].Besides,the strong texture developed in wrought Mg alloys usually brings about severe mechanical anisotropy,which further deteriorates the formability of Mg alloys [5–6].Therefore,weakening the mechanical anisotropy is of great significance to expanding the applications of Mg alloys.
Over the past decades,many studies have pointed out that initial texture has a great influence on the mechanical anisotropy of Mg alloys [7–11]In the beginning,reducing texture intensity was considered an effective way to weaken the mechanical anisotropy.Chen et al.[7]studied the influence of rolling direction on mechanical anisotropy and found that the cross-rolled Mg-Zr-Cd sheet exhibited lower texture intensity compared with that in the unidirectional-rolled sheet,and lower mechanical anisotropy was achieved in the crossrolled sheet.Zhang et al.[8]investigated the effect of alloying elements (Ca and Gd) on mechanical anisotropy and pointed out that the addition of Gd and Ca elements could weaken the basal texture of the rolled Mg-3Al sheet,thereby weakening the mechanical anisotropy.However,it is still difficult to achieve planar mechanical isotropy only by reducing texture intensity.Until Pan et al.[9]took the distribution of initial texture into consideration and found that compared with the RD (rolling direction)-tilted texture,the sheet with<0001>axis evenly distributing on a circle around ND (normal direction) exhibited a completely removed planar mechanical anisotropy.Subsequently,the relationship among the initial texture distribution,deformation mechanism,and mechanical anisotropy attracted extensive attention.Zhao et al.[12]investigated the deformation mechanism of extruded Mg-Li sheet with a TD (transverse direction)-split texture during the tensile deformation.It showed that prismaticslip was the dominant deformation mode when the tensile direction is parallel to the extrusion direction (ED),and higher yield strength was obtained.When the tensile direction is parallel to TD,basalslip and {102} twinning played key roles in deformation,and a larger elongation was achieved.Zhang et al.[13]pointed out that the activation of deformation mode is related to the<0001>axis tilt angleα(the angle between<0001>axis and tensile direction).The severe mechanical properties anisotropy in Mg-Zn-Gd sheet resulted from the different deformation mechanism in different tensile directions,which stemmed from the asymmetric texture.So far,great efforts have been devoted to establishing the correlation among initial texture,deformation mechanism,and mechanical anisotropy [7,14–15].However,most of these investigations are based on the Schmid factor analysis of the initial grains,the actual activated deformation mechanism during the tensile deformation is still not well understood.Besides,crystal orientation evolution during the tensile deformation also attracts significant attention.Especially,the twinning-induced orientation evolution has been extensively studied in the past years[16–18].However,the slip-induced orientation evolution is still not well elaborated.To further understand and reduce the anisotropy of rolled Mg alloy sheets,it is necessary to investigate the actual active deformation mechanism during tensile deformation.And a deep understanding of the grain orientation evolution during the tensile deformation should be established.
In this study,an annealed cross-rolled Mg-6.75Zn-0.57Zr-0.4Y-0.18Gd sheet was employed as the starting material.Deformation mechanism and associated orientation evolution during tensionwere investigated by quasi-in-situelectron backscatter diffraction observation (EBSD) and in-grain misorientation axis(IGMA)analysis.Combined with the analysis results and Schmid factor distribution,the influence of initial orientation on deformation behavior was clarified.Meanwhile,slip-induced orientation evolution during tensile deformation was also elaborated.
2.Material and experimental methods
The starting material is an annealed cross-rolled Mg-6.75Zn-0.57Zr-0.4Y-0.18Gd (wt.%) sheet.The sheet was initially cut from the as-received forged block with a dimension of 113 mm × 95 mm × 13 mm,and then cross rolled at 425 °C with a total reduction of 90%.Prior to cross rolling,the sheet was preheated at 425 °C for 30 min to equalize the temperature.After each rolling pass,the sheet was returned to the furnace and reheated at rolling temperature for 15 min to maintain the rolling temperature.The rolling direction was changed by 90° around the normal direction after each pass,as schematically illustrated in Fig.1.After rolling,the rolled sheet was annealed at 400 °C for 1 h followed by water quenching.For the convenience of description,the rolling direction,transverse direction,and normal direction of the first rolling pass are defined as the RD,TD,and ND,respectively.After rolling and annealing,the sheet was composed of equiaxed grains and exhibited a typical basal texture(Fig.2a,b).Referring to the inverse pole figure(IPF)map,the grains were mainly categorized into two groups: the grains with<100>axis near parallel to the RD or<110>axis near parallel to the RD.The grains with<100>/<110>axis deviating from RD less than 15° were picked out and shown in Fig.2c,d.Their corresponding fractions were about 41% and 38%,respectively.
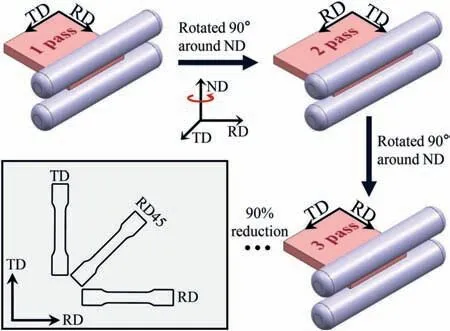
Fig.1.Schematic diagram of rolling path of cross rolling and sampling position for tensile tests.
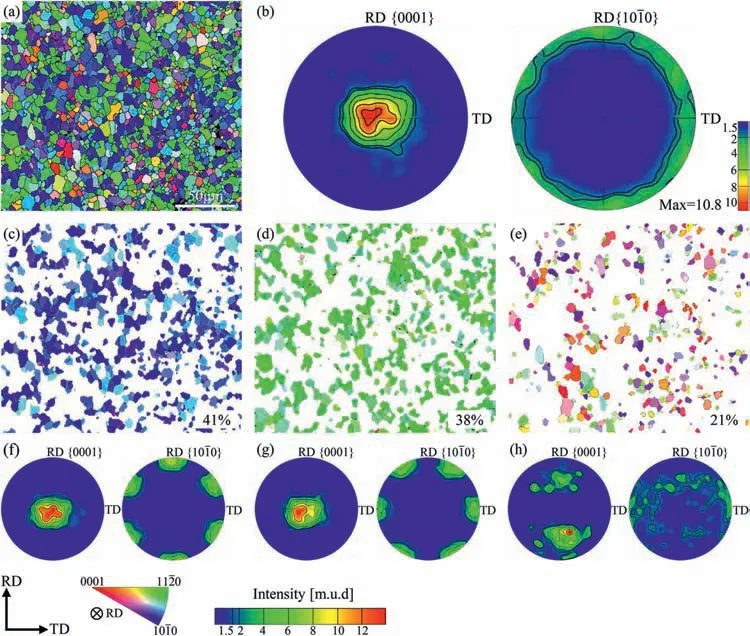
Fig.2.Microstructure of annealed cross-rolled sheet.(a) IPF map colored relative to RD.(b) {0001} and {100} pole figures.IPF map of (c) the grain with<100>// RD,(d) the grain with <100>// RD,(e) the rest of grains.(f-h) corresponding pole figures of (c–e).
Tensile tests were subsequently carried out in the Instron universal testing machine at a load speed of 1 mm/min.The dog-bone shaped samples were machined along RD,TD,and diagonal direction (RD45) with gauge dimensions of 22 mm × 10 mm × 1.3 mm.Yield strength,ultimate tensile strength,and fracture elongation of each direction were obtained based on the average value of three tests.
Microstructure evolution during tension and the fracture morphology were examined by EBSD and scanning electron microscopy (SEM).EBSD measurement was performed with step sizes of 0.6 μm and 0.3 μm using Helios Nano Lab 600i scanning electron microscopy equipped by HKL Technology Channel 5.0 acquisition system.Specimens for EBSD measurement were firstly mechanically ground and followed by electropolishing in a solution consisting of 12 mL perchloric acid,30 mL n–butyl alcohol,and 258 mL alcohol,at -30 °C.
3.Results and discussions
3.1.Microstructure evolution and deformation mechanism during tension
Fig.3 presents the detailed microstructures near the fracture edges of the tensile samples.As shown in the IPF map of the RD sample (the IPF map is colored relative to RD),the initial equiaxed grains were slightly elongated along the tensile axis (TA),and most grains showed an orientation with<100>axis near parallel to TA after tensile fracture.Besides that,significant texture evolution was also observed in Fig.3b.Different from the initial concentrically distributed one,the {0001} pole figure was split into double peaks extending perpendicular to the TA (marked by arrows) after tensile fracture.Simultaneously,the {100} pole figure exhibits six-fold symmetry with one of the {100}poles aligned to the TA.Microstructure evolution of RD45 and TD samples are shown in Fig.3c–f.Coincidently,all the samples present similar grain morphology and texture evolution.According to the statistics in Fig.4,the fraction of the grains with<100>//TA in the three samples significantly increased after deformation,which is almost twice of the grains with<110>axis// TA.All the above results suggest that an obvious orientation evolution has occurred during the tension,and associated details will be further discussed in Section 3.2.
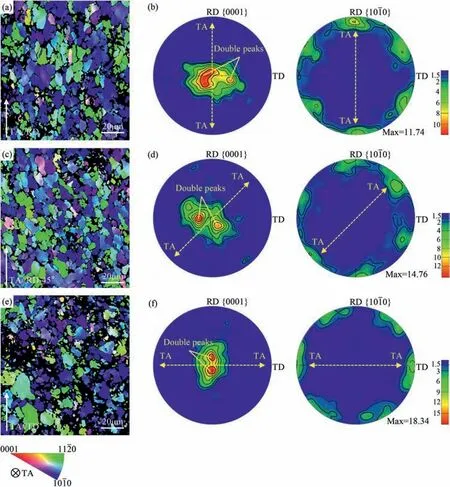
Fig.3.EBSD results of the three tensile samples after the tensile fracture.(a) IPF map (colored relative to TA) and (b) {0001} and {100} pole figures of the RD sample.(c) and (d) for the RD45 sample.(e) and (f) for the TD sample.

Fig.4.The area fraction of the grain with <100> axis// TA and <100>axis// TA in different samples.
Fig.5 gives the SEM images of the fracture surfaces for the three tensile samples.As can be seen,these samples show similar fracture characteristics,which are covered with large and deep dimples and tearing ridges.These characteristics suggest that ductile fracture is the main fracture mechanism in the three samples.Considering the similar microstructure evolution and alike fracture characteristics of the three samples,the RD sample is selected as the representative for further investigation.

Fig.5.SEM images of the fracture surface of (a) RD sample (b) RD45 sample (c) TD sample.

Table ITaylor axes corresponding to the common slip modes in Mg alloys24.
To investigate the activated slip modes during the tension,quasi-in-situEBSD observation and IGMA analysis were performed on the RD sample.Here,IGMA analysis refers to an experimental approach,which identifies the activated slip system by matching the in-grains misorientation axis with the Taylor axis of a given slip mode.The principle of IGMA analysis has been detailly described by Chun et al.,[21]and the Taylor axes of different slip modes in Mg alloys are listed in Table I.As presented in Fig.6a and b,microstructure evolution is analyzed in the same region before and after~2%strain.As can be seen,low angle grain boundaries and slight orientation gradient are found in some grains,indicating the plastic deformation has occurred in these grains.Fig.6c is the Schmid factor distribution for basalslip in {0001}pole figure.Apparently,the grains with<0001>axis tilting away from the TA are favorable for the activation of basalslip.However,when the<0001>axis is near perpendicular to the TA,the activation of basalslip is restricted due to the unfavorable orientation.In order to satisfy the Von Mises criterion,[22]non-basal slip is expected to be activated in these grains.As the common non-basal slip in Mg alloys,prismaticslip generally possesses relatively lower CRSS value than pyramidal
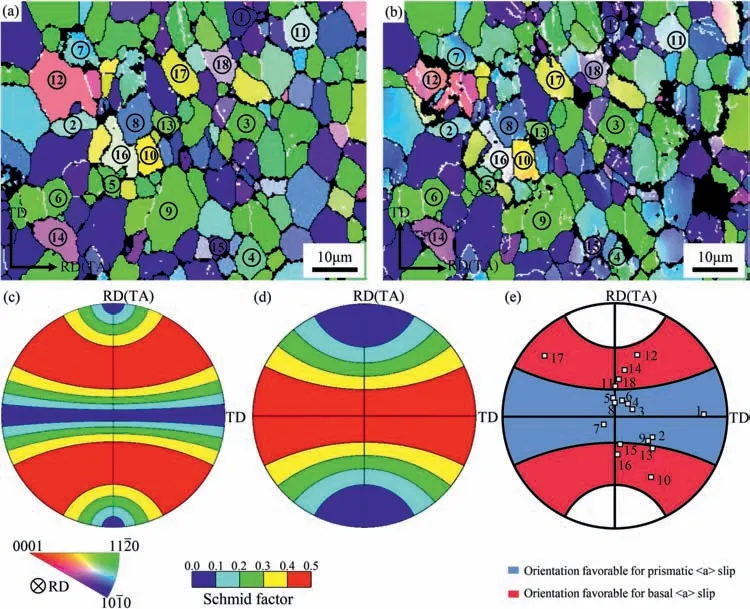
Fig.6.Quasi-in situ EBSD results and Schmid factor distribution.(a) IPF map colored relative to RD before deformation and (b) after 2% strain.Schmid factor distributions of (c) basal slip and (d) prismatic slip in {0001} pole figure.(e) The orientation distribution of Grains 1–18 in {0001} pole figure.
Since most point-point misorientation angles measured in the starting sheet are below 1°,and the misorientation angle higher than 5° is associated with the formation of low angle boundary or kink bands,[25]the IGMA distribution maps are plotted with a misorientation angle between 1° and 5° in this study.As seen from Fig.7a,the initial IGMA distributions of Grains 1–18 are quite different: some grains show uniform IGMA distributions,while some grains show concentrated IGMA distributions.After 2% strain,a remarkable transformation in IGMA distribution is observed (Fig.7b).For grains in the orientation favorable for prismaticslip (Grains 1–9),the IGMA distributions of most grains (Grains 1–6) become concentrated near the<0001>axis.By matching the IGMA with the Taylor axis (Table I),the slip mode activated in Grains 1–6 is determined to be prismaticslip.For grains in the orientation favorable for basalslip (Grains 10–18),the IGMA distributions of most grains(Grains 10–16)transform into a concentrated distribution around the
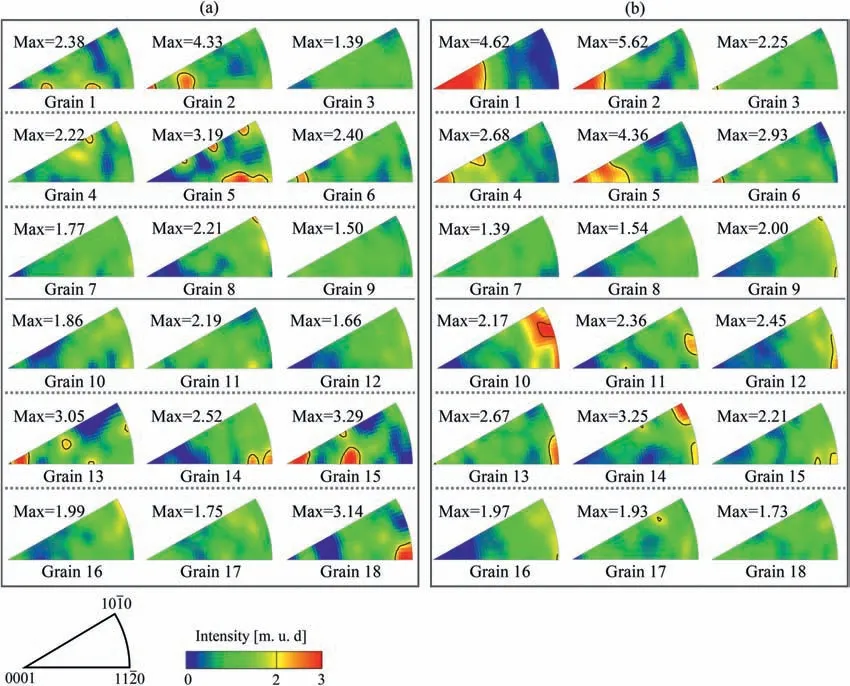
Fig.7.IGMA distributions of Grains 1–18.(a) before deformation and (b) after 2% strain.
Combined with the Schmid factor distribution and the IGMA analysis,it is concluded that the activation of deformation mechanism is significantly influenced by initial grain orientation.Prismaticslip dominates the deformation of the grains with<0001>axis nearly perpendicular to the RD.With the<0001>axis tilted towards the RD,basalslip becomes the dominant deformation mode.In addition,since the annealed cross-rolled sheet has a concentrically distributed {0001} pole,which provides similar initial grain orientation in the three tensile samples,the deformation mechanism of RD45 and TD samples during the tension is likely to be similar to that of RD sample.This speculation is also supported by the alike texture evolution of the three samples (Fig.3).Therefore,the RD sample is selected to investigate the orientation evolution during the tensile deformation.
3.2.Orientation evolution during the tension
As presented in Section 3.1,a significantly orientation change has occurred after the tension.Considering the little effect of the twinning in this study,orientation evolution during the tension is mainly attributed to the slip-induced lattice rotation.Fig.8 shows the quasi-in-situEBSD observation of the representative grains,which are dominated by basalslip.Before deformation,the point-point misorientation angle measured along Line 1 is less than 1° (Fig.8c),which indicates that the orientation of Point 1 and Point 2 is almost consistent (Fig.8d).With the activation of basalslip,the lattice starts to rotate anticlockwise around the<110>axis (Fig.8a),and the maximum misorientation angle along the line 1′exceeds 6° (Fig.8c).Under the effect of lattice rotation,the {0001} pole gradually moves from Point 1′to Point 2′,as shown in Fig.8e.Similar lattice rotation is also observed in Grain B (Fig.8b).For Grain B,the lattice rotation is around<100>axis,which gradually moves the{0001} pole from Point 4′to Point 5′as shown in Fig.8e.Interestingly,the grains dominated by basalslip show a similar orientation evolution,that is,the {0001} pole gradually approaches the ND-TD plane.In fact,it is well known about the face-centered cubic metals that under uniaxial tensile deformation,the crystal will rotate in such a way: the slip direction of the slip system with the largest Schmid factor approaches the tensile direction [26].According to the above rule,for grains dominated by basalslip in Mg alloys,the lattice should rotate around
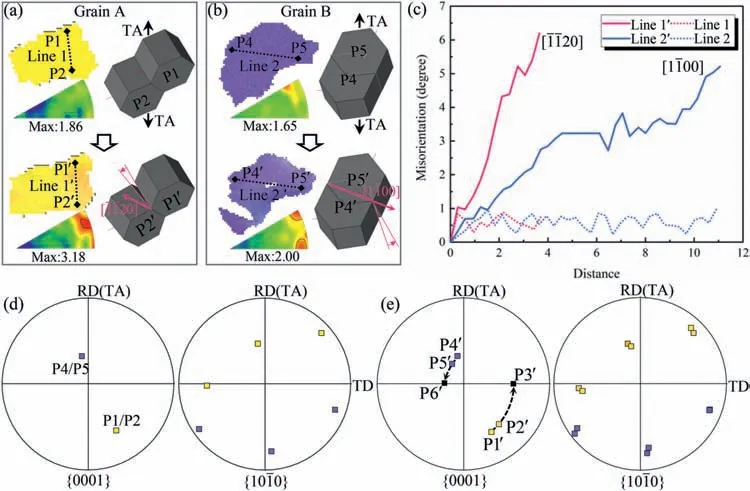
Fig.8.Quasi-in-situ EBSD results of the grains dominated by basal slip.(a-b) IPF maps and lattice rotation of Grain A and Grain B.(c) Misorientation angle distribution along Line 1–2 and Line 1′-2′.Grain orientation (d) before deformation and (e) after 2% strain.
Next,the orientation evolution induced by prismaticslip is discussed.As shown in Fig.9a and d,the grain dominated by prismaticslip presents a clear orientation gradient.Meanwhile,the {100} pole shows obvious extension after deformation (Fig.9b and e).Different from the basalslip,there are three slip planes for prismaticslip,and the Schmid factors of the three slip systems (marked by S1,S2,and S3) are calculated and shown in Fig.9c.Apparently,the S2 slip system possesses the highest Schmid factor and can be activated primarily.With the activation of S2 system,the grain rotates clockwise around the<0001>axis,trying to make the slip direction of S2 system parallel to TA,as shown in Fig.9f.It is expected that the grain will keep rotating until the slip direction of S2 system is parallel to the TA.However,as calculated in Fig.9f,the Schmid factors for S1 and S2 slip systems are decreased during the rotation,while that for S3 slip system is increased.It indicates that the three prismatic slip systems keep competing during the lattice rotation,and associated orientation evolution should be further discussed.
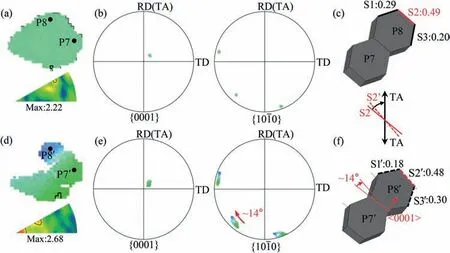
Fig.9.Quasi-in-situ EBSD results of the grain dominated by prismatic slip.(a) IPF map,(b) grain orientation,(c) hexagonal prisms of point 7–8 and the Schmid factors for three slip systems before deformation.(d) IPF map,(e) grain orientation,(f) hexagonal prisms of point 7′-8′ and the Schmid factors for three slip systems after 2% strain.
For the convenience of discussion,it is assumed that the<0001>axis of the grain is perpendicular to TA,and the<100>axis is randomly distributed,which is measured by the angleθ(the angle between the TA and the [10-10]direction).Fig.10a demonstrates the Schmid factors of the three slip systems varying with the angleθ.Fig.10b is a schematic diagram indicating initial grain orientation,active slip system(highlighted by red color),and the direction of lattice rotation.For grain with -30°<θ <0°,S2 slip system possesses appreciable superiority in Schmid factor and becomes the primary slip.By deformation,the grain will rotate in a clockwise direction so that the slip direction of S2 could parallel to TA.Under this rotation,angleθis reduced,which results in the increase of Schmid factor for S3 slip system (Fig.10a).This rotation will keep going untilθ=0°,where the Schmid factor of the S3 slip system becomes equal to S2 slip system.Upon further deformation,a double slip of S2 and S3 slip systems will cause the opposite tendencies of lattice rotation,which finally balance with each other atθ=0° and align the[10-10]direction parallel to TA[27,28].For grain with 0°<θ<30°,the primary slip system is S3 slip system.With the activation of the S3 slip system,the grain will rotate in an anticlockwise direction so that the slip direction of S3 slip system could parallel to TA,which results in a decrease of angleθ.As can be seen in Fig.10a,S3 slip system maintains an obvious advantage untilθ=0°.When the grain rotates toθ=0°,repeat the above situation,a double slip system will finally align the [10-10]parallel to TA.Besides,the situation of grain withθ=±30° is similar to that of grain withθ=0°,in which double slip systems are balanced with each other and align<100>axis parallel to TA.Apart from the situation ofθ=±30°,no matter what the initial orientation is,the grains will finally align the<100>axis parallel to the TA under the lattice rotation induced by prismaticslip.It results in an increase in the fraction of grains with<100>axis// TA orientation (Fig.4) and the formation of {100} pole figure with<100>axis// TA in the three tensile samples (Fig.3).

Fig.10.Schematic diagram of lattice rotation induced by prismatic slip.(a) Relationship between the Schmid factor of prismatic slip systems and angle θ.(b) Lattice rotation induced by prismatic slip in different initial orientations.(S1,S2,S3 indicate the (010) [20] (100) [110],and [010][110]slip system,respectively.)
According to the above results and discussions,the orientation evolution in the three samples can be illustrated in Fig.11.For those grains tilting<0001>axis away from the TA,basalslip dominates the deformation.Basalslip-induced lattice rotation gradually rotates the{0001}plane parallel to the TA,which results in a tighter distribution of {0001} pole accompanied with the formation of “double peaks”.While for those grains near perpendicular to TA,prismaticslip becomes the main slip mode.Under the rotation induced by prismaticslip,most of the grains gradually align<100>axis parallel to TA,which results in the distribution of{100}pole figure with<100>axis//TA.
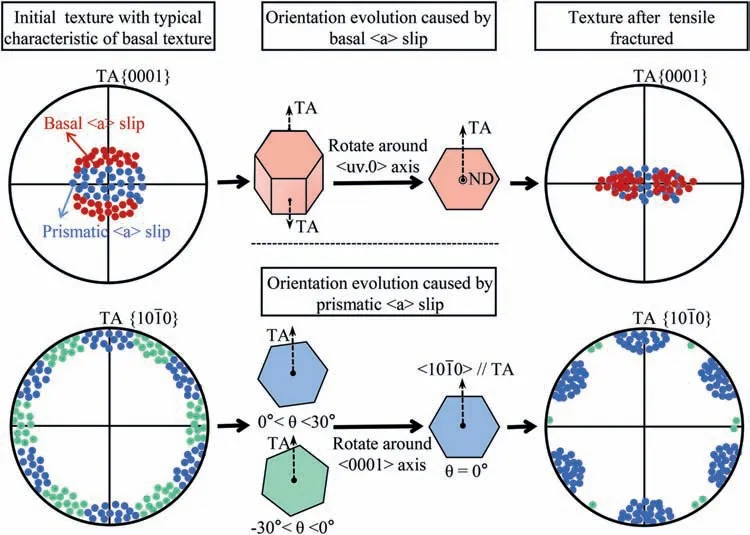
Fig.11.Schematic diagram of orientation evolution during tensile deformation.
3.3.Discussion for the relationship between initial texture and mechanical properties
Fig.12 presents the detailed tensile properties of the three tensile samples.As can be seen,the three samples show almost equal mechanical properties with a fracture elongation of about 15%,ultimate tensile strength (UTS) of 272 MPa,and the yield strength (YS) is in the range of 204–211 MPa.The ratio of the difference between the maximum and minimum values for UTS,YS,and fracture elongation is 0%,3.3%,and 4.5%,respectively.Compared with the value of 15%-20%,even higher than 200% in Mg alloys rolled sheets reported before,[14–15,29–30]this sheet achieved nearly isotropic mechanical properties.
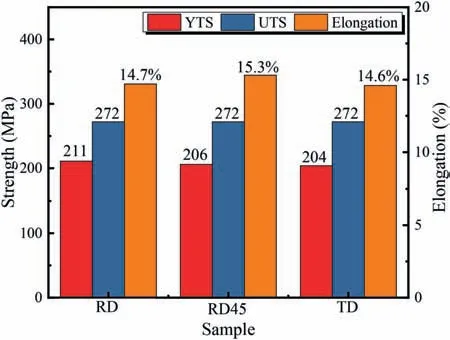
Fig.12.Tensile properties of the RD,RD45,and TD samples.
It is well known that the yield strength anisotropy of Mg alloy with strong texture is highly dependent on the selection of dominant deformation mode and corresponding Schmid factor [13–15].Since both basalslip and prismaticslip are activated in this study,a comparison of Schmid factor of basalslip and prismaticslip in the three samples is provided in Fig.13.For basalslip,the average Schmid factors of RD,RD45 and TD samples are 0.21,0.22 and 0.22,respectively.For prismaticslip,the average Schmid factor in the three samples is almost equal to 0.42.Obviously,the difference in the average Schmid factor of the three samples is negligible,which verifies the similar deformation behaviors among the three samples,and results in almost equal yield strength in the three samples.Besides,it is reported by Koike et al.[28]that the elongation anisotropy is highly related to the tilt angle of the basal planes from the ND.In this study,the initial{0001}pole intensity distribution is circularly symmetric in the RD-TD plane,which provides similar initial textures in three tensile samples.Therefore,an almost equal elongation is achieved in the different tensile samples.

Fig.13.Schmid factor distribution of basal slip and prismatic slip in different samples.(a) RD sample,(b) RD45 sample,(c) TD sample.
Based on the results in this study,it is concluded that the nearly isotropic mechanical properties achieved in this study are essentially attributed to the concentrically distributed texture in the annealed cross-rolled sheet,which gives rise to similar deformation mechanism in different directions.Therefore,controlling the distribution of texture is of great significance to weakening the planar mechanical anisotropy of the rolled sheet and expanding the applications of Mg alloys.
4.Conclusion
In this study,the annealed cross-rolled Mg-Zn-Zr-Y-Gd sheet with typical basal texture was employed as the starting material.The deformation mechanism of the sheet during uniaxial tension and associated orientation evolution were analyzed.The correlation among the initial texture,deformation mechanism,and mechanical anisotropy was established.The main conclusions drawn in the study are listed in the following:
1.The activation of the deformation mechanism largely depends on the initial grain orientation.Prismaticslip dominates the deformation of the grains with<0001>axis nearly perpendicular to the TA.With the<0001>axis gradually tilted towards the TA,basalslip becomes the dominant deformation mode.
2.Orientaton evolution during the tension is related to the slip-induced lattice rotation.During the tensile deformation,the grains dominated by basalslip gradually tilt the {0001} plane parallel to TA,and the grains dominated by prismaticslip reorient the<100>axis parallel to the TA.Combined with the effects of basalslip and prismaticslip,the initial concentrically distributed {0001} pole is split into double peaks extending perpendicular to the RD,and randomly distributed {100} pole became aligned parallel to RD after tensile to fracture.
3.The nearly isotropic mechanical properties achieved in this study are essentially attributed to the concentrically distributed texture in the annealed cross-rolled sheet,which gives rise to a similar deformation mechanism in different directions.Therefore,controlling the distribution of texture is of great significance to weakening the planar mechanical anisotropy of the Mg alloy sheet.
Declaration of competing interest
We have no known competing financial interests or personal relationships that could have appeared to influence the work reported in this paper.
Acknowledgments
The authors acknowledge the financial support from the National Natural Science Foundation of China (NSFC) with projects Nos.51874367 and 51574291.
 Journal of Magnesium and Alloys2023年7期
- Journal of Magnesium and Alloys的其它文章
- Recent progress in MgB2 superconducting joint technology
- “Smart” micro/nano container-based self-healing coatings on magnesium alloys: A review
- Recent advances using equal-channel angular pressing to improve the properties of biodegradable Mg–Zn alloys
- Twin evolution in cast Mg-Gd-Y alloys and its dependence on aging heat treatment
- Effects of Ce content on the modification of Mg2Si phase in Mg-5Al-2Si alloy
- Solute drag-controlled grain growth in magnesium investigated by quasi in-situ orientation mapping and level-set simulations
