
Molecular force mechanism of hydrodynamics in clay nanopores
2023-09-23 08:00:38ShengjieWEIYuchaoLIPengSHENYunminCHEN
Shengjie WEI, Yuchao LI, Peng SHEN, Yunmin CHEN
Research Article
Molecular force mechanism of hydrodynamics in clay nanopores

MOE Key Laboratory of Soft Soils and Geoenvironmental Engineering, College of Civil Engineering and Architecture, Zhejiang University, Hangzhou 310058, China
Nanopores are prevalent within various clay morphologies, and water flow in clay nanopores is significant for various engineering applications. In this study, we performed non-equilibrium molecular dynamics (NEMD) simulations to reveal the molecular force mechanisms of water flow in clay nanopores. The water dynamic viscosity, slip length, and average flow velocity were obtained to verify the NEMD models. Since the water confined in the nanopores maintained a dynamic mechanical equilibrium state, each water lamina can be regarded as a simply supported beam. The applied driving force, the force from clay crystal layers, the force from compensating sodium ions, and the force from other water laminae were further calculated to investigate the force mechanisms. The van der Waals barrier above the surface and hydraulic gradient lead to distribution differences in water oxygen atoms, which contribute to a net van der Waals resistance component of the force from clay crystal layers. Meanwhile, the water molecules tend to rotate to generate the electrostatic resistance component of the force from clay crystal layers and balance the increasing hydraulic gradient. Due to the velocity difference, the water molecules in the slower lamina have a higher tendency to lag and generate a net electrostatic resistance force as well as a net van der Waals driving force on the water molecules in the faster lamina, which together make up the viscous force.
Molecular dynamics; Hydrodynamics; Clay; Nanopore; Molecular force; Boundary effect; Viscous force
1 Introduction
Clays are natural geomaterials with various particle morphologies under different environmental conditions (i.e., single crystal layers, quasi-crystals formed by stacking layers, and aggregates assembled by quasi-crystals) (Quirk and Aylmore, 1971; Ahmed and Abduljauwad, 2017). Nanopores are prevalent within various clay morphologies and water flow in clay nanopores is significant for various engineering applications, such as the design of cut-off walls and anti-pollutant barriers (Wasak and Akkutlu, 2015; Li et al., 2017), and petroleum engineering (Xiong et al., 2020). However, because the length scale of clay nanopores is of the same order of magnitude as the molecular size, there are excessive molecular fluctuations in water behavior and the hydrodynamics properties become inhomogeneous (Daivis and Todd, 2018), making the accuracy and validity of continuous description by means of the Navier-Stokes equation questionable (Sam et al., 2021).
Since classic fluid mechanics is unable to accurately describe nanoscale water-flow behaviors, gaining insights into the micro-physical mechanisms can aid in better controlling the process of water flow in clay nanopores. Due to the limitations of nanofluidic experimental technology and the development of computational capacity, numerical simulation has become an indispensable way for studying the process.
Among various kinds of simulation methods, molecular dynamics (MD) method was known as the bridge between macroscopic properties and molecular mechanisms of nanoscale water flow (Cao, 2017). In the MD simulations, interactions between water molecules and those between water and clay matrix (i.e., clay crystal layers and compensating cations) were chiefly described by non-bonded interactions, including van der Waals and electrostatic interactions (Cygan et al., 2004; Cao, 2017). The short-range van der Waals interaction was generally described by the Lennard-Jones potential, while part of the long-range electrostatic interaction within cutoff distance was described by Coulombic potential and the other part beyond the cutoff distance was calculated by Ewald summation algorithm (Wei et al., 2023). Particularly, as one of the specific kinds of MD simulations, non-equilibrium molecular dynamics (NEMD) simulation, with an external perturbation (e.g., pressure gradient) driving the system out of the original equilibrium state (Allen and Tildesley, 2017), has allowed for better simulations of pressure-driven nanofluidic behaviors (Ramos-Alvarado et al., 2016). To generate stable pressure differences, dual-reservoir model (Wang et al., 2012), fluid piston model (Hanasaki and Nakatani, 2006a, 2006b), reflecting particle model (Li et al., 1998), and quasi-gravity-driven model (Boţan et al., 2011; Wei et al., 2023) were widely applied. So far, researchers have used these models to primarily investigate the relationships between two aspects of water flow in clay nanopores: microscopic structure of water (i.e., density, orientation, and hydrogen bonds) and hydrodynamics properties of flow (i.e., velocity, viscosity, and slip length). It was found that water density in nanoflow was dominated by water-substrate interactions rather than water-water interactions (Alexiadis and Kassinos, 2008), and slip length showed a predictable relation to the spatial distribution and morphological organization of interfacial water molecules (Ramos-Alvarado, et al., 2016). Further simulations illustrated that the types and concentrations of cations highly influenced the orientations of water molecules (Simonnin et al., 2018), and the increasing concentrations densified the hydrogen-bonding networks to increase the viscosity of water (Yin and Zhao, 2020). Furthermore, simulated slip lengths by NEMD were adopted to modify the continuous description by the Navier-Stokes equation for a better prediction of flow velocity of water flow in clay nanopores (Zhan et al., 2020), but the modification with local viscosity was still unable to eliminate the offsets near the mineral surface (Hansen et al., 2011).
Although previous molecular simulations have made great progress in the insights on the influencing factors (e.g., mineral type, size/geometry of pores, and type/concentration of cations) on the hydrodynamics properties (i.e., slip length and viscosity) of the confined water molecules in clay nanopores by means of density profile and planar distribution of water molecules, few studies have explored the force mechanisms of those properties straightforward. In this study, NEMD simulations on water flow in montmorillonite nanopores were performed. The model was verified in terms of water viscosity, slip length, and flow velocity. After investigation of the time fluctuation of total force on the pore water, we calculated the distributed molecular forces on the pore water. Finally, we looked at the relationship between the molecular forces on water molecules and the morphological organization of water molecules. This study revealed the force mechanisms of the slip length and water viscosity on hydrodynamics in clay nanopores at molecular scale.
2 Models and methods
The clay substrate of nanopore was constructed by randomly substituting aluminum atoms in the octahedral sheet of pyrophyllite with magnesium atoms. The lattice parameters and fractional coordinates of atoms used for pyrophyllite were obtained from the model developed by Skipper et al. (1995). All of the isomorphic substitutions followed Loewenstein's rule (that is, no substitution site was adjacent to another) (Loewenstein, 1954), and the negative charges due to isomorphic substitutions were neutralized by 24 compensating Na+atoms. Three different pore sizes(3.5, 5.0, and 6.5 nm) were considered, and the number of water moleculeswfor different pore sizes was determined based on the bulk density of water (Boţan et al., 2011). More details on the molecular models could be found in our previous work (Wei et al., 2023).
As for the atomic interactions, the ClayFF force field (Cygan et al., 2004), the Smith-Dang parameters (Smith, 1998), and the extended simple point charge (SPC/E) model (Berendsen et al., 1981) were utilized for the clay crystal layers, compensating sodium cations, and water molecules, respectively. The rigidity of water molecules was constrained by the SHAKE algorithm (Ryckaert et al., 1977). The cutoff distance for short-range interactions was set to be 1 nm. We adopted the open source code LAMMPS to perform the simulations (Plimpton, 1995) and the OVITO software for post-visualization (Stukowski, 2010).
2.1 Equilibrium molecular dynamics
Equilibrium molecular dynamics (EMD) simulations in canonical ensemble were performed to obtain the properties of the quasi-static water confined in clay nanopores. The clay crystal layers were frozen and an initial velocity distribution based on the initial temperature of 10 K was assigned to the water molecules and mobile cations. The minimum timestep was set to be 1.0 fs and the temperature was controlled with a Nosé-Hoover thermostat (Martyna et al., 1994). After the initial structure was optimized by means of energy minimization, the water molecules and mobile cations were heated from 10 to 300 K after 100 ps. Following the equilibration period of 1 ns, the trajectories of atoms for water molecules and Na+were collected every 0.1 ps for 2 ns. The final configurations of the EMD simulations were taken as the initial configurations for the subsequent NEMD simulations.
Fig. S1 of the electronic supplementary materials (ESM) illustrated the number density profiles of water molecules and compensating sodium cations calculated by EMD simulations. We divided the clay nanopores into three zones: Stern layer, diffusion layer, and bulk region (Wei et al., 2023). The Stern layer was characterized as a single water layer with highly-polarized molecules, and the width of the layer (about 3.5 Å) maintained unchanged with the increasing pore sizes. In the Stern layer, the location of the first density peak of water oxygen atoms (2.5–3.0 Å from the clay mineral surface) was generally used as the indicator of the first adsorbed water layer and the accessible width for water molecules*enlarged with pore sizes (Kannam et al., 2013). Followed the Stern layer, the diffusion layer was considered as the transition layer for water molecules from being polarized to being free. Due to the reduction of salt concentration (Mitchell and Soga, 2005), its width enlarged with pore sizes (9.0, 11.5, and 18.5 Å for 3.5, 5.0, and 6.5 nm, respectively). Since all of the substitutions occurred at the octahedral sheet, hydrated sodium cations tended to form outer-sphere complexes in the diffusion layer. Water molecules in the bulk region were not affected by the clay crystal layer and the compensating cations, and the number density did not change with the distance from clay crystal layers.
2.2 Non-equilibrium molecular dynamics
By adopting appropriate external perturbation to ensure the linear response of the system, we were able to adapt the molecular dynamics method to treat the non-equilibrium system (Hoover and Hoover, 2005). According to the quasi-gravity-driven method, we generated different total driving forcesdon the pore water by assigning additional accelerations in the-directiona(5.5×10¹², 16.5×10¹², 32.9×10¹², and 65.9×10¹²m/s2) to the fluid particles. Subsequently, the equivalent differential pressures (Δ=20, 60, 120, and 240 MPa) between two sides of the simulation box along the-direction (i.e., the flow direction) could be generated based ondand the flow area (Liu et al., 2018). Obviously, the additional accelerations would generate fictitious high temperature because the net velocity of water molecules was not zero. To solve this problem, the-component of the velocity of the mass center of water molecules was subtracted out during the thermostatic process (Boţan et al., 2011; Wei et al., 2023). For NEMD simulations with different pore sizes and driving pressures, a 2-ns equilibrium period was required to achieve a steady flow and a 2-ns sampling period was used for collecting thermodynamics properties of each particle. During the sampling time, the hydrodynamics properties were obtained to verify the NEMD simulation models. Subsequently, the clay crystal layers, the compensating cations, and the water molecules in nanopores were respectively placed in three independent groups, and the interaction forces between the groups were calculated via the compute group/group command in LAMMPS (Plimpton, 1995) to conduct the mechanical analyses of water flow in clay nanopores and reveal the force mechanisms of hydrodynamics in clay nanopores.
3 Hydrodynamics properties
The flow velocity of theth water laminavcan be calculated as follows:
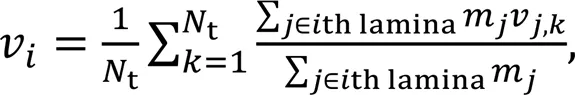
where mj is the mass of particle j within the ith lamina, vj,k is the y-velocity of particle j at timestep k, and Nt is the number of total timesteps considered. The velocity profiles under different equivalent flow-driving pressures for h=3.5 nm are illustrated in Fig. 1, while the profiles for h=5.0 and 6.5 nm are plotted in Fig. S2 of the ESM. It is noteworthy that the NEMD simulation was unable to adapt to the non-equilibrium system if the applied flow-driving force on the pore water was too great to ensure the linear response of the system (Hoover and Hoover, 2005). The results showed that ΔP=240 MPa for h=5.0 nm as well as ΔP=120 and 240 MPa for h=6.5 nm was unacceptable for the NEMD method. Thus, the results obtained with these three cases are excluded from this paper.
The NEMD models were quantitatively verified in terms of the hydrodynamics properties of water flow in clay nanopores (i.e., water dynamic viscosity, slip lengths, and average flow velocity). The parabolic part of the velocity profile in Fig. 1 can be fitted by the Navier-Stokes equation:
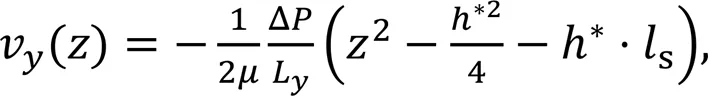
whereLis the-dimension of the simulation box. The values ofandsare determined by fitting the obtained velocity profiles and the results are summarized in Table 1. The dynamic viscosity of water (=(0.71±0.05) cP) remained stable with various pore sizes and equivalent flow-driving pressures. To verify this, the viscosity for bulk water was also obtained according to the Green-Kubo equation (Kondratyuk, 2019) in the EMD simulations (Fig. S3 of the ESM). The value ofobtained via NEMD simulations basically conformed to that obtained from EMD simulations (about 0.69 cP), but was slightly larger than the other published results with SPC/E water model (Hess, 2002). The slip lengthsis a simple parameter to characterize the slip magnitude along the interface between the fluid and the solid surface. Fors≤0, there was a strong boundary interaction on the water molecules near the clay mineral surfaces and the water flow had a sticky boundary; otherwise, the water molecules tended to slide near the boundary and the water flow had a slip boundary. As shown in Table 1, all values ofswere greater than 0 and enlarged with the increase of Δ. Besides, we adopted two methods to calculate average flow velocity. One (1) involved averaging the fitting velocity profile along the-axis; the other (2) was based on the total outflow volumeduring the 2-ns sampling time from the NEMD simulations (calculation details are shown in Note S4 of the ESM). The relative error between1and2was less than 6% (Table 1) and cross-validation between these two methods confirmed that the system had achieved a thermodynamic equilibrium state.
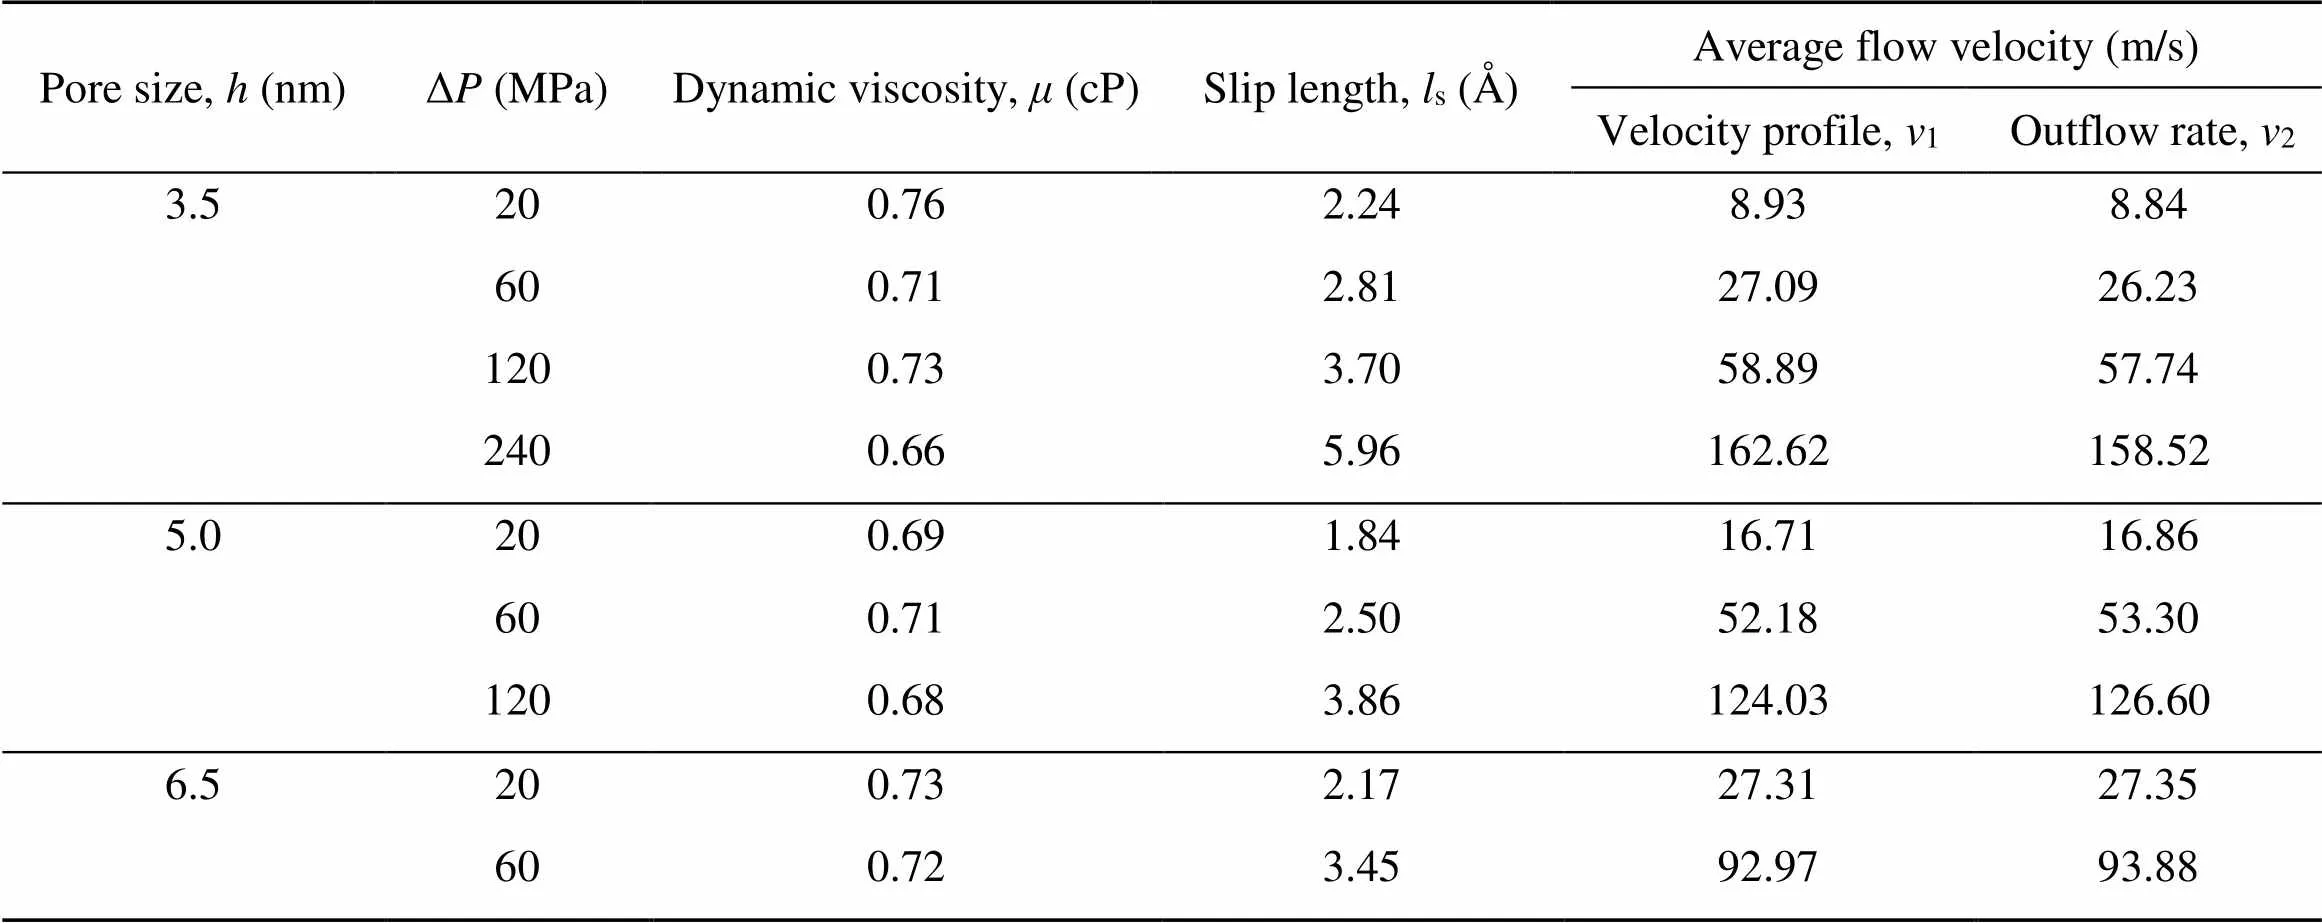
Table 1 Obtained values of hydrodynamics parameters for water flow
4 Molecular forces on water molecules in clay nanopores
In the following sections, we described the link between the morphological organization and molecular forces of the water molecules to reveal the force mechanisms of water flow in clay nanopores. For the sake of convenience, all of the following force variables refer to the force components along the flow direction. The value of a driving force is positive, while the value of a resistant force is negative. The width of a nanopore has little influence on the distribution and mechanism of the forces on water molecules; therefore, for the sake of simplicity, we considered the forces on water molecules in a 3.5-nm clay nanopore as typical.
4.1 Total forces on pore water
A total of 20000 values of the total force of clay matrix on pore waterscfor Δ=0 and 240 MPa were sampled and illustrated with dots in Fig. 2. It can be found that the values ofsccontinued to fluctuate after the 2-ns equilibrium period. To investigate the fluctuation patterns ofsc, we divided the fluctuant range equally into 100 intervals and counted the number of timesteps when the value ofscfell into the corresponding interval. The occurrence frequencies of the correspondingscare plotted with black circles in Fig. 2. We found that the fluctuation ofscconformed to the Gaussian function and the mean value of the distribution decreased with the increment of Δ. The difference between the absolute time-averaged value ofscanddfor Δ=240 MPa was 2×10-12N and the relative error was 0.1%. This indicates that the water flow in clay nanopores reached a dynamic mechanical equilibrium state (Wei et al., 2023) and further force analyses can be conducted on them. Moreover, the standard deviations of the Gaussian distribution ofscfor Δ=0 and 240 MPa were basically the same, which indicated the dispersion degree ofscwas basically independent of Δat an identical temperature.
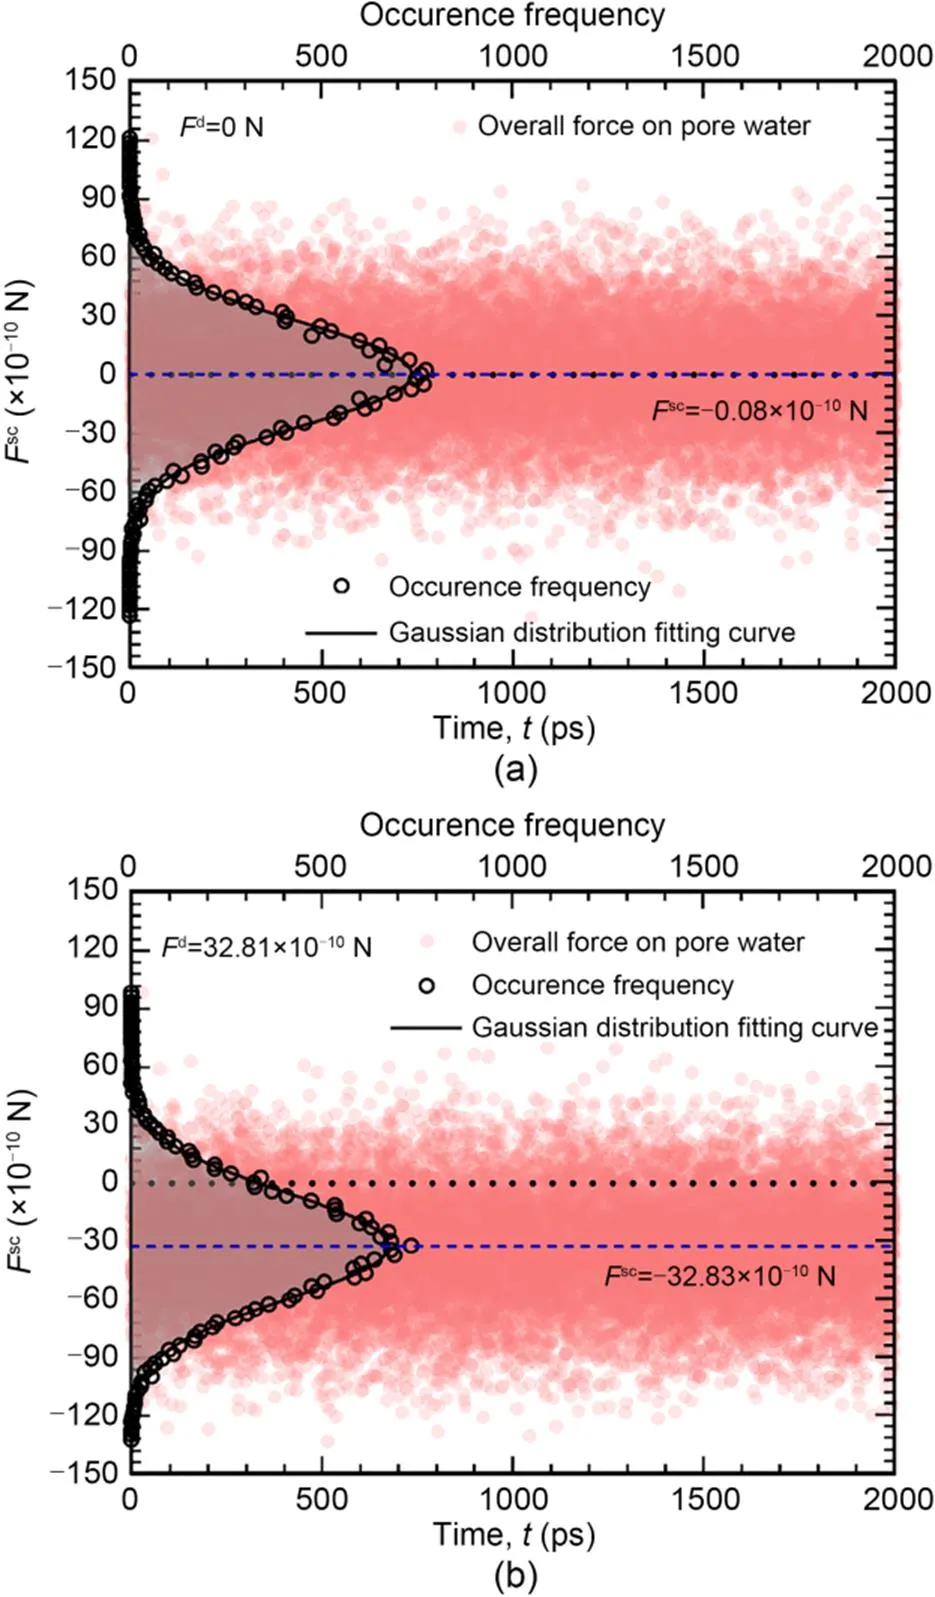
Fig. 2 Time fluctuation and occurrence frequency distribution of Fsc for ΔP=0 MPa (a) and ΔP=240 MPa (b)
4.2 Force analyses for water laminae
Each water lamina can be equivalent as a simply supported beam with four forces acting on it: the applied driving force (fd), the force from clay crystal layers (fs), the force from compensating sodium ions (fc), and the force from other water laminae (fw) (Wei et al., 2023). Undoubtedly, with the increase of Δ, the forces on pore water were less susceptible to thermodynamic disturbance, and the distribution patterns of forces were more prominent. Hence, we took the profile of these forces along the-axis with Δ=240 MPa as an example; it is plotted in Fig. 3.
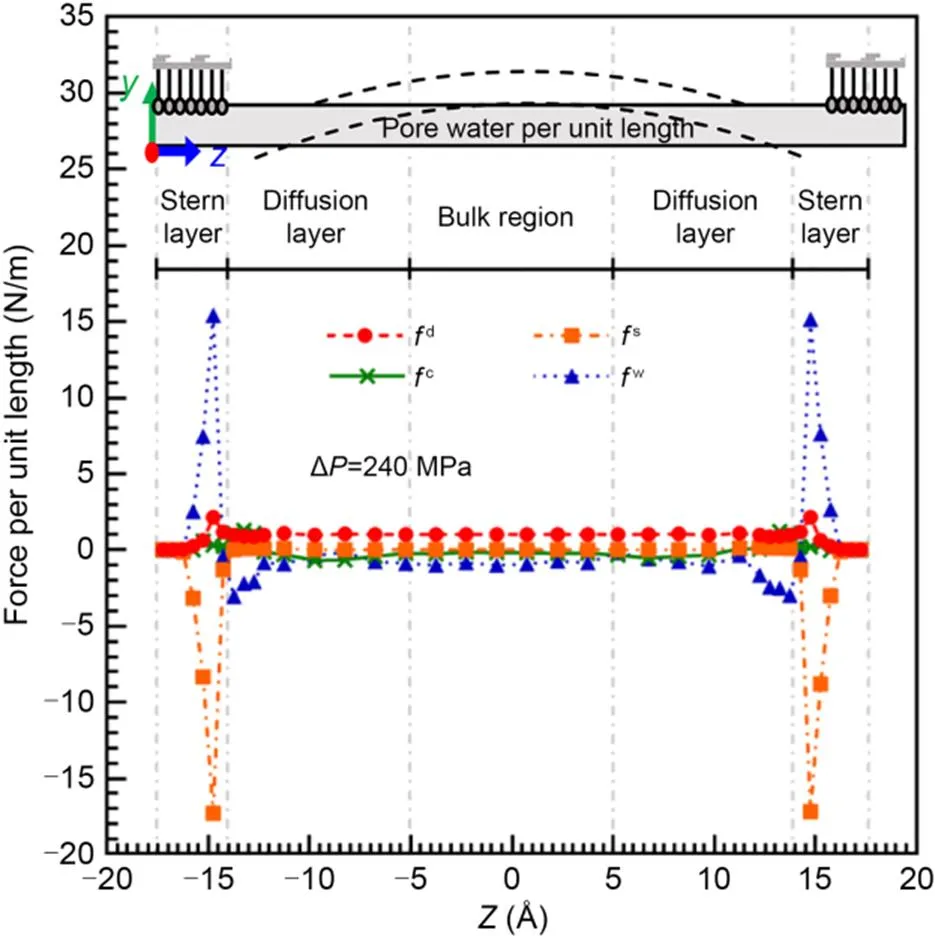
Fig. 3 Profile of forces acting on water molecules in each water lamina with ΔP=240 MPa
Obviously,d(represented by the curve with circles in Fig. 3) was proportional to the number density of water molecules.s(the curve with squares in Fig. 3) was a resistance force (i.e.,s<0) mainly acting in the Stern layer, whilec(the curve with crosses in Fig. 3) was chiefly concentrated in the diffusion layer. Within a range of 3.5–5.0 Å from the clay surface,cwas characterized as a driving force (i.e.,c>0) due to ion hydration. Subsequently,cbecame a resistance force and gradually decayed to zero with further diffusion of Na+.fw(the curve with triangles in Fig. 3) served as a dominant viscous force to balance the shear force induced by the other three forces.
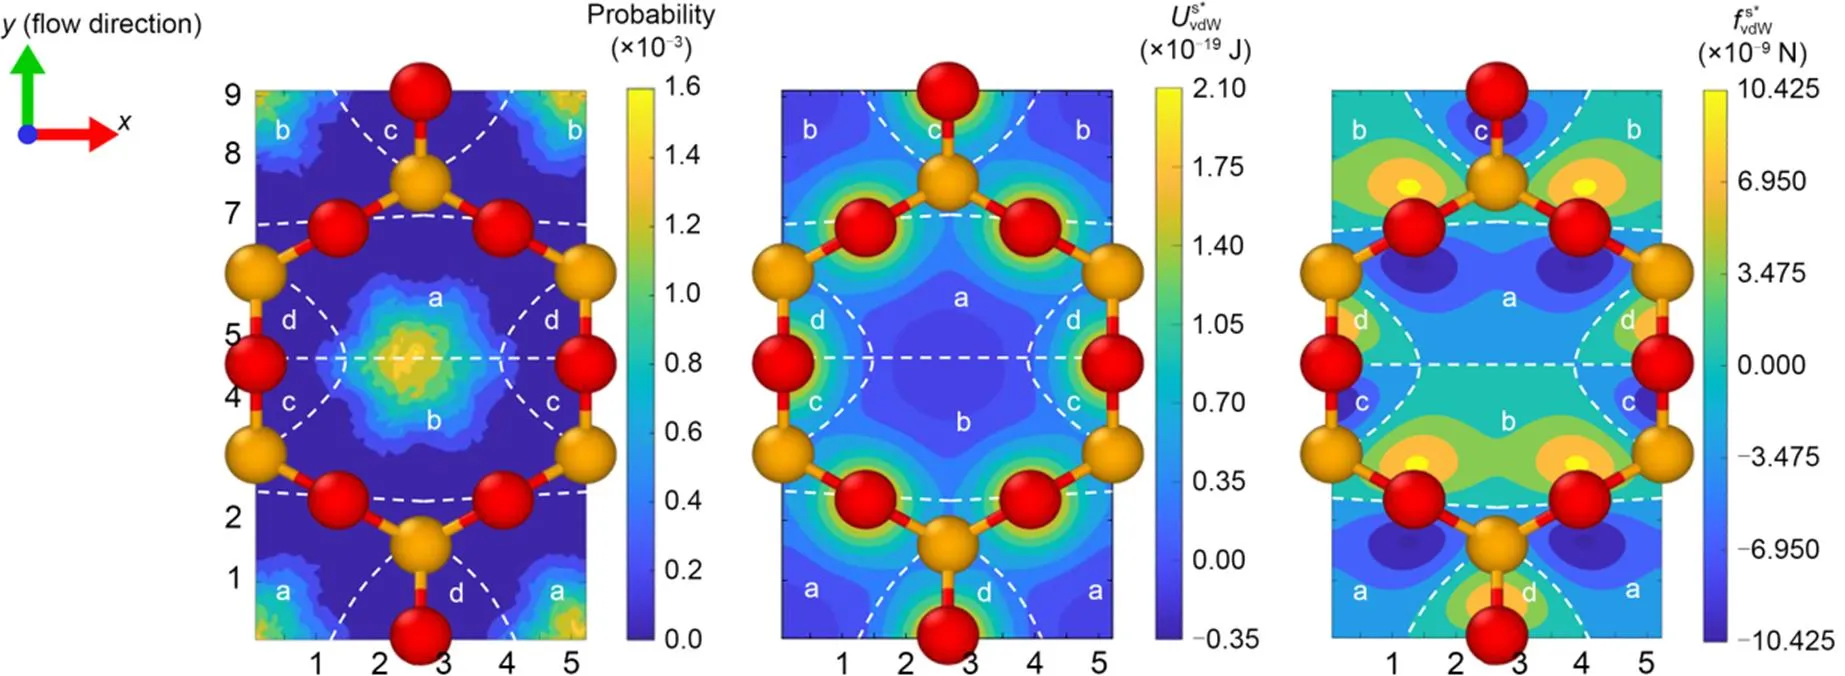
Fig. 4 Cloud maps for a single water molecule in the plane 2.25 Å away from the mineral surface: (a) distribution probability; (b) van der Waals potential ; (c) van der Waals force . The notation '*' is used to distinguish the force on an individual water molecule from the distributed force along the z-axis
5 Force mechanism of clay crystal layers on water molecules

5.1 van der Waals component

5.2 Coulomb electrostatic component

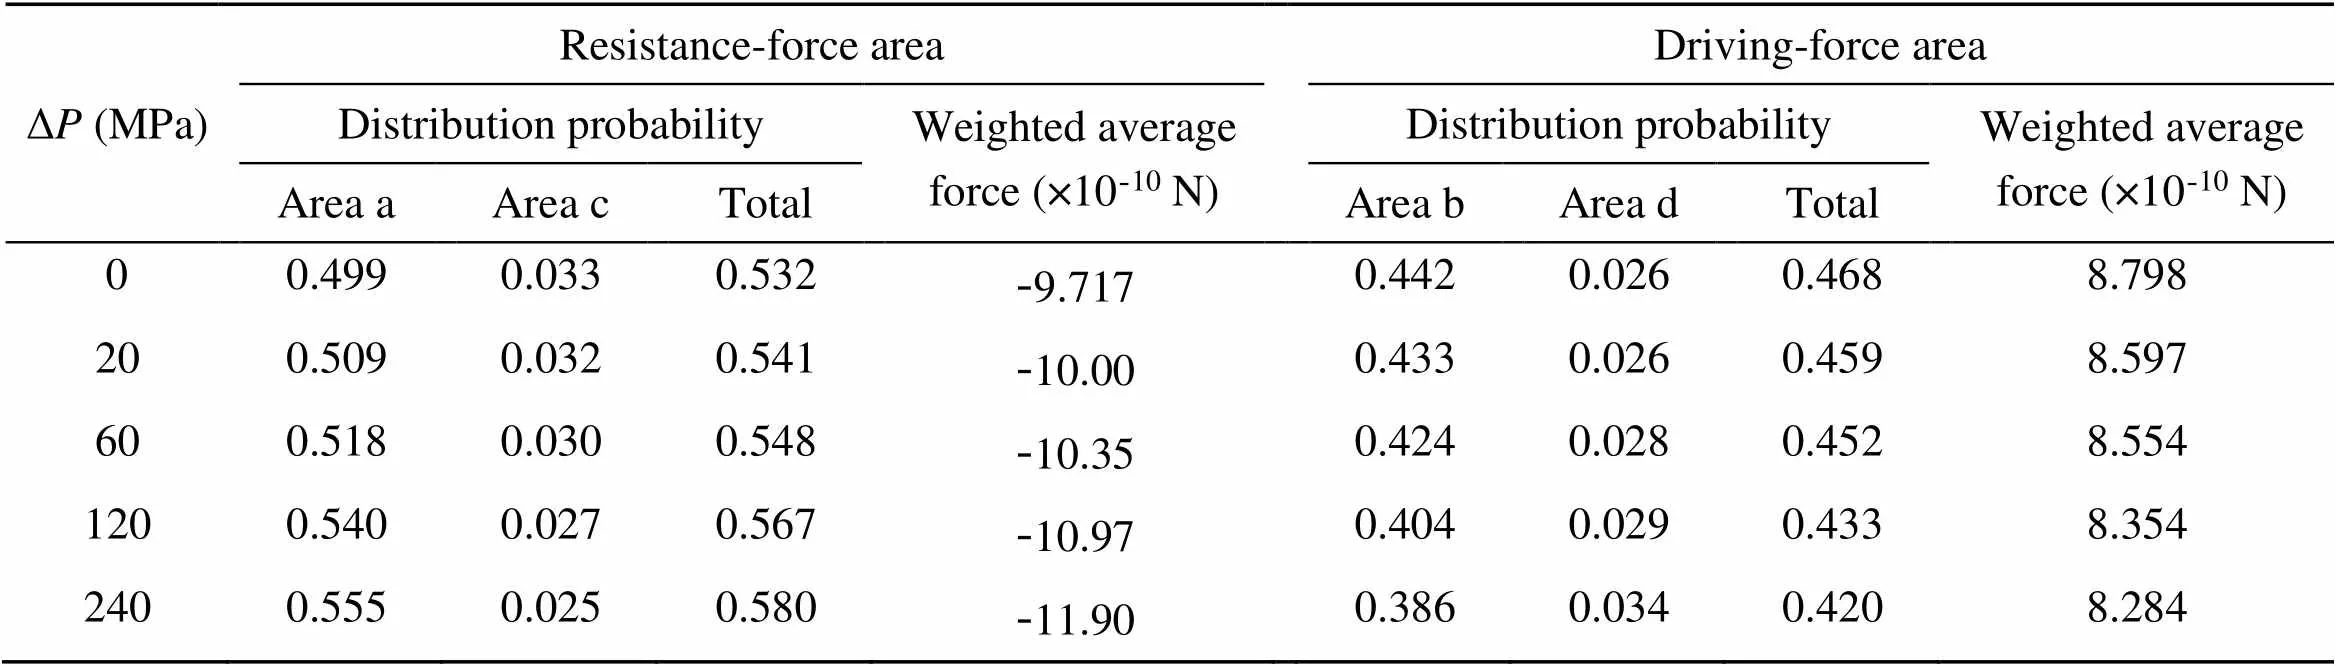
Table 2 Distribution probability and weighted average force of a single water molecule in each area of a unit cell
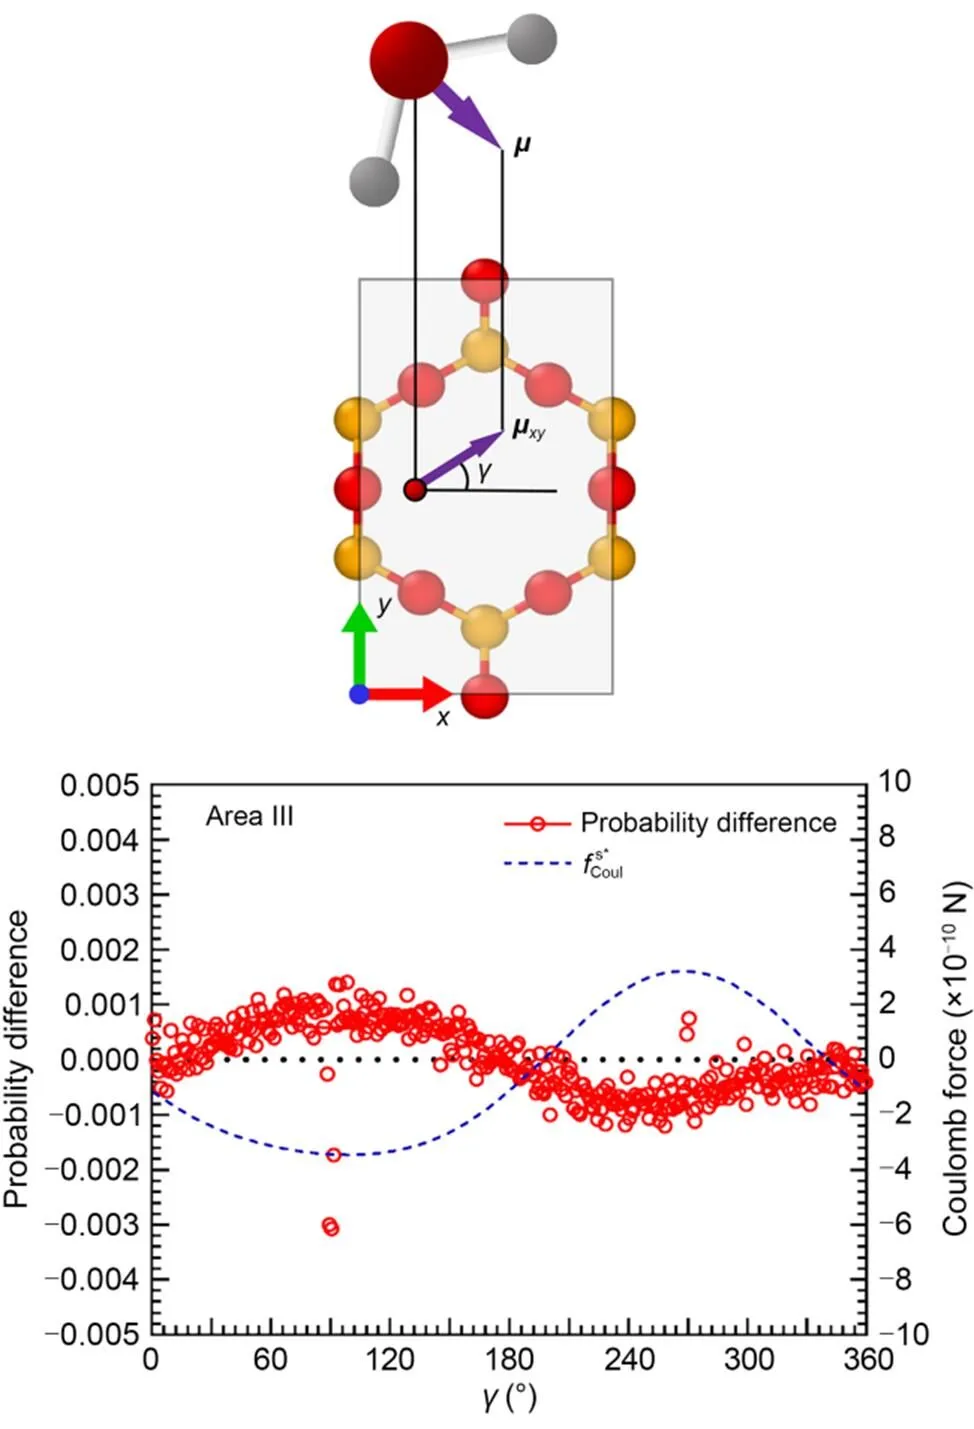
Fig. 5 Electrostatic forces on a single water molecule and probability differences between ΔP=240 MPa and ΔP=0 MPa for water molecules with different rotation angles γ in Area III. μxy is the projection of the orientation vector of water molecule μ on the xy-plane
6 Mechanism of internal viscous force within pore water

To determine the mechanism ofw, we performed the following analyses using the spatial distribution function (SDF) calculation method (Chen et al., 2019), but in a two-dimensional way. An arbitrary water lamina was taken as the central lamina (CL), and for each water molecule in CL, we calculate the-component forces from the water molecules that satisfied the hydrogen bonding criterion (Kumar et al., 2007) in the adjacent laminae (i.e., FL or SL). Afterwards, with respect to each water oxygen atom in the CL, the relative-planar distributions of forces from water molecules in the SL are elucidated as an example.
It can be concluded from Fig. 6 that the Coulomb electrostatic force between water molecules in the adjacent laminae was attractive, and thus generated a driving force from downstream water molecules and a resistance force from upstream water molecules. Similarly, we noted that the van der Waals force between water molecules was repulsive. Due to the velocity difference between adjacent laminae, the water molecules in the SL were more likely to reside upstream with respect to the water molecules in the CL. Therefore, in the SL, the values of forces from upstream water molecules were always higher than those from downstream ones. It was the retention that induced the net electrostatic resistance force and the net van der Waals driving force from the water molecules in the SL to the water molecules in the CL. Furthermore, the net electrostatic force was always greater than the net van der Waals force, so the water molecules in the SL exerted a net resistance force, while the water molecules in the FL exerted a net driving force to the water molecules in the CL, which was the mechanism of the viscous force. Obviously, the different probabilities of being downstream or upstream were dependent on the velocity gradient between adjacent laminae. Hence, as the hydraulic gradient increased, the velocity gradient between the adjacent laminae increased, eventually resulting in a stronger viscous force within the flowing pore water.
7 Conclusions
In this study, we simulated the nanoflow in the clay nanopores via the NEMD simulation method. The hydrodynamics properties were obtained to verify the simulation model, and the molecular forces from clay matrix and the viscous force within the pore water were calculated. The mechanisms of the van der Waals and Coulomb electrostatic components of these molecular forces were revealed by analyzing the planar distribution and morphology of water molecules. The following conclusions can be drawn:
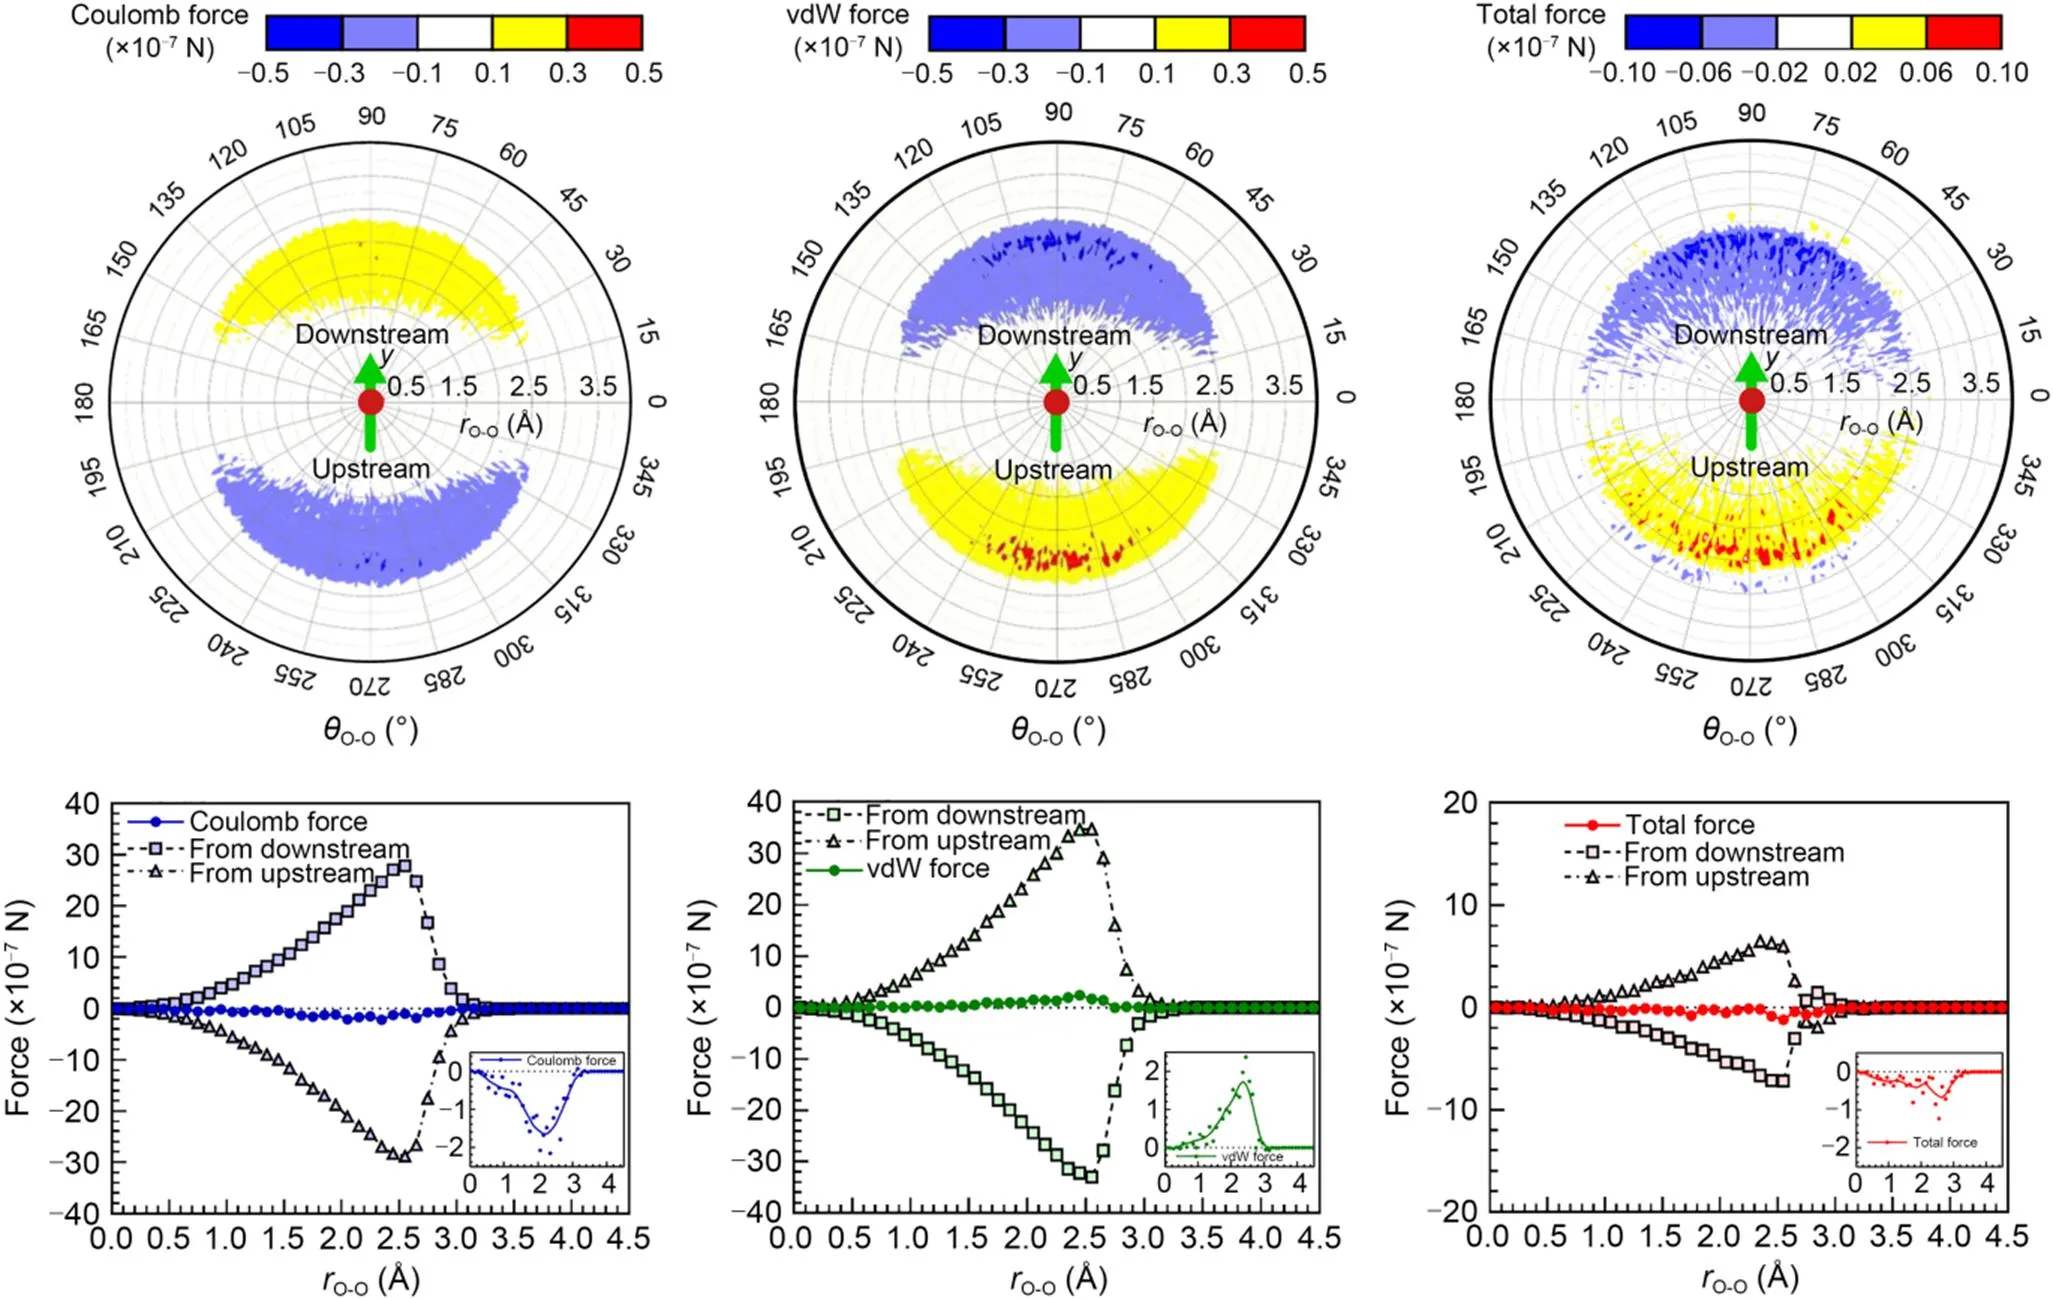
Fig. 6 Planar distribution of forces from water molecules in the SL. vdW represents van der Waals; rO-O is the length of the oxygen vector, which is the vector from the central water oxygen atom to another water oxygen atom in the SL; θO-O is the angle between the oxygen vector and x-axis

As forwwithin the flowing pore water, due to the velocity difference between adjacent laminae, the water molecules in the slower lamina have a higher probability of residing upstream, resulting in a net electrostatic resistance force and a net van der Waals driving force. The increasing velocity gradient raises the probability of water molecules in the slower lamina lagging behind, and results in a correspondingly stronger viscous force within the pore water.
Acknowledgments
This work is supported by the National Natural Science Foundation of China (Nos. 51988101, 42077241, and 42277125) and the National Key Research and Development Program of China (No. 2019YFC1806002). The technical assistance from Hangjun WU (the administrator of the High-performance Computation Platform in the Center of Cryo-Electron Microscopy (CCEM), Zhejiang University) is greatly appreciated.
Author contributions
Yuchao LI and Shengjie WEI designed the research. Shengjie WEI and Peng SHEN processed the corresponding data. Shengjie WEI wrote the first draft of the manuscript. Yuchao LI helped to organize the manuscript. Yuchao LI and Shengjie WEI revised and edited the final version. Yunmin CHEN and Yuchao LI acquired the financial support.
Conflict of interest
Shengjie WEI, Yuchao LI, Peng SHEN, and Yunmin CHEN declare that they have no conflict of interest.
Ahmed HR, Abduljauwad SN, 2017. Nano-level constitutive model for expansive clays., 67(3):187-207. https://doi.org/10.1680/jgeot.15.P.140
Alexiadis A, Kassinos S, 2008. The density of water in carbon nanotubes., 63(8):2047-2056. https://doi.org/10.1016/j.ces.2007.12.035
Allen MP, Tildesley DJ, 2017. Computer Simulation of Liquids. 2nd Edition. Oxford University Press, Oxford, UK. https://doi.org/10.1093/oso/9780198803195.001.0001
Berendsen HJC, Postma JPM, van Gunsteren WF, et al., 1981. Interaction models for water in relation to protein hydration.: Pullman B (Ed.), Intermolecular Forces. Springer, Dordrecht, the Netherlands, p.331-342. https://doi.org/10.1007/978-94-015-7658-1_21
Boţan A, Rotenberg B, Marry V, et al., 2011. Hydrodynamics in clay nanopores., 115(32):16109-16115. https://doi.org/10.1021/jp204772c
Cao GX, 2017. Computational simulations of pressure-driven nanofluidic behavior., 47(7):070011. https://doi.org/10.1360/sspma2016-00400
Chen SJ, Chen WQ, Ouyang YB, et al., 2019. Transitions between nanomechanical and continuum mechanical contacts: new insights from liquid structure., 11(47):22954-22963. https://doi.org/10.1039/c9nr07180f
Cygan RT, Liang JJ, Kalinichev AG, 2004. Molecular models of hydroxide, oxyhydroxide, and clay phases and the development of a general force field., 108(4):1255-1266. https://doi.org/10.1021/jp0363287
Daivis PJ, Todd BD, 2018. Challenges in nanofluidics—beyond Navier–Stokes at the molecular scale., 6(9):144. https://doi.org/10.3390/pr6090144
Hanasaki I, Nakatani A, 2006a. Flow structure of water in carbon nantubes: Poiseuille type or plug-like?, 124(14):144708. https://doi.org/10.1063/1.2187971
Hanasaki I, Nakatani A, 2006b. Fluidized piston model for molecular dynamics simulations of hydrodynamic flow., 14(5):S9-S20. https://doi.org/10.1088/0965-0393/14/5/s02
Hansen JS, Todd BD, Daivis PJ, 2011. Prediction of fluid velocity slip at solid surfaces., 84(1):016313. https://doi.org/10.1103/PhysRevE.84.016313
Hess B, 2002. Determining the shear viscosity of model liquids from molecular dynamics simulations., 116(1):209-217. https://doi.org/10.1063/1.1421362
Hoover WG, Hoover CG, 2005. Nonequilibrium molecular dynamics., 8(2):247-260.
Kannam SK, Todd BD, Hansen JS, et al., 2013. How fast does water flow in carbon nanotubes?, 138(9):094701. https://doi.org/10.1063/1.4793396
Kondratyuk N, 2019. Contributions of force field interaction forms to Green-Kubo viscosity integral in-alkane case., 151(7):074502. https://doi.org/10.1063/1.5103265
Kumar R, Schmidt JR, Skinner JL, 2007. Hydrogen bonding definitions and dynamics in liquid water., 126(20):204107. https://doi.org/10.1063/1.2742385
Li J, Liao D, Yip S, 1998. Coupling continuum to molecular-dynamics simulation: reflecting particle method and the field estimator., 57(6):7259-7267. https://doi.org/10.1103/PhysRevE.57.7259
Li YC, Chen GN, Chen YM, et al., 2017. Design charts for contaminant transport through slurry trench cutoff walls., 143(9):06017005. https://doi.org/10.1061/(asce)ee.1943-7870.0001253
Liu B, Qi C, Zhao XB, et al., 2018. Nanoscale two-phase flow of methane and water in shale inorganic matrix., 122(46):26671-26679. https://doi.org/10.1021/acs.jpcc.8b06780
Loewenstein W, 1954. The distribution of aluminum in the tetrahedra of silicates and aluminates., 39(1-2):92-96.
Marry V, Rotenberg B, Turq P, 2008. Structure and dynamics of water at a clay surface from molecular dynamics simulation., 10(32):4802-4813. https://doi.org/10.1039/b807288d
Martyna GJ, Tobias DJ, Klein ML, 1994. Constant pressure molecular dynamics algorithms., 101(5):4177-4189. https://doi.org/10.1063/1.467468
Mitchell JK, Soga K, 2005. Fundamentals of Soil Behavior. 3rd Edition. Wiley, Hoboken, USA.
Plimpton S, 1995. Fast parallel algorithms for short-range molecular dynamics., 117(1):1-19. https://doi.org/10.1006/jcph.1995.1039
Quirk JP, Aylmore LAG, 1971. Domains and quasi-crystalline regions in clay systems., 35(4):652-654. https://doi.org/10.2136/sssaj1971.03615995003500040046x
Ramos-Alvarado B, Kumar S, Peterson GP, 2016. Hydrodynamic slip in silicon nanochannels., 93(3):033117. https://doi.org/10.1103/PhysRevE.93.033117
Ryckaert JP, Ciccotti G, Berendsen HJC, 1977. Numerical integration of the Cartesian equations of motion of a system with constraints: molecular dynamics of-alkanes., 23(3):327-341. https://doi.org/10.1016/0021-9991(77)90098-5
Sam A, Hartkamp R, Kumar Kannam S, et al., 2021. Fast transport of water in carbon nanotubes: a review of current accomplishments and challenges., 47(10-11):905-924. https://doi.org/10.1080/08927022.2020.1782401
Simonnin P, Marry V, Noetinger B, et al., 2018. Mineral- and ion-specific effects at clay–water interfaces: structure, diffusion, and hydrodynamics., 122(32):18484-18492. https://doi.org/10.1021/acs.jpcc.8b04259
Skipper NT, Chang FRC, Sposito G, 1995. Monte Carlo simulation of interlayer molecular structure in swelling clay minerals. 1. Methodology., 43(3):285-293. https://doi.org/10.1346/CCMN.1995.0430303
Smith DE, 1998. Molecular computer simulations of the swelling properties and interlayer structure of cesium montmorillonite., 14(20):5959-5967. https:/doi.org/10.1021/la980015z
Stukowski A, 2010. Visualization and analysis of atomistic simulation data with OVITO–the Open Visualization Tool., 18(1):015012. https://doi.org/10.1088/0965-0393/18/1/015012
Wang L, Dumont RS, Dickson JM, 2012. Nonequilibrium molecular dynamics simulation of water transport through carbon nanotube membranes at low pressure., 137(4):044102. https://doi.org/10.1063/1.4734484
Wasak A, Akkutlu IY, 2015. Permeability of organic-rich shale., 20(6):1384-1396. https://doi.org/10.2118/170830-PA
Wei SJ, Li YC, Shen P, et al., 2023. Molecular forces of water flow in clay nanopores. The 9th International Congress on Environmental Geotechnics, p.259-268. https://doi.org/10.53243/ICEG2023-33
Xiong H, Devegowda D, Huang L, 2020. Oil-water transport in clay-hosted nanopores: effects of long range electrostatic forces., 66(8):1-23. https://doi.org/10.1002/aic.16276
Yin YM, Zhao LL, 2020. Effects of salt concentrations and pore surface structure on the water flow through rock nanopores., 69(5):054701 (in Chinese). https://doi.org/10.7498/aps.69.20191742
Zhan SY, Su YL, Jin ZH, et al., 2020. Molecular insight into the boundary conditions of water flow in clay nanopores., 311:113292. https://doi.org/10.1016/j.molliq.2020.113292
Zhu KQ, Xu CX, 2009. Viscous Fluid Mechanics. Higher Education Press, Beijing, China (in Chinese).
Notes S1–S8, Table S1, Figs. S1–S12
https://doi.org/10.1631/jzus.A2200427
Yuchao LI, https://orcid.org/0000-0002-3636-5007
Revision accepted Feb. 20, 2023;
Crosschecked Aug. 29, 2023
© Zhejiang University Press 2023
Sept. 4, 2022;
 Journal of Zhejiang University-Science A(Applied Physics & Engineering)2023年9期
- Journal of Zhejiang University-Science A(Applied Physics & Engineering)的其它文章
- Noise robustness of an operational modal-based structural damage-detection scheme using impact-synchronous modal analysis
- Bifurcation control of solid angle car-following model through a time-delay feedback method
- A data-driven approach for modeling and predicting the thrust force of a tunnel boring machine
- Theoretical and experimental investigation on the efficiency of a novel roller piston pump
- Finite-time path following control of a sailboat with actuator failure and unknown sideslip angle