
Fractal analysis of small-micro pores and estimation of permeability of loess using mercury intrusion porosimetry
2023-07-24 10:07TuoLUYamingTANGYongboTIEBoHONGWeiFENG
Tuo LU ,Yaming TANG ,Yongbo TIE ,Bo HONG ,Wei FENG
1Chinese Academy of Geological Sciences, Beijing 100037, China
2School of Water Resources and Environment, China University of Geosciences, Beijing 100083, China
3Xi’an Center of China Geological Survey, Xi’an 710054, China
4Chengdu Center of China Geological Survey, Chengdu 610081, China
Abstract: Many popular models have been proposed to study the fractal properties of the pores of porous materials based on mercury intrusion porosimetry (MIP).However,most of these models do not directly apply to the small-micro pores of loess,which have a significant impact on the throat pores and tunnels for fluid flow.Therefore,in this study we used a combination of techniques,including routine physical examination,MIP analysis,and scanning electron microscope (SEM) image analysis,to study these small-micro pores and their saturated water permeability properties.The techniques were used to determine whether the fractal dimensions of six MIP fractal models could be used to evaluate the microstructure types and permeability properties of loess.The results showed that the Neimark model is suitable for analysis of small-micro pores.When applied to saturated water permeability,the results from this model satisfied the correlation significance test and were consistent with those from SEM analysis.A high clay content and density cause an increase in the number of small-micro pores,leading to more roughness and heterogeneity of the pore structure,and an increase in the fractal dimensions.This process further leads to a decrease in the content of macro-meso pores and saturated water permeability.Furthermore,we propose new parameters: the *Ellipse and its area ratios (*EAR).These parameters,coupled with 2D-SEM and 3D-MIP fractal dimensions,can effectively and quantitatively be used to evaluate the types of loess microstructures (from type I to type III) and the saturated water permeability (magnitude from 1×10⁻⁴ cm/s to 1×10⁻⁵ cm/s).
Key words: Malan loess;Fractal models;Small-micro pores;Mercury intrusion porosimetry (MIP);Microstructure;Saturated water permeability
1 Introduction
The Belt and Road Strategy and the Great West‐ern Development policies in China have led to an in‐crease in urban development on the Loess Plateau,which is the thickest loess deposit in the world,cover‐ing more than 440000 km2(Zhu et al.,1983;Ma et al.,2017).The impact of pore structure on hydraulic and permeability properties during civil engineering activ‐ities in plateau regions with abundant loess is becom‐ing increasingly noticeable (Li and Li,2017;Li et al.,2018;Mu et al.,2020;Zhang et al.,2020;Xu et al.,2022;Yu et al.,2022).Small-micro pores are an es‐sential component of loess pore structure.They in‐clude some inter-aggregate pores and intra-aggregate pores,which have been described as narrow sluices and throat pores allowing fluid flow (Li and Li,2017;Li et al.,2018;Wei et al.,2019a,2019b,2020b).However,it is not easy to precisely quantify the geo‐metric characteristics of these pores,such as the pore size distribution (PSD),using conventional statistical methods based on mercury intrusion porosimetry(MIP).Nevertheless,the fractal hypothesis provides a new method to quantify some parameters of these pores (Pfeifer and Avnir,1983).
In previous studies,six different fractal models based on the fractal hypothesis have been proposed.Their results closely match estimates of material het‐erogeneity obtained from the MIP data of sands,coals,and clayey soils (Friesen and Mikula,1987;Neimark,1992;Shen et al.,1995;Zhang and Li,1995;Li and Horne,2006;Li,2010;Zhang and Weller,2014).However,the results from various frac‐tal models are not always consistent and the smallmicro porosity fractal region of materials is likely to have a single fractal dimension for most MIP fractal models (Zhang and Weller,2014;Li et al.,2017;Zhou and Tang,2018;Hu et al.,2020;Dou et al.,2021;Xiao et al.,2022).
Meanwhile,it has been pointed out that a fractal region with a ratio of pores (the minimum diameter to the maximum diameter) smaller than 1×10⁻³(dmin≪dmax)should be given more consideration so that the calcu‐lated fractal dimension has a representative and frac‐tal scaleless band in a porous material (Mandelbrot,1982;Yu and Li,2001).
A few studies based on MIP tests have been car‐ried out on the fractal characteristics of intact Malan loess pores.Questions remain as to whether smallmicro pores have a robust fractal feature,and which existing fractal models are suitable for characterizing them.Thus,in this study we performed a systematic comparative analysis of six popular fractal models using MIP,scanning electron microscopy (SEM),and routine laboratory tests (soil natural density test,natural water content test,specific gravity test,soil particle size screening test,liquid plastic limit test,double-oedometer method estimating the collapsibility of loess test,and the falling water head permeability test),to analyze the fractal characteristics of the smallmicro pores of loess,their microstructure,and their saturated water permeability.We aimed to determine if the existing fractal models were applicable to the small-micro pores of loess,and whether the results of fractal analysis correlated with the saturated water permeability.Finally,we developed a novel method that couples 2D and 3D fractal dimensions,to evalu‐ate the microstructure and saturated water permeability properties of loess.
2 Fractal models
2.1 Fractal models based on mercury intrusion porosimetry
Fractal models based on MIP data have been classified into six prevalent models (Table 1) (Lu et al.,2022).
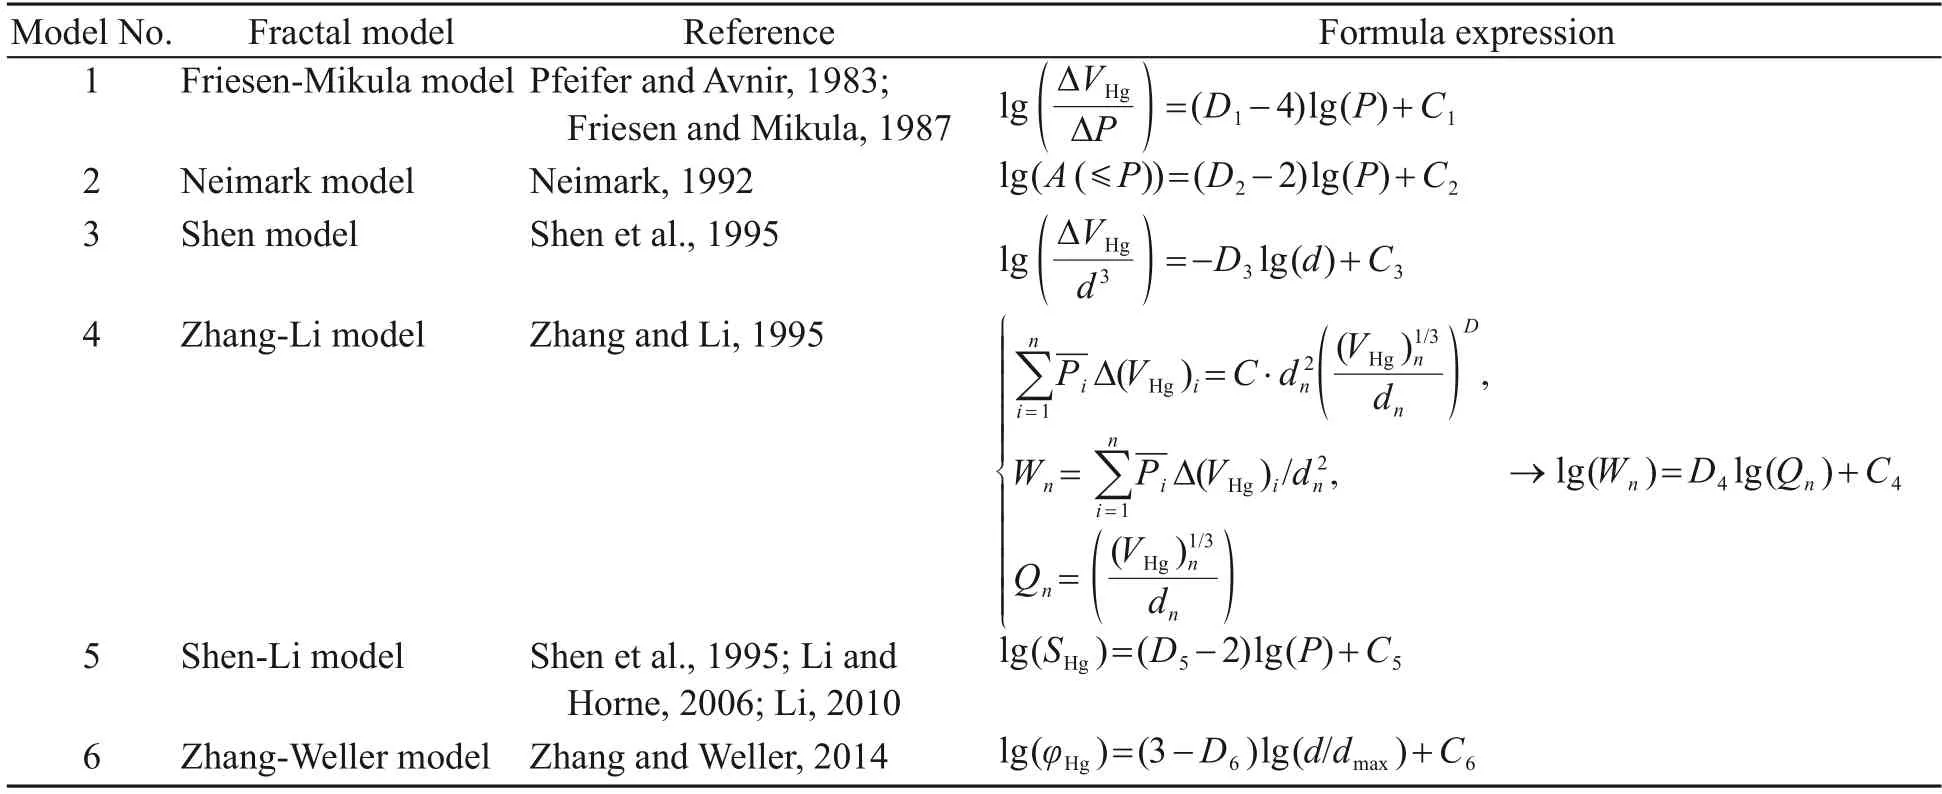
Table 1 MIP fractal models considered in this study (Lu et al.,2022)
2.2 Box-counting fractal dimension
The box-counting fractal dimension (Li et al.,2009) was taken as a key reference indicator to com‐pare results from the above-mentioned six MIP frac‐tal models.
The calculation process of the box-counting frac‐tal dimension was as follows: In step (a),SEM images of the samples were denoised with a median filter (in‐cluding increasing the brightness and the contrast),and the edges were detected with a sober-edge filter(Fig.1a).Then,the images were binarized using the watershed segmentation method and the pores and grains were extracted.The blue color denotes the pores,while the white color represents the grains(Fig.1b).In step (c),an adaptive watershed segmenta‐tion algorithm (Yu et al.,2021) was derived from the images (Fig.1c).In step (d),the pores smaller than 8 μm (Fig.1d) on the label image were selected to cal‐culate the box-counting fractal dimension (Li et al.,2009).This method changes mainly the box size to obtain a different number of boxes occupied by the pores and to fit a linear relationship among them(Figs.1e and 1f).
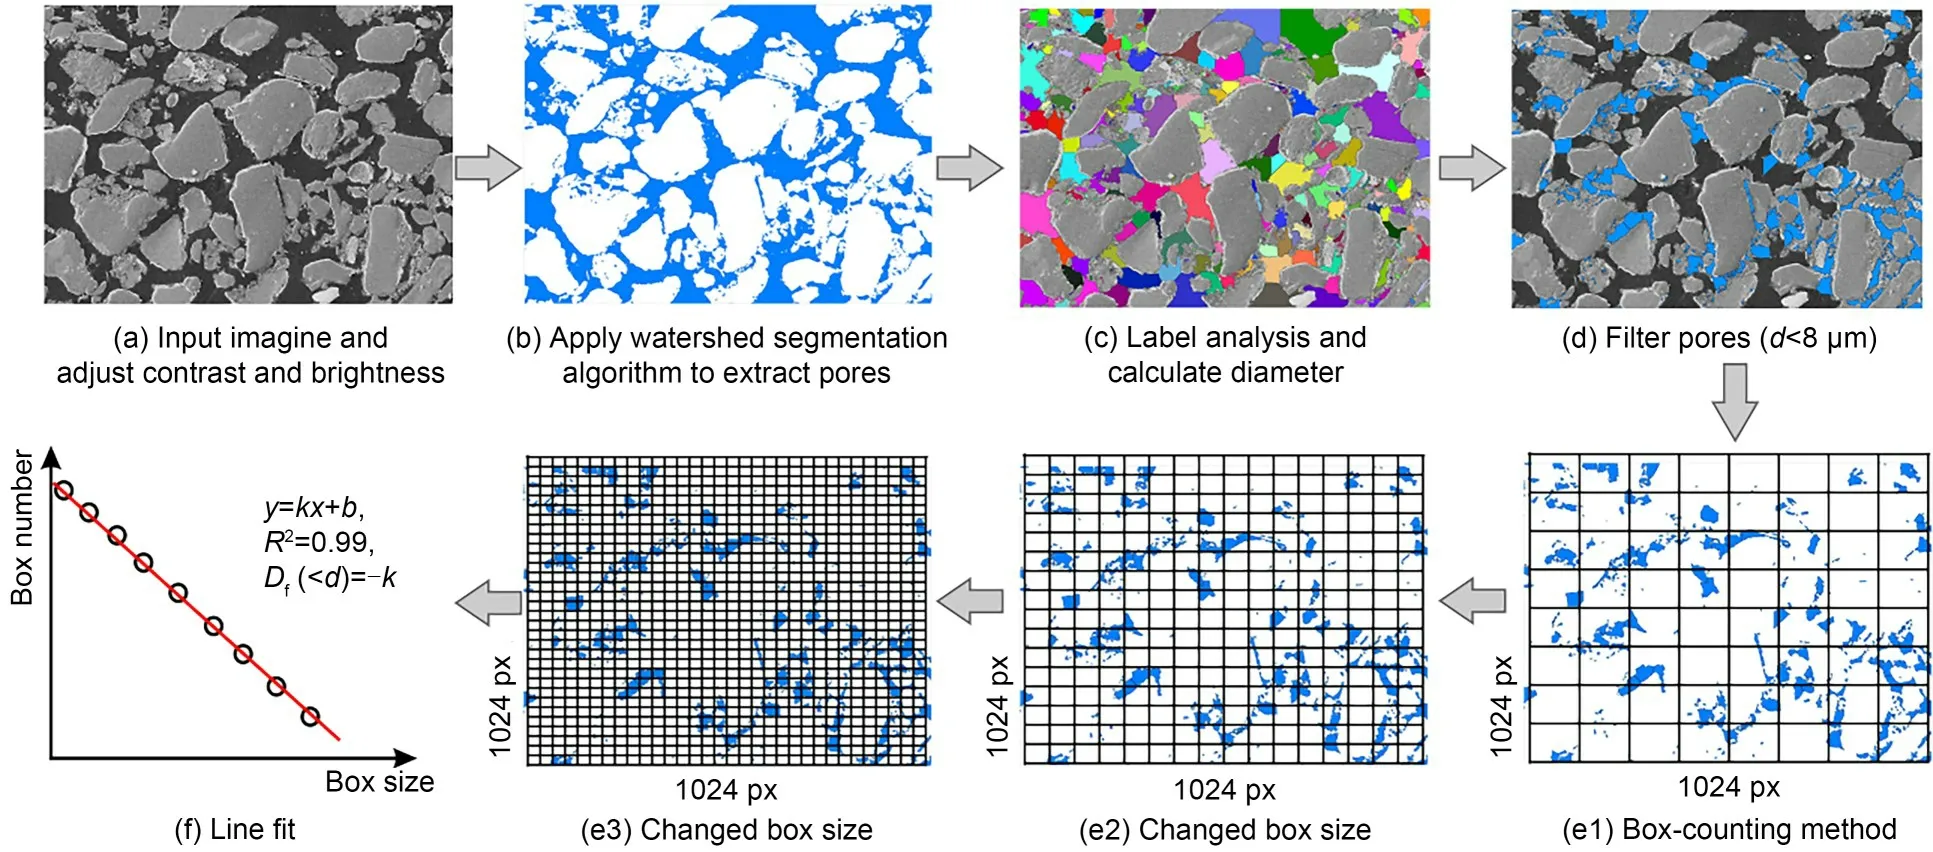
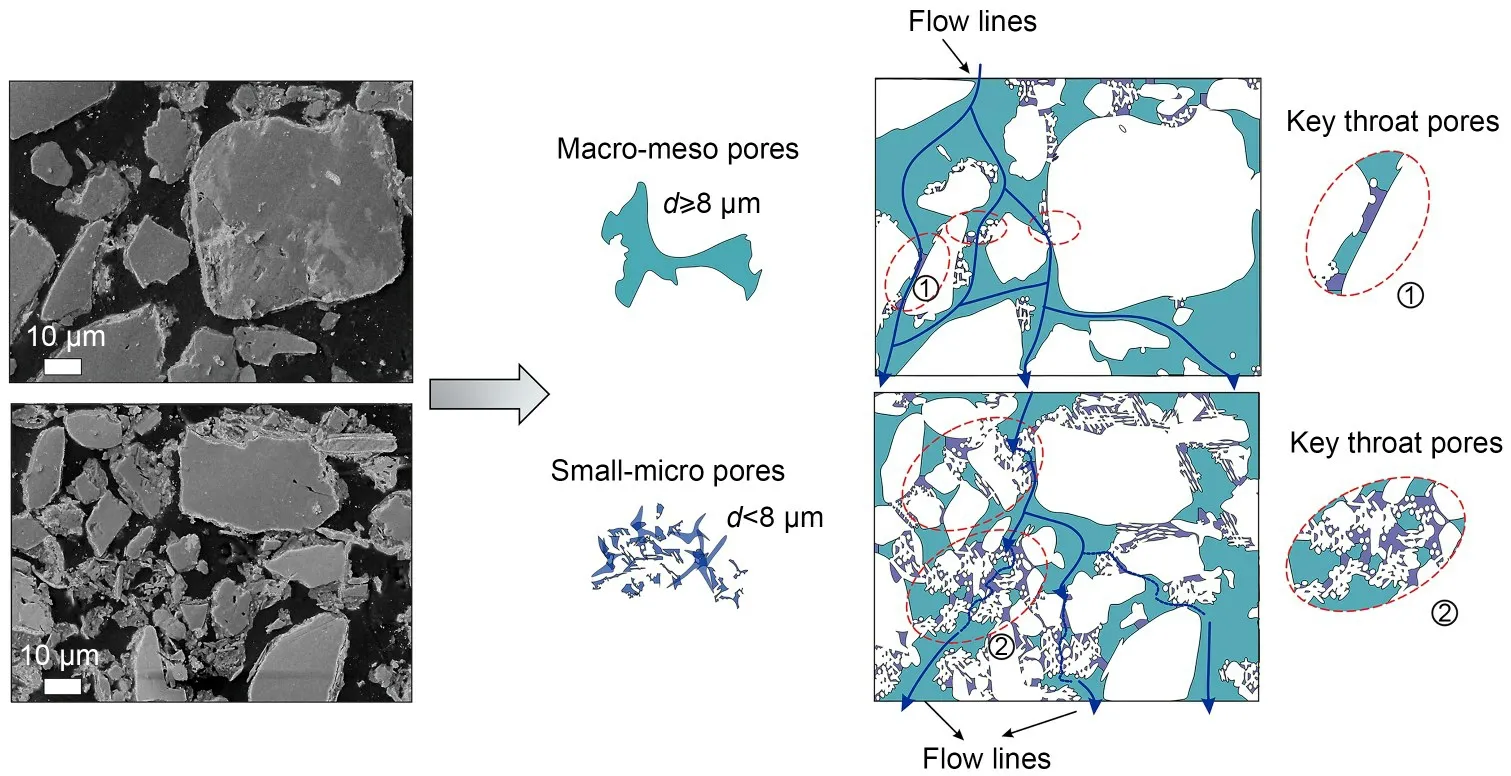
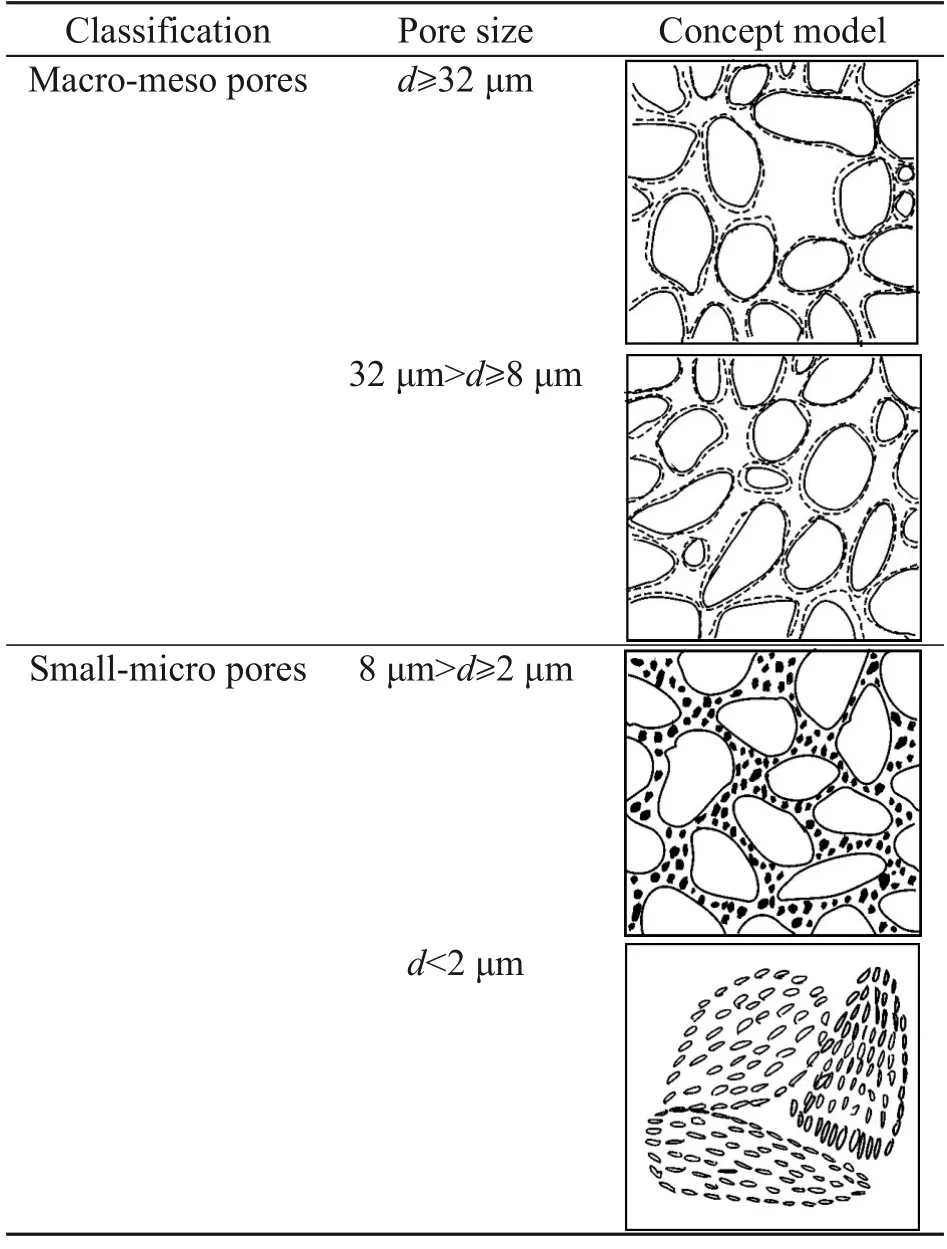
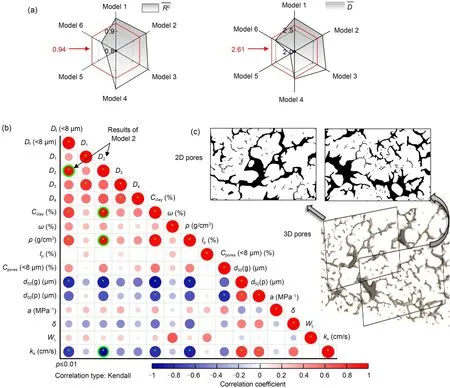
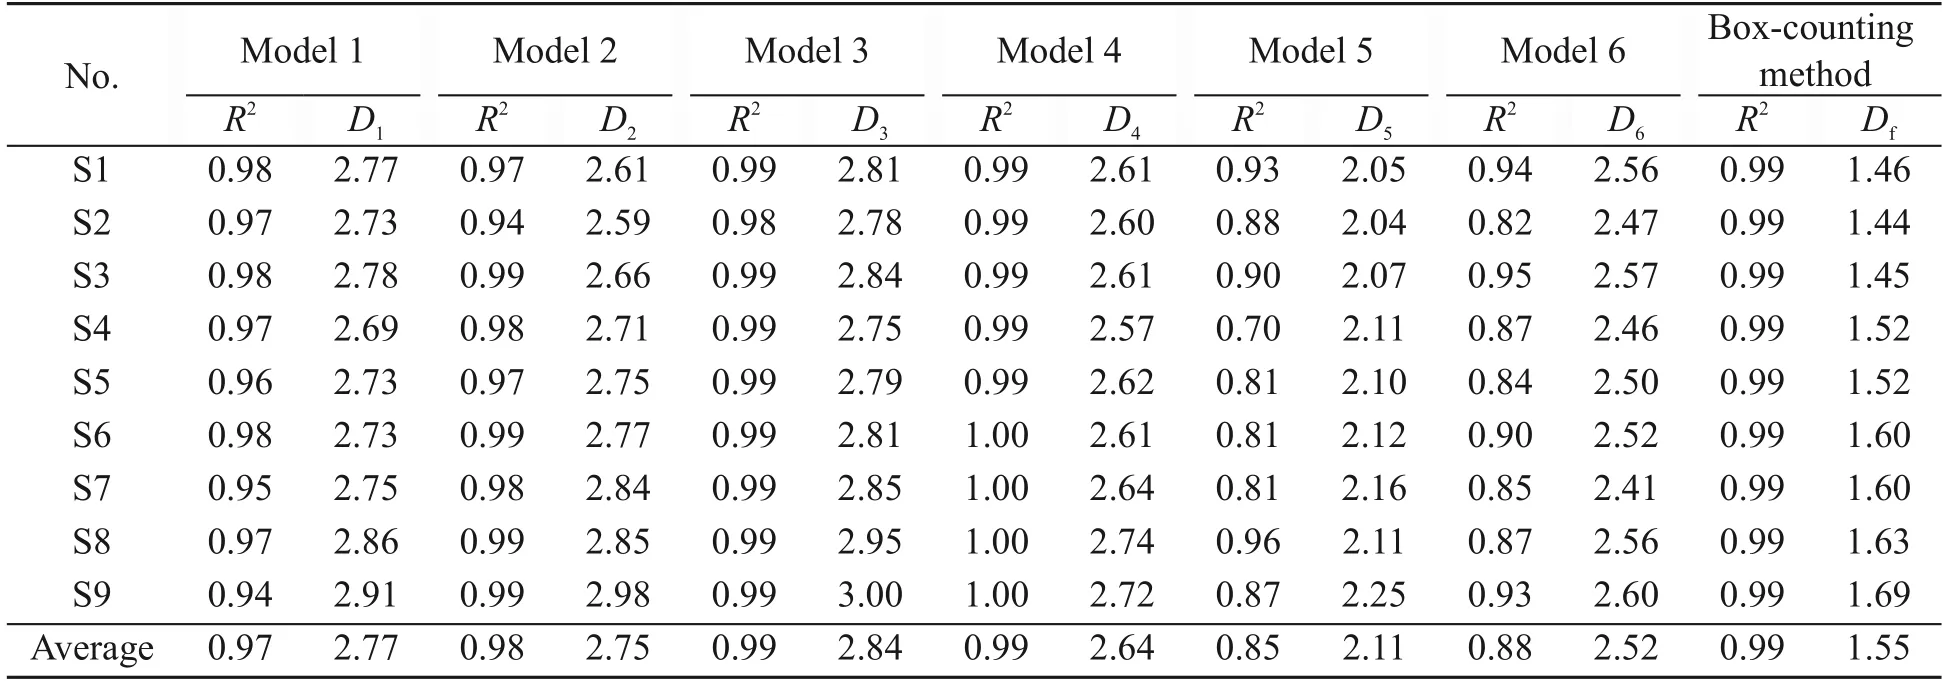
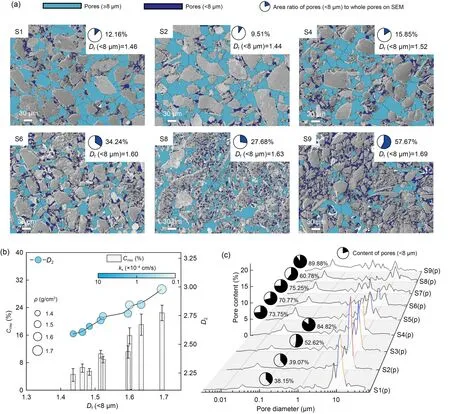
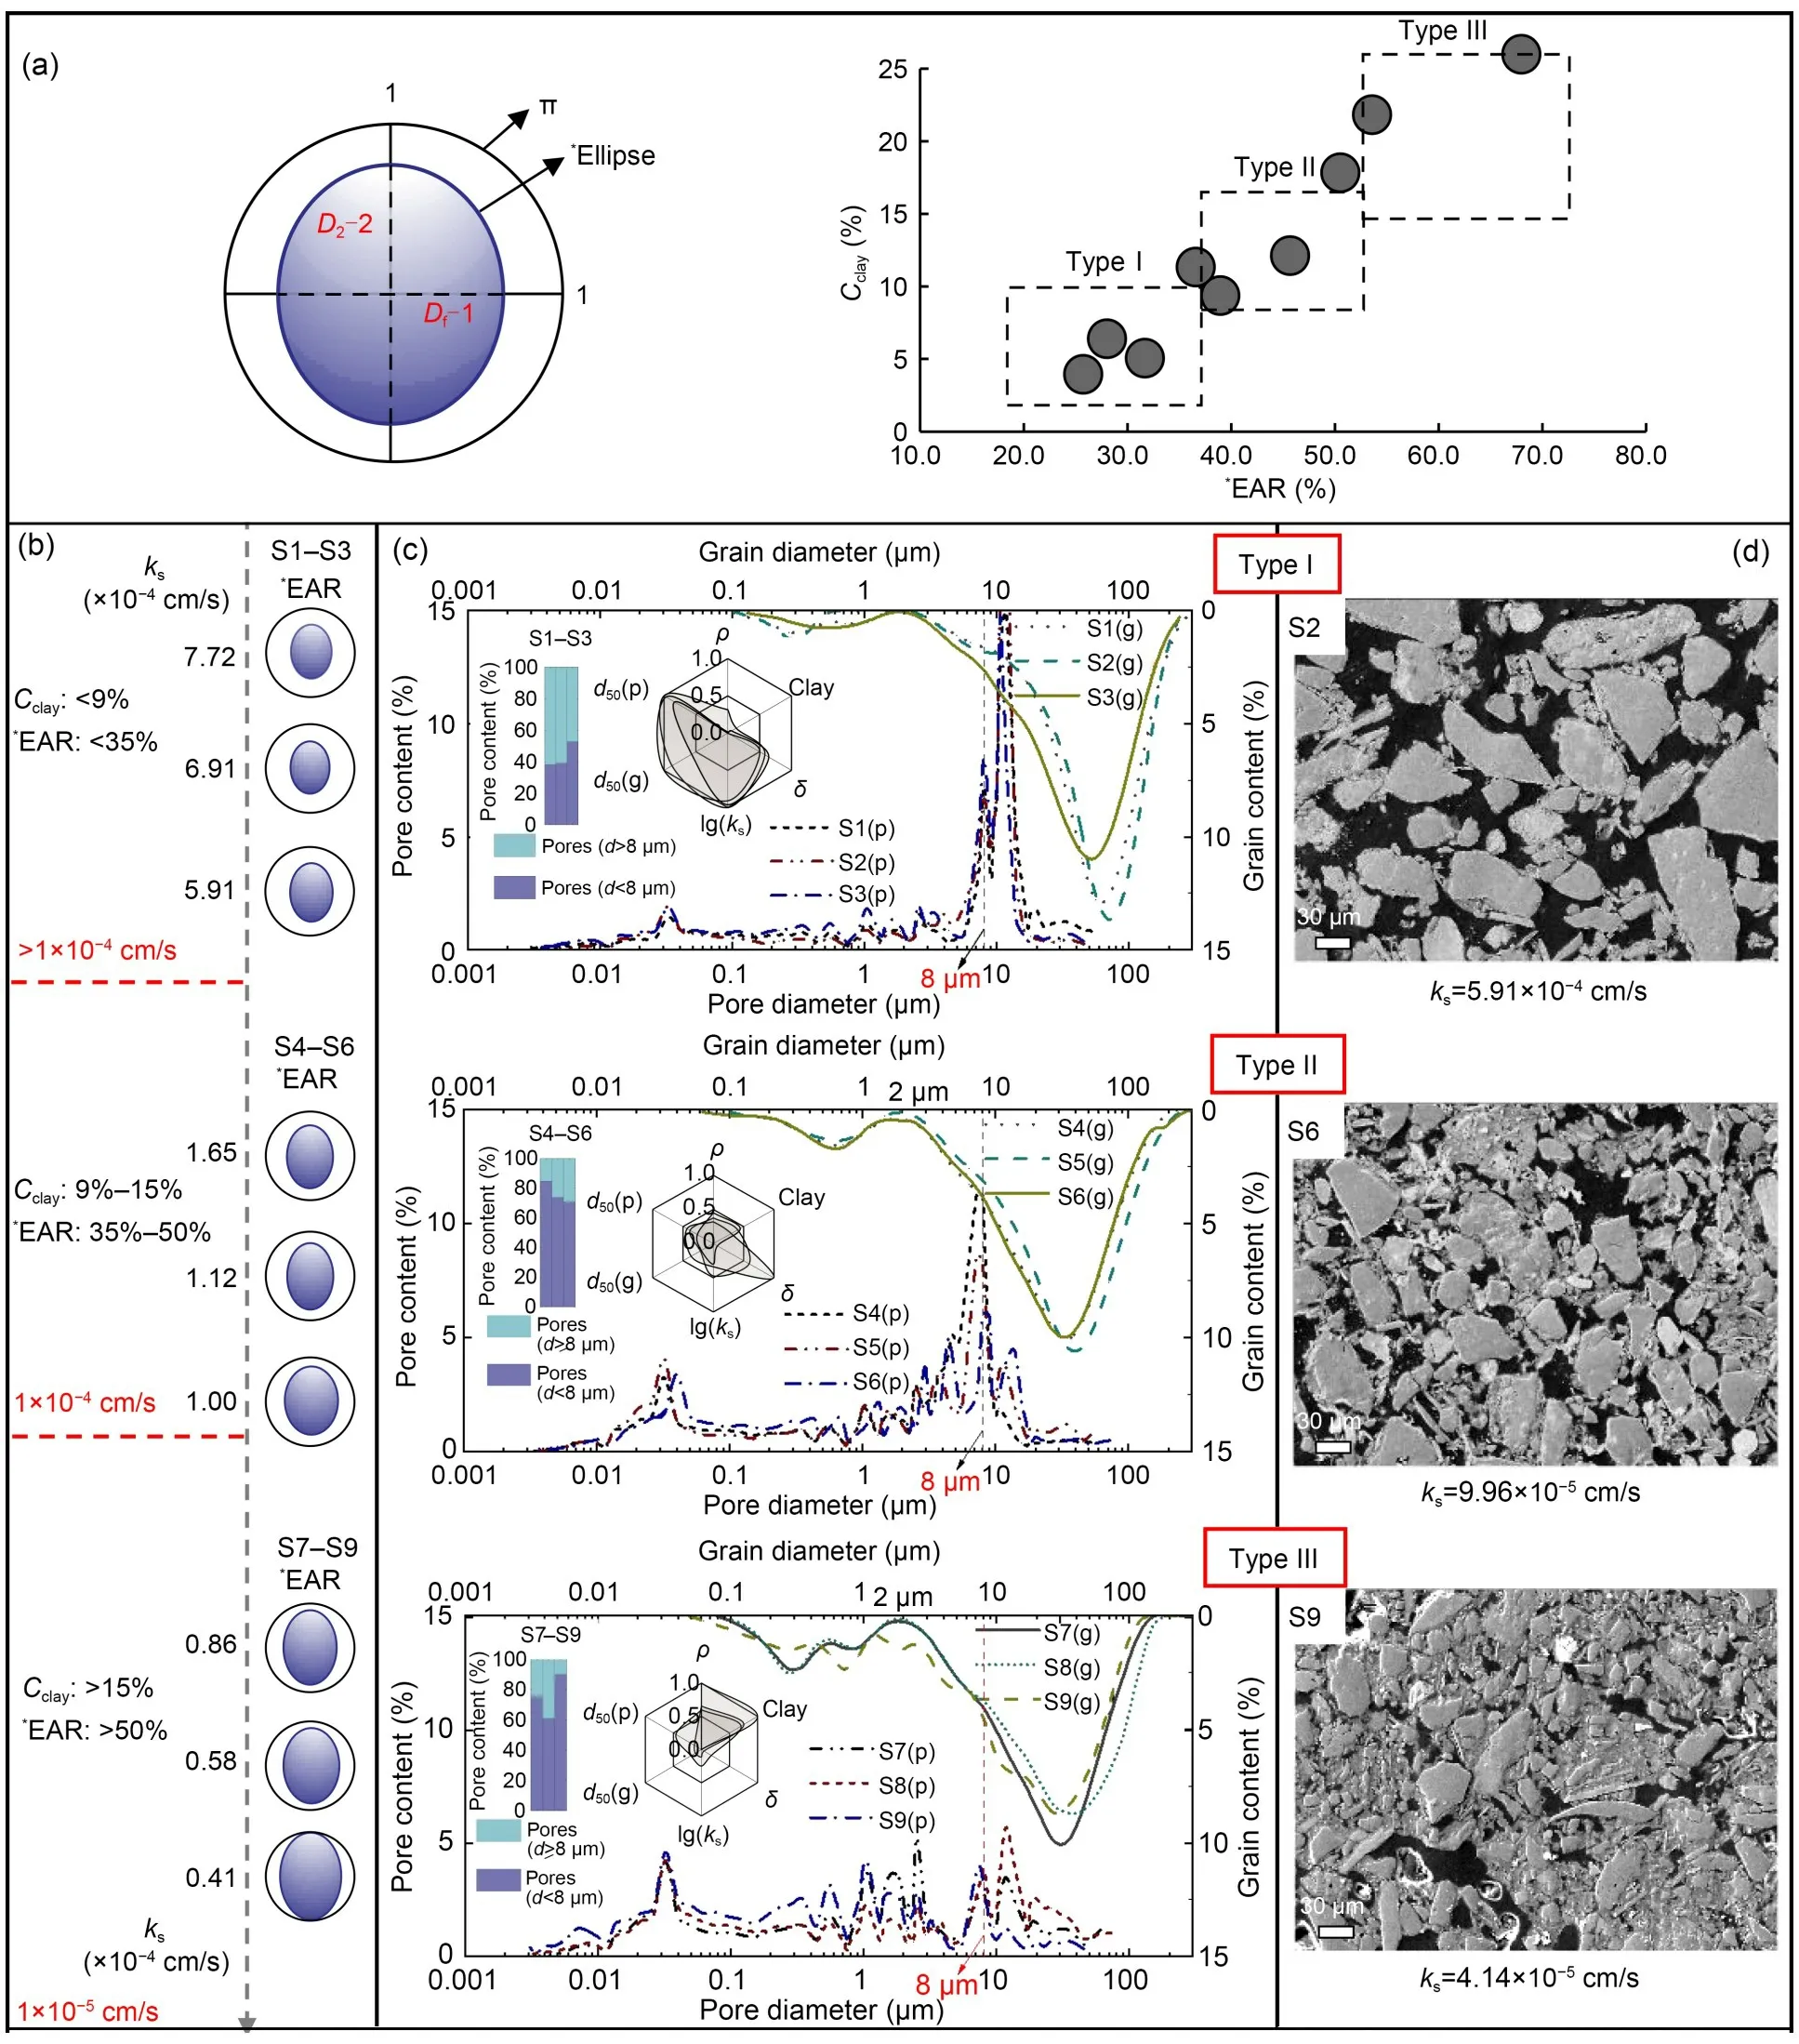
Fig.1 SEM image processing ((a)–(d)) and the box-counting fractal dimension calculation ((e) and (f)).Blue color represents the pores and white color represents the grains in step (b).Different colors represent different diameters in step (c).Df ( For a comparative analysis of the different frac‐tal models,test samples with the same pore size range should be delineated.This pore size range is referred to as the fractal region in this study.The pore classifi‐cation rule (Lei,1987,1988),referenced by many re‐searchers (Wang et al.,2019;Wei et al.,2019a,2020a,2020b;Li ZQ et al.,2021),was used in this study (Fig.2).Lei (1987) considered a pore less than 8 μm in diameter as a small pore or a micropore in loess (Table 2).In addition,the fractal region ratio(the minimum diameter to the maximum diameter in this region) should be smaller than 1×10⁻³(Mandel‐brot,1982;Yu and Li,2001) so that the calculated fractal dimension has a representative and fractal scaleless band. Fig.2 Pores viewed in SEM images in this study Table 2 Routine pore classification (Lei,1987) Hence,0.006 μm was chosen as a starting pore diameter in the fractal region and 8 μm as an ending pore diameter (0.006 μm was the maximum value of the minimum pore diameters of all the samples con‐sidered in this study,whereas 8 μm was the upper lim‐it of small-micro pores considered by previous studies(Lei,1987,1988).The fractal region of the smallmicro pores ranged from 0.006 μm to 8 μm,and the fractal region ratio was 0.75×10⁻³<1×10⁻³(Yu and Li,2001).The corresponding fractal dimensions were ob‐tained by applying each of the six models compared in this study. Nine samples were collected from typical Q3Malan loess profiles in the Lvliang Mountain area(Liulin,Xixian,Daning,Jixian,Lanxian,Jiaocheng,Xiaoyi,and Fenxi counties) in Shanxi Province,China.The robust exhumation was able to produce samples with dimensions of 40 cm×40 cm×40 cm at a sampling depth of 3–10 m.The physical indices of the samples were then determined (Table 3) using the geotechni‐cal test standard GB/T 50123-2019 (MOHURD and SAMR,2019).The particle composition was obtained using a Bettersize 2000 laser molecule measure ana‐lyzer.The powder contained between 61.97% and 78.45% of the particles,i.e.,within the range of the ordinary aeolian Malan loess. Table 3 Physical parameters of the samples A laboratory falling-head permeability test by TST-55 soil penetrometer (Nanjing Soil Instrument Factory,China) (6.18 cm×4.00 cm) was used to de‐termine the saturated water permeability of the test samples. The apparent variation among the samples from S1 to S9 was as follows (Table 3): the range in clay content was 4.58%–22.55%;the range in density was 1.47–1.68 g/cm3;the range in saturated water permea‐bility was 4.14×10⁻⁵–7.72×10⁻⁴cm/s. Water in the pore structure can affect the results when determining the pore structure of intact loess,so samples should be dried before SEM and MIP testing.Three methods are commonly used for soil drying:oven-drying (at 105 °C),freezing-drying,and airdrying.Oven-drying has the advantage of a fast-drying time.However,the rapid evaporation of water can cause damage to the soil microstructure,leading to problems such as dry cracking.Freeze-drying works on the principle of the sublimation of ice crystals and requires freezing the samples first.However,it has certain disadvantages including high cost and the like‐lihood of causing freeze-swelling damage to the micro‐structure during the freezing process.Air-drying is the process of naturally drying samples in a cold,venti‐lated place to minimize damage to the microstructure caused by evaporation.It is inexpensive,but the pro‐cess is slow,and often takes 7–10 d to complete.Con‐sidering the pros and cons of these methods,the airdrying method was chosen for this study. The naturally air-dried samples were cut into cubes of 2.0 cm×2.0 cm×1.5 cm.Then,an AutoporeIV9500 mercury porosimeter (Micromeritics company,USA)was used to perform the MIP test in accordance with Chinese standard (AQSIQ,2012).The pressure range for the mercury porosimeter was measured to be 0.003–414 MPa.However,due to the possible pres‐ence of some visible wormholes,root holes,cracks,the rough undulations on the surface of samples,and the limited minimal pressure of the MIP apparatus,the mercury might infiltrate or mistakenly detect pores of larger diameter (Mu et al.,2020,2022).Thus,to determine the pores within the actual structure in this study,it was necessary to avoid these mega-pores while preparing MIP test samples.Following the MIP test,the diameter of the actual largest pore was ob‐tained by determining the threshold entry pressure(Fig.S1 of the electronic supplementary materials(ESM)),Pt,i.e.,the pressure at which mercury enters the largest-diameter pore (Robinson,1966;Pittman,1992;AQSIQ,2012). The SEM test method was performed according to Li and Li (2017).The naturally air-dried loess sam‐ples were cut into cubes of 2.0 cm×2.0 cm×1.5 cm and covered with special glue.The test samples were cut into thin discs and polished.A JSM-7500 field emission microscope (JEOL Company,Japan) (mag‐nification 400×,image resolution 0.46 μm) was used to inspect the samples and obtain images.The boxcounting fractal dimensions were calculated using the SEM images of the test samples. Models 1 and 6: The decision coefficient (ad‐justedR2) of the fitting equation represents the linear goodness of fit for a fractal curve.A better linear fit suggests better fractal properties,and the linear fit is good when the decision coefficient is close to 1.0.The fractal curves of Models 1 and 6 showed a somewhat poor linear fit in the fractal regions.The fractal curves of Model 1 started to fall steadily from 5.680 μm(Fig.S2 of the ESM);therefore,its fractal region was practically 0.006–5.680 μm.The fractal curves of Model 6 exhibited more curvilinear features than straight lines (Fig.S3 of the ESM).Hence,the fractal property of Model 1 was better than that of Model 6,according to the decision coefficients (Fig.3a,Table 4).The fractal dimension ranges (D1andD6) of Models 1 and 6 in the fractal region were 2.69–2.83 and 2.40–2.60,respectively. Fig.3 Correlation analysis: (a) the averages of adjusted R2 and D values for each model;(b) correlations between fractal dimensions and physical properties (the green circles represent suitable fractal models and key physical parameters,e.g.,saturated water permeability);(c) relationship between 3D and 2D pore structures Table 4 Fractal results Models 2 and 5: These models had similar inflec‐tion points of around 8.0 μm on their fractal curves(Figs.S4 and S5).Furthermore,the linear fit of Model 2 was much better than that of Model 5.The fractal dimension range in the fractal region was 2.59–2.98 for Model 2 (D2),and was 2.04–2.25 for Model 5 (D5)(Fig.3a,Table 4). Models 3 and 4: these models had no noticeable inflection points on their fractal curves and seemingly had single fractal dimensions (Figs.S6 and S7).Fur‐thermore,their fractal properties were better than those of the other models based on their decision coeffi‐cients (Fig.3a,Table 4).However,their fractal dimen‐sion values (D3andD4) were different.The range of fractal dimensions in the fractal region was 2.75–3.00 for Model 3 (D3) and was 2.67–2.74 for Model 4 (D4)(Fig.3a,Table 4). The results of the fractal models (D1,D2,D3,andD4) were selected for the subsequent analyses to find suitable models (Fig.3a).Their decision coefficients were greater than 0.94 (the mean of all theR2values of the test samples based on the six MIP fractal mod‐els),suggesting that these models had better goodness of fit than Models 5 and 6. D2(Model 2 results) had the strongest positive correlation,with a significantp-value of 0.01 (Fig.3b).Moreover,D2was positively correlated with clay con‐tent and density,and negatively correlated with the saturated water permeability and median particle size(d50(g)) (Fig.3b).Note that the fractal results of Model 2 (D2) in the fractal region showed a strong positive correlation and an orderly upward trend with the SEM box-counting fractal dimensions (Df(<8 μm)) (Figs.3b and 4b).Hence,Model 2 was suitable for characteriz‐ing the small-micro pores in this study. The structural characteristics of pores in 3D space are theoretically reflected in some representative 2D planes (Mandelbrot,1982;Yu and Li,2001).The 3D pore structure of loess with relatively uniform particle distribution can be simplified as a stack of a series of thin 2D sections (Fig.3c).Therefore,2D-SEM results can be used to estimate 3D-MIP fractal results,such as those from Model 2.Similar findings were ob‐tained by Mahamud and García (2018) and Xiao et al.(2022).They used Model 2 (the Neimark model) to characterize loess and coal pores,and their fractal re‐sults were related to pore structure. The test samples showed visible differences in the SEM images and the MIP data.From S1 to S9,the content of larger pores decreased while those of smaller pores (<8 μm) (Figs.4a–4c) and clay grains(Fig.4a) increased.The results from both the boxcounting method (Df)and Model 2 (D2) increased in an orderly manner from 1.44 to 1.69 and from 2.59 to 2.98 (Fig.4b),respectively. Fig.4 Pore (p) structure characteristics and results from Model 2: (a) pore structure of the test samples from the SEM test;(b) fractal dimensions from Model 2;(c) pore structure of the test samples from the MIP test As the clay content increased,the dominant par‐ticles in the soil skeleton changed from silt to clay,and individual silt particles could not clearly be seen in SEM images.Clay particles tended to stick firmly to the edges of silt grains and fill the spaces between silt particles.Similar results were obtained by Liu et al.(2016) and Mu et al.(2019).Moreover,in this study,this process led to a decrease in the number of macromeso pores and an increase in the number of smallmicro pores. The pore structure tended to be complex and het‐erogeneous,with an increasing proportion of smallmicro pores.The pore structure also increased the sur‐face roughness (Figs.3c and 4a).The roughness and heterogeneity led to the 3D-MIP and 2D-SEM fractal dimensions presenting an upward trend.After all,the pore structure,and not the fractal model type,controls the fractal characteristics.Finally,this process de‐creased the dominant flow line and the water-saturated permeability properties. The theoretical range of fractal dimensions is 2–3 for 3D pores and 1–2 for 2D pores (Mandelbrot,1982;Yu and Li,2001).A 3D fractal dimension (D3D)value (minus two) was coupled with the 2D fractal di‐mension (D2D) value (minus one) to form an ellipse(marked*Ellipse) with a theoretical area of 0–π(Fig.5a).This*Ellipse area ratio (*EAR) was used to show how close it was to π.*EAR=(D3D−2)×(D2D−1)×π/(1×1×π)×100%.In this study,the fractal dimensions of Model 2 (D2) and the SEM’s box-counting fractal dimension (Df) were considered as the two main axes of the*Ellipse (Fig.5a),and the*EAR was then calcu‐lated (Fig.5a).To compare differences among sam‐ples,a normalization method was applied to the physi‐cal indexes (the formula wasX′=(X−Xmin)/(Xmax−Xmin),whereXis a soil physical parameter,such as natural density,clay content,median grain diameter,median pore diameter,collapsibility coefficient,and saturated water permeability coefficient,Xminis the minimum value andXmaxis the maximum value of the physi‐cal parameter among all the samples considered in this study,andX′ is the normalized physical parame‐ter),as shown in Fig.5c. Fig.5 Fractal dimensions,microstructure,and permeability evaluation: (a) a new specific *Ellipse parameter (*EAR)and microstructure types;(b) *EAR and saturated water permeability;(c) PSD and GSD curves and microstructure types of samples;(d) microstructure observed under SEM.Si(p): PSD curves of test samples;Si(g): GSD curves of test samples The test samples could be classified into three categories based on their clay contents and*EAR,and corresponding to three typical microstructure types,type I,type II,and type III (Figs.5a and 5b).The three distinct microstructure types affected saturated water permeability.In type I,the grain size distribu‐tion (GSD) and PSD curves showed typical bimodal characteristics.Clay content,density,and content of pores (<8 μm) were lower than those of the other types.In type II,the GSD and PSD curves showed typical bimodal features,while clay content,density,and content of pores (<8 μm) were intermediate.In type III,the GSD and PSD curves showed multimodal characteristics,and clay content,density,and content of pores (<8 μm) reached a new high level (Figs.5c and 5d). The microstructure of the soil changed notice‐ably when its clay content was between 9% and 15%and its*EAR values were between 35% and 50%(Figs.5b and 5c).This marked the transition from type I to type II microstructure (Figs.4b,4c,5c,and 5d).The saturated water permeability approached a magnitude of 1×10⁻⁴cm/s.When the clay content was greater than 15% and the*EAR values greater than 50% (Figs.5a and 5b),the microstructure ultimately transitioned from type II to type III (Figs.4b,4c,5c,and 5d).This marked a steep change in saturated water permeability (from 1×10⁻⁴cm/s to 1×10⁻⁵cm/s)for the loess.Notably,as the*EAR value increased,the microstructure became more complex and hetero‐geneous and,correspondingly,the saturated water per‐meability declined (Figs.5b–5d). A systematic fractal analysis method,including six popular fractal models based on MIP tests,was ap‐plied to study the fractal features of small-micro pores of intact loess.In addition,some routine laboratory tests and SEM imaging were conducted to analyze the pore structure and MIP fractal results.The main find‐ings were as follows: (1) Model 2 (the Neimark model) of the region of the small-micro pores showed a very good linear fit (decision coefficients greater than 0.94–the aver‐age of all MIP fractal models).The results showed a strong positive correlation with clay content,density,and saturated water permeability,and followed an or‐derly upward trend that matched that of the boxcounting fractal dimensions of SEM images. (2) A high content of clay particles leads to an in‐crease in the number of small-micro pores.These small-micro pores also cause more surface roughness and heterogeneity in the pore structure,which tends to present large fractal dimensions.This process leads to a decrease in the content of macro-meso pores and the dominant flow line,thereby degrading the saturated water permeability properties. (3) A new*Ellipse and its area ratio (*EAR) pa‐rameter were introduced in this study,in which the two main half-axes consist of the Neimark model’s re‐sults (minus two) and the box-counting fractal dimen‐sions (minus one).The*EAR and clay content can be used as valid parameters to quantitatively evaluate the type of loess microstructure and the saturated water permeability.The loess microstructure transitions from type I to type II when the*EAR is between 35% and 50% and the clay content is between 9% and 15%.The microstructure further transitions from type II to type III when the*EAR is greater than 50% and the clay content is greater than 15%.Correspondingly,the saturated water permeability shows a downward trend in magnitude from 1×10⁻⁴cm/s to 1×10⁻⁵cm/s.These results can serve as reference values for the classification of the soil microstructure,seepage fail‐ure,and water storage of loess in the field of civil engineering. Acknowledgments This work is supported by the China Geological Survey Project (No.DD20190642) and the Shaanxi Provincial Key Research Program of China (No.2019ZDLSF07-07-02). Author contributions Yaming TANG designed the research.Tuo LU,Bo HONG,and Wei FENG processed the corresponding data.Tuo LU wrote the first draft of the manuscript.Yongbo TIE helped to organize the manuscript.Yaming TANG revised and edited the final version. Conflict of interest Tuo LU,Yaming TANG,Yongbo TIE,Bo HONG,and Wei FENG declare that they have no conflict of interest.2.3 Fractal region of small-micro pores
3 Samples and testing methods
3.1 Sample information and routine physical tests
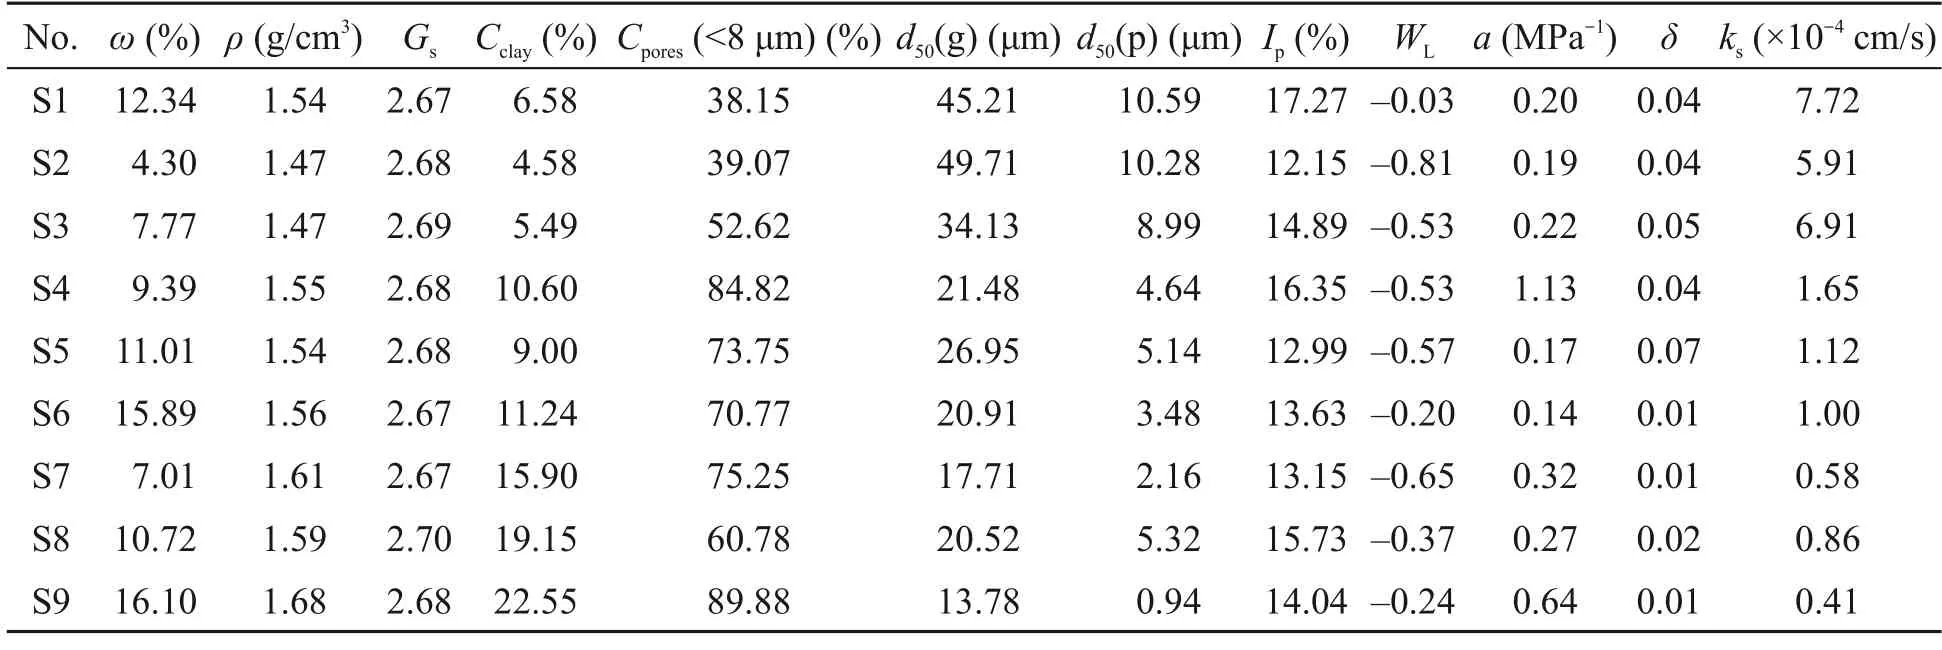
3.2 MIP and SEM tests
4 Results
4.1 Results of fractal models
4.2 Suitable fractal model for small-micro pores
5 Discussion
5.1 Relationship between fractal dimensions and pore structure/permeability
5.2 Fractal dimensions and evaluation of micro‐structure and permeability properties
6 Conclusions
 Journal of Zhejiang University-Science A(Applied Physics & Engineering)2023年7期
- Journal of Zhejiang University-Science A(Applied Physics & Engineering)的其它文章
- Numerical investigation of the effect of geosynthetic clay liner chemical incompatibility on flow and contaminant transport through a defective composite liner
- Monotonic uplift behavior of anchored pier foundations in soil overlying rock
- Underwater minirobots actuated by hybrid driving method
- Square cavity flow driven by two mutually facing sliding walls
- Bogie active stability simulation and scale rig test based on frame lateral vibration control
- Analytical solution of ground-borne vibration due to a spatially periodic harmonic moving load in a tunnel embedded in layered soil