
Numerical investigation of the effect of geosynthetic clay liner chemical incompatibility on flow and contaminant transport through a defective composite liner
2023-07-24 10:07ShiyuanYAOYuchaoLIShanTONGGuannianCHENYunminCHEN
Shiyuan YAO ,Yuchao LI ,Shan TONG✉ ,Guannian CHEN,2,3 ,Yunmin CHEN
1MOE Key Laboratory of Soft Soils and Geoenvironmental Engineering, Department of Civil Engineering, Zhejiang University, Hangzhou 310058,China
2School of Civil &Environmental Engineering and Geography Science, Ningbo University, Ningbo 315211, China
3Ningbo ZCONE High-tech Co., Ltd., Ningbo 315000, China
Abstract: A composite liner consisting of a geomembrane (GMB) and a geosynthetic clay liner (GCL) can be compromised by inorganic contaminants because of a defective GMB.When the composite liner with defective GMB is exposed to aggressive leachate conditions,the neglect of the chemical incompatibility of the GCL can potentially result in an underestimation of the leakage rate and flux through the composite liner.This paper proposed a numerical investigation on the effect of chemical incompatibility of GCL on the barrier performance of the composite liner with hole defect.Four cases with leachate solutions having varied cation valencies and ionic strengths were analyzed,in which the hydraulic conductivity of GCL was concentration dependent.Both the effect of the chemical incompatibility of GCL and the mechanisms were analyzed.The incompatibility of GCL resulted in significant increases in leakage rate and flux through the composite liner by factors of up to 4.9 and 5.0,respectively.The incompatibility-affected area in GCL is located within 0.1 m from the center of the hole in the GMB.The coupled increase in the hydraulic conductivity of GCL and pore water concentration impacts the flux and leakage in a short period of time.With GCL chemical incompatibility considered,advection may dominate the contaminant transport through GCL.
Key words: Geosynthetic clay liner (GCL);Chemical incompatibility;Leakage;Contaminant transport;Hydraulic conductivity
1 Introduction
Liners are installed at the bottom of waste con‐tainment systems (e.g.,landfills) to prevent contami‐nants from migrating to the surrounding environment.Composite liners,typically comprising a geomembrane(GMB) overlying a low permeability soil liner (i.e.,geosynthetic clay liner (GCL) or compacted clay liner(CCL)),are commonly used in modern landfills (Rowe and Brachman,2004;Rowe,2012).A permeable layer or a subsoil may be constructed at the base of the composite liner,to act as an attenuation layer (AL).The most commonly used GMB in composite liners is high-density polyethylene GMB,due to its high resistance to the transport of a variety of chemicals(Thomas and Koerner,1996).Water and contaminants can barely migrate through an intact GMB via advec‐tion,and the diffusion of inorganic contaminants through an intact GMB is negligible due to its low diffusive coefficients (i.e.,approximately five orders of magni‐tude lower than in soils) (Rowe,1998).However,ex‐perience has shown that defects in GMBs are almost inevitable.Rowe (2012) reported seven causes of de‐fects in GMBs,including manufacturing and installa‐tion defects,waste placement in landfills or cleaning in leachate lagoons,and stress cracking due to the GMB aging.Thus,for a composite liner,the primary migration pathway for inorganic solutes is through defects in the GMB via advection,then through the GCL/CCL via advection and diffusion (Foose et al.,2001,2002;Rowe,2012).
A GCL typically comprises a thin layer of bentonite sandwiched by two layers of geotextiles with needlepunching reinforcement.The excellent containment property of GCL is attributed to the low hydraulic conductivity of the bentonite when properly hydrated.However,GCL is susceptible to chemical attack due to the incompatibility of the bentonite with aggressive leachates containing high cation valency,high ionic strength,or extreme pH.The significant increase in hydraulic conductivity of GCL (kGCL) when the GCL is exposed to inorganic solutions (e.g.,whereis the hydraulic conductivity of GCL per‐meated with deionized water (DIW)),has been dem‐onstrated by extensive laboratory experiments (Petrov and Rowe,1997;Petrov et al.,1997;Jo et al.,2001,2004,2005;Vasko et al.,2001;Kolstad et al.,2004;Katsumi et al.,2007).Such chemical incompatibility is one of the greatest concerns when employing GCLs in waste containment systems.
A comparison ofkGCLbased on flexible-wall hydraulic conductivity tests with DIW and inorganic solutions with solute concentrations (c) ranging from 0.005 to 1 mol/L is shown in Fig.1.The values ofkGCLvary between 9×10⁻¹²and 3×10⁻¹¹m/s with DIW,and increase by up to 5 orders of magnitude (i.e.,5×10−6m/s)with increasing solute concentrations.However,the relationship betweenkGCLandcis nonlinear.ThekGCLonly increases by a factor of up to 5 at dilute concen‐trations (i.e.,c≤0.01 mol/L),but significantly increases by 1–5 orders of magnitude at aggressive concentra‐tions (i.e.,c>0.01 mol/L).ThekGCLfor the solutions with divalent cations,with most values exceeding 1×10⁻⁹m/s whenc≥0.025 mol/L,generally is greater than that for the solutions with monovalent cations,with most values lower than 1×10⁻⁹m/s except for NH4Cl.The chemical compatibility can be enhanced by allow‐ing GCLs to be hydrated with water before being ex‐posed to chemical solutions,i.e.,prehydration treat‐ment.As shown in Fig.1,a 1–4 orders of magnitude difference inkGCLexists between prehydrated and nonprehydrated GCLs when permeated with the same solutions (Petrov and Rowe,1997;Ruhl and Daniel,1997;Shackelford et al.,2000;Vasko et al.,2001;Jo et al.,2004).
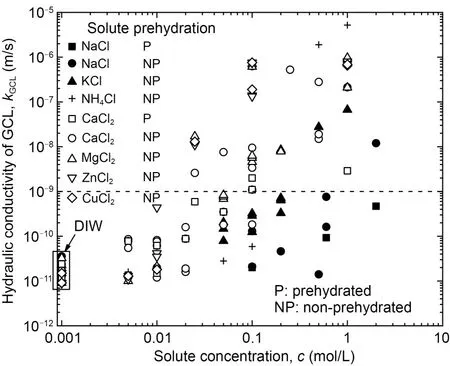
Fig.1 Hydraulic conductivity of GCL with deionized water and inorganic solutions (Petrov and Rowe,1997;Shackelford et al.,2000;Jo et al.,2001,2005;Vasko et al.,2001;Lee and Shackelford,2005;Lee et al.,2005;Katsumi et al.,2007;Setz et al.,2017;Chai and Prongmanee,2020)
In previous studies the mechanism of contami‐nant transport in composite liners has been extensively studied by using numerical methods,andkGCLis an essential parameter in the assessment of contaminant transport.Foose et al.(2002) compared the solute transport in three composite liners using a 3D nu‐merical model,in which the values ofkGCLused were representative values for GCLs permeated with real leachate (i.e.,1×10−11and 1×10⁻¹²m/s).Rowe and Brachman (2004) assessed the equivalence of GCL and CCL in composite liners using a 1D model with a relatively large value ofkGCLof 2×10⁻¹⁰m/s to repre‐sent the increases inkGCLwith leachate and suggested that the barrier systems should be designed based on a higherkGCLto avoid the effect of increases inkGCLwhen the GCL is exposed to leachate.Saidi et al.(2006) calculated the impact on flow rate and wetted area of a composite liner involving partially saturated GCL using 2D and 3D numerical models where the hydraulic conductivity of GCL was related to satura‐tions.El-Zein et al.(2016) simulated the transport of inorganic contaminants in a triple composite liner with multiple defects using 2D numerical models,in which different values of the hydraulic conductivity of GCL were considered.Rowe and AbdelRazek (2019) ana‐lyzed the effect of hydraulic conductivity and interface transmissivity on the leakage and contaminant trans‐port in a composite liner by using a 2D finite element model and a semi-analytical approach,in whichkGCLwas dependent on the stress.Many of these studies considered varyingkGCLwith different contaminant con‐centrations (i.e.,the chemical incompatibility of GCL)in the contaminant transport modelings.However,the transient changing ofkGCLwith increased pore concen‐tration as contaminant migrates through the liner,and the effect of this coupled increase in bothkGCLand pore water concentration on the barrier performance of composite liners has not been quantitatively investi‐gated,as most numerical studies of contaminant trans‐port assumed constant values ofkGCLin such studies.
The values ofkGCLadopted by Foose et al.(2002)and Rowe and Brachman (2004) were from experi‐mental data measured by Ruhl and Daniel (1997) for GCLs permeated with a municipal solid waste (MSW)landfill leachate solution from the mid-western USA,which comprised 16 mmol/L monovalent cation (Na+)and 9 mmol/L divalent cations (Ca2+and Mg2+).How‐ever,the concentrations of cations in the leachate were lower than typical values reported for MSW landfill leachates.For example,Kjeldsen et al.(2002) reported that the maximum concentrations of Na+,Ca2+,and Mg2+in MSW leachates were 335,180,and 625 mmol/L,respectively,based on the data collected from 14 MSW landfills.Higher inorganic cation concentrations also have been found for the leachates from other types of solid waste landfills,such as hazardous waste (HW)landfills and MSW ash landfills.Rowe et al.(2004)summarized the leachate characteristics of three HW landfills and six MSW ash landfills and found that the average and maximum concentrations of monovalent cations in the HW landfills were 228 and 347 mmol/L,respectively;the average concentrations of monova‐lent and divalent cations in MSW ash landfills were 79 and 80 mmol/L,whereas the maximum concen‐trations of the two types of cations were 220 and 222 mmol/L.Khodary et al.(2020) also reported a very high Na+concentration of 660 mmol/L in the leachate from the El-Nasreya landfill in Egypt (a hazardous waste landfill).Moreover,the use of GCL composite liners has recently extended to mining and other in‐dustrial facilities (Bouazza et al.,2014) such as solar ponds,reverse osmosis ponds,and brine ponds,in which high salt concentrations may occur.El-Sebaii et al.(2011) found that the concentration of NaCl at the bottom of a solar pond was 26%,which was roughly equivalent to 4400 mmol/L.Abdulsalam et al.(2017)reported that the Na+concentration in a brine pond was as high as 1000 mmol/L.Thus,the values ofkGCLused in most of the previous studies on contaminant transport may be relatively low and may have resulted in an underestimation of the containment properties of the GCL.In addition,it is necessary to investigate the effect of the coupled increase ofkGCLwithcon the containment properties of long-term barriers under a high salt concentration environment.
In this paper,the effect of coupled increasedkGCLwithcon the barrier performance of a composite liner comprising a defective GMB and a GCL is investigated with varied cation valence and ionic strength (I0) in the permeating leachates based on a 2D numerical model.The contaminant transport process in the GCL is analyzed in terms of the changes in distributions of cation concentration,hydraulic conductivity,hydraulic head,flow rate,and total contaminant flux in GCL with time.In addition,comparisons of advective and diffu‐sive transport of contaminants through the composite liner are also discussed.
2 Model
2.1 Geometry
A 2D axisymmetric model of a composite liner comprising a thickness-neglected GMB and a 7-mmthick GCL,overlaying a 2-m-thick AL was estab‐lished,withrrepresenting the radial direction andzrepresenting the vertical direction,as shown in Fig.2.The GMB had a 5-mm-radius hole (rh=5 mm),repre‐senting a large circular defect in the GMB (Giroud,1997).The center of the hole was set as the origin of the coordinates,that is,r=0 m andz=0 m.The radius of the model (rm) was set to be sufficiently wide (i.e.,6 m) to eliminate the impact of the lateral boundaries on the flow and contaminant transport simulations.The composite liner was assumed to be a saturated,homogeneous,and isotropic porous medium.
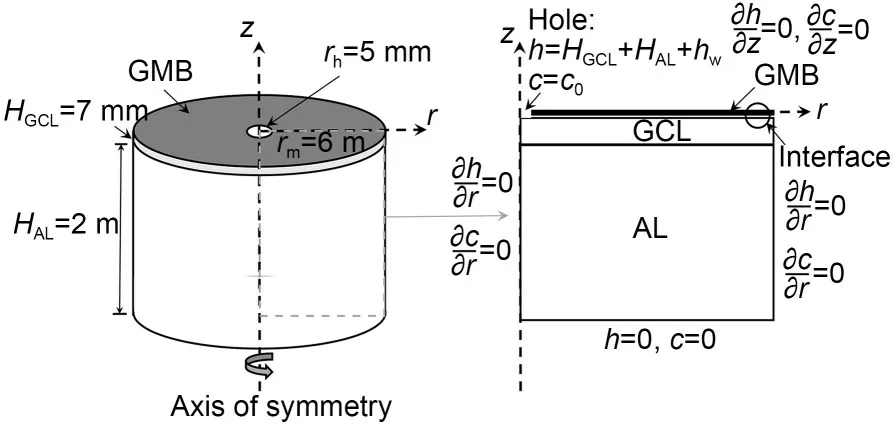
Fig.2 Schematic of the 2D axisymmetric model of the composite liner above the AL (not in scale)
To simulate the interface leakage between the GMB and the GCL,a 0.1-mm-thin layer was added between the two layers,which was within the range of 0.02 to 0.15 mm recommended for geomembranesoil spacing by Brown et al.(1987).
2.2 Governing equations and boundary conditions
Darcy’s law and the advection-diffusion equation for porous media (Javandel et al.,1984) were used for the flow and contaminant transport simulations:
wherekis the hydraulic conductivity (m/s) of the po‐rous media;his the total hydraulic head (m);nis the porosity;Ris the retardation factor;tis the time (s);D*is the effective diffusion coefficient (m2/s);uis the Darcy’s velocity vector;cis the solute concentration(mol/L).
The steady-state Darcy seepage field was set as the initial flow distribution in the composite liner.The initial pore water concentration in the composite liner was assumed to be zero.
The boundary conditions of the model are shown in Fig.2.The GMB,the axis of symmetry,and the lateral boundary were set to be no-flow boundaries for seepage and no-flux boundaries for contaminant trans‐port.The bottom of AL was set to be a zero hydraulic head boundary for flow (corresponding to free drain‐age) and a zero-concentration boundary for contami‐nant transport (preliminary estimations had shown that the zero-concentration or zero-concentration gradient boundary of the bottom of AL had no significant im‐pact on the result of contaminant transport in this model).The hole in the GMB was assumed to be a constant hydraulic head boundary and a constant concentration boundary.The constant hydraulic head boundary was described as follows:
wherehwis the depth of leachate (m),which was as‐sumed to be 0.3 m in this study;HGCLis the thickness of GCL (m);HALis the thickness of AL (m).
2.3 Material parameters and simulation cases
Since the leachates in HW and MSW ash and some MSW landfills contain high concentrations of inorganic cations that may induce chemical incompat‐ibility of GCL,the source concentrations (c0) in the mod‐eling were selected to be 150,300,and 600 mmol/L for NaCl and 50,100,and 200 mmol/L for CaCl2,with the sameI0of 150,300,and 600 mmol/L,repre‐senting low,mean,and maximum values of inorganic solute concentrations in aggressive leachates reported in the aforementioned experimental studies.
Rowe and Abdelatty (2012) reported that the effect of variations ofD*within a reasonable range on the contaminant transport through GCL was not sig‐nificant.The averageD*of Na+and Ca2+in GCL were 4.2×10⁻¹⁰and 1.1×10⁻¹⁰m2/s,according to laboratory test results from Lake and Rowe (2000) and Shackel‐ford and Lee (2003).
For the interlayer between the GMB and the GCL,the value of interface transmissivity between the GMB and GCL (θ) was assumed to be 2×10⁻¹¹m2/s,in accor‐dance with Barroso et al.(2006) and Rowe and Ab‐delatty (2012).Thus,the equivalent hydraulic conduc‐tivity of the GMB/GCL interface (kIF) was 2×10⁻⁷m/s,according to the equation proposed by Giroud and Bonaparte (1989):
wheresis the thickness of interface (m).
The adsorption of Na+and Ca2+of the clay in the composite liner was considered in this period.Hence,the retardation factors and other parameters of the materials are summarized in Table 1.The frequency of holes on the GMB was assumed to be 2.5 holes/ha,which is an appropriate value corresponding to the scenario of GMBs installed with strict construction quality assurance (Giroud and Bonaparte,2001).
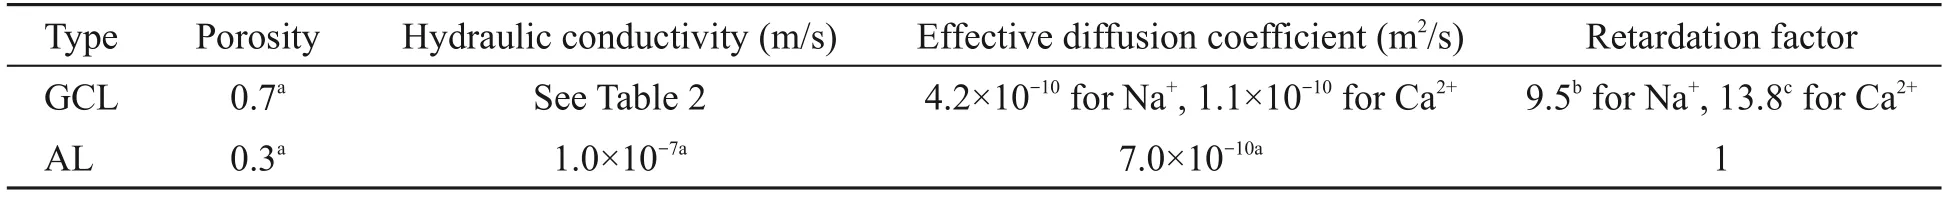
Table 1 Material parameters and transport properties of GCL and AL
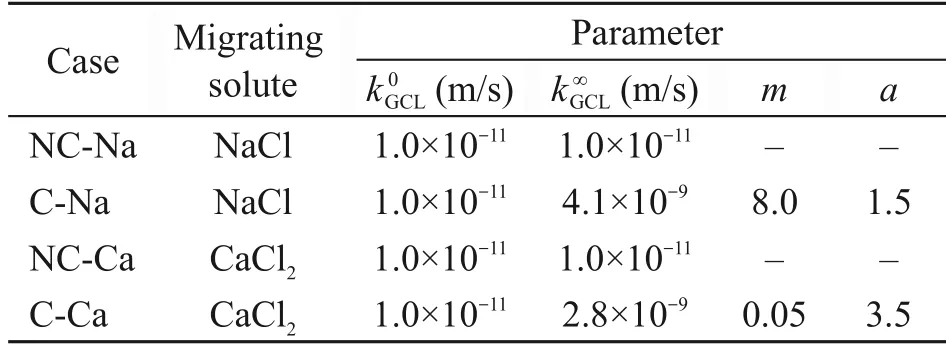
Table 2 Simulation cases and values for parameters
Dissolved inorganic salt is a major group of com‐ponents of MSW landfill leachates,along with vola‐tile fatty acids,heavy metals at low concentrations,and volatile organic compounds (Rowe and AbdelRazek,2019).Since chloride was not affected by precipita‐tion,sorption,or biodegradation (Rowe et al.,2004),NaCl and CaCl2were regarded as the representative inorganic contaminants with monovalent and divalent cations in this paper.Two sets ofkGCL-cdata from experimental studies in the literature were selected for the simulations (Fig.3).All thekGCLvalues used in this paper were measured after chemical equilibrium in the corresponding hydraulic conductivity tests had been achieved,and thus can be adopted as the long-termkGCLwith salt solutions (Jo et al.,2005).As shown in Fig.3,a logistic function was adopted to describe the relationship between the measuredkGCLandc:the concentration in GCL increases over time in the simulation process,in the cases of NC-Na and NC-Ca,kGCLwas assumed to be constant (i.e.,=1×10⁻¹¹m/s) throughout the modeling.
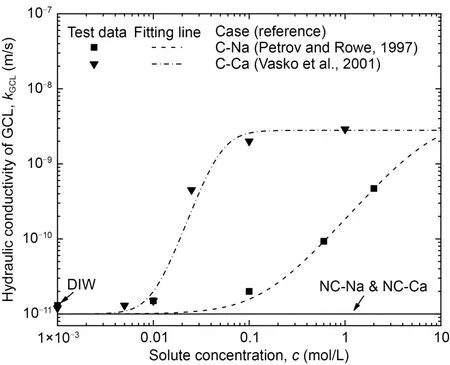
Fig.3 Hydraulic conductivity of prehydrated GCLs with NaCl or CaCl2 solution.C-Na represents the cases of prehydrated GCL permeated with NaCl;C-Ca represents the cases of prehydrated GCL permeated with CaCl2;NC-Na and NC-Ca represent two cases without consideration of incompatibility.dots: experimentally measured data from the literature;lines: fitting curves of each set of data based on Eq.(5)
2.4 Numerical method
A commercial finite element software,COMSOL Multiphysics,was used to establish the 2D axisym‐metric model to simulate the coupled transient flow and contaminant transport in the composite liner.The numerical method used in this study for the coupled advection-diffusion transport process was validated by simulating the long-term effluent concentration curves of the chemical transport column tests,which had been performed by the authors (Chen et al.,2020,2022).The numerical method used in this study was also verified by comparison with the numerical results ob‐tained by Foose et al.(2002) and Rowe and Abdelatty(2012) for leakage and long-term solute transport through composite liners with a constant hydraulic conductivity for GCL.A steady-state flow field simu‐lation was conducted first with the initial value ofkGCL,then the result of steady-state flow velocity was used as the initial value in the next transient simula‐tion of both flow and contaminant transport fields,in which the non-linearkGCL-crelationship from the unit tests of GCL chemical compatibility was incorporated based on Eq.(5).The configuration of triangular finite element grids applied to the model is shown in Fig.4.The grids near the hole and in thin layers (i.e.,the GCL and the GMB/GCL interface) were refined to improve accuracy.The grid sizes in the interface layer near the hole were no larger than 0.05 mm,whereas those in the rest of the interface layer were gradually getting coarser but no larger than 0.1 mm.The grid sizes in the GCL layer were refined to be no larger than 1 mm since the thickness of GCL is relatively thin compared to that of the AL.Overall,the configu‐ration of grids contained 761 653 elements and 402 335 nodes.Two dependent variables,i.e.,pore water pres‐sure and solute concentration,were defined for each node.A time-dependent solver was applied with a backward differential equation for time stepping.
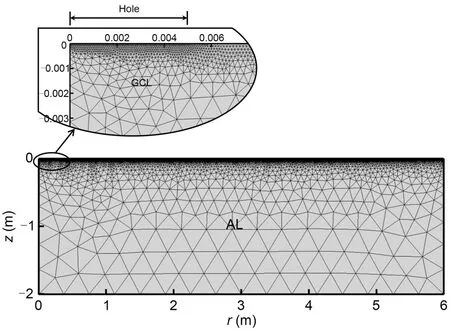
Fig.4 Configuration of the finite element grids applied to the model
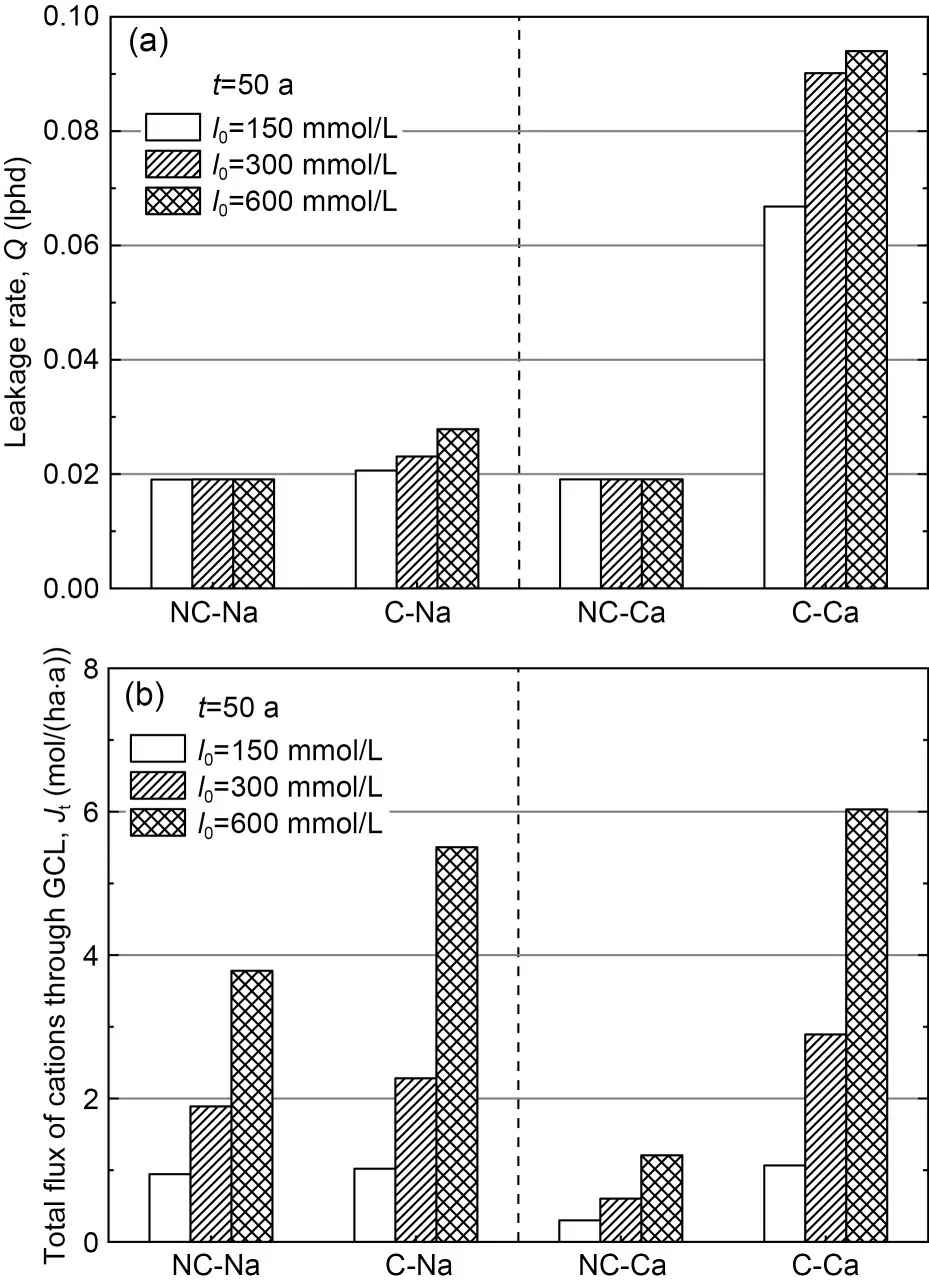
Fig.5 Leakage rate Q (a) and total flux of cations through the GCL (Jt) (b) at t=50 a for all four cases
3 Results and discussion
3.1 Impact of chemical incompatibility on the leakage rate and contaminant flux
Typically,the average service life expectancy of a landfill will not exceed 50 years.Thus,the steadystate value of leakage rate (Q) and total flux (Jt) of Na+or Ca2+through the GCL att=50 a for all four cases were calculated to analyze the impact of the chemical incompatibility on the barrier performance of the com‐posite liner,as shown in Figs.5a and 5b.
In the two cases with incompatibility considered,the values ofQranged between 0.021 and 0.094 lphd(liters per hectare per day,1 lphd=1.16×10⁻⁸m3/(ha·s)),which are 1.1 to 4.9 times higher than those for the four cases with incompatibility neglected (i.e.,0.019 lphd for NC-Na and NC-Ca).In the cases with NaCl solutions,compared to the NC-Na and NC-Ca cases,Qfor the C-Na and C-Ca cases increased by a factor of 1.1 to 1.5,and 3.5 to 4.9,respectively,asI0increased from 150 to 600 mmol/L.Thus,the neglect of GCL incompatibility will probably result in a con‐siderable underestimation ofQ.
When incompatibility is considered,the increased values ofQwith increasingI0for the Ca2+cases are higher than those for the Na+cases,which can be at‐tributed to the higherkGCLwith CaCl2solutions relative to that with NaCl solutions at the sameI0.For example,whenI0=300 mmol/L,Qfor C-Ca was 3.9 times higher than that for C-Na since the value ofkGCLof the former was 65 times higher than that of the latter.
For the GCL,theJtis a function of bothkGCLandI0.For NC-Na and NC-Ca cases,Jtincreased from 0.95 to 3.78 mol/(ha·a) and from 0.30 to 1.21 mol/(ha·a),respectively,asI0increased from 150 to 600 mmol/L.When incompatibility was considered,Jtfor most cases significantly increased.AsI0increased from 150 to 600 mmol/L,the values ofJtfor C-Na cases in‐creased by a factor of 1.1 to 1.5 relative to that for NC-Na cases,whereas those for C-Ca cases were 3.5 to 5.0 times higher than that for the NC-Ca case.For every case,the increases inJtwere almost identical toQ.
In general,values ofJtfor Ca2+cases were higher than those for Na+cases at the sameI0.For example,whenI0=300 mmol/L,Jtfor C-Ca was 2.9 mol/(ha·a),whereas that for C-Na was 2.3 mol/(ha·a),smaller than the former,although the concentration of Na+was three times higher than that of Ca2+.The impact of cation valence on chemical incompatibility is more significant than that of cation concentration.
In summary,for composite liners,the chemical incompatibility of GCL may induce considerable in‐creases ofQandJtwhen the GCL is exposed to ag‐gressive leachates from MSW landfills with high con‐centration levels,as well as HW and MSW ash land‐fills.It is necessary to consider the incompatibility of GCL when evaluating the barrier performance of com‐posite liners.
3.2 Mechanisms of flow and contaminant transport affected by chemical incompatibility
In this section,the contribution of GCL incom‐patibility in the mechanism of flow and contaminant transport through the composite liner is investigated mainly by comparing the cases of C-Ca and NC-Ca atc0=100 mmol/L,which represents the mean value of divalent cation concentration for typical aggressive leachates in MSW ash landfills.
In the simulation,the concentration of Ca2+in the GCL was nearly identical along the vertical direction after 0.1 a since the GCL was very thin compared to the AL.Thus,the concentration profiles at the middepth of GCL were used to represent the concentra‐tion distribution in the whole GCL at varying service durations (0.01 to 50 a),for C-Ca withc0=100 mmol/L.As shown in Fig.6,the concentration beneath the hole rapidly increased toc0within 0.1 a,more accu‐rately,on the fifth day,as shown by the difference be‐tween the line oft=0.01 a andt=0.1 a.
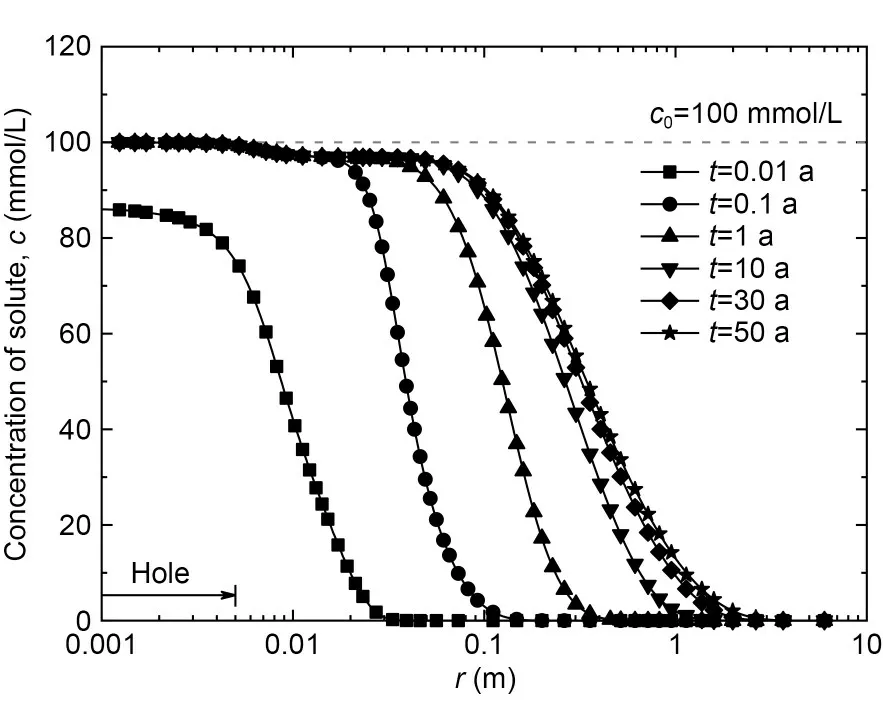
Fig.6 Ca2+ concentration profiles at the mid-depth of GCL for C-Ca with c0=100 mmol/L
In the radial direction,the Ca2+concentration gradually decreased asrincreased,and varied signifi‐cantly with time.Thercorresponding toc=0.95c0(that is,c=95 mmol/L in this case) increased from 0.02(four times ofrh) to 0.06 m (12 times ofrh),and thercorresponding toc=0.01c0(that is,c=1 mmol/L in this case) increased from 0.03 to 2.4 m whentincreased from 0.1 to 50 a.It can be inferred that in the zone wherecdecreased rapidly,the radial concentration gradient decreased with time as the contaminant con‐tinuously migrated along the radial direction.
The varying radial profile ofkGCLwith time at the mid-depth of GCL for C-Ca withc0=100 mmol/L is shown in Fig.7.When chemical incompatibility was considered,kGCLwas assumed to be dependent onc(data of C-Ca case in Fig.3).Moreover,kGCLincreases nonlinearly withcas the increase reduces at higherc.Thus,the portion of GCL wherecwas close toc0(dozens ofrhin the radial direction) had akGCLalmost identical to(value ofkGCLcorresponding toc0)and probably would have poor barrier performance.A deterioration zone (D Zone) can be defined to repre‐sent the portion whereatt=0.1 a.For the portion far away from the hole,cremained low andkGCLwas close to(i.e.,1×10−11m/s) att≤50 a.A non-impact zone (NI Zone) was defined to represent the portion whereatt=50 a.The portion between the D Zone and the NI Zone was defined as a sub-deterioration zone (SD Zone),in which thekGCLconsiderably increased duringt=0.1–50 a.For C-Ca,the radial lengths of D Zone,SD Zone,and NI Zone were 0.03,1.47,and 4.50 m,respectively (Fig.7).In this study,the radii of D Zone and SD Zone in all the cases were smaller than 0.05 and 3 m,respectively.Thus,when chemical incompatibility is considered,the affected region of hydraulic conductivity in GCL is very small for a hole frequency in GMB of 2.5 hole/ha.
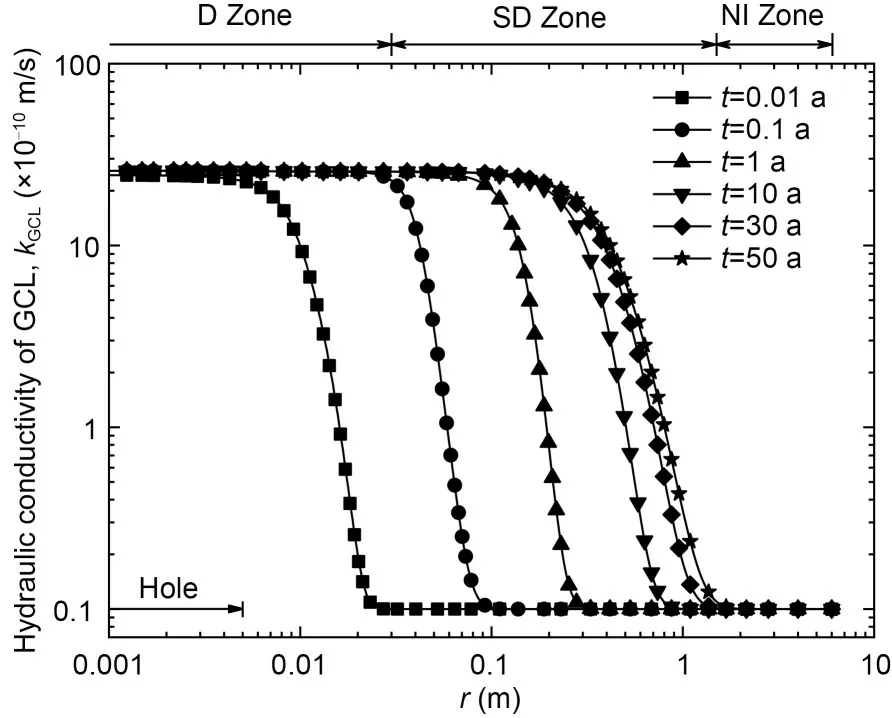
Fig.7 kGCL profiles at the mid-depth of GCL for C-Ca with c0=100 mmol/L
The distribution profiles of the hydraulic head in the D Zone (r≤0.03 m) of the GCL for the cases of NC-Ca and C-Ca atc0=100 mmol/L are shown in Fig.8.For the NC-Ca case,the head distribution within the GCL remained constant over time,as shown in Fig.8a.For the C-Ca case,the head distribution changed rapidly in the first 0.1 years,resulting in an increased radial hydraulic gradient in the D Zone,and then remained nearly unchanged with time,as shown in Figs.8b–8d.The denser contour lines of the C-Ca case indicated that the hydraulic gradient near the hole was higher than in the NC-Ca case.The radial drop of the head occurred mainly within the D Zone for both cases,but was more significant for the C-Ca case.Be‐yond the D zone (r≥0.03 m),the head for the NC-Ca case was lower than 1.073 m whereas that for the C-Ca case was lower than 0.075 m,corresponding to 47% and 3% of the initial head (i.e.,2.307 m),respectively.
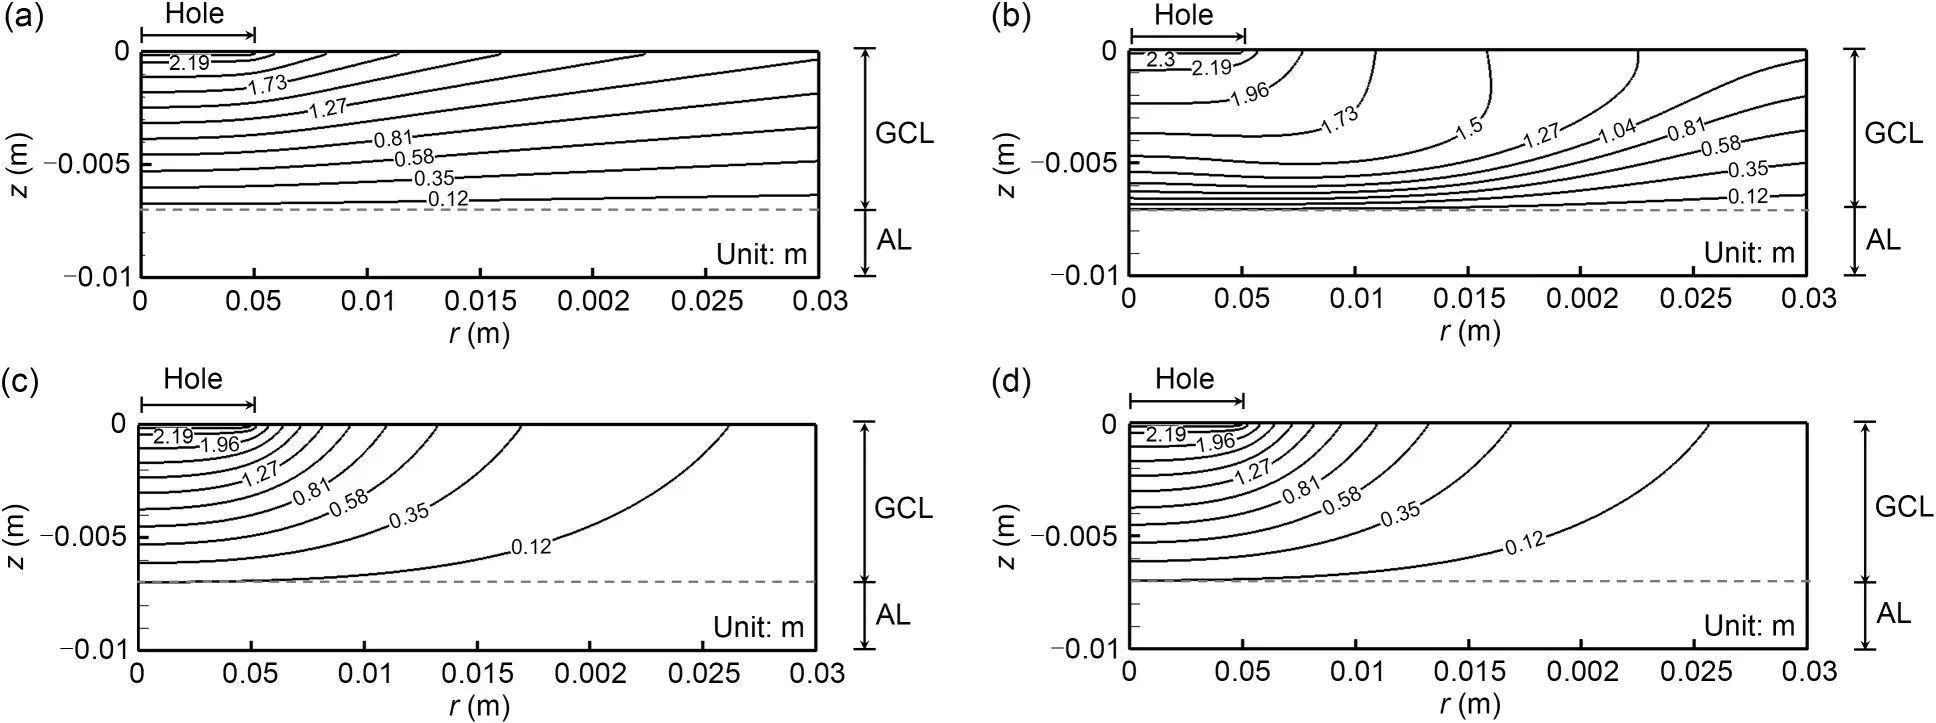
Fig.8 Contours of hydraulic head in the GCL for NC-Ca and C-Ca with c0=100 mmol/L: (a) NC-Ca;(b) C-Ca,t=0.01 a;(c) C-Ca,t=0.1 a;(d) C-Ca,t=50 a
The incompatibility of GCL can induce a nar‐rower wetted area,where GMB-GCL interface flow occurs (Giroud and Bonaparte,1989;Rowe 1998).In this model,the wetted area was defined as the area where the hydraulic head at steady-state was no less than 10% of the original value.For the NC-Ca and C-Ca cases,the radii of the wetted area (Rw) were 0.14 m and 0.02 m,respectively.The effect of GCL incompatibility onRwcan be explained by the analytical solution proposed by Giroud and Bonaparte (1989):
whereksis the equivalent hydraulic conductivity of the underlying soil.Rwis inversely related tokswhich is also related tokGCL.Thus,higherkGCLwould result in smallerRw.
For the NC-Ca case,sincekGCL(i.e.,1×10−11m/s)was much lower than the hydraulic conductivity of AL (i.e.,1×10−7m/s),the reduction of the hydraulic head in the vertical direction mainly occurred in the GCL (approximately reduced by 99.1%) and resulted in a value of 0.002 m at the base of GCL beneath the hole.For the C-Ca case,the maximum hydraulic head at the base of GCL was 0.079 m,a little higher than NC-Ca because of higherkGCL.
Following the analyses ofkGCLand the hydraulic head,the profile of flow rate per unit area (q) at the mid-depth of GCL is shown in Fig.9.Compared with the NC-Ca case,the increasedkGCLfor the C-Ca case resulted in significantly higherqin the D Zone and a more rapid radial decrease along the radial distance.The maximum value ofqfor the C-Ca case (8.1×10⁻⁷m/s)was nearly 2.5 orders of magnitude greater than that for the NC-Ca case (3.3×10⁻⁹m/s).The estimated radial cumulative flow rate indicated that 88% of the leakage occurred within the D Zone (r≤0.03 m) for the C-Ca case,whereas the range of the same propor‐tion of leakage rate for the NC-Ca case was 0.36 m,more than 10 times larger than the former.Thus,the incompatibility of GCL induces a higher amount of flow beneath the hole.
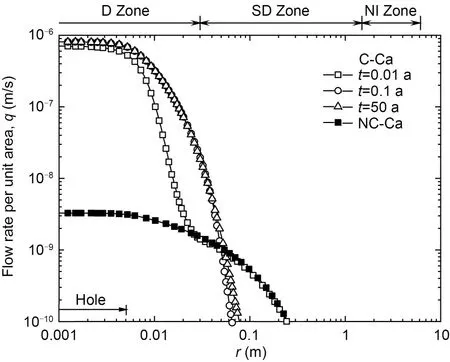
Fig.9 Profiles of flow rate at the mid-depth of GCL for NC-Ca and C-Ca with c0=100 mmol/L
For the C-Ca case,the distribution ofqmain‐tained constant after 0.1 a due to the rapid increase ofkGCL,so thatqreached a steady state.In this case,the effect of the coupled increase inkGCLandcoccurred rapidly (less than 0.1 a).Similar results have also been found for the C-Na cases.However,the flow rate dis‐tribution for C-Na cases (which is not show in Fig.9)showed thatqkept gradually increasing for 10 years for C-Na cases even though it exceeded 98% of the steady-state value after 1 a.
For all cases with incompatibility of GCL con‐sidered,the high values ofq(>10% of the maximum value) that occurred within the area ofr<0.1 m were larger than in the D Zone but smaller than in the com‐bined area of D Zone and SD Zone.Thus,according to the seepage,the actual incompatibility-affected area in the GCL was located within 0.1 m from the center of the hole in the GCL.
The distributions of the total flux of Ca2+through the unit area of mid-depth of GCL (jt) with time are shown in Fig.10.The trend of decreasingjtwith in‐creasingrwas similar to that ofqwithr.The maxi‐mumjtfor the C-Ca case (8.1×10⁻⁵mol/(m2·s)) was approximately two orders of magnitude greater than that for the NC-Ca case (7.1×10⁻⁷mol/(m2·s)) att=50 a,andjtfor the C-Ca case decreased more than three orders of magnitude withr=0.1 m.For all the cases where the incompatibility of GCL was considered,the high values ofjt(>10% of the maximum value) also occurred within the area ofr<0.1 m,indicating that the radius of the actual incompatibility-affected area in the GCL was smaller than 0.1 m according to con‐taminant transport,which was the same asq.
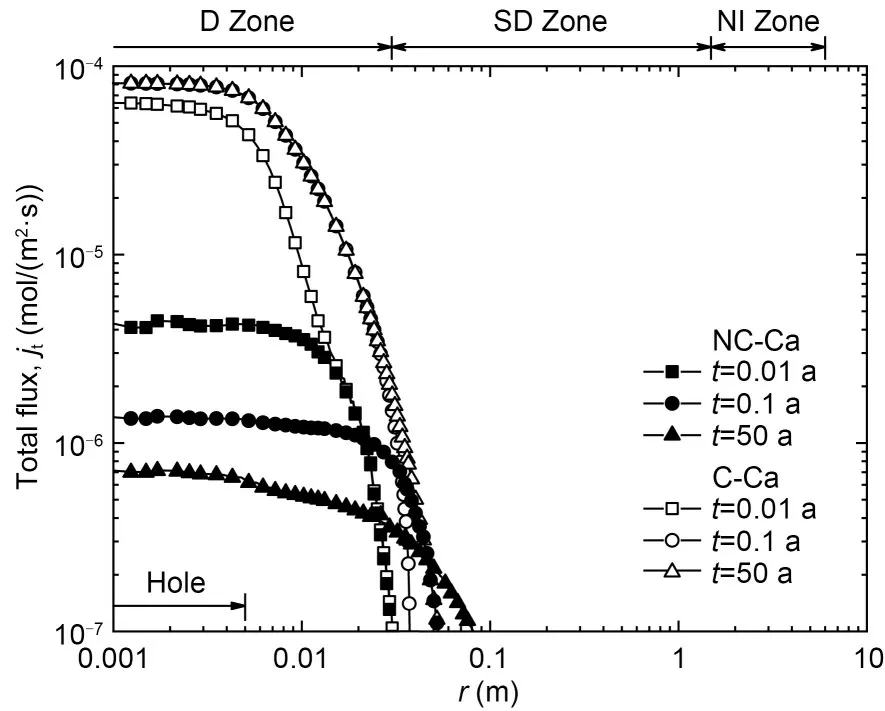
Fig.10 Total flux profiles of Ca2+ through the unit area of mid-depth of GCL for NC-Ca and C-Ca with c0=100 mmol/L
For the C-Ca case,jtincreased over time in all zones because of the increasedkGCL.The change in the distribution ofjtwas minimal after 0.1 a,indicating that the flux through GCL reached a steady-state within a very short time,the same as the change inq.For all the other three cases,the change in the distribution ofjtwas very small after one year.Therefore,both the analyses for the change ofqandjtover time indicated that consideration of the coupled increase inkGCLandchad a limited impact on leakage rate and contaminant flux,so it can be ignored for a rapid evaluation of bar‐rier performance of composite liners.
Based on the analyses ofqandjt,neglect of the incompatibility of GCL will cause significant underes‐timation of the wetted area and of the leakage and flux occurring beneath the hole,leading to a consider‐ably unconservative prediction of both the flow and the contaminant barrier performances of the composite liner.
The total flux is the combination of advective and diffusive fluxes when the impact of dispersion is ignored.The integrals of advective flux and diffu‐sive flux through the composite liner (JaandJd) are defined as
The fluxes of all cases reached a steady-state(>95% of the maximum values) within 20 years.The steady-state values ofJaandJdfor all four cases withI0ranging from 150 to 600 mmol/L are summarized in Table 3.The downward direction was regarded as positive for fluxes.For cases with incompatibility neglected,the values ofJawere slightly smaller than that ofJdwith the difference remaining less than 20%,indicating that diffusion was comparable to advection in the contaminant transport.Moreover,the ratio ofJaandJd(|Ja/Jd|) was not affected byc0if the incompati‐bility of GCL was neglected.
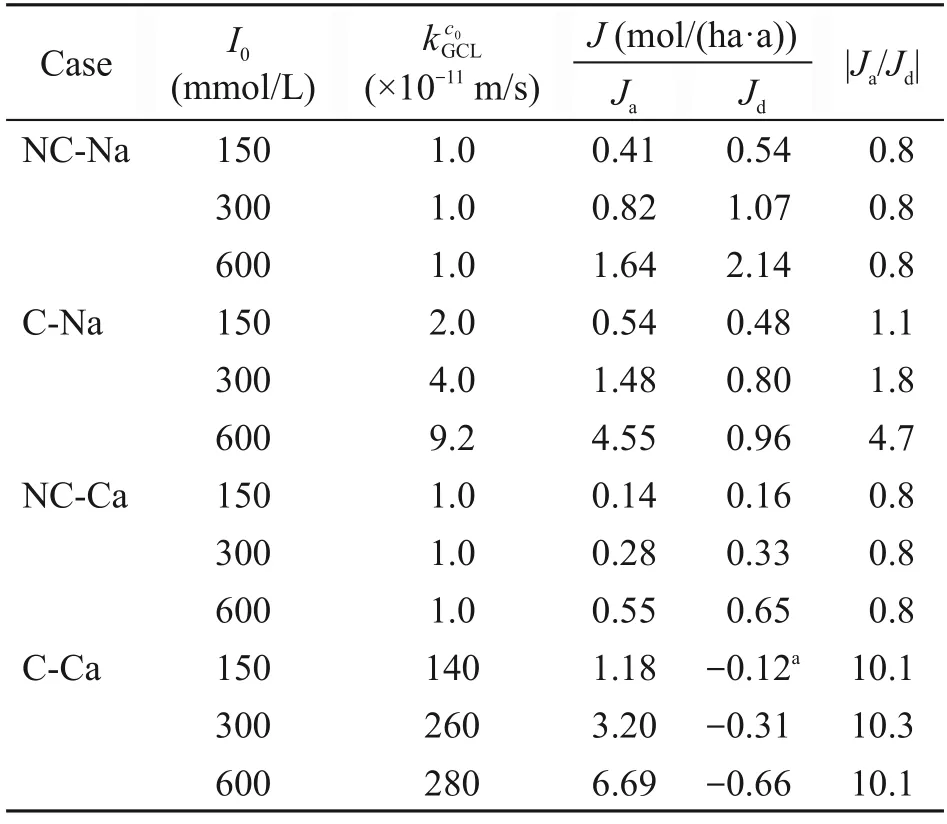
Table 3 Steady-state values of advective and diffusive fluxes through the composite liner
Note that the presence of AL beneath the GCL composite liner could significantly reduce the contam‐inant flux,especially the advective flux because the large thickness of the AL could significantly reduce the concentration of contaminant in the region be‐neath the hole.For all cases,total fluxes of Ca2+or Na+through the mid-depth of AL decreased by 43% to 46%compared to those through the liner,respectively,with advective fluxes decreasing by more than 95%.
4 Conclusions
The effect of chemical incompatibility of GCL on the barrier performance of defective composite liners was investigated numerically via a comparison of four cases.The mechanism of the effect was analyzed in terms of the distributions of contaminant concentra‐tion,hydraulic conductivity,hydraulic head,flow rate,and contaminant flux.The following conclusions were drawn based on the analyses and comparisons.
It is necessary to consider the chemical incom‐patibility of GCL when evaluating barrier performance of composite liners with defective GMB,especially for a landfill with leachates containing high concentra‐tions of inorganic cations.In this study,as the ionic strength of inorganic solutions increased from 150 to 600 mmol/L,the leakage rate and the total flux through the composite liner increased by a factor of 1.1 to 1.5 for C-Na cases,and 3.5 to 4.9 for C-Ca cases within the average duration of life expectancy of a landfill (t=50 a).The increase ofkGCLdue to chemical incompatibility results in a much higher flow rate and flux in the GCL portion directly beneath the hole,and it also re‐sults in a smaller radius of the wetted area.Compared to the NC-Ca cases,the C-Ca cases have much more leakage within the D Zone.For all the cases considering the incompatibility,the radii of the incompatibilityaffected area in GCL were less than 0.1 m.The increas‐ing process ofkGCLoccurs in a short period of time(less than 1 a for the cases in this study) if the chemi‐cal incompatibility of GCL is considered.The chemi‐cal incompatibility of GCL significantly increases the ratio of advective flux to diffusive flux through the de‐fective composite liner.
This paper focused on the effect of the GCL chemical incompatibility on the barrier performance of composite liners.The effects of other parameters,such as the size of the hole,the interface transmissivity,and the AL thickness,were not considered here but can be evaluated in the future based on this paper.The numerical method in this paper can be used in the future to design and simulate in-site tests of contami‐nant transport through defective composite liners.
Acknowledgments
This work is supported by the National Key Research and Development Program of China (Nos.2018YFC1802304 and 2019YFC1806002) and the National Natural Science Foun‐dation of China (Nos.42077241 and 51988101).
Author contributions
Shiyuan YAO and Yuchao LI designed the research.Shiyuan YAO and Guannian CHEN processed the correspond‐ing data.Shiyuan YAO and Shan TONG wrote the first draft of the manuscript.Yuchao LI and Yunmin CHEN helped to organize the manuscript.Shan TONG revised and edited the final version.
Conflict of interest
Shiyuan YAO,Yuchao LI,Shan TONG,Guannian CHEN,and Yunmin CHEN declare that they have no conflict of interest.
 Journal of Zhejiang University-Science A(Applied Physics & Engineering)2023年7期
- Journal of Zhejiang University-Science A(Applied Physics & Engineering)的其它文章
- Monotonic uplift behavior of anchored pier foundations in soil overlying rock
- Fractal analysis of small-micro pores and estimation of permeability of loess using mercury intrusion porosimetry
- Underwater minirobots actuated by hybrid driving method
- Square cavity flow driven by two mutually facing sliding walls
- Bogie active stability simulation and scale rig test based on frame lateral vibration control
- Analytical solution of ground-borne vibration due to a spatially periodic harmonic moving load in a tunnel embedded in layered soil