
Monotonic uplift behavior of anchored pier foundations in soil overlying rock
2023-07-24 10:07YizhouSUNHongleiSUNChongTANGYuanqiangCAIFengPAN
Yizhou SUN ,Honglei SUN ,Chong TANG ,Yuanqiang CAI ,Feng PAN
1College of Civil Engineering and Architecture, Zhejiang University, Hangzhou 310058, China
2College of Civil Engineering, Zhejiang University of Technology, Hangzhou 310014, China
3State Key Laboratory of Coastal and Offshore Engineering, Dalian University of Technology, Dalian 116024, China
4Zhejiang Electric Power Design Institute Co. Ltd., China Energy Engineering Group, Hangzhou 310012, China
Abstract: Rock-embedded foundations with good uplift and bearing capacity are often used in mountains or hilly areas.However,there are soil layers with a certain thickness on the rocks in these mountainous areas,and the utilization of those soil layers is a problem worthy of attention in foundation construction.Considering construction-and cost-related factors,traditional single-form foundations built on such sites often cannot provide sufficient resistance against uplift.Therefore,an anchored pier foundation composed of anchors and belled piers,specifically constructed for such conditions,can be invaluable in practice.This paper introduces an experimental and analytical study to investigate the uplift capacity and the uplift mobilization coefficients(UMCs) of the anchored pier foundation.In this study,three in-situ monotonic pullout tests were carried out to analyze the load–displacement characteristics,axial force distribution,load transfer mechanism,and failure mechanism.A hyperbolic model is used to fit the load–displacement curves and to reveal the asynchrony of the ultimate limit states (ULSs) of the anchor group and the belled pier.Based on the results,the uplift capacity can be calculated by the UMCs and the anchor group and pier uplift capacities.Finally,combined with the estimation of the deformation modulus of the soil and rock,the verification calculation of the uplift capacity and UMC was carried out on the test results from different anchored pier foundations.
Key words: Uplift capacity;Anchored pier foundation;Belled pier;Rock anchor;Uplift mobilization coefficient (UMC)
1 Introduction
Piers and rock anchors are widely used forms of uplift resistant foundations (Park et al.,2013;Harris and Madabhushi,2015).Piers are used in areas with deep soils and rock anchors are used in areas with ex‐posed rock or rock with thin overburden.
The southern part of Zhejiang Province,China,is dominated by hills and mountains,and the rocks in these areas are generally covered with a thickness of soil (Ma et al.,2015).Pier foundations are difficult to use in such areas with thin soils,and usually the bot‐tom of the foundation needs to be embedded in the rock to ensure uplift capacity.The deeply buried pier foun‐dation usually needs to be embedded in the bedrock,which is difficult to excavate (Kulhawy,2015).How‐ever,if rock anchors are chosen for such sites,the soil layer needs to be removed.This means an increase in excavation and a waste of the bearing capacity of the in-situ soil.
An anchored pier foundation consists of a pier and rock anchors (Cheng et al.,2012;Jia et al.,2014;Sun et al.,2022).A foundation constructed in this way exhibits high stiffness and pullout resistance due to the pier being embedded in the in-situ soil and the rock anchors.Fig.1 shows the different shapes of the anchored pier foundations.However,as far as we know,research has yet to be conducted on the mono‐tonic uplift capacity and failure mechanism of an‐chored piers.The monotonic uplift capacity and the load distribution are the objects of research on the up‐lift behavior of anchored piers.Results of field tests conducted on three anchored piers,subjected to mono‐tonic uplift,are presented here.The load–displacement(P-s) curves were fitted using a hyperbolic model based on the analysis of load distribution and failure mechanisms.The calculation method for the uplift ca‐pacity of anchored piers is proposed based on the up‐lift mobilization coefficient (UMC) concept and the current design framework.The verification calcula‐tion was carried out on the uplift test results of an‐chored pier foundations with different geological con‐ditions and geometric dimensions.Combined with the estimation method of geotechnical deformation modu‐lus,the parameter determination method in UMC cal‐culation was supplemented and refined.
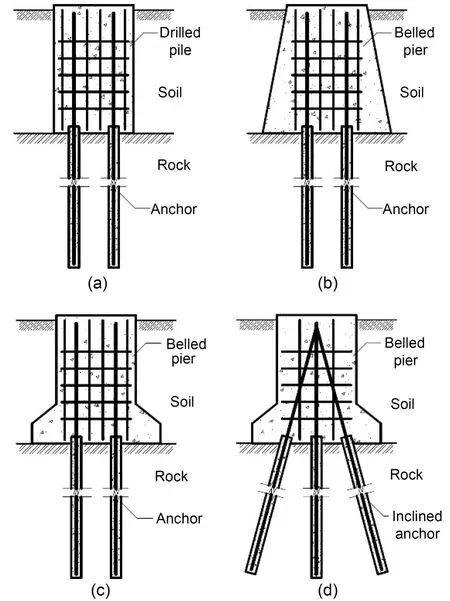
Fig.1 Examples for the anchored piers: (a) anchored pile foundation;(b) anchored pier foundation (cap);(c) anchored pier foundation (belled pier);(d) anchored pier foundation(inclined anchor)
Generally,the uplift capacity of the upper pier of the anchored pier depends on the shear capacity of the undisturbed soil.Previous studies have established the failure mechanism and the methods used to determine the uplift capacity of belled piers (Meyerhof and Adams,1968;Wang et al.,2011;Li et al.,2022;Wu et al.,2022;Zhang et al.,2022).Honda et al.(2011)proposed a theoretical solution to predict the uplift ca‐pacity of belled piles in dense sand.Qian et al.(2015)conducted pullout tests of 41 full-scale belled piers in Gobi gravel and analyzed the uplift load–displacement curves.Four representative uplift interpretation crite‐ria were used to evaluate the capacity of each belled pier and the interrelationships of these criteria were established.Understanding the failure mechanism of the pier foundation is essential for research into loadtransfer characteristics,design,and engineering appli‐cations.The primary failure mechanism of belled piers under tensile loads has been reviewed by Pacheco et al.(2008).According to these studies,there are two fail‐ure modes of belled piles: shallow foundation failure and deep foundation failure.
The pullout resistance and failure mechanism of anchors have also been extensively studied.The uplift capacity calculation and design of anchors can be ob‐tained from specifications (IEEE,2001;BSI,2013).Serrano and Olalla (1999) proposed a set of equations to describe the failure mechanism of anchors and cal‐culated the uplift capacity by analyzing the force bal‐ance of the anchor on the fracture surface at the ulti‐mate limit state (ULS).In that study,they also pro‐posed to classify the anchor failure shape into “short anchors”and “long anchors”according to the slender‐ness ratio and rock mass parameter.Numerous studies have used laboratory and field tests,complemented by analytical and numerical analyses,to investigate the anchoring mechanism (Ma et al.,2016;Fabris et al.,2021).Kim and Cho (2012) categorized the failure modes of anchors into four groups: tensile fail‐ure of the steel tendon,shear failure at the tendon–grout interface,shear failure at the grout–rock inter‐face,and shaped failure of the rock.Zhang et al.(2019) employed the classification method proposed by Serrano and Olalla (1999) to divide the failure modes of anchors into three types: slipping destruction,monolithic destruction,and compound destruction.
2 Field investigation of anchored pier foundations
2.1 Background and construction process
The site of the field tests for the present study was in Yeshanlong in Qingtian County,Lishui City,Southern Zhejiang Province,China.The geology was investigated,including a survey and geotechnical sam‐pling.Uplift tests were conducted sequentially on three anchored pier foundations;the loading was static and monotonous.No groundwater was found at the test site.The view of the site is shown in Fig.2.
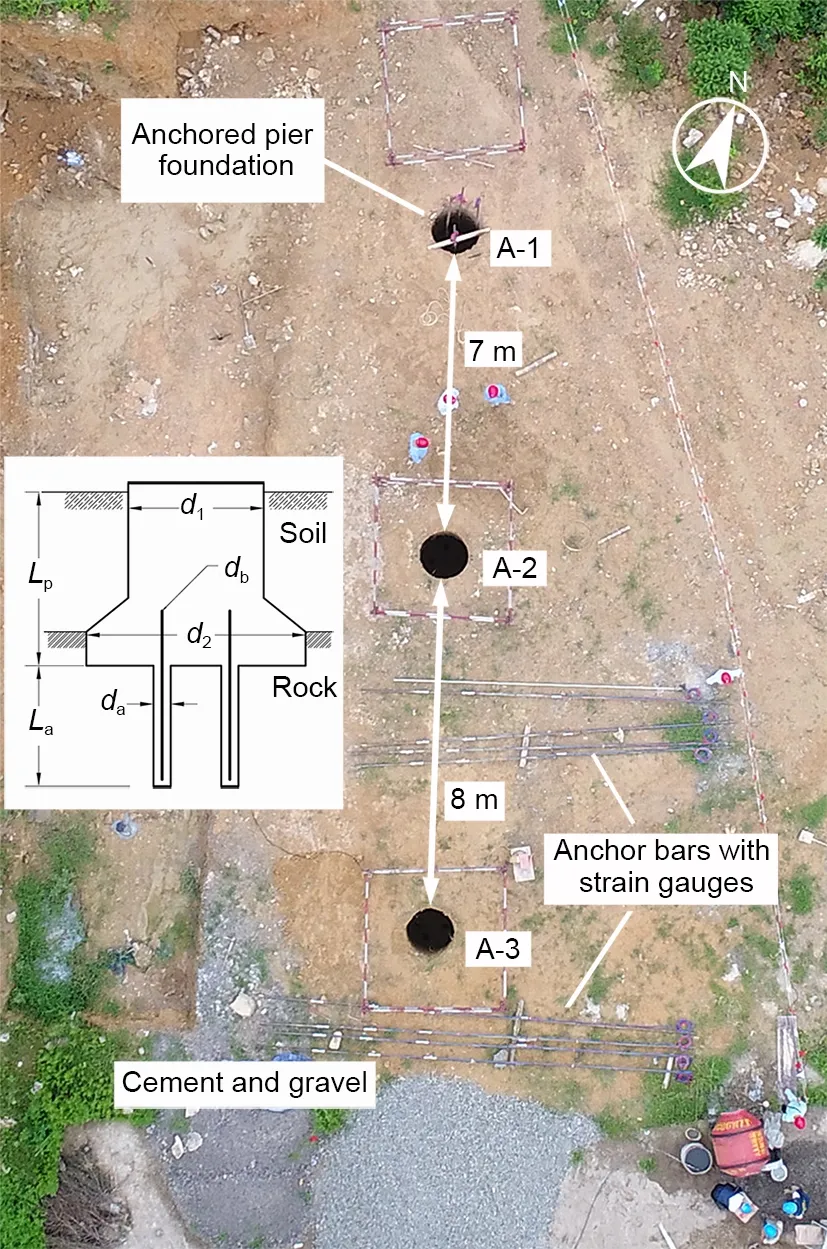
Fig.2 Top view of the test site
The dimensions of the foundation are shown in Table 1,whereLpandLaare the lengths of the piers and anchors,andd1,d2,da,anddbare the diameters of the column of the pier,the diameter of the belled bot‐tom,the diameter of the anchor hole,and the diameter of the anchor bar,respectively.Considering the pull‐out synchronization of the anchors and avoiding the group effect,all the foundations were uniformly dis‐tributed with four anchors.The space between the an‐chors was 0.5 m.Anchor lengths of 1,2,and 3 m were chosen to ensure that there was a significant dif‐ference in the uplift capacity of the anchor group,no plastic damage to the material at the ULS of the foun‐dation,and that construction quality was assured.
Table 1 Dimension information of test foundations
In the first step,a suitable construction area was selected based on project requirements and geological profile (Fig.3a).A geological survey and sample test‐ing were carried out to determine the suitability of the anchored pier design and site layout plan in the area(Fig.3b).Once the center point of the foundation was determined,the belled piers were excavated and formed using hand tools (Fig.3c).The surrounding soil was not affected during excavation and construc‐tion,so the sidewalls remained rough.Drilling was started once the pier pit was checked and accepted.The drill rod was extended into the pit with the drilling machine positioned in the design location (Fig.3d).The diameters of the boreholes and anchor bolts were 120 and 40 mm,respectively.All anchor bolts were threaded steel bars with a design strength of 400 MPa(design tensile force was 502.7 kN).At the same time,strain gauges were connected to the bolts through sleeves (Fig.3e).Both the strain gauge and the sleeve had a design tensile strength of 500 MPa to ensure that they would not be damaged before the steel bar.After the boreholes were formed,the bolts and sen‐sors were inserted and installed (Fig.3f),and the grouting material was then poured into the boreholes.The grouting material was a fine aggregate concrete with a compressive strength of 35 MPa under stan‐dard curing conditions for 28 d.After the initial set of the grouting material was completed in 5 d,the rein‐forcement cages of the piers were started.Rebar with a diameter of 28 mm and a design tensile strength of 400 MPa was used as the main reinforcement of the pier.The last step of the construction was a coarse ag‐gregate concrete that was poured into the pit (Fig.3g).The compressive strength of concrete under 28 d of standard curing conditions was 30 MPa.While the foundations were cured,the test components were fab‐ricated and transported,including concrete blocks(Fig.3h),steel plates,and steel beams.After all the conditions met the requirements,the test system was built,including the installation of steel beams,commis‐sioning of instruments,and connector welding (Fig.3i).
2.2 Loading system and test program
The loading system and testing devices included one loading beam (H-beam),four main beams (Hbeams),a hydraulic loading system,a supporting sys‐tem,dial gauges,and monitoring devices.A total ofsix dial gauges were used to measure the displace‐ment of the foundation and ground surface in each loading stage and were arranged in two groups on each anchored pier foundation.Two of the dial gauges were symmetrically arranged at the top of the founda‐tion,and the others were arranged around the founda‐tion,with a spacing of 1.5 m from the center point of the top surface of the foundation.Fig.4 presents a schematic profile of the test setup.The steel bars in the foundation were positioned 2.5 m above the top surface of the foundation,and each bar was welded with the steel connector on both sides.
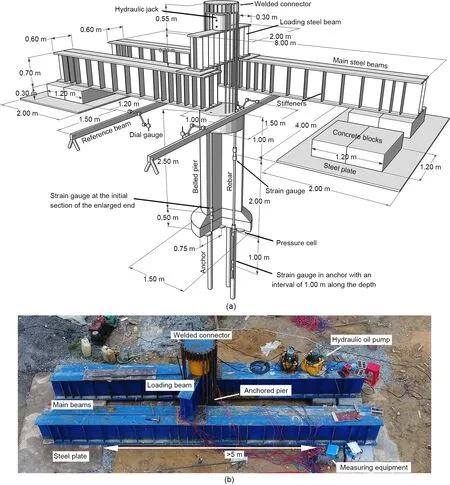
Fig.4 Field tests: (a) schematic profile of the test setup;(b) site photo
Strain gauges and earth pressure cells were em‐bedded in the foundations.Strain gauges were placed at the joints between the anchors and the belled piers so that the loads of the anchor groups could be obtained.At intervals of 1 m,the strain gauges in each anchor were arranged on the steel bar.Another group of strain gauges was arranged 1 m below the top of the foundation and at the point where the straight section met the enlarged base.Each of the two groups com‐prised four strain gauges,which were installed sym‐metrically on the same section.Strain gauges were connected to steel bars through sleeves of matching sizes to ensure coaxiality and reliability.Five earth pres‐sure cells were evenly and horizontally distributed on the pre-grooved rock surface under each belled pier.Each earth pressure cell was wrapped with geotextile and was padded with sand on the top and bottom to avoid the influence of concrete solidification and to ensure the uniform and vertical transmission of pres‐sure.Both the strain gauge and the earth pressure cell were vibrating-wire sensors.
According to ASTM D3689/D3689M-07(2013)e1(ASTM,2013),the slowly maintained load method was used for all of the uplift tests.During the uplift tests of each foundation,the load was gradually in‐creased by 10% of the expected ultimate load of each foundation.Every load stage was maintained until the two consecutive displacements within each hour were less than 0.1 mm;then the next stage was conducted.The test continued after the pullout displacement of each stage was stabilized,while the loading stopped until the uplift rate exceeded the above-mentioned standard.
2.3 Geology conditions
It can be estimated from the continuous core samples (Fig.3b) and foundation construction that the thickness of the soil layer was about 2.5 m and was followed by weathered rock.On the basis of the cate‐gorization standards for rock and soil (ASTM D2487-17e1 and D6032/D6032M-17) (ASTM,2017a,2017b),laboratory tests were conducted.The range of the pa‐rameters was established by testing on the rock and soil using sieving analysis.Fig.5a shows the particle gradation of the soil within the buried depth of the belled pile,which can be classified as SP (poorly graded sand with gravel) according to ASTM D2487-17e1.The rock samples completed point-load and uniaxial compression testing to gauge their strength.Examples of test samples are shown in Fig.5b.The rock classes are listed in Section S1 of the electronic supplementary materials (ESM) according to rock mass classification standard ASTM D5878-19 (ASTM,2019).According to the rock mass rating system(RMR),the ratings of the cores at foundations A-1,A-2,and A-3 are 35,36,and 25,respectively,all of which are classified as Class Ⅳ poor rocks.
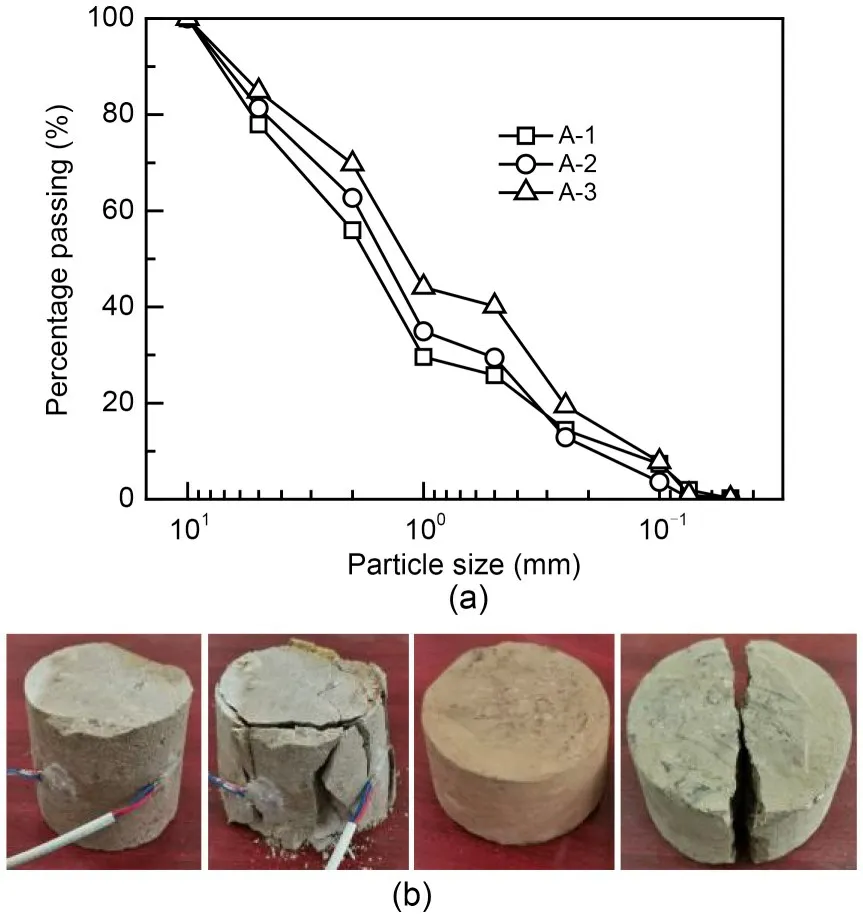
Fig.5 Laboratory tests of soil and rock: (a) typical particle gradation of the soil;(b) in-situ core samples
The deformation modulus of the soil can be esti‐mated according to a chart of the flat dilatometer test(DMT) proposed by Marchetti and Crapps (1981).The details of their estimation method are presented in Section S2 of the ESM.The geological parameters of each test point are shown in Table 2.

Table 2 Geological parameters
3 Analysis of the experimental results
3.1 Processing of the experimental results
The measured upliftP-scurves of all founda‐tions are shown in Fig.6.The value of the loading in the test results was converted from the pressure of the jack.sfis the displacement of the anchored pier,which is the average of the measured readings of the two dial gauges at the top of the foundation.TheP-scurves of the anchored pier foundation,as well as those of the belled piers and anchor groups,are shown in Fig.6.spis the displacement of the pier,which is consistent with the displacement of the anchored pier.sais the displacement of the anchor group obtained by removing the elastic deformation of the pier from thesf.The displacement conversion process of the anchor group is expressed as
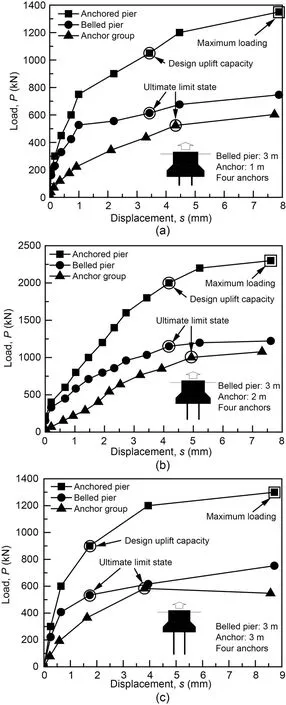
Fig.6 Load–displacement curves of the anchored pier foundations: (a) A-1;(b) A-2;(c) A-3
wheresaiandsfiare the uplift displacements of the an‐chor group and anchored pier foundation at theith loading stage,respectively;Lpis the buried depth of the belled pier (which is 3 m);Pfiis the loading value of stagei;Apis the cross-sectional area of the piercolumn (which is 0.785 m2);Ecis the tensile modu‐lus of elasticity of concrete.The ultimate uplift ca‐pacity (UUC) and the ULS of the anchored pier are determined by the tangential intersection method (Hi‐rany and Kulhawy,1988) of theP-scurve,with the details shown in Section S3 of the ESM.
The total force measured by four strain gauges placed at the intersections of the anchors and the belled pier of each foundation was translated into the load of the anchor group (Pa).By deductingPafrom the pullout load of the anchored pier (Pf),the load of the belled pier (Pp) was determined.
The uplift capacity may be represented as
wherek1andk2are the UMCs of the pier and the an‐chor group,respectively.
According to the definition of the serviceability limit state (SLS),neither the pier nor the anchor group reaches the ULS until the anchored pier reaches the SLS.The first component (pier or anchor group)to reach the ULS is the controlling factor for the SLS of the anchored pier foundation.Based on the analy‐sis of theP-scurves and the determination of the ULS,it can be found that the pier is the first to reach its ULS.Table 3 shows the test results and correspond‐ingk1andk2values of the hybrid foundation at its de‐sign uplift capacity (DUC).It can be seen that,when the DUC of the hybrid foundation is reached,k1equals 1,that is,the belled pier reaches its ULS.Thek2value is less than 1,which means that the anchor group has not fully reached its UUC.The test data show that A-2 had a better uplift capacity than A-3 for the belled pier and anchor group.Differences in geol‐ogy and construction caused this significant differ‐ence.Geologically,the uniaxial compressive strength of the cores from A-2 (12.17 MPa) is much greater than that of A-3 (1.37 MPa).Considering the condi‐tion of discontinuities and quality of the rock,the RMR of A-2 rock (36) is also higher than that of A-3 rock (25),as shown in Section S1.This results in the uplift capacity of foundation A-2 being greater than that of foundation A-3.In terms of construction,there were more stones in the burial depth of the A-2 pier,and the vacancies created by falling stones during manual excavation increased the concavity of the side‐walls.This can be confirmed in Fig.7.The friction and bite force between the foundation sidewall and the geotechnical body are the components that consti‐tute the uplift capacity of the anchored pier.Thus,the pier of A-2 with rougher sidewalls had a higher uplift capacity,as shown in Table 3.
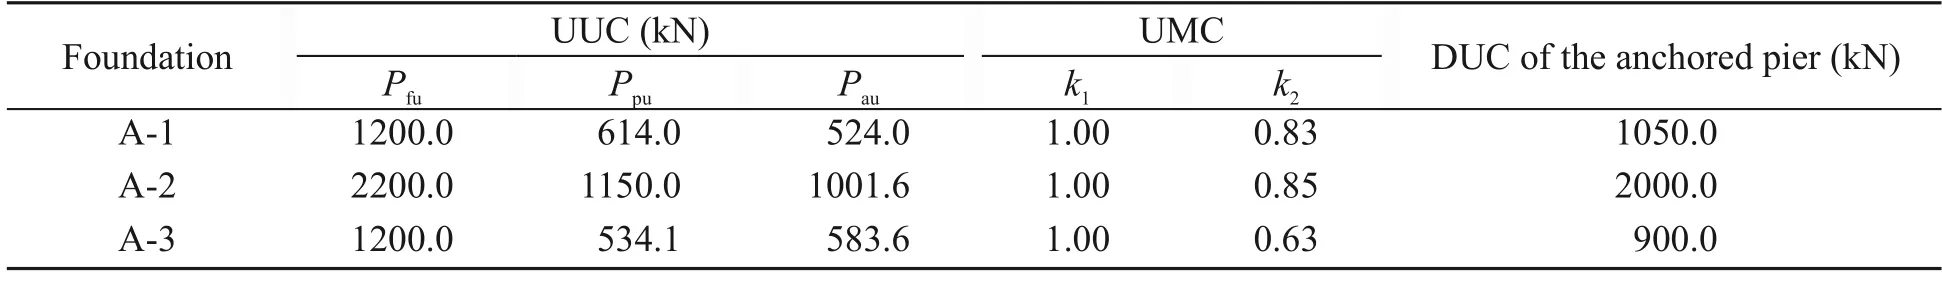
Table 3 Pullout test results for all foundations
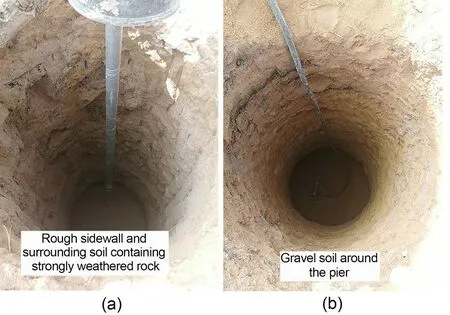
Fig.7 Comparison of sidewalls and surrounding soil: (a) A-2;(b) A-3
3.2 Load distribution of pier and anchor
The strain gauge readings were calculated and processed to obtain the forces in each section of the foundation.The following equation gives the calcula‐tion of the forces:
where subscriptsiandjrepresent the loading stage and section,respectively;Tijandσijare the force and stress at the loading stage and section,respectively;Acis the cross-sectional area of the foundation in addi‐tion to the reinforcement,which is 0.785 m2;Asis the sum of the sectional areas of all reinforcement,which is 0.015 m2;EcandEbare the elasticity moduli of concrete and reinforcement,respectively.The values of 27.5 and 200.0 GPa forEcandEb,respectively,were obtained from the sample tests.
The load distribution of the foundation is shown in Fig.8.The resistance curves for the depths of the various stages reveal that the resistance of the in‐creased bottom,the side friction of the pier column,and the anchoring force of the anchor group made up the three components of the uplift capacity of the foundation.As the load increased,the pullout resis‐tance provided by each part increased.In the final stage curve in Fig.9,the force of the pier column was greater than the load placed on the foundation.This indicates that the stresses in the foundation sections derived from the reinforcement stresses exceed the ac‐tual values.The concrete and the reinforcement ap‐peared to be incompatible in terms of deformation,i.e.,cracks appeared.
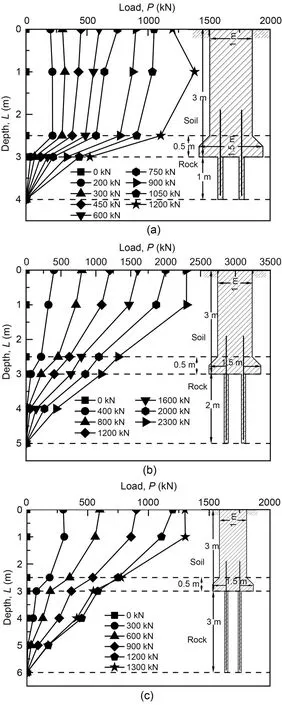
Fig.8 Axial force distribution: (a) A-1;(b) A-2;(c) A-3
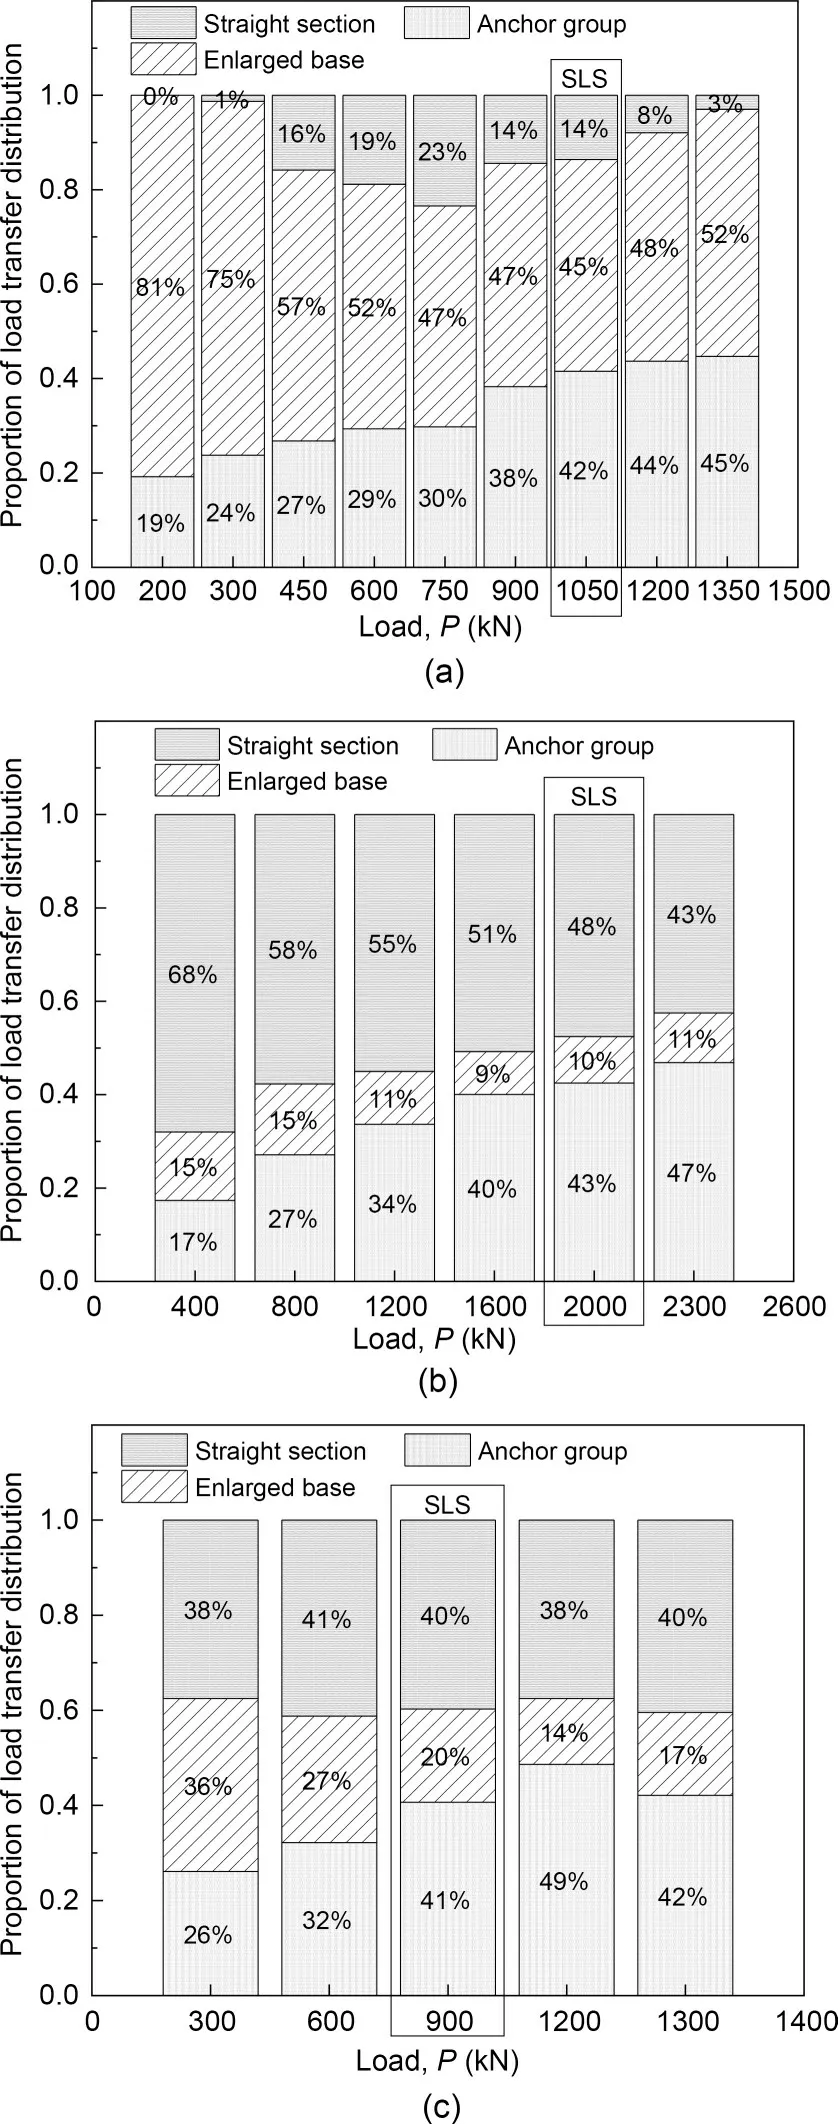
Fig.9 Load distribution: (a) A-1;(b) A-2;(c) A-3
Fig.9 shows the load distribution.It can be seen that before reaching the DUC,the proportion of the load of the pier under each stage decreased step-wise while the proportion of the anchor group increased.For the pier,as the load developed previous to the ULS,the percentage of the load carried by the larger bottom steadily dropped.The uplift capacity was deter‐mined by the total shear capacity of the surrounding soil,and the weight of the soil and foundation.Fur‐thermore,the proportion of the anchor group gradually increased from about 20%,in the initial stages,to about 40% in the final stages.The load distribution ratio of the anchor group tended to stabilize or decline(A-3) after the ULS was reached.
The above study shows that for anchored piers with similar geometry as the ones in this test,belled piers and anchor groups determine the SLS and ULS of the anchored piers,respectively.The determination of the DUC at the SLS is critical to the design of the foundation (Phoon,2006;Tang and Phoon,2018).
3.3 Failure mechanism of belled pier
The surface displacement changed significantly after the anchored pier foundation reached the ULS,and cracks appeared around the foundation,as shown in Fig.10a.The cracks spread around in a roughly emissive shape,indicating an uplift deformation of the surrounding soil.Fig.11a shows the displacement results of the top surface of the anchored pier founda‐tion and the ground surface 1.5 m from the center of the foundation.Extracting the displacement measure‐ment results of the A-1 foundation at 1350 kN,the contour diagram,as shown in Fig.11b,can be drawn.The contour diagram gives the variation from the up‐lift displacement of 0 mm at a position 3.5 m from the center of the foundation to the uplift displacement of 8 mm at the top side edge of the foundation.From the test results regarding the uplift displacement,it can be seen that the displacement of the ground surface 1.5 m from the center of the foundation is much smaller than that for the foundation at the corresponding loading stage.
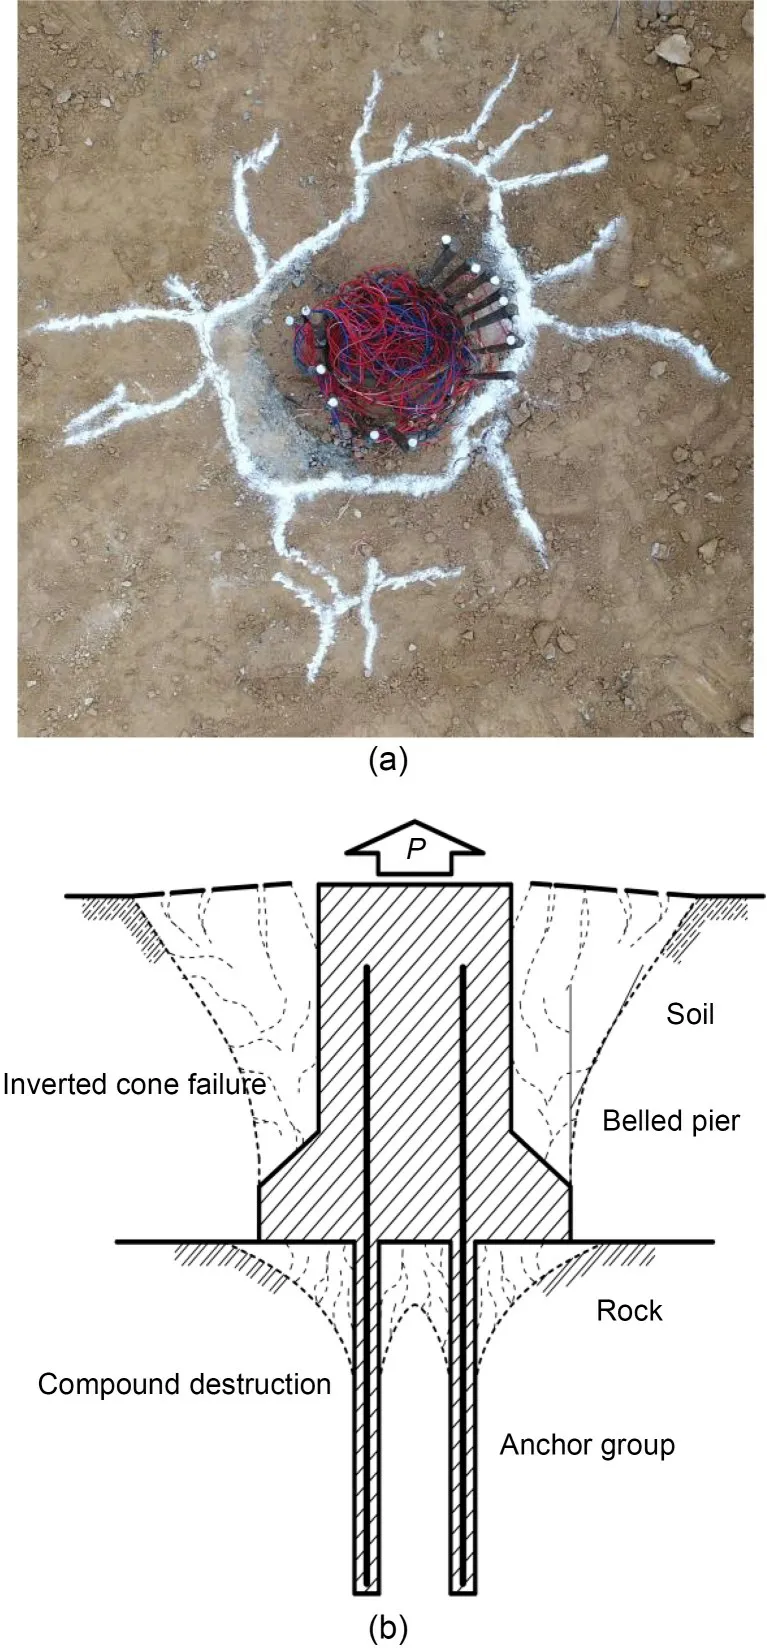
Fig.10 Failure mode: (a) surface crack map of foundation A-1;(b) schematic of the failure mode
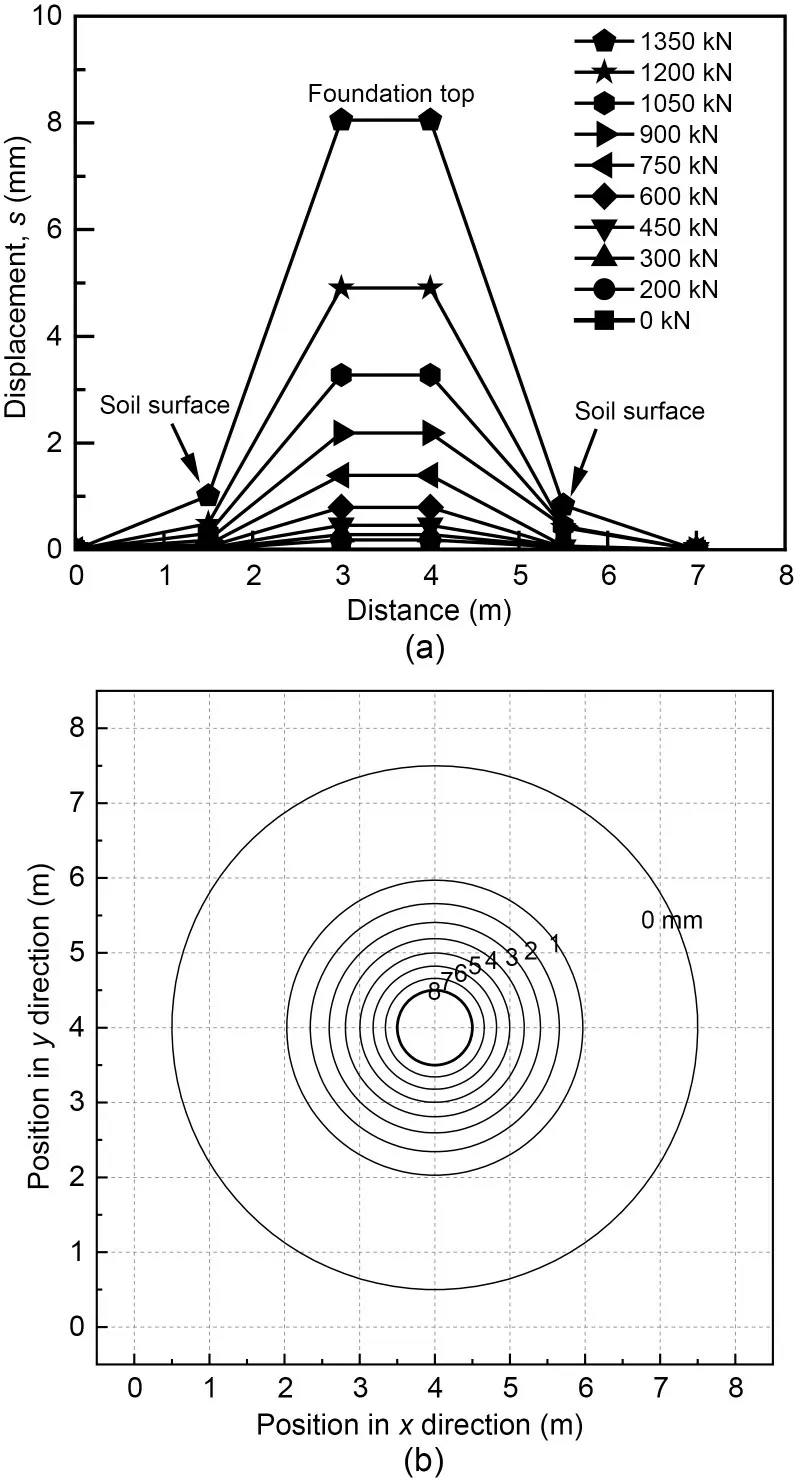
Fig.11 Measured displacements of the foundation and soil surface (A-1 as an example): (a) foundation and ground displacement under various loads;(b) contour diagram of soil surface around A-1 at 1350 kN
3.4 Failure mechanism of anchor group
Fig.12 illustrates the uplift loads (measured by strain gauges) of the pier and anchor group at each stage compared to the forces at the bottom of the pier measured by the pressure cells.The uplift loads of the pier and anchor group correspond to the lefty-axis,and the bottom force corresponds to the righty-axis.The bottom force was obtained by multiplying the av‐erage pressure measured by the pressure cells by the bottom area of the pier.As the uplift load increased,the bottom of the pier was gradually pulled away from the lower rock mass,and the pressure decreased.At the maximum loading,the corresponding changes in the bottom force of A-1,A-2,and A-3 are −12.8,−39.4,and −4.2 kN,respectively.However,the force at any stage was much smaller than the weight of the belled pier (66.55 kN),which showed that the under‐lying layer was still attached to the bottom of the belled pier.
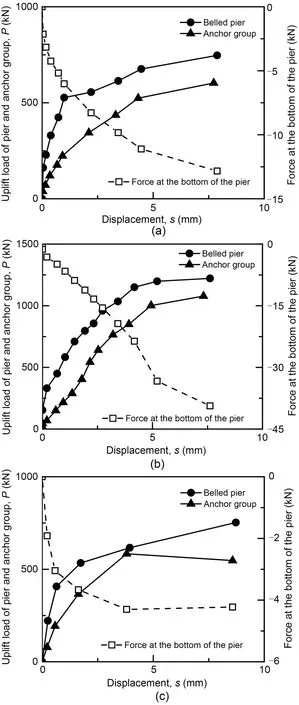
Fig.12 Comparison of the uplift loads of the pier and anchor group at each stage with the force at the bottom of the pier as measured by the pressure cells: (a) A-1;(b) A-2;(c) A-3
Further,the mobilization of the failure surface and the failure mode of the anchored pier can be con‐sidered.According to the classification proposed by Pacheco et al.(2008),the failure mode of the piers in this study belongs to the shallow mode.At the early stage of uplift,the friction of the pier-soil surface was gradually exerted with the increase of load.A relative slip of the sidewall and soil appeared and the failure surface developed downward.With the transfer of load to the bottom of the pier,the belled bottom began to squeeze the upper soil (soil was sheared),and the anchoring force of the anchor came into play,at which time the failure surface extended to the belled bottom.The pier was the first to reach the ULS,and the sur‐rounding soil experienced overall shear damage,with the failure surface penetrating from the bottom of the pier to the ground (inverted cone failure) (Das,2017).At this time,the failure surface also appeared at the interface between the anchor and the rock and devel‐oped.The rock around the upper part of the anchor was subjected to shear and tensile forces resulting in fissures.At the ULS of the anchor,the rock around the initial section of the anchor underwent overall shear damage,forming an inverted cone pullout body,as can be surmised from the previous analysis of the pres‐sure cell results.Referring to the study by Serrano and Olalla (1999),compound destruction was the fail‐ure mode of the anchor groups in this test.The fail‐ure surface in the lower part of the anchor was at the anchor–rock interface,while in the upper part of the anchor,it extended outward into the rock mass.Fig.10b is a schematic diagram of the failure mode of the an‐chored pier.
4 Calculation theory of monotonic uplift capacity
The calculation method can be expanded and supplemented based on existing design codes (IEEE,2001;BSI,2013) and studies on piers (Das,2017)and anchors (Serrano and Olalla,1999),in terms of DUC calculations,design processes,and construction requirements.To the best of our knowledge,the com‐bination of these two foundations (anchored pier foun‐dations) has not been specified in any previous stud‐ies or standards.The special parameters,UMCs,which reflect the load distribution of this foundation,need to be determined in the uplift capacity calculation and the design process.Although it was observed from the three tests that the anchor groups reached the ULS be‐fore the piers (k1<1,k2=1),it did not rule out that the pier reached the ULS before the anchor group.There‐fore,considering the applicability of the UMC calcu‐lation method,one ofk1andk2can be assumed to be equal to 1 in the derivation,and then the equation of the other can be given (as discussed below).
4.1 Calculation method for the UMC
Assume the case wherek1=1 to solve fork2as an example for analysis.First,the load-transfer equation of the pier is as follows,following research on the up‐lift capability of the pier (Chow,1986):
whereris the radius of the foundation,σzis the total stress in the vertical direction,andτis the shear stress on the side of the foundation.
The concept of influencing radiusrmproposed by Randolph (1978) is crucial for the calculation of the uplift capacity.The following equation can be used to determine the initial uplift stiffness of the belled pier(Kp) with the introduction ofrm:
whereGis the shear modulus of soil;is the Randolph influencing radius coefficient;rm=2.5ρLp(1-vs) is the Randolph influencing radius;νsis Poisson’s ratio of the soil;ρ=represents the ratio of the soil shear modulus at the middle and bot‐tom of the pier depth.For shallow foundations,ρis equal to 1.r0andrdare the radii of the pier column and the enlarged bottom,respectively.
The above calculations can only obtain the upliftP-srelationship of the belled pier in the elastic state.In fact,the upliftP-scurves of foundations are typi‐cally very nonlinear.A normalized hyperbolic model proposed by Chin (1970) can be used to fit these curves.Some pile tests were conducted by Castelli et al.(1991) to verify the validity of this theory with the introduction of initial tangent stiffness (i.e.,initial uplift stiffness mentioned above) and hyperbolic fitting coefficientRf.The uplift load and displacement have a nonlinear connection that may be represented as:
Eq.(6) is also suitable for fitting theP-scurve of the anchor.Therefore,to calculate the pullout loadPaof the anchor,the initial uplift stiffness of anchor (Ka)and the UUC need to be determined.
According to the study on the pullout deforma‐tion and stiffness of grouted rock anchors made by Cai et al.(2004),the initial uplift stiffness of anchors is calculated as
Based on the above analysis,the expression fork2can be obtained,as follows:
wherea1anda2are the initial uplift coefficients of the pier and anchor,respectively;b1andb2are the bearing capacity coefficients of the pier and anchor,respec‐tively;Rf1andRf2are the hyperbolic fitting coeffi‐cients of the pier and anchor,respectively.In the service-limit state of the anchored pier,Pp=Ppu,sok2can be calculated as:
Similarly,the case whenk2=1 is analyzed,and the expression fork1is obtained,as follows:
where,in the service-limit state of the anchored pier,Pa=Pau,sok1can be calculated as:
Eq.(9) or Eq.(11) can be used to calculate the UMC,and the results can then be entered into Eq.(2)to determine the uplift capacity of the anchored pier.The calculation procedure of the UMC is shown in Section S4 of the ESM,along with the UMC of A-1 as a case.
4.2 Calculation process of monotonic uplift capacity
Fig.13 shows the fitting results of the analytical solution of the hyperbolic model based on Eq.(6) and the experimental data of A-1.The deformation moduli of the soil and the rock mass are taken as 174 and 1034 MPa,respectively,based on the estimation me‑thod.The dimensional parameters are shown in Table 1.According to the characteristics of theP-scurves,the hyperbolic fitting coefficients corresponding to the pier and the anchor group can be taken asRf1=0.7 andRf2=1.0,respectively.The hyperbolic model matches well with the trend of the measuredP-scurve.It can be noted that in the initial pullout phase of the anchor group,the measurement results deviate from the hy‐perbolic model.The measured initial uplift stiffnessKa(slope) of the anchor group is lower than that of the hyperbolic model.The reason for this could be twofold.On the one hand,the fractures and weak lay‐ers in the rock mass make theKalower than that cal‐culated from the core samples.On the other hand,there may be a small relative sliding at the interface between the concrete and the rock,which reduces theKa.
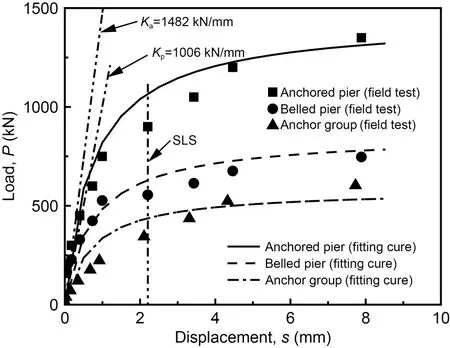
Fig.13 P-s curves of the foundation A-1 as fitted by hyperbolic models
The three anchored piers of this test and the foundations (anchored piers CF-A and CF-B,and combination foundation GTC2+AG8) reported in other studies (Ismael et al.,1979;Cheng et al.,2012;Qian et al.,2015) were used as examples for the verifica‐tion of the calculation method proposed above,and the results are shown in Table 4.Details of other foun‐dations are shown in Section S5 of the ESM.The the‐oretical method proposed to determine the UMC and the uplift capacity can be used to calculate the DUC of the anchored pier.Except for A-3,the difference between the physical test and the calculation ap‐proach forPffor each of the foundations is within 10%.As mentioned earlier,differences in geology and construction (Fig.7) led to anomalies in the A-3 re‐sults,thus increasing the difference between the mea‐sured and theoretical calculations ofPf.It is important to note thatk2does not indicate the individual uplift properties of anchors.Its significance is reflected in the process of calculating the uplift capacity of the an‐chored pier.
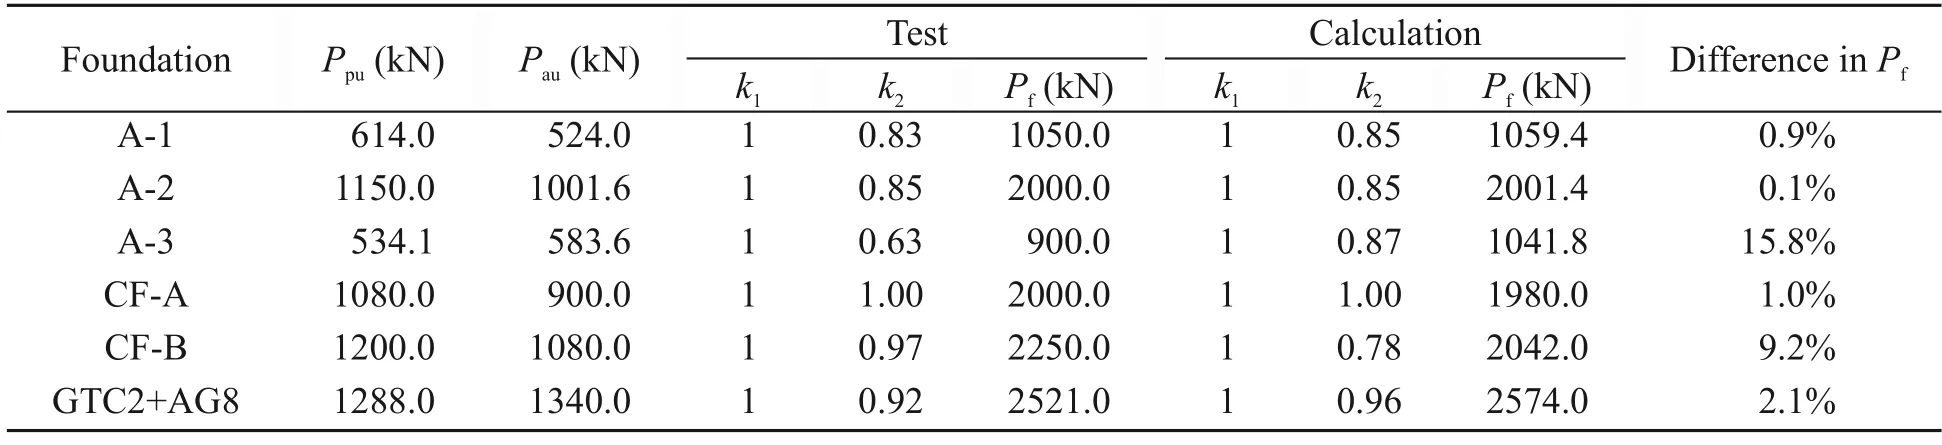
Table 4 Comparison of the experimental and calculated results (Ismael et al.,1979;Cheng et al.,2012;Qian et al.,2015)
5 Conclusions
Three in-situ monotonic uplift tests performed on the anchored pier foundations have been described in this paper.Through analysis and fitting of the test results,the uplift behavior characteristics and the UMC calculation methods for the anchored pier foundations are given and the conclusions shown below can be reached for the structural configurations and geologi‐cal conditions considered.
1.The uplift capacity of anchored pier is mainly provided by two parts: the belled pier and the anchor group.The uplift capacity of the former is composed of the side friction and the shear effect of the undis‐turbed soil on the enlarged bottom,while the latter is the anchorage force on the rock.
2.The first part that reached the UUC is the con‐trol factor for the SLS of the anchored pier.Due to the load distribution,the uplift capacity of the foundationcan be calculated by the UMCs and the uplift capacity of each part.
3.A combination of the failure mechanisms of the belled pier and the anchor group characterizes the failure mode of the anchored pier at the uplift ULS.
4.The anchored pier foundation is an indepen‐dent foundation that can be flexibly adjusted accord‐ing to geological conditions.Based on the theory of belled piers and anchors,the anchored pier foundation design should include a load distribution analysis to determine the SLS and the DUC.
5.The UMCs can be effectively obtained by sub‐stituting the survey results (geology and dimensions)into the theoretical calculation method proposed in this paper.They provide a basis for the calculation of uplift capacity and the design of the anchored pier foundation.
Acknowledgments
This work is supported by the National Natural Science Foundation of China (No.U2006225) and the European Union’s Horizon 2020 Marie Skłodowska-Curie Research and Innovation Staff Exchange Programme (No.778360).
Author contributions
Yizhou SUN designed the research and wrote the first draft of the manuscript.Honglei SUN helped to organize the manuscript.Chong TANG,Yuanqiang CAI,and Feng PAN re‐vised and edited the final version.
Conflict of interest
Yizhou SUN,Honglei SUN,Chong TANG,Yuanqiang CAI,and Feng PAN declare that they have no conflict of interest.
 Journal of Zhejiang University-Science A(Applied Physics & Engineering)2023年7期
- Journal of Zhejiang University-Science A(Applied Physics & Engineering)的其它文章
- Numerical investigation of the effect of geosynthetic clay liner chemical incompatibility on flow and contaminant transport through a defective composite liner
- Fractal analysis of small-micro pores and estimation of permeability of loess using mercury intrusion porosimetry
- Underwater minirobots actuated by hybrid driving method
- Square cavity flow driven by two mutually facing sliding walls
- Bogie active stability simulation and scale rig test based on frame lateral vibration control
- Analytical solution of ground-borne vibration due to a spatially periodic harmonic moving load in a tunnel embedded in layered soil