Trans-scale study on the thermal response and initiation of ternary fluoropolymer-matrix reactive materials under shock loading
Chao Ge, Die Hu, Jin Wang, Qingbo Yu, Haifu Wang, Yuanfeng Zheng
School of Mechatronical Engineering, Beijing Institute of Technology, Beijing,100081, China
Keywords:Reactive materials Trans-scale Mesoscale Thermal response
ABSTRACT To investigate the thermal response and initiation behavior of ternary fluoropolymer-matrix PTFE/Al/W reactive materials, a research combining shock loading tests and trans-scale modelling is conducted. On the basis of a good agreement of the numerically simulated and tested shock wave propagation, the significant impact of component ratios and particle sizes on the evolution of mesoscopic temperature,hot-spots and initiation is well characterized and analyzed.Results demonstrate that as the content of W increases, the range of mesoscopic high-temperature area increases and tends to distribute more uniform, while material with smaller W particles causes more intense particle deformation and larger temperature rise. The time to reach the critical temperature shows positive correlation to the content of W, while the critical temperature of hot-spots shows negative correlation to the particle size of W. For PTFE/Al/W of high density, with the increase of W particle size, the reaction rate decrease, however the time to reach the peak reaction rate shortens.
1. Introduction
Metal-fluoropolymer, prepared by mixing/sintering high fluorine content polymer binder with metal particles, is a typical kind of reactive materials(RMs),and was first proposed by Montgomery[1] in patent in the form of reactive fragments. RMs possess ideal strength as well as high chemical potential, and the reaction between metal particles and fluoropolymer matrix accompanied by a large amount of heat release could be initiated under high-rate shock loading. Based on the above characteristics, RMs like Al/PTFE, Al/W/PTFE not only have broad application prospects in military,space,petroleum industry and other fields[2-4],but also become the worldwide hot spot and frontiers of research in recent years [5,6].
Initiation mechanism of reactive materials as Al/PTFE is one of the issues of most concern.Two main shock-initiation mechanisms of reactive materials can be distinguished up to the present,namely, the mechanical and thermochemical mechanisms [7].However,the categorization of initiation of PTFE/Al into one of the above is unclear.Ames[8]and Lee et al.[9]attribute the initiation to large strain deformation, shear bands, and fractures, and they believe that the high temperature that is generated during impact is insufficient to produce initiation. Hunt et al. [10] proposed that the high strain rate and stress convert mechanical energy into thermal energy to promote ignition.No matter the exact initiation mechanism belongs to which of the above, they demonstrate the crucial significance of thermal effect within the material structure under shock loading [11].
Essentially, Al/PTFE is a kind of metal particles filled polymer matrix composite. Under high-rate loading,shock wave forms and continue to propagate into material structure.Particles under shock compression would then produce intense deformation and plastic flow,causing the collapse of intergranular hole and the remixing of particles[12].Such mesoscale changes would eventually lead to the macro phenomenon like temperature rising, material failure and ignition[13].However,it is difficult to obtain the evolution process of reactive materials in mesoscale through experiments due to the limited observation technology and the extremely short process of shock induced reaction of reactive materials, and necessitated the analysis in mesoscale numerical modelling,through which a more direct quantification of the mesoscale response can be related to macro dynamic mechanical and chemical behaviors.
In this research, thermal response under high-rate shock loading of ternary reactive material Al/W/PTFE was studied,combing the method of experimental, theoretical, and trans-scale modelling. Correlation between material composition, mesoscale structural configuration and thermal response was established.Initiation threshold was obtained and the initiation mechanism was revealed. The results would provide beneficial guide for the design and application of reactive materials.
2. Experimental and numerical methods
2.1. Material fabrication
In this research, ternary reactive material Al/W/PTFE (15.9 wt%/40 wt%/44.1 wt%),of which the mass ratio of active metal Al and fluoropolymer matrix PTFE was determined through zero-oxygenbalance, was fabricated. Preparation of the material followed a pressing/sintering process described in previously published papers [14,15], and is briefly presented here. First, powders of Al(Hunan Goldsky Aluminum Industry High-Tech Co.,Ltd.,Changsha,China,JT-4),W(Hunan Zhuzhou Jingzuan Co.,Ltd.,Zhuzhou,China)and PTFE (DuPont PTFE 9002-84-0, type MP 1000) were mixed uniformly via a dry mixing process in vacuum, before a drying process in vacuum at 50°C for ~24 h. Dried mixtures were then prepressed in a Φ30 mm×30 mm steel mold under the pressure of 70-80 MPa,with a dwell time of approximately 10 min.Following this procedure, the prepressed samples experienced a further isostatic pressing process at the pressure ranging from 220 MPa to 250 MPa for another 10 min with the adoption of a cold hydrostatic pressing machine. Finally, the pressed samples underwent a sintering cycle in a furnace under the protection of argon atmosphere.Specifically, the sintering cycle included heating the pressed samples at a rate of about 50°C/h to a final temperature of 380°C,holding at the final temperature for 4 h, then cooling to 310°C at the rate of 50°C/h and holding for 4 h,and thereafter cooling to the ambient temperature at an average rate of 50°C/h, as depicted in Fig. 1(a). From the sintered materials, specimens of φ30 mm × 30 mm for subsequent shock loading tests were machined,as shown in Fig.1(b).
2.2. Shock loading tests
Shock response of the Al/W/PTFE (15.9 wt%/40 wt%/44.1 wt%)were conducted with the adoption of an explosive loading device,of which the basic structure is depicted in Fig. 2. Four specimens were stacked vertically in the central and fine constrained by a quartz tube with an inner diameter of 30 mm and a thickness of 5 mm and was then amounted in a hollow steel body.On one side of the steel body,a slit was designed as an observation passageway to monitor the reaction process,while on the other side,four equally distributed holes were drilled in the steel body and quartz tube,through which four electric probes could be installed.

Fig. 2. Structure of the explosive loading device.
On the top of the specimens,pressed trinitrotoluene(TNT)with a diameter of 30 mm was selected as energy source to apply the explosive loading. Four electric probes were attached to the top of each specimen, where each electric probe was composed of two wires isolated by the enamel layer, and separately connected to a resistance-inductance-capacitance (RLC) network between the other ends of the wires. When the detonation wave arrived, the enamel melt connection of the wires would conduct the circuit.Triangular shock pulses generated displayed on the oscilloscope.At the bottom of the specimens, a buffer material made by 2024 Al alloy was able to absorb the multiple impacts before needing to be replaced, and prevent further shock damage between specimens.
2.3. Mesoscale simulation
The first prerequisite to carry out the numerical simulation is to establish a reliable mesoscale model of the ternary reactive materials.True microstructures of materials can be directly obtained by scanning electron microscopy (SEM), which offers a solid basis to statistically analyze the mesoscopic morphology, geometric and distribution characteristics of each component through the methods of image processing, mathematical statistics [16]. Finally,according to statistical analysis, the meso structure simulation model consistent with the real meso geometric and distribution characteristics could be reconstructed.
The particle size of Al and W satisfy the law of normal distribution, based on microscopic observation and statistical analysis[17].Using R as the size parameter for Al particles,which is random and large enough to fulfill the lognormal distribution. The mean value μ and standard deviation σ in this situation are 119 μm and 36 μm,respectively.Furthermore,W particles are treated as equalsized sphere in order to concentrate on the influence of W mass ratios on dynamic and thermal response of the ternary system.
To describe the ratio of each component and their distribution in two dimensions, we converted volume fraction to area fraction,which are quantitatively equal. The volume fraction of each component could be expressed as

Fig.1. (a) Temperature history of the sintering cycle and (b) prepared samples.
where ρAl, ρPTFE, ρWare the density of Al, W and PTFE, while mAl,mPTFE, mware the mass of each component respectively.
Random particles are generated based on this fraction and then packed into a preset matrix domain of 1.2 mm × 2.0 mm. The particles are randomly implanted without overlapping under this basic condition. Totally eight mesoscale models of different component mass ratios and particle sizes are reconstructed.Detailed information of the models is tabulated in Table 1.
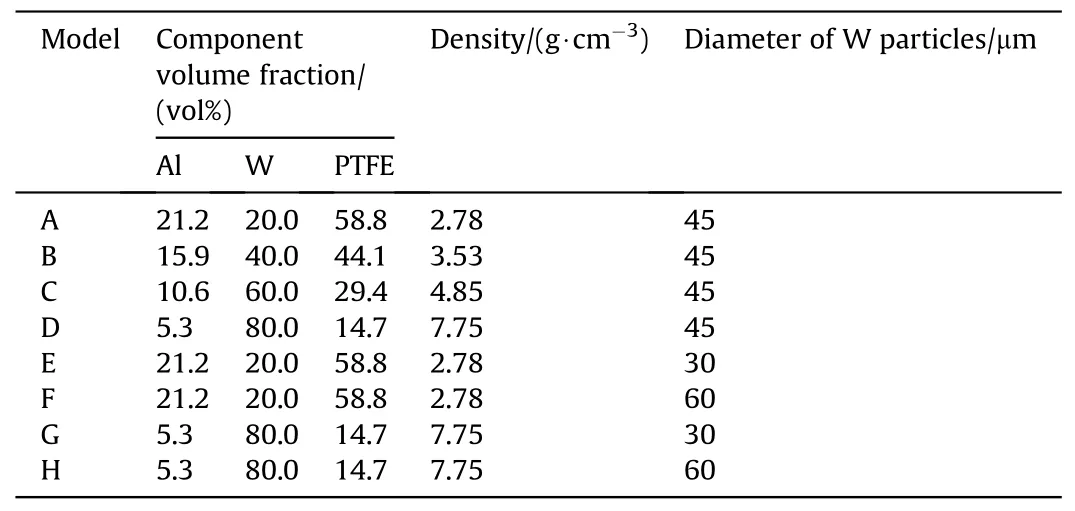
Table 1 Detailed information of mesoscale models.
The reconstructed models were then imported into AUTODYN platform for analysis using Euler algorithm [18]. A rigid plate assigned with certain velocities is added at the left side of the models to load and attributed with Lagrange algorithm. The outflow boundary is set on the upper and the bottom sides of the model to avoid the influence of stress wave reflection. Fixed boundaries are set at the right side of the model to limit the degree of freedom to move down,but to allow the model to compress due to loading. Interactions between either two elements are handled by single-sided automatic contact method.Finally,1 μm/cell square mesh was selected to discrete all the calculation domain,to obtain sufficient accuracy and calculation efficiency. Configuration of the calculation model is depicted in Fig. 3.
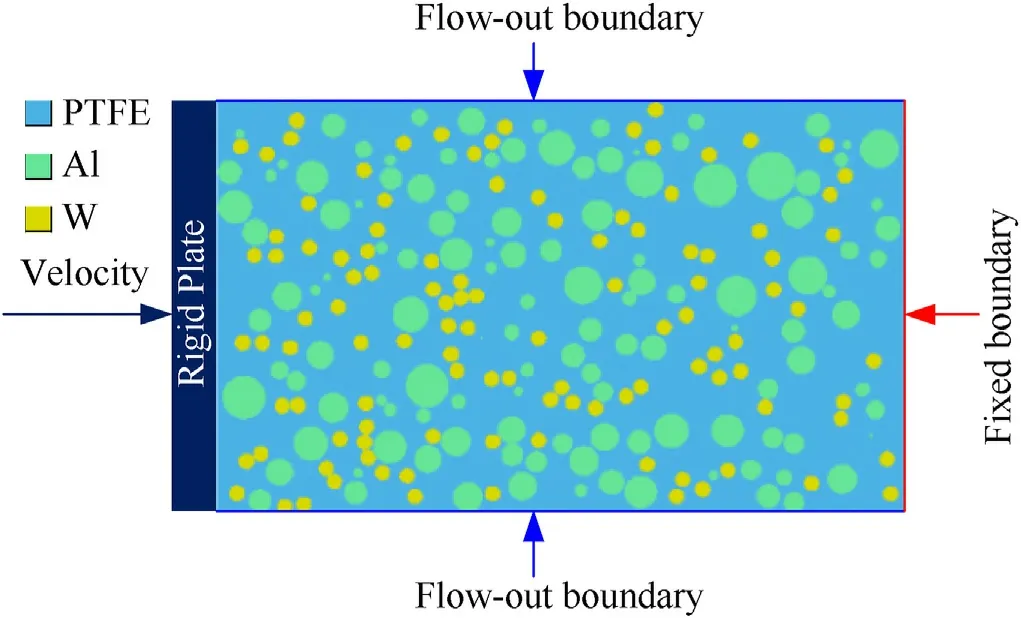
Fig. 3. Configuration of the calculation model.
The standard Johnson-Cook strength model and Mie Gr″uneisen equation of the state are employed to describe the properties of all the components. In Johnson-Cook strength model, the equivalent plastic stress σ is defined as [19].
The Mie-Gru″neisen equation of state is defined as
where P is the current pressure, ρ0is the initial density, C0is the bulk sound speed,μ=(ρ/ρ0-1)is a measurement of compression,ρ is the current density,Γ0is the Gr″uneisen’s gamma at the reference state, s is a liner Hugoniot slope coefficient, and E is the internal energy. Detailed parameters used in the strength model and EOS are listed in Table 2 [20].

Table 2 Parameters of material strength model [20].
Apart from the strength and EOS model, the great difference of the strength between metal particles and PTFE matrix results in most of the plastic strain adapts to the matrix rather than to the metal particles during loading. Thus, failure criterion should be applied to PTFE matrix as well,which is expressed as
where εfis the effective fracture strain under the current time step,σ* is the ratio of pressure to effective stress, while the damage parameter is defined as
3. Mesoscale thermal response
3.1. Simulation method validation
In order to verify the reliability of the mesoscale simulation method, shock loading of Al/W/PTFE (15.9 wt%/40 wt%/44.1 wt%)were conducted and the Hugoniot parameters were calculated.Fig. 4 shows the high-speed camera sequences of the explosive loading tests. The corresponding RLC circuit’s pulse signal, which records the arrival time of the shock wave front at each electric probe is shown in Fig.5.Based on the signals,relationship between propagation time t and distance x could be determined, which could be expressed as
Time of the shock wave propagation from the first probe to the second (t1), the third (t2) and the fourth (t3) probe, and the corresponding fitting coefficients are listed in Table 3 While he propagation velocity Usof shock wave could be expressed as

Table 3 Propagation time and coefficients of fitting curve.

Table 4 Values of the parameters [25-27].
Employing the mesoscale model (Model B) of the same component ratios as in the experiment, response under shock loading of the material was modelled.To capture the wave front at different moments in the mesoscale model during shock loading,twenty-one gauges were implanted in the model.However,due to the influence of particle sizes and their random distribution, the wave front usually does not exist as a plane wave form, and this particularity brings calculation error for determining the specific position of the wave front. Thus, a tracer method was used, by which the pressure of each Euler grid point could be captured according to the given calculation period to explain the spatial inhomogeneity in the shock response. Then the instantaneous position of the equivalent plane wave front was obtained by averaging the column grid data. Sudden spikes and jagged interfaces due to error sources can be smoothed to minimize errors. Despite the fact that the mesoscale model places a domain significantly smaller than the sample used for the experiment-only 1.2 mm × 2.0 mm-as can be seen in Fig. 6, a fair correlation between the experimental and numerical data is attained. Thus, it is reasonable to conclude that the model has the capabilities to investigate the thermal response under high-rate shock loading with sufficient accuracy.

Fig. 4. High-speed camera sequences of the explosive loading tests.

Fig. 5. Pulse signals from the RLC circuit.

Fig. 6. Fitting curve of distance-time.
3.2. Effect of component ratios on thermal response
Due to the obvious heterogeneity,component ratios and particle sizes all have significant impact on the thermal response of Al/W/PTFE materials. Temperature evolution of Al/W/PTFE of different component ratios under shock velocity of 1000 m/s is shown in Fig. 7.

Fig.7. Temperature distribution of Al/W/PTFE with diffe rent component ratios at t=50 ns,t=300 ns,t=500 ns under shock velocity of 1000 m/s:(a)Model A;(b)Model B;(c)Model C; (d) Model D.
Basically, the temperature rise and distribution demonstrates heterogeneous characteristics, and the high temperature regions could be divided into three categories: particles, particle borders and matrix. Under impact loading, relative movement of particles,as well as extrusion and collision between particles, occurs as a result of shock wave compression. When W particles with high strength interact with each other,there is no visible deformation or temperature rise inside the particles due to the strength difference between Al and W particles. The figure demonstrates that the significant increase of temperature is largely centered at the particle junction,namely,the side where Al particles are squeezed and smashed, but the temperature rise in the interior and far side of particles is rather limited.This suggests that particle collisions and friction are key contributors to temperature growth. Comparison between materials with varying W concentrations can also corroborate this. The area of particle contact rises as the W concentration increases,as does the area of Al particles suffering severe deformation and high temperature distribution.
Observing the matrix,the temperature also rises obviously and the range is bigger than that of the particles,which is mainly caused by the extrusion and friction between the matrix and particles under the action of the shock wave.Parts of the matrix adjacent to Al particles exceeds the decomposition temperature of PTFE of 725 K,which would finally cause chemical reaction between Al and breakdown products of PTFE.
By comparing the temperature distribution of models with different component ratios, it can be found that the content of W has prominent effect. As the content of W increases, the range of high-temperature area increases significantly, while the hightemperature area tending to distribute more uniform. However,when the content of W reaches 80%, the violently deformed Al particles are directly separated by W particles, and the hightemperature areas are interconnected and appear in the form of bands. These local high temperatures will bring considerable energy dissipation,and such energy dissipation is greatly affected by W content.At 500 ns,it can be seen that the high temperature area gradually decreases along the propagation direction of the shock wave,even when W content exceeds 60%,the temperature rise near the wave front is very insignificant.
3.3. Effect of particle size on thermal response
The thermal response of reactive materials is also affected by the size of W particles.Under the same loading condition,Fig.8 depicts the temperature distribution of four particle size grading materials with four distinct particle sizes. The figure shows that when the fraction is the same, W with smaller particle size causes more intense particle deformation and a larger temperature rise.
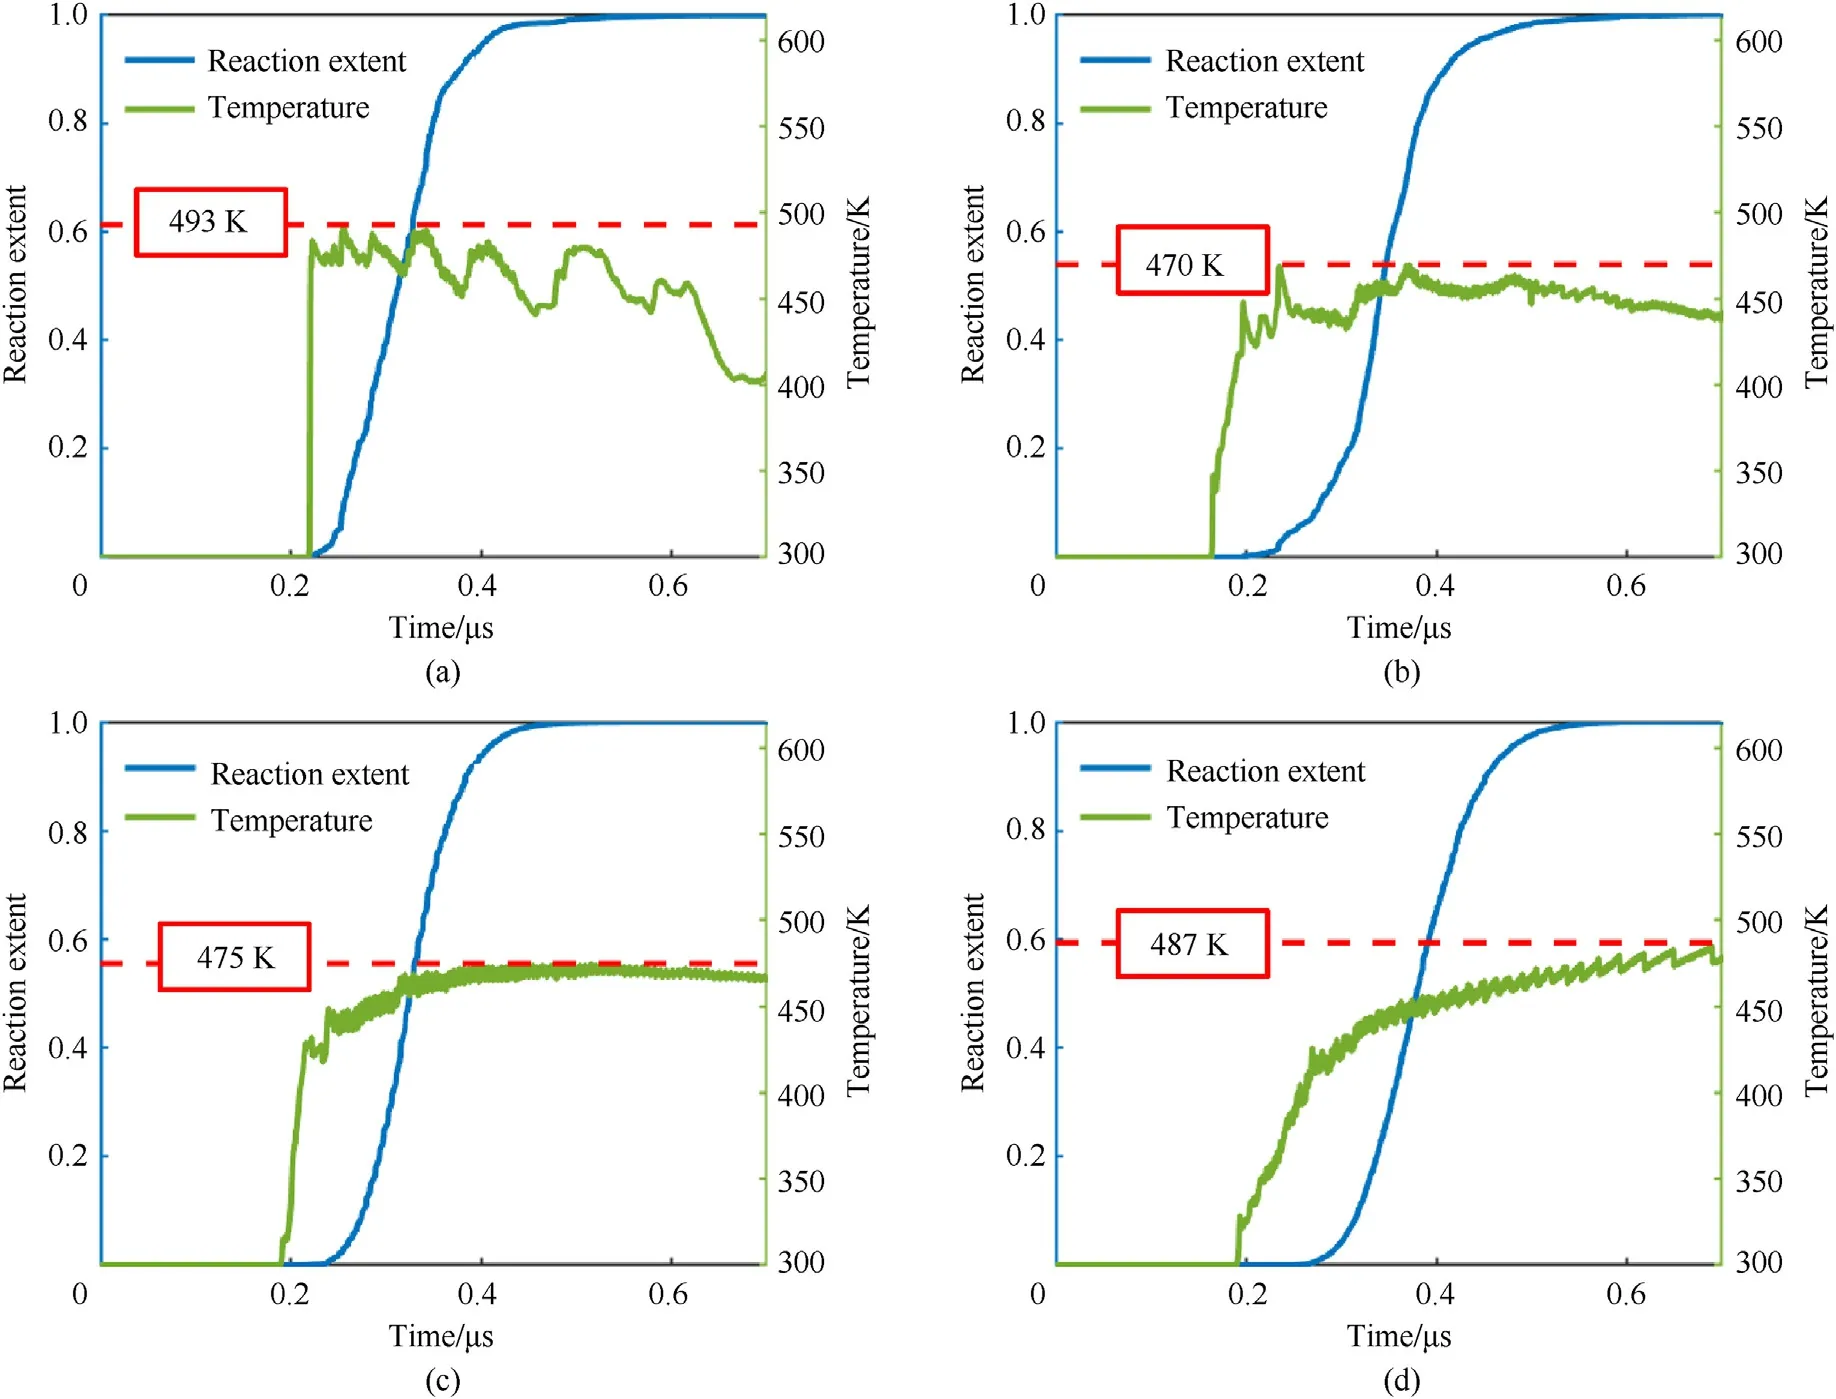
Fig. 9. Effect of component ratios on reaction degree of reactive materials: (a) Model A; (b) Model B; (c) Model C; (d) Model D.
The interaction area between W and Al particles with tiny particle sizes is smaller, which means that under the same loading condition, the shear stress caused by the extrusion collision between the two particles is higher, leading to severe deformation and breakage of Al particles.Many Al particles hit violently with W particles,virtually encircling W particles,and the temperature rise at the particle interface surpasses 600 K.At the same time,several high-temperature pieces are formed, which are higher than the melting point of Al. Melted Al particles combine with the PTFE matrix to mix,react,and excrete heat,resulting in a huge number of segmented high temperature zones.
Meanwhile,as shown in Fig. 8(a)and Fig.8,(b)at the same fraction,the particle deformation caused by W with large particle size is relatively minor. To begin with, when a large particle size W is extruded with an Al particle, the interaction area is higher and the shear stress is lower.As a result,although Al particle deformation is minimal,the temperature at the particle contact remains high.Second, larger size equals less quantity when the content is the same.Between the uncommon W and Al particles,a substantial amount of matrix is filled. Under impact loading, the matrix acts as a buffer,slipping and friction with the particles and wasting a significant amount of energy in the process.As a result,Al particles collide with larger W particles are generally elliptic,with only a few examples of fragmentation.However,a significant amount of matrix and particle friction dissipates, generating a continuous sub-high temperature zone that diminishes as the shock wave propagates. There is no discernible temperature rise along the wave front at 500 ns.
4. Shock-induce initiation
4.1. Hot-spots formation
In the structure of reactive materials, non-uniform stress and temperature distribution occurs under shock loading. During this energy importation and dissipation process, numbers of local positions in the bulk material would be raised and form hot-spots,which would stimulate the thermo-chemical reaction of reactive materials.Based on the mesoscopic dynamic and thermal response,initiation as well as reaction behavior of the ternary system could be quantitatively obtained.
It is necessary to obtain the formation mechanism and reaction criterion of hot spots,as well as to connect the critical hot spots and their evolution process caused by thermochemical stimulation with the chemical reaction diffusion process, in order to reveal and quantify the shock reaction mechanism of reactive materials from the perspective of microstructure properties.
According to the Arrhenius reaction rate theory, the rate of interface chemical reaction is mostly affected by the temperature rise during shock loading[22],the rate of chemical reaction can be expressed as
where y is the reaction degree, t is the reaction duration, A is the apparent preexponential factor, Eais the apparent activation energy,Ruis the molar gas constant,and T is the absolute temperature obtained by simulation.
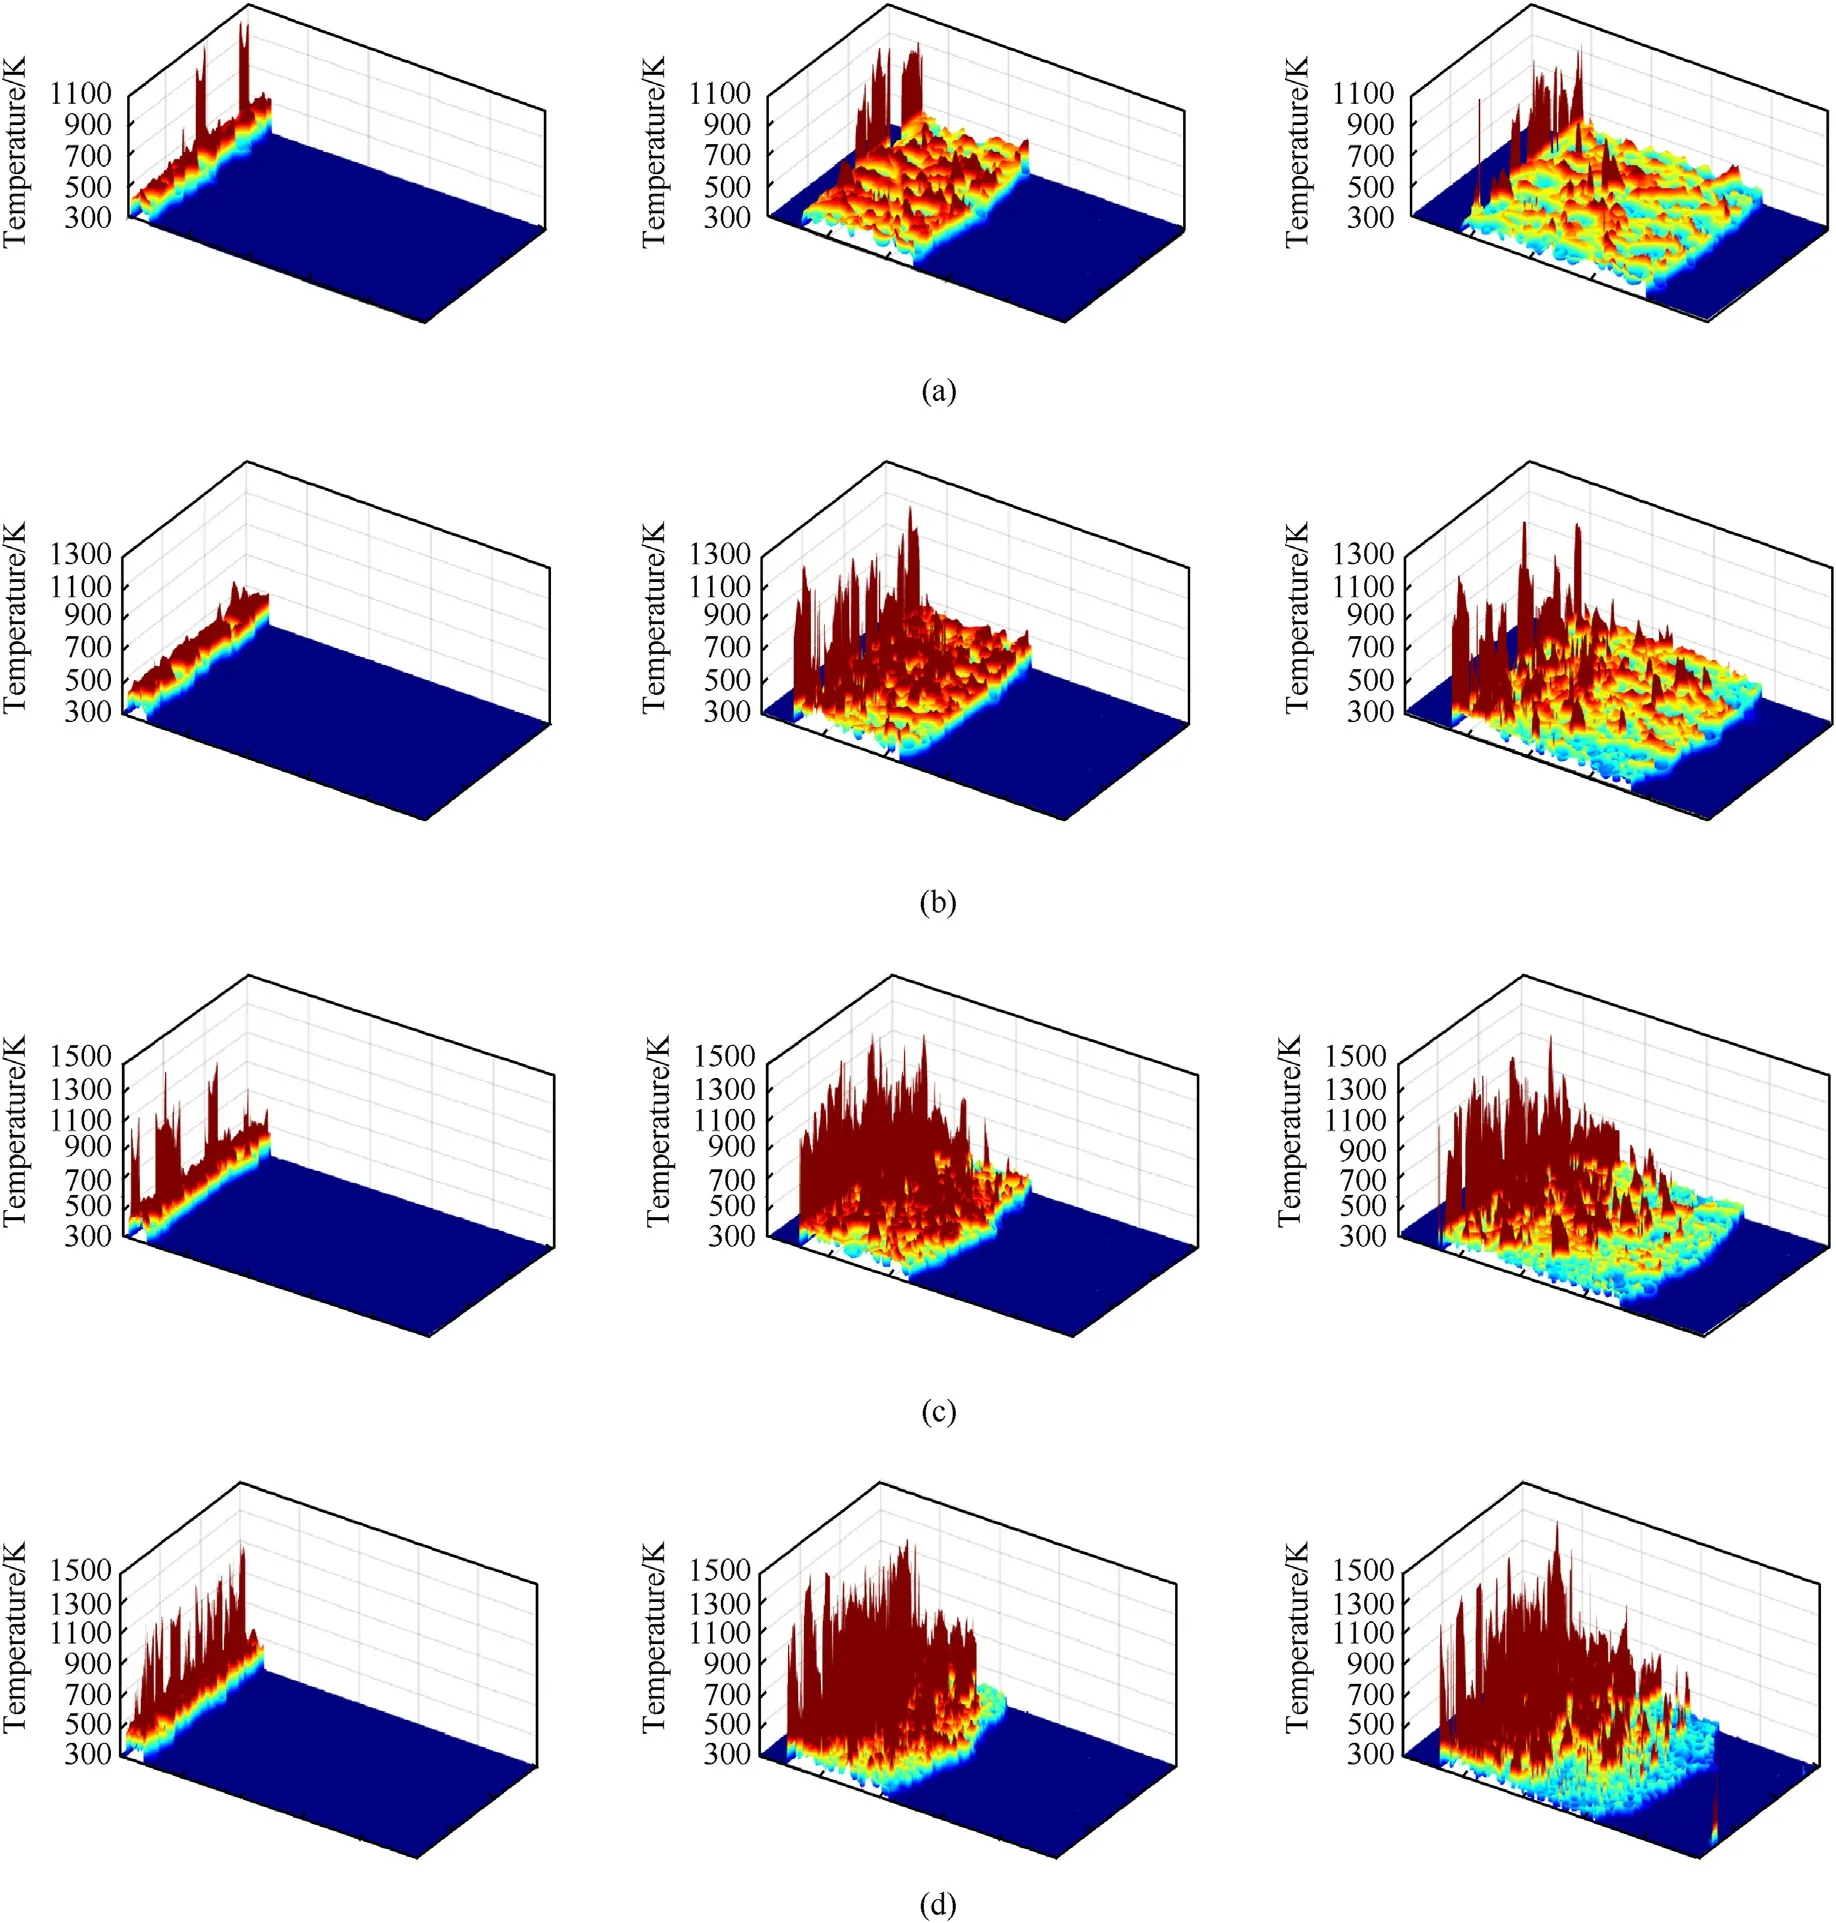
Fig.10. Evolution of hot-spots distribution of materials with varying component ratios at t=50 ns,t=300 ns,and t=500 ns:(a)Model A;(b)Model B;(c)Model C;(d)Model D.
For solid reactants,the apparent preexponential factor A can be calculated from differential scanning calorimetry (DSC) data by Ref. [23].
where β is the temperature rise rate, and Tris the peak-to-peak temperature of the primary heat release of differential scanning calorimetric curve.
Since the shock-induced chemical reaction process is very short,n-dimensional kernel/growth-controlled reaction model [24] can be used to describe the high-rate temperature-rising solid-state reaction, which can be expressed as
where n is the coefficient related to various boundary conditions and is related to the specific parameters of material impact reaction mechanism.
Based on avarami-Erofeev model [25], the equation of reaction degree and temperature rise can be expressed as the first derivative of T to y
The reaction rate can also be expressed as

Fig.11. Effect of particle size on reaction degree of reactive materials: (a) Model E; (b) Model F; (c) Model G; (d) Model H.
Eq. (14) correlates the shock temperature to reaction degree.After hot-spots are identified based on a minimum temperature in the mesostructure, reaction degree and its evolution process, as well as the effect of component ratios and particle sizes would be obtained. Values of the parameters are listed in Table 4.
4.2. Hot-spots and initiation evolution
Using Eq.(14),the reaction extent of 200 implanted gauges was assessed at terminal time,and those that reached 1,indicating that the chemical reaction of the relevant area was completely accomplished,were chosen.It appears to be a critical temperature above which the chemical reaction has the potential to continue until it is completion. Thus, the critical temperature can be regarded as the initiation threshold of the reaction of reactive material, which is a characteristic applied to represent the requirement of fulfilling the shock induced reaction.And the initiation threshold can be used to assess how material composition and mesoscale structural configuration affect the thermal response of reactive material.Exothermic accumulation in the reaction causes a high temperature zone to evolve into a hot spot, triggering the entire sample's initiation. With various component ratios, Fig. 9 displays the reaction extent and temperature over time. It demonstrates that when the density rises with the increase of W content, the critical temperature rises firstly and falls subsequently. Model B with 40% W particles has the lowest critical temperature of 470 K. This demonstrates that the presence of the ideal component ratio leading to the material to undergo more severe chemical reaction and release huge quantities of energy.
Fig.10 shows the evolution of potential hot-spots distribution of materials, which is above the specific critical temperature, with varying component ratios at t = 50 ns, t = 300 ns, and t = 500 ns.Generally, the highest temperature is near the center of the spot,resulting in significant peaks. As the wave interaction reaches relative equilibrium over time, the distribution of potential hot spots tends to be virtually uniform. The typical distance between hot spots is quite short, and its size has a considerable impact on nearby hot-spot connectivity. As the shock wave propagates, hot patches appear as ribbons, becoming more apparent. Although high-temperature regions can be found throughout the structure,only a few regions have maximum temperatures that above the threshold of hot spots, implying that chemical reaction are governed by a small number of hot spots in the material.
Similarly,the effect of particle size on reaction degree of reactive materials is depicted in Fig.11,while the evolution process of hotspots is shown in Fig. 12. As can be observed in the graph, with densification, the distribution of hot spots changes. The high temperature zone is primarily distributed at the position of particle contact in the early stages. Although there is friction loss due to particle-matrix slippage, the temperature rise of the matrix is substantially lower than the temperature of particle extrusion.As a result, high-density materials exhibit denser spikes, as well as higher peak temperatures and hot spot dispersion. The recombination of particle location and extrusion between particle and matrix become the main causes of plastic deformation and temperature rise during shock wave loading. The critical temperature of reaction hot-spots decreases as W particle size increases for both low (Model E and Model F) and high (Model G and Model H)density materials. This suggests that materials with coarse W particles are easier to initiate at lower temperatures.
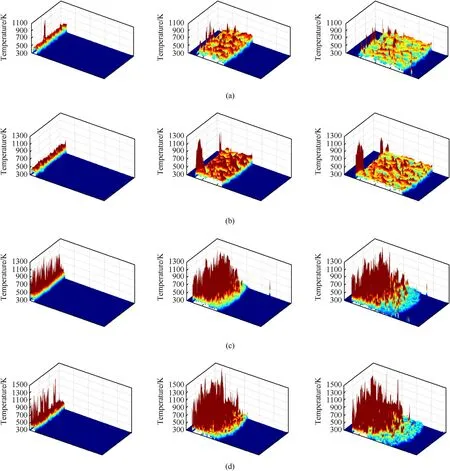
Fig.12. Evolution of hot-spots distribution of materials with varying particle sizes at t = 50ns, 300ns, and 500ns: (a) Model E; (b) Model F; (c) Model G; (d) Model H.
4.3. Effect of material characteristics on initiation
As analyzed in Subsection 4.2,component ratios and W granule sizes have significant effect on the initiation process of PTFE/Al/W.Fig.13 shows the effect of material characteristics on the time to reach the critical initiation temperature and critical temperature of hot-spots.With the increase of W particle content(Model A,Model B,Model C and Model D),the time to reach the critical temperature slows down.The material achieves the critical temperature at 0.256 μs when the W content is 20 wt%(Model A),and at 0.636 μs when the W content increased to 80 wt% (Model D).
When the sample contains 20 wt%W and the density is low,it is discovered that the material reaches the critical temperature as quickly as 0.082 μs when the W particle size is 60 μm. When the particle size of W in the material is as tiny as 30 μm, as demonstrated by Model E, the material reaches a critical temperature at 0.189 μs,which should be connected to the influence of W particles on heat transfer rate.When the sample contains 80 wt%W particles and the density is comparatively high,the time to reach the critical temperature are gradually increased. When the size of the W particles increases from 30 μm to 60 μm,the time to reach the critical temperature increase from 0.443 μs to 0.691 μs,indicating that the addition of small particle size of W is beneficial to the rapid accumulation of heat.
On the contrary of the time changing regulation, the critical temperature of hot-spots shows the similar trends for both low and high density reactive materials,as the size of W particles increase,i.e. the critical temperature of hot spots decreases from 501 K to 481 K as W particle size increases with materials of low density,while it decreases from 506 K to 475 K in situations involving high density.It seems that though the materials with coarse W are easier to initiate at lower temperatures, the requiring time to reach the critical temperature are not quite the same,which might be related to the effect of granule size on the reaction rate.

Fig.13. Effects of component ratios on reaction time and time to reach critical temperature of reactive materials with different component ratios.
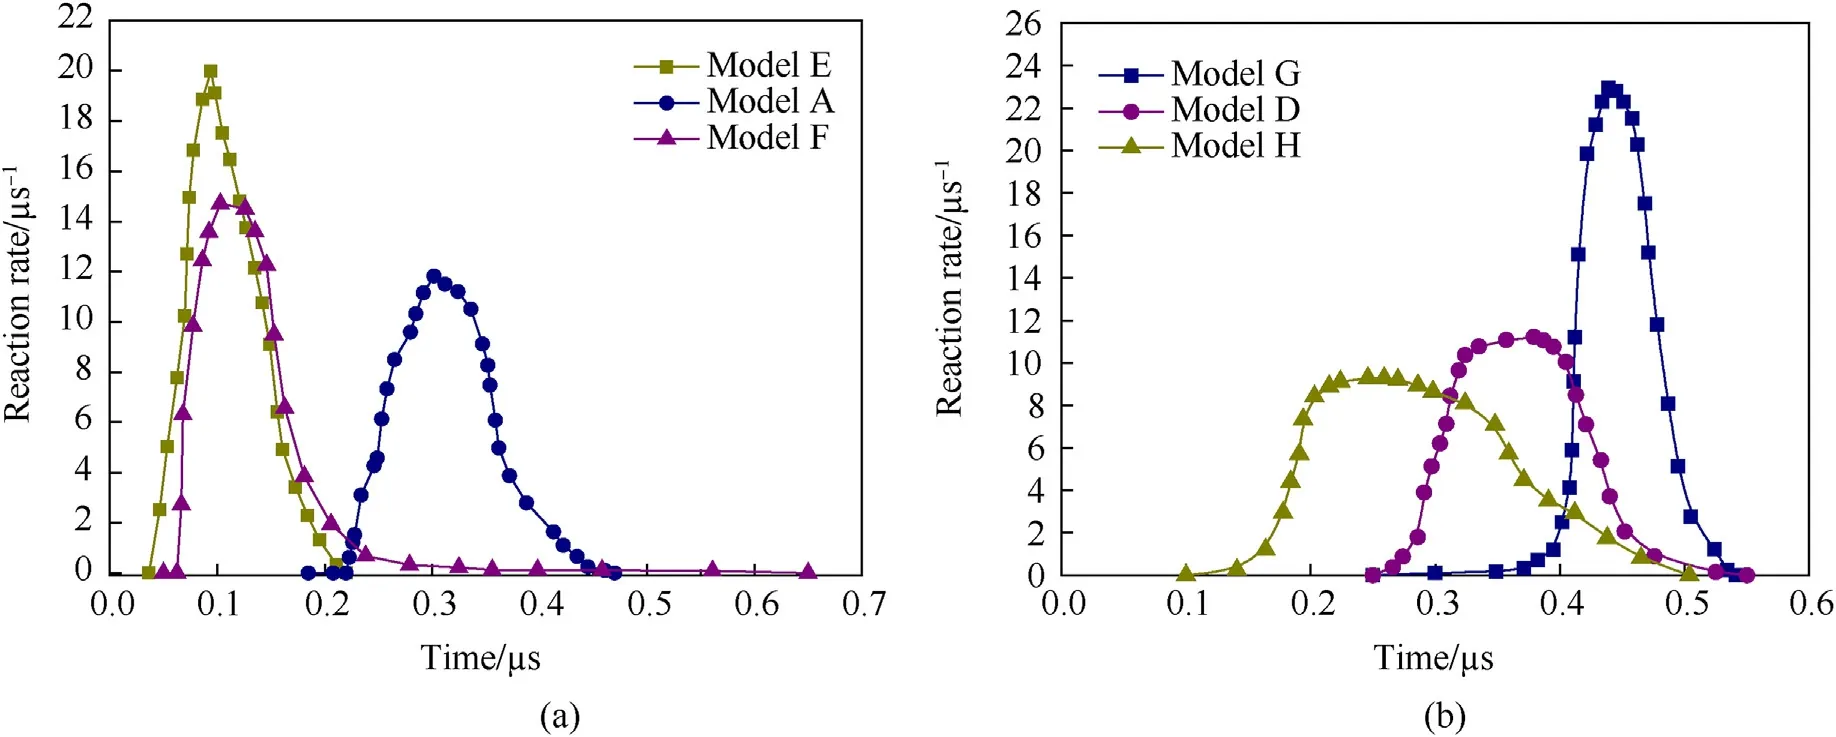
Fig.14. Effect of W particle size on reaction rate: (a) Low density; (b) High density.
The reaction rate can be calculated using the acquired reaction extent,to evaluate the effect of granule size on the growth progress of reaction. Fig.14 depicts the Effect of W granule size on reaction rate.Generally,the reaction rate rapidly climbs and decreases,with a plateau at the peak indicating that the material reacts at a reasonably constant pace.The peak values of the material reaction rate change dramatically when the W particle size changes.When the particle size of W is 30 μm, the reaction rate peak at 19.99 μs-1at low density, and the lowest peak value is 11.82 μs-1when the particle size is 45 μm. The reaction rate peak of the material reaches 14.7 μs-1when the particle size is 60 μm, however the duration is brief,the rate quickly falls down to less than 1 μs-1after 0.2 μs and last for more than 0.45 μs, 3 times larger than the high-rate period.
The span of the peak reaction rate changes more with high density,and the peak reaction rate steadily reduced while the peak platform duration rose as particle size increase. The peak reaction rate of W reaches its highest value of 22.95 μs-1when the particle size is 30 μm. When the particle size of W particles was raised to 60 μm,the peak velocity fell to 9.283 μs-1,the peak plateau lasted nearly 0.15 μs, and the slope of the reaction rate decline section became more relaxed.This suggests that the materials with coarse W particles are more likely to react on a relatively low but steady rate. While for those with tiny W particles, the whole process changes in a step way.
However, there was no discernible difference between the amount of potential hot spots produced by large and small particle size materials. This is due to the small size of the particles and matrix, which indicates a relatively larger contact area and heat transfer due to friction,shear,causing the critical temperature heat to concentrate at the reaction formation of hot spots and provide heat in the hot growth stage.
5. Conclusions
Based on shock loading tests and trans-scale modelling, the shock compression behavior of ternary fluoropolymer-matrix PTFE/Al/W reactive materials was investigated.The effect of component ratios and particle sizes on the thermal response and initiation was well characterized and analyzed. The main conclusions include:
(1) Mesoscale models of PTFE/Al/W ternary reactive materials of different component ratios and particle sizes were developed based on real mesoscopic structural characteristics. The results of trans-scale shock compression modelling correlate reasonably well with the corresponding shock loading tests,indicating the numerical methods were capable to investigate the thermal response under high-rate shock loading with sufficient accuracy.
(2) Mesoscopic temperature evolution and distribution shows that the high temperature regions could be divided into three categories: particles, particle borders and matrix. As the content of W increases, the range of high-temperature area increases, while the high-temperature area tending to distribute more uniform.
(3) The particle size acts vital part in mesoscopic thermal response. W with tiny particle size causes more intense particle deformation and larger temperature rise, while the particle deformation caused by W with large particle size is relatively minor.
(4) Based on the reaction extent and temperature history, the critical temperature of hot-spots, time to reach the critical temperature and reaction rate is obtained.The time to reach the critical temperature shows positive correlation to the content of W, while the critical temperature of hot-spots shows negative correlation to the particle size of W. For PTFE/Al/W of low density, no obvious trend of the reaction rate is found. However, for PTFE/Al/W of high density, the reaction rate decrease with the increase of W particle size,the time to reach the peak reaction rate decrease.
Declaration of competing interest
The authors declare that they have no known competing financial interests or personal relationships that could have appeared to influence the work reported in this paper.
Acknowledgements
The authors are very grateful for the support received from the Beijing Municipal Natural Science Foundation(Grant No.1214022).
- Defence Technology的其它文章
- Camouflaged people detection based on a semi-supervised search identification network
- A novel modification method for the dynamic mechanical test using thermomechanical analyzer for composite multi-layered energetic materials
- An improved SLAM based on RK-VIF: Vision and inertial information fusion via Runge-Kutta method
- Shock response of cyclotetramethylene tetranitramine (HMX) single crystal at elevated temperatures
- A super resolution target separation and reconstruction approach for single channel sar against deceptive jamming
- Angular disturbance prediction for countermeasure launcher in active protection system of moving armored vehicle based on an ensemble learning method

