A super resolution target separation and reconstruction approach for single channel sar against deceptive jamming
Shi-qi Liu , Bing Li , Bo Zho ,*, Lei Hung , Yue-zhou Wu , Wei-min Bo ,e
a Guangdong Key Laboratory of Intelligent Information Processing, College of Electronic and Information Engineering, Shenzhen University, Shenzhen,518060, China
b School of Electrical Engineering, Southwest Jiaotong University, Chengdu, 611756, China
c State Key Laboratory of Millimeter Waves, Southeast University, Nanjing, 210096, China
d School of Computer Science, Civil Aviation Flight University of China, Guanghan, 618307, China
e China Aerospace Science and Technology Corporation, Beijing,100048, China
Keywords:Deceptive jamming suppression Off-grid reconstruction Majorization-minimization Synthetic aperture radar (SAR)
ABSTRACT The excellent remote sensing ability of synthetic aperture radar (SAR) will be misled seriously when it encounters deceptive jamming which possesses high fidelity and fraudulence.In this paper,the dynamic synthetic aperture (DSA) scheme is used to extract the difference between the true and false targets. A simultaneous deceptive jamming suppression and target reconstruction method is proposed for a single channel SAR system to guarantee remote sensing ability. The system model is formulated as a sparse signal recovery problem with an unknown parametric dictionary to be estimated. An iterative reweighted method is employed to jointly handle the dictionary parameter learning and target reconstruction problem in an majorization-minimization framework, where a surrogate function majorizing the Gaussian entropy in the objective function is introduced to circumvent its non-convexity. After dictionary parameter learning, the grid mismatching problem in a fixed grid based method is avoided.Therefore, the proposed method can reap a super resolution result. Besides, a simple yet effective DSA section scheme is developed for the SAR data excerpting, in which only two DSAs are required. Experimental results about location error and reconstruction power error reveal that the proposed method is able to achieve a good performance in deceptive jamming suppression.
1. Introduction
Synthetic aperture radar(SAR)finds widespread applications in both civilian and military remote sensing for its ability of providing high-resolution surveillance on the terrain under a variety of weather and illumination conditions [1]. Nevertheless, performance of the SAR imaging degrades seriously when encountering electronic countermeasure, such as radio frequency interference[2,3], barrage jamming [4,5] and deceptive jamming [6,7]. Unlike the other two traditional jamming schemes,the deceptive jamming brings more harm to SAR imaging since it implants well-designed false scene into SAR imagery by performing time-delay and phase modulation to the intercepted SAR signal. Lots of researches have been focused on improving the fidelity and reducing the computational complexity of the deceptive jamming, bringing threat to SAR imaging and raising the challenge to tackle it[8-11].Therefore,it is meaningful to research the strategy of deceptive jamming suppression to guarantee the remote sensing ability of SAR.
The deceptive jamming suppression problem has attracted a lot of attention over the past few years [12-19,32]. An effective method is to use multi-channel techniques to achieve more spatial degree of freedom [12,13]. In this way, the significant distinctions between the true echoes and the deceptive jamming in different channels can be used for jamming mitigation.However,the multichannel framework is an expensive and complex way due to its high cost of deployment and maintenance on airborne/spaceborne platform. Besides these efforts, another line of work studies the countermeasure based on agile waveform, which is much cheaper than the former method [14]. The effectiveness is based on the assumption that,with the transmission of agile waveform,it is hard for the jammer to finish the work of interception,modulation and re-transmission within one pulse repetition internal.Nevertheless,as the hardware and algorithm of deceptive jammer develop, the improvement of real-time performance will negate the jamming suppression effect of agile waveform.
In order to surmount those foregoing limitations,anti-deceptive jamming methods are developed to decrease the implementation cost[16-19].In Refs.[16-18],dynamic synthetic aperture(DSA)is proposed to eliminate deceptive jamming based on a singlechannel SAR system and a fixed waveform. The DSAs are used to provide multiple observations about the different distributions of the deceptive jamming and real SAR echo in time-frequency domain. And then the jamming mitigation is formulated as a sparse recovery problem. By solving such a problem, the true and false targets can be distinguished obviously.However,the location errors of the reconstructed targets are not so desirable because of grid mismatch errors [16]. Besides, the introduced multiple DSAs are quite redundant, resulting in a large scale sparse recovery problem.This motives us to ameliorate the method to improve the jamming suppression performance with less data extracted by fewer DSAs.
In this paper, we tackle the deceptive jamming suppression problem under a super resolution compressed sensing framework[20,21]. Specifically, the problem of target separation and reconstruction against deceptive jamming is formulated as a sparse signal recovery problem with an unknown parametric dictionary to be estimated. The dictionary parameter learning and target reconstruction is addressed simultaneously by utilizing an iterative re-weighted method. During the solving process, a surrogate function that majorizes the Gaussian entropy is decreased iteratively in an majorization-minimization (MM) framework [22-24].Furthermore, after a detailed analysis on the time-frequency distribution characteristic difference between two kinds of targets, a DSA selection strategy is proposed to alleviate the requirement of selecting multiple DSAs in the wide slow time domain in previous method [16,17].
The remainder of this paper is organized as follows.In Section 2,the signal model of SAR system and the theory of deceptive jamming are depicted briefly. Then the problem of target separation and reconstruction against deceptive jamming is formulated as a sparse representation problem. The grid mismatch problem is analyzed in Section 3,where a joint jamming mitigating and target reconstruction method is proposed. In Section 4, we provide the experiment results to evaluate the effectiveness of the proposed method. Section 5 presents the concluding remarks.
2. Problem formulation of deceptive jamming suppression
2.1. Signal model of true echo and deceptive jamming
The geometrical model of SAR imaging and deceptive jamming is shown in Fig. 1. The axis x is parallel to the azimuth direction,along which the platform flies, axis y represents the range dimension, axis z is perpendicular to the ground. The zero slow time is set at the moment when the SAR beam center is pointing at the jammer J.
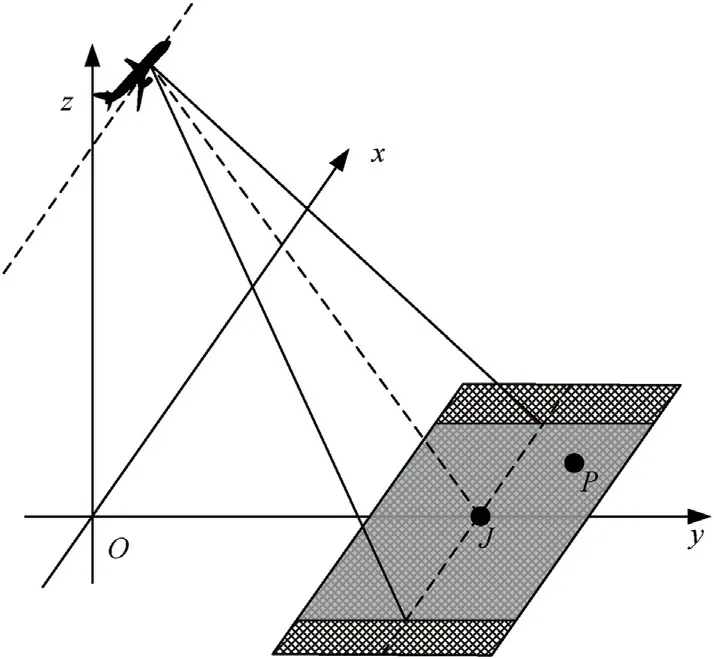
Fig.1. Geometrical model of SAR imaging and deception jamming.
For a single-channel SAR with fixed waveform, a linear frequency modulation (LFM) signal is usually adopted in the SAR system to achieve high resolution in the range domain, which can be expressed as
where rect(∙)is a rectangular function,tris the fast time,Trdenotes the pulse duration,f0represents the carrier frequency,and Kris the chirp rate.
In order to simplify the formulation, the range domain processing procedures such as pulse compression and range migration correction are assumed to have been carried out in the following analysis. After range processing, the echo reflected from a true scatterer can be expressed as
where tais the slow time,λ is the wavelength,σnis the scattering coefficient, Bris the bandwidth of the transmitted SAR signal, c is the propagation velocity of the electromagnetic wave,τnis the time delay of the scatterer in azimuth, Rn(∙) is the instantaneous slant range history varying with the slow time, and Rn0is the reference range of the scatterer.
In the process of SAR imaging, it is usually assumed that, if a scatterer falls into the main lobe of the antenna, its echoes can be received by the SAR without any attenuation, whereas no echoes will be collected when the scatterer goes out of the main lobe. For simplicity,aa(∙)is usually considered as a rectangular function,i.e.,
where |∙| calculates the absolute value and Tais the synthetic aperture time.Obviously,the support region of the true scatterer in the slow time domain is[-Ta/2 +τn,Ta/2 +τn].In the so-called main lobe deceptive jamming, the same envelope assumption is also utilized,where the deceptive jammer can only disturb the SAR when it is illuminated by the main lobe.
The support region of the true scatterer evidently varies as its azimuth location changes. Whereas, the support regions of all the false targets are the same as that of the jammer, which is [-Ta/2,Ta/2]. This is because the echo of the true scene is reflected form different scatterer,while the deceptive scene signal is emitted from the same source.
In order to appear at the same location as the true scatterer,the false scatterer's jamming signal is generated by implementing the shift along the slant range domain and phase modulation in the azimuth domain based on the intercepted SAR signal. After range processing, the deceptive jamming signal can be expressed as
where σJnstands for the preset scattering coefficient of the false scatterer. By comparing Eq. (4) with Eq. (2), it is clear that, after range compression, the signals of true scene and false scene coincide exactly with each other in the range domain.The high degree of consistency of signal characteristics in range domain not only brings the high fidelity and fraudulence in the SAR imagery,but also poses a great challenge in distinguishing the true and false targets through range domain processing.
2.2. Separation and reconstruction model of true and false targets
The above analysis reveals that the well-designed deceptive jamming mechanism may efficaciously embed the false scene to the SAR imagery, which is pernicious and also hard to tackle.Meanwhile, it is worth noting the difference lies in the azimuth support regions, which lead to a distinctive characteristic in timefrequency distribution. Therefore, fortunately, it is possible to take measures to suppress the jamming signal in the azimuth domain processing. The time-frequency distributions of the true echoes and deceptive jamming are shown in Fig.2.The thick solid lines represent the distribution of the true target signal echoes,which distribute along the slow time axis. The thick dashed lines represent the distribution of the false target signal, which distribute along the Doppler frequency axis.
In a traditional azimuth focusing process, Doppler center correction, dechirping and Fourier transform are performed successively to achieve a focused SAR imagery.However,the process is carried out with the whole slow time domain, which could not extract the distinction between the azimuth support regions of true and false targets. This is because, if the Fourier transform is performed with a wide slow time domain, all the energy of signals from true and false targets will be retained well. This is why the deceptive jamming works. Whereas, actually, if the Fourier transform Is implemented with a small slow time,the energy of signals from the two kinds of targets suffer different energy degradation characteristics.This is the fundamental principle of the DSA based idea.
Based on the above analysis, the DSA scheme employees a sliding synthetic aperture with varying center in the slow time domain,which is called DSA,to select a small segment data before the implementation of Fourier transform.Different time-frequency characteristics can be presented based on the processing of the selected data. The DSA is sketched as the dashed-dotted line in Fig. 2, which can be denoted as a rectangular function, i.e.,
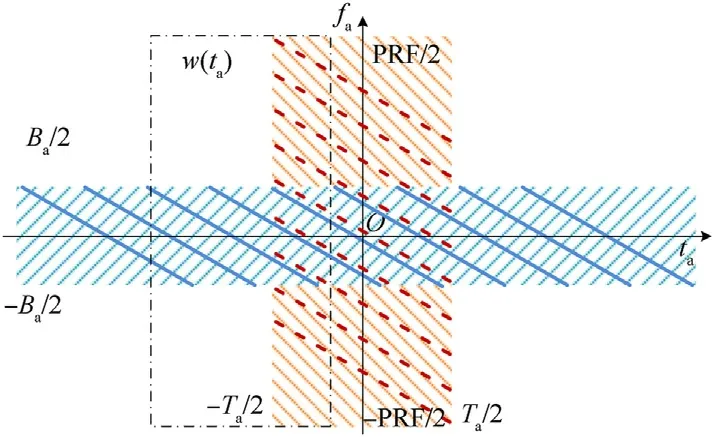
Fig. 2. Time-frequency distributions of the true echoes and deceptive jamming.
where ηwis the slow time center of the DSA.As ηwmoves along the slow time axis,different parts of the true echoes and the deceptive jamming will be extracted. This will lead to different imaging quality degradation for the true and false scenes.After the azimuth focusing process of Doppler frequency center correction, dechirping, DSA extraction and Fourier transform, the azimuth profile of the true and false scatterers in each range cell can be represented by U(fa,ηw)and UJ(fa,ηw), respectively
where, considering the consistency of true and false target in range domain,for notational simplicity,we omit the range domain parameters and expressions hereafter,is the Doppler frequency center,fais the Doppler frequency,γ is the Dopplerchirp rate,α andαJare the degeneration coefficientof the true and false scatterers,respectively,which can be defined by
As the data acquired by the SAR contains a mixture of the true echo and the jamming signal,the azimuth focusing process can be modeled as
where uwis the azimuth profile of the imagery after the processing of the selected data within the DSA,p, q∊ℂN×1are the scattering coefficient of the true and false targets, r∊ℂN×1is the modeling and measurement error,and N is the number of the azimuth cells,Gw, Hw∊ℂN×Nare azimuth profiles of the true and false scatters.Based on (6) and (7), their column vectors can be represented as
where ⊙is the Hadamard product operator, fais the vectorized Doppler frequency coordinates corresponding to the azimuth cells.Considering that the targets we are interested are often manmade targets, which are constructed with typical strong scattering structures, their sparsity can be used to separate and reconstruct the true and false targets based on their distinctions mixed in Eq. (10). On the basis of aforementioned analysis, the separation and reconstruction problem can be converted to a sparse reconstruction problem, i.e.,
where‖•‖0is the ℓ0-norm,which denotes the number of nonzero elements in the vector,‖•‖2is the ℓ2-norm and ε is a threshold for the reconstruction error.Then,the coefficients of both the true and false targets can be simultaneously obtained by solving the optimization problem in Eq. (13).
Note that, for a SAR system, the focusing in azimuth domain relies on the relative movement between the target and SAR. A jammer with a fixed location can only shift the frequency in the azimuth domain to place a false scatterer to the location it intends to imitate. Then it inevitably leads to the distinction in timefrequency distributions, which is used for deceptive jamming suppression in this paper. Therefore, it is not only valid for frequency-shifting jammer [25], but also for interrupted sampling repeater jammer (ISRJ) [26].
3. Proposed method
3.1. Analysis of the modeling error
Because of the NP-hardness of the ℓ0-norm problem,Eq.(13)is usually tailored to an ℓ1-norm problem [16-18], i.e.,
which is a computationally feasible problem. However, it is wellknown that, the accurate reconstruction of a sparse signal relies on the knowledge of sparse representation dictionary [20,21].Actually, it is impractical to pre-specify a dictionary that can sparsely represent the targets in advance. This is because it is impossible to precisely know all the locations that the scatterers may present for the SAR system. In the preceding reconstruction model,in order to apply compressed sensing to such an application,the continuous azimuth location has to be discretized to a finite set of grids. In other word, the dictionaries, Gw, Hw, are constructed based on the discretized azimuth slow time, {τn}. And the recovered scatterers are assumed sparse on the discretized azimuth location, correspondingly. Nevertheless, their actual locations do not necessarily lie on the discretized grid,but can reside anywhere in the continuous azimuth location axis. As a result, this discretization inevitably incurs errors and causes the problem of basis mismatch, which will have a negative impact on the achievable accuracy of the SAR imageries. A direct method to solve the problem is implementing finer grids. However, the finer grids result in the high dimensionality of the dictionaries and will require more measurements to match the dictionaries.
3.2. Parametric separation and reconstruction
In this paper, to outfox the problem of grid mismatch, the azimuth time grid points {τn} are treated unknown. Denote τ≜{τn}∊ℝ1×N, then the overcomplete dictionaries Gw(τ), Hw(τ)are also unknown,with their atoms,gw, hw,determined by Eq.(11)and Eq. (12), respectively. Letting Mw(τ) = [Gw(τ),Hw(τ)], z =[p;q], the problem of separation and reconstruction can be formulated asIn this framework, the aim is not only to estimate the sparse coefficients of the targets, but also to optimize/refine τ corresponding to their locations so that the parametric dictionary will approach the true sparsifying dictionary. To face with the NPhardness of the ℓ0-norm problem, the ℓ1-norm based minimization is a well-behaved numerical selection for its attractive convex property. Despite its popularity, ℓ1type methods suffer from a drawback that its global minimum does not necessarily coincide with the sparsest solution [27,28]. In this paper, the Gaussian entropy is introduced as the alternative sparsity encouraging penalty function for sparse signal recovery, which is defined as
where znis the n-th component of the vector z,and ε>0 is a small positive parameter to ensure that the function is well defined.It is obvious that, when ε→0, each individual logarithmic term log(|zn|2+ε) has infinite slope at zn= 0, ∀n. It implies that Gaussian entropy places a relatively large penalty on small nonzero coefficients to drive them to zero. Hence, this penalty function behaves more like the ℓ0-norm than the ℓ1-norm [27,29].Removing the constraint and adding a data fitting term,ρ‖Mwz-uw‖22to the objective function,the jamming suppression issue can be formulated as an unconstrained optimization problem,namely
where ρ>0 is a regularization parameter controlling the trade-off between the sparsity and the reconstruction error.
Note that the objective function in Eq.(17)is non-convex,so it is hard to solve the problem directly.In this paper,to circumvent this issue, we adopt the MM framework, which is based on a bounded optimization strategy[22-24].The idea is to obtain an appropriate surrogate function which is easy to handle, and then iteratively minimize the simple surrogate function to get the solution.
We first find a surrogate function majorizing L(z), which is differentiable and convex, i.e.,
After that, the problem in Eq. (15) reduces to the iterative minimization of the surrogate function. After some arrangements and ignoring terms that are independent of z and τ, the optimization problem at the k-th iteration can be expressed as
where (•)Hdenotes the conjugate transpose, D(k)is a diagonal matrix given asGiven τ fixed, resorting to the Lagrangian multiplier method[30], we can easily obtain the optimal z as
Substituting (22) back into (20), the optimization simply becomes searching for the unknown azimuth time grid points,that is
Note that the parameter τ is tightly coupled with the sophisticated form in Eq. (23). It is impossible to derive a closed-form solution. In practice, it is not necessary to obtain the parameter minimizing the function.We only need to search for a new estimatesuch that the following equality holds
Such an estimate can be easily acquired with the implementation of any a descent method. Then, ︿z(k+1)can be obtained by replacing τ with ︿τ(k+1)in Eq. (22), i.e.,
In what follows, we verify the non-increasing monotonicity of the objective function value with the new estimate{︿z(k+1),︿τ(k+1)},that is
In order to achieve the purpose, we can readily derive that
and
which come from the properties of the surrogate function Q(∙).Meanwhile, we can also get
which comes from the monotonicity of f(•). Then combining Eq.(27), Eq. (28) and Eq. (29), we can easily obtain (26). The convergence will be guaranteed by the non-increasing monotonicity of the objective function value in the iteration procedure.
For clarification, the parametric algorithm for target separation and reconstruction against deceptive jamming is summarized in Algorithm 1.

Algorithm 1Parametric Algorithm for Target Separation and Reconstruction Against Deceptive Jamming
3.3. DSA selection
Compared with the conventional azimuth focusing process with no jamming suppression mechanism, the DSA based method can extract the distinction between the true and false targets through the selection of a small data segment in azimuth domain.However,at the same time, it is the limited data that also limits the reconstruction performance.This is because a small part of the acquired SAR data would only contain part of the distinctive feature.In order to reap a stable performance,a good and direct choice is to employ multiple randomly selected DSAs to synthetic the distinctive feature embraced in different data segments [16,17]. The employment of multiple DSAs is able to provide more observations on the true and false targets to reduce errors.Nevertheless,this operation will imply larger grid dimensions embedding into very highdimensional spaces which will inevitably lead to a higher computational overhead. Additionally, it should be noted that the computation cost in refinement of the dictionary parameters is not ignorable. Therefore, it is meaningful to restrict the amount of the data to be processed as possible as it can be.
In order to alleviate this problem,in the following,we will focus on the time-frequency distribution again. Based on the analysis in Section 2.2, the false targets can be classified into three groups according to their distances to the jammer. For clarification, we denote the distance and the length of the synthetic aperture as dn,and La, respectively. Then the three groups can be described as follows.
1) When|dn|≤La,the false scatterers fall into Group 1.Their timefrequency distributions overlap partly or totally with the true scatterers that have the same distances to the jammer.
2) When La<|dn|≤0.5(β -1)La,the false scatterers fall into Group 2, with β being the oversampling rate in azimuth. Their timefrequency distributions do not overlap with the true scatterers that have the same distances to the jammer. Meanwhile, their distributions do not exceed the pulse repetition frequency(PRF).The deceptive jamming signal of these scatterers can be easily suppressed by a lowpass filter.
3) When |dn|>0.5(β - 1)La, the false scatterers fall into Group 3.
Their time-frequency distributions exceed the PRF,which leads to the nonsatisfaction of the Nyquist sampling theorem. In this case, it fails to deceptively jam the SAR.
Based on the above analysis,we shall maintain our focus on the scatterers falling in Group 1. Different from the deceptive signal limited in[ -0.5Ta,0.5Ta],the echoes of the true scatterers located at the same area as false scatterers in Group 1 distribute in[-1.5Ta,1.5Ta] in the slow time domain. From Fig. 2, one can observe that there are two critical points locating at ta= ± 0.5Ta.The time-frequency distributions of the true and false signals will overlap or non-overlap with each other near the critical points. In this paper, we choose the two critical points as the centers of the DSAs.Then,all the difference between the distributions of true and false targets will be covered in the only two selected data segments.Meanwhile, with the decrease of the number of the DSAs, the computational overhead and the need of memory space will be alleviated.

Fig. 3. The process of deceptive jamming suppression for SAR system.
Note that, in the system model, the zero azimuth time is established at the moment when the SAR beam center points at the jammer. To put the jamming suppression work into practice, we have to find out the jammer's location. As depicted in Fig. 2, the frequency of true echoes distributes in [ - 0.5Ba,0.5Ba], while the frequency of deceptive signals distributes in [ - 0.5PRF,0.5PRF].This difference provides the opportunity to locate the jammer. If the acquired signal is filtered through a high-pass filter with its frequency thresholds being ±0.5Ba, the remained signal will only contain deceptive signals. Then, find the maximum energy integration in a DSA moving along the slow time axis,and the center of that DSA will correspond to the jammer's location.
3.4. Practical application consideration
To tackle the deceptive jamming effectively,a series of processes including deceptive jamming identification, target extraction/background elimination, and target reconstruction are required.Such a procedure is depicted in the following block diagram.
As Fig. 3 shows, deceptive jamming identification and target extraction are implemented before target reconstruction.
1) In the process of deceptive jamming identification,the aim is to figure out whether the SAR imagery is polluted by deceptive jamming or not,and where are the false targets located in.Only when deceptive jamming is discovered and identified, the subsequent procedures (including target extraction and target reconstruction) are necessary to be implemented.
2) In the process of target extraction,the SAR imageries polluted by deceptive jamming are screening out, and the potential false targets are extracted out. This operation can distinctly restrict the data being processed in the following target reconstruction procedure, which will obviously reduce the amount of calculation.
3) In the process of target reconstruction, the attention is focused on the extracted area to reconstruct the targets of interest.
In this paper,the work is concentrated on target reconstruction.The process of deceptive jamming identification and target extraction(background elimination)is assumed to have been done.
In general,it is not necessary to carry out all 3 steps depicted in Fig. 3 when dealing with the deceptive jamming. In practical application, low cost and high efficiency are usually preferred. For example, when a deceptive jamming area has been identified, a decision of weather proceed to the following steps can be made based on the power of the identified area. A deceptive jamming area with weak scattering characteristic can only covers true scene which is much weaker.In this case,the reconstruction procedure is not necessary because, in general, there is not high valued target with strong scattering coefficients.
When the identified deceptive jamming area includes strong target, the target extraction procedure should be done to restrictthe operation of target reconstruction in a smaller area.
Therefore,even though the deceptive jamming is carried out in a complex distributed scene,the work of target reconstruction can be separately implemented in small areas to complement the target reconstruction work for the whole scene.
The computational complexity of the proposed method is dominated by the update of the optimal scattering coefficient vectorvia Eq. (22), which involves inverting a 2N× 2N matrix with a complexity of O(N3)per iteration.When dealing with a large scene, N becomes very large, the computational complexity will become very high.
Fortunately, the complexity can be significantly reduced based on the results of the preprocessing mentioned before (including jamming identification and target extraction). After the preprocessing, instead of processing on the whole imaging area, the work of target reconstruction is focused on the extracted area containing potential false targets.Then the imaging area is reduced and the dimension of the dictionary matrix will be reduced. The computational complexity will decrease cubically. For example, if the dimension of the extracted area contains K cells, which is less than N, the computational complexity will decrease to O(K3).
Furthermore,to decrease the computational complexity further,the azimuth profile can be divided into several segments. In this way, targets in each segment can be reconstructed separately. For example, if the extracted area is divided into J segments and each segment contains L cells, the computational complexity will decreased to O(JL3), which is sufficiently lower than the original computational amount. Moreover, the divided segments can be processed parallelly. This will improve the algorithm efficiency furthermore.
4. Experimental results
In this section, we illustrate the performance of our proposed method through experiment results. A SAR picked up on an airborne platform is employed here and it is set to work in the sidelooking strip-map mode. The parameters of SAR are shown in Table 1.

Table 1 SAR parameters.
In the following, we first compare the proposed method with the method in Ref. [16] to show the effectiveness after the considering of grid mismatch problem. Then the comparison of reconstruction performances with different DSA selection strategies are discussed to demonstrate the validity of the strategy adopted in Section 3.3.At last,we illustrate simulation result of the real measured target.
4.1. Reconstruction performance
At first, we generate the SAR data of the true and false targets,with their shapes designed as “N” and “Z”, respectively shown in Fig. 4 (a) and (b). After the implementation of the conventional range-Doppler algorithm, as shown in Fig. 4 (c), the true target is not recognizable any longer. Before the operation in azimuth domain, a super-resolution processing is applied in the range domain to alleviate the interactions between scatterers close in distance[16-18].Here,20 randomly selected DSAs are employed to excerpt the data segments for the extraction of distinctions between true and false targets.Then, the results after the separation and reconstruction processing,by using the method in Ref.[16]and the proposed method in this paper, are shown in Figs. 5 and 6,respectively. Roughly, the visual discrepancies between the two results of true targets are not too pronounced since all the true scatterers are on-grid designed. Note that, because the mismatch problem is not considered in Ref. [16], some energy leaks around the actual location in the in the imagery of the reconstructed false target.Three residual scatterers appear in the reconstruction result of the false target, which are circled in red circles. In contrast, the result of false target in Fig. 6 (b) is well reconstructed with little energy diffusion. This is because, with the mismatch problem handled, the energy is more focused on the actual locations.
To reveal the performance promotion, location errors and reconstruction power errors of the constructed true and false targets are illustrated in Fig. 7. The results with the approach in Ref. [18] are marked by“○” and mentioned as “iDSA”. The results with the approach in Ref.[16]are marked by“×”and mentioned as“mDSA”. The results with the approach in Ref. [17] are marked by“⊳” and mentioned as “mDSA-ADMM”. The results with the approach proposed in this paper are marked by“⋄”and mentioned as “proposed”. It is observed that, by implementing the proposed method,the lowest location errors and reconstruction power errors are achieved among all the algorithms, verifying the performance promotion of the proposed method in deceptive jamming suppression.
4.2. Comparison of DSA selection strategies
We first show performance of the method with three kinds of single-DSA strategies with ηwset as -0.5Ta,0.5Ta,0,respectively.The corresponding results are illustrated in Figs. 8, Fig. 9, and Fig. 10. The performance with 20 randomly selected DSAs is depicted as a benchmark. In Fig. 8, the location error and the reconstruction power error on the negative axis are distinctly lower than the positive axis. That's because the data selected from the DSA with ηw=-0.5Taonly contains the information of the scatterers located at the negative axis. On the contrary, as is shown in Fig.9,when the center of the DSA is set at 0.5Ta,the errors on the negative axis are evidently higher than the positive axis.In Fig.10,the reconstruction errors for the true scatterers are lower in the middle. Meanwhile, the reconstruction results are better for the false scatterers. This is because all the deceptive jamming signals are retained in the data selected from the DSA with ηw= 0,while only signals from the true targets near the jammer are retained.Based on these results with single DSA, we can notice that, the information embraced in the data segment extracted with one DSA is limited.It is impossible to separate and reconstruct the two kinds of targets simultaneously. Therefore, a number of DSAs have to be employed to improve the robustness [16].

Fig. 4. Conventional imaging results. (a) True targets. (b) False targets. (c) Deceptive jamming result.

Fig. 5. Reconstructed targets without the considering of the mismatch problem [16]. (a) True targets. (b) False targets.
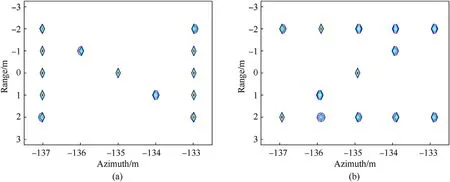
Fig. 6. Reconstructed targets with the considering of the mismatch problem. (a) True targets. (b) False targets.

Fig. 7. Performance comparison of reconstructed targets with the state-of-the-art approaches.(a) Location error of true targets.(b) Reconstruction power error of true targets.(c)Location error of false targets. (d) Reconstruction power error of false targets.

Fig.8. Evaluation metrics of reconstructed targets with ηw set as -0.5Ta.(a)Location error of true targets.(b)Reconstruction power error of true targets.(c)Location error of false targets. (d) Reconstruction power error of false targets.

Fig. 9. Evaluation metrics of reconstructed targets with ηw set as 0.5Ta.(a) Location error of true targets. (b) Reconstruction power error of true targets.(c) Location error of false targets. (d) Reconstruction power error of false targets.
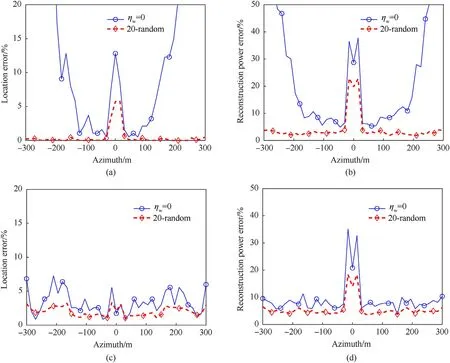
Fig.10. Evaluation metrics of reconstructed targets with ηw set as 0. (a) Location error of true targets. (b) Reconstruction power error of true targets. (c) Location error of false targets. (d) Reconstruction power error of false targets.
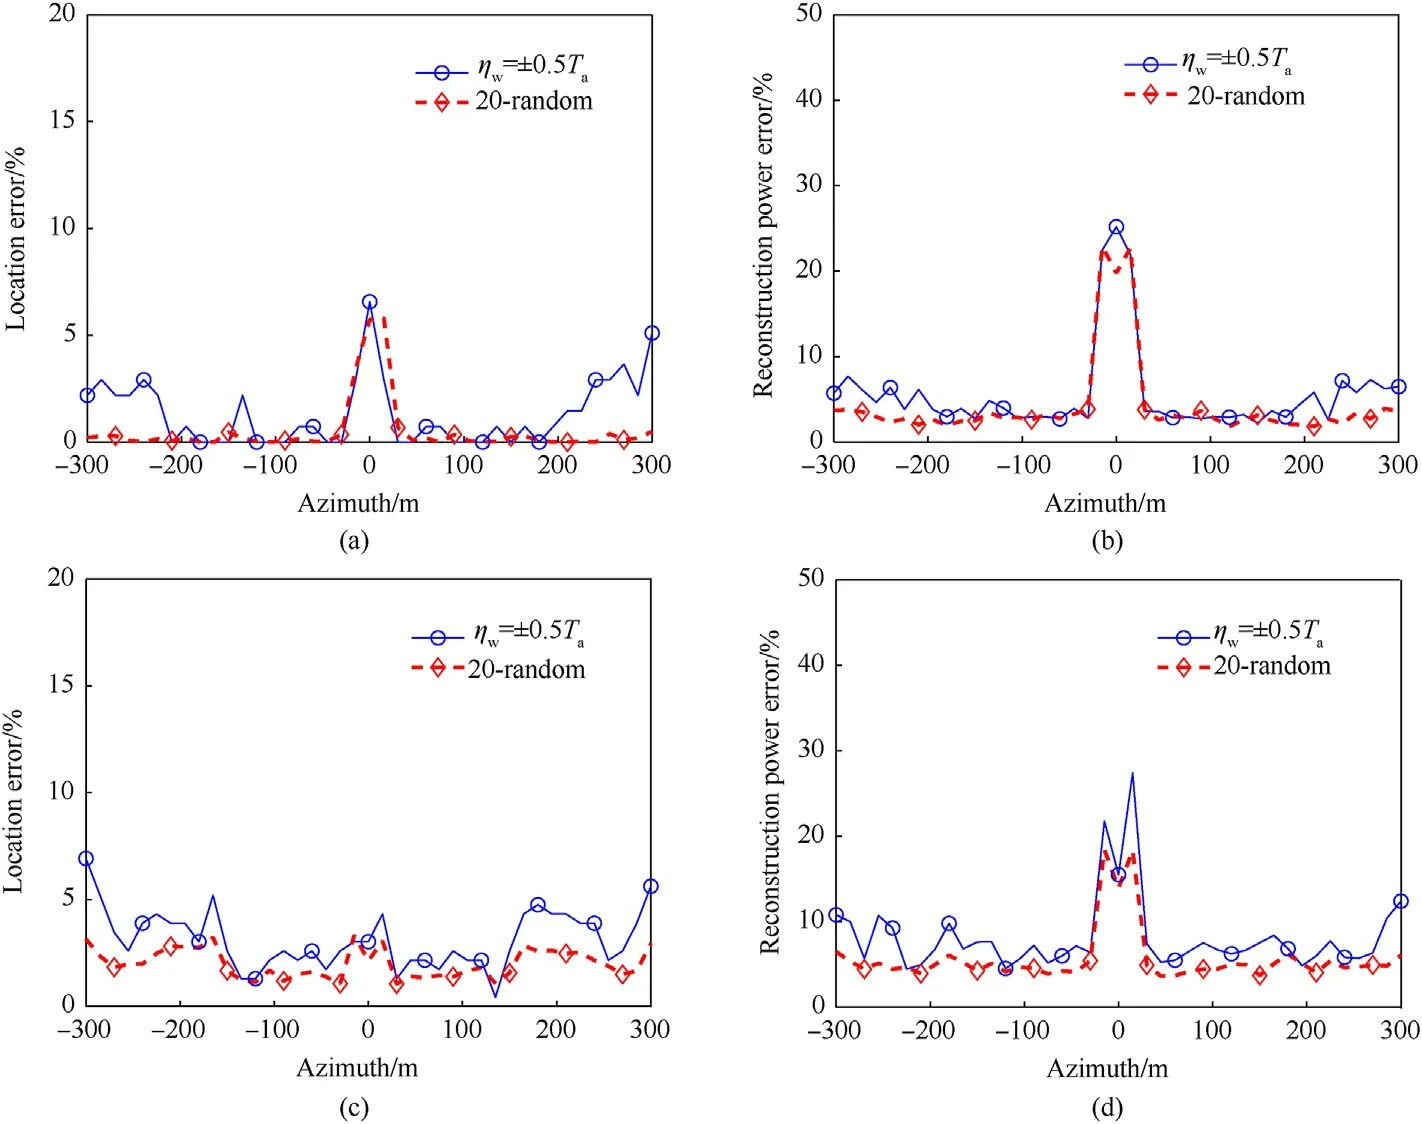
Fig.11. Evaluation metrics of reconstructed targets with ηw set as±0.5Ta .(a)Location error of true targets.(b)Reconstruction power error of true targets.(c)Location error of false targets. (d) Reconstruction power error of false targets.

Fig.12. Conventional imaging results. (a) True targets. (b) Deceptive jamming results.
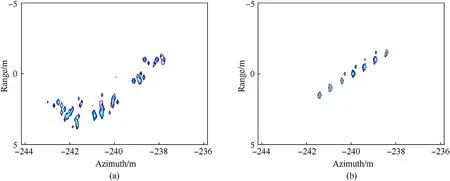
Fig.13. Reconstruction results. (a) True targets. (b) False targets.
In Fig. 11, we provide the performance with the two DSAs selected at ηw=±0.5Ta.It can be observed that the two curves are very similar in all the sub-figures,which reveals that,with the only two carefully selected DSAs,we can reap the performance as good as using 20 random DSAs. Thus, it is valid to implement the DSA selection strategy analyzed in Section 3.3. It should also be noted that, the DSA selection strategy is very meaningful. With the decrease of the number of the DSAs, the computational overhead and the need of memory space will be alleviated obviously.
4.3. Experiment on measured SAR data
The last experiment is implemented based on the measured SAR data of an armored personnel carrier, which is collected in the Moving and Stationary Target Acquisition and Recognition(MSTAR)program[31].In order to focus on the structure and the scattering coefficients of the target and alleviate the amount of computation,a background suppression preprocessing is applied on the original image before echoes generating to highlighting the target.The true target is illustrated in Fig. 12 (a). When a meticulously designed false target signal is implanted to the acquired SAR data, the imagery after conventional range-Doppler algorithm processing without jamming suppression is shown in Fig.12 (b). We can see that, the deceptive jamming not only makes it impossible to recognize the true carrier any more, but may mislead us to recognize it as other target (e.g., a truck).
Alternatively, by adopting the proposed method, the true and false target reconstruction results are shown in Fig.13 (a) and (b),respectively. It is clear that, when the false target is stripped from the fused SAR data, the real target is revivified clearly.
5. Conclusion
In this paper, we provided a super resolution target separation and reconstruction approach for single channel SAR encountering deceptive jamming.We first formulated the problem into a sparse signal recovery problem with an unknown parametric dictionary to be estimated.A simultaneous deceptive jamming suppression and target reconstruction method was developed to guarantee the remote sensing ability. By resorting to the iterative re-weighted method, we jointly addressed the dictionary parameter learning and target reconstruction problem in a majorization-minimization framework. The objective function value was gradually decreased by iteratively decreasing a surrogate function majorizing the Gaussian entropy with the refined unknown parameters. Experimental results show that the proposed method is able to decrease the location error and reconstruction power error. Besides, the proposed method can achieve a good reconstruction performance with only two DSAs.
Declaration of competing interest
The authors declare that they have no known competing financial interests or personal relationships that could have appeared to influence the work reported in this paper.
Acknowledgement
This work was supported in part by the National Natural Science Foundation of China under Grants 61801297, 62171293, U1713217,U2033213,61971218,61801302,61701528,61601304,in part by the National Science Fund for Distinguished Young Scholars under Grant 61925108, in part by Natural Science Funding of Guangdong Province under Grant 2017A030313336, in part by the Guangdong Basic and Applied Basic Research Foundation under Grant 2019A1515110509, in part by Foundation of Shenzhen City under Grant JCYJ20170302142545828,in part by the Shenzhen University Grant 2019119,2016057,in part by the Fund of State Key Laboratory of Millimeter Waves under Grant K202235,and in part by Sichuan Science and Technology Program under Grant 2021YFS0319.
- Defence Technology的其它文章
- Trans-scale study on the thermal response and initiation of ternary fluoropolymer-matrix reactive materials under shock loading
- A novel modification method for the dynamic mechanical test using thermomechanical analyzer for composite multi-layered energetic materials
- An improved SLAM based on RK-VIF: Vision and inertial information fusion via Runge-Kutta method
- Shock response of cyclotetramethylene tetranitramine (HMX) single crystal at elevated temperatures
- Camouflaged people detection based on a semi-supervised search identification network
- Angular disturbance prediction for countermeasure launcher in active protection system of moving armored vehicle based on an ensemble learning method

