Sagging damage characteristics of hull girder with trapezoidal crosssection subjected to near-field underwater explosion
Hai-tao Li, Xin-ying Zheng, Chi Zhang, Zhi-yuan Mei, Xue-fei Bai, Kai Liu
College of Naval Architecture and Ocean Engineering, Naval University of Engineering, Wuhan, 430033, PR China
Keywords:Underwater explosion Bubble pulsation Sagging damage Dynamic response
ABSTRACT To investigate the overall damage characteristics and failure modes of a warship subjected to an underwater non-contact near-field explosion, a hull girder with a trapezoidal cross-section was designed,manufactured, and tested. The design criteria and parameters were determined according to the similarity criterion. Dynamic responses of the girder freely floating on water were obtained under varying conditions, including stand-off distance, charge mass, and position of attack. Damage morphologies of the girder model were obtained. Based on our analysis, basic conditions for sagging damage of the hull girder are proposed.The aim of this study was to determine an efficient method of attack resulting in the most severe damage to the ship hull. The experimental results show that the girder mainly exhibits a first-order response when the first wet frequency of the girder is close to the frequency of the explosion bubble pulsation. The largest deformation was observed when the underwater explosion occurred directly below the midspan of the girder compared to other explosions of the same intensity at different attack positions. When the ratio of stand-off to maximum bubble radius (λ) satisfies 0.7 ≤λ<2, the bubble mainly causes sagging damage instead of hogging.As λ decreases(1≤λ<2),the sagging damage increases under the same charge mass. However, as λ decreases further (0.7≤λ<1), the sagging deformation decreases. This is likely due to the impact of the liquid jet formed by the collapsing bubble,which causes the girder deformation to shift from sagging back to hogging deformation.The initial shock wave excites the high-frequency response of the girder structure but contributes very little to the overall velocity and displacement.However,bubble pulsation typically causes a low-frequency response, which will affect the velocity and displacement of the girder. The low-pressure region of the flow field formed by bubble pulsation and resonant coupling between the girder and the bubble are the predominant causes of damage to the overall girder structure.
1. Introduction
In modern naval battles, warships are primarily attacked by means of near-field underwater explosion (UNDEX) of explosive devices such as torpedoes or mines.The long and thin structure of a warship determines its low-order modal frequency,which is in the range of several Hertz and similar to the frequency of the bubble pulsations produced by underwater explosions.In the far field,the whipping response due to coupling between the explosion bubble and the warship can also be excited[1-5].In the near field,damage to the warship is mainly induced by large plastic deformation caused by overall sagging and hogging, with more serious consequences, and the ship may sink [6-10]. Fig. 1 shows the typical dynamic responses and damage modes of a warship under different explosion conditions when an UNDEX occurs underneath the warship.
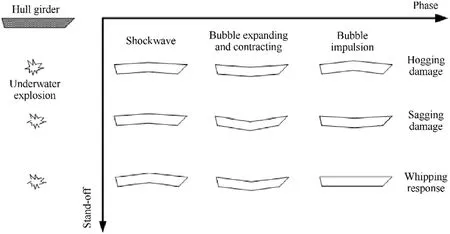
Fig. 1. Schematic diagram illustrating the typical dynamic responses and damage modes of a warship subjected to various underwater explosion (UNDEX) conditions.
A considerable amount of research has been carried out on the overall dynamic response of warships subjected to UNDEX using various research approaches.Theoretical and experimental studies typically only consider the hull girder of the warship,which can be treated as a simple beam. Zong [11] adopted the spherical bubble hypothesis to theoretically study the dynamic response of a hull girder subjected to an explosion bubble in the far field.Their study focused on motion of the rigid-plastic girder during the bubble pulsation stage while ignoring the effects of shock waves.Furthermore, Zhang [12] theoretically analyzed the response characteristics of an ideal elastic-plastic hull girder under spherical bubble pulsation, and established models of the three stages of girder movement: elastic motion, rigid-plastic deformation, and elastic recovery. Li [13,14] applied numerical and experimental methods to study the overall damage of a hull girder with rectangular section subjected to a near-field UNDEX. Their preliminary studies revealed the mechanism of sagging damage.Further to this,Li [15] divided the blast load process into five typical stages and established a simplified theoretical model of the overall motion of the hull girder under the combined effect of the shock wave and the bubble. The elastic and elastic-plastic deformation modes of the girder were studied. Vertical deformation of the hull girder under repeated loading and unloading was analyzed during the bubble pulsation stage. Zhang [16] performed experiments to determine the overall hogging plastic damage of a girder model subjected to near-field UNDEX and revealed the hogging damage mechanism.In addition,they analyzed the effects of coupling between the overall motion and local distortion of the hull girder. Numerical simulations were carried out by Zhang[17],Zong[18],Zhu and Cheng[19]et al. in ABAQUS to study the response of warships or hull girders subjected to UNDEX with various stand-off distances. The simulation methods were validated with experimental tests.
Due to confidentiality reasons and challenges associated with performing experiments on the overall damage of warships,research in this area is relatively limited. A few experimental studies have shown the effects of bubble pulsation on sagging damage using girder models. However, numerous simplifications were made.For example,the cross section of the hull girder is often assumed to be rectangular and the mass distribution of the girder along longitudinal direction is not considered. Furthermore, the results showed that overall deformation damage of a girder subjected to UNDEX will vary with stand-off distance and attack angle.Further study of these correlations is warranted.
This paper presents an experimental study of the overall sagging and hogging damage modes of a hull girder with a trapezoidal cross-section. The mass distribution and attack position were considered. When the girder response and deformation are dominated by coupled resonance, sagging damage will typically occur.The effects of other parameters, such as the ratio of stand-off distance to maximum bubble radius, on the bubble pulsation and dynamic response of the hull girder are also discussed.
2. Experimental design
2.1. Test model
The structural responses of prototypes and models subjected to underwater explosion do not completely satisfy the similarity criterion.Under an explosion shockwave load,the overall response of the structure can satisfy the similarity criterion when the strain rate effect is ignored[20,21].Under the load of an underwater explosion bubble,the maximum bubble radiusdoes not satisfy the similarity criterion due to the initial hydrostatic pressure(H+10.3). Although the response of the girder structure does not fully satisfy the similarity criterion,it has been previously reported that if the structural dimensions of the prototype and the model satisfy the similarity criterion and the ratio of the first-order wet modal frequency of the girder to the corresponding bubble pulsation frequency is almost equal, the damage modes are consistent and will satisfy a particular damage mechanism or law [22].
Based on the above principles,a girder with a trapezoidal crosssection was designed as a scale model of a typical warship using the following design process:
(1) The structural parameters of the girder in both the prototype and model should satisfy the formulawhereλ represents the scale factor,I represents the moment of inertia of the girder cross-section,σ represents the yield strength of the material, y is the distance from the test point to the neutral axis of the cross-section, and m and p denote the model and the prototype, respectively. When the structural parameters of the prototype are known, the structural parameters of the model,such as moment of inertia Im,can be obtained using the formula. Due to confidentiality reasons,the structural parameters of the prototype and the scale factor are not provided here.
(2) The charge mass in the model experiment is determined according to scale factor λ, and the bubble pulsation frequencycorresponding to the explosion depth is calculated.The frequency fmsof the scale model can be determined according to the formulawherefsis the first-order wet modal frequency of the girder.
(3) The length of the girder model can be adjusted and the weights balanced to ensure the model draft satisfies the similarity requirements and the first-order wet modal frequency of the model is close to fms.
A scaled hull girder model and test conditions were designed according to a certain type of destroyer attacked by detonation of a certain mass of trinitrotoluene (TNT) charge as the prototype. In view of the manufacturing and welding challenges, a full-scale geometric model of the hull girder was not produced. There are no longitudinal stiffeners in the scale model,however,the effect of longitudinal reinforcement,such as middle-line keelson plates and longitudinal stringers,is still considered.Based on the equivalence principle, stiffeners were included in the outer plate thickness of the model,which ensures that the moment of inertia of the girder satisfies the similarity criterion in the prototype and model. The simplification process is shown in Fig. 2.

Fig. 2. Design process of scaled girder model.

Fig. 3. Structure and dimensions of hull girder model.
As shown in Fig. 3, the length of the scaled girder model was 4 m, the width was 0.3 m, and the molded depth was 0.15 m. The model was divided into 10 cabins and the length of each cabin was 0.4 m. The thickness of all plates was 1 mm. To ensure the model draft was equivalent to that of the real ship,iron blocks of different weights were welded to the transverse bulkheads, except for the bow and stern bulkheads, as shown in Figs. 3 and 4. After adding the counterweight, the mass of the girder was 71.52 kg, the total counterweight was 42 kg.The model material was mild steel with a yield strength of 250 MPa and an elastic modulus of 2.1×10⁵MPa.The natural frequency of the hull girder was measured using experimental modal analysis (EMA) based on mechanical admittance[19].The first-order and second-order wet modal frequencies of the girder model were 22.2 Hz and 61.9 Hz, respectively.
2.2. Test set-up and test cases
To study the dynamic response of the hull girder model subjected to a near field UNDEX,8 strain gauges and 3 accelerometers were set up on the hull:strain measuring points S1-S3 were placed side-by-side in the vertical direction along the midship; strain measuring points S4-S8 and accelerometers A1-A3 were placed in the longitudinal direction along the stringer deck.The arrangement of measuring points is shown in Fig. 3.
The UNDEX tests were carried out in a water tank.The test setup is illustrated in Fig.5.The hull girder model floated freely on the water surface with a draft of approximately 0.08 m. The actual water depth was 3.0 m. The TNT charge was arranged below the hull girder with either a 90°or 45°attack angle relative to the bottom center of the girder, as shown in Fig. 3. Pressure sensor P1(type PCB138A50) was placed in the near field to obtain the shockwave pressure of the UNDEX and the bubble pulsation period.Details of each test case are listed in Table 1. Parameters W, R, θ,rmax, and fbdenote the mass of TNT charge, stand-off distance,attack angle, maximum bubble radius, and first pulsation frequency, respectively. Values of rmaxand fbwere obtained from the literature [23,24]. The ratio of stand-off distance to maximum bubble radius is λ=R/rmax.By varying the mass of TNT and standoff distance,λ was varied between 0.7 and 4.

Table 1 Test cases.

Fig. 4. Tested hull girder models.
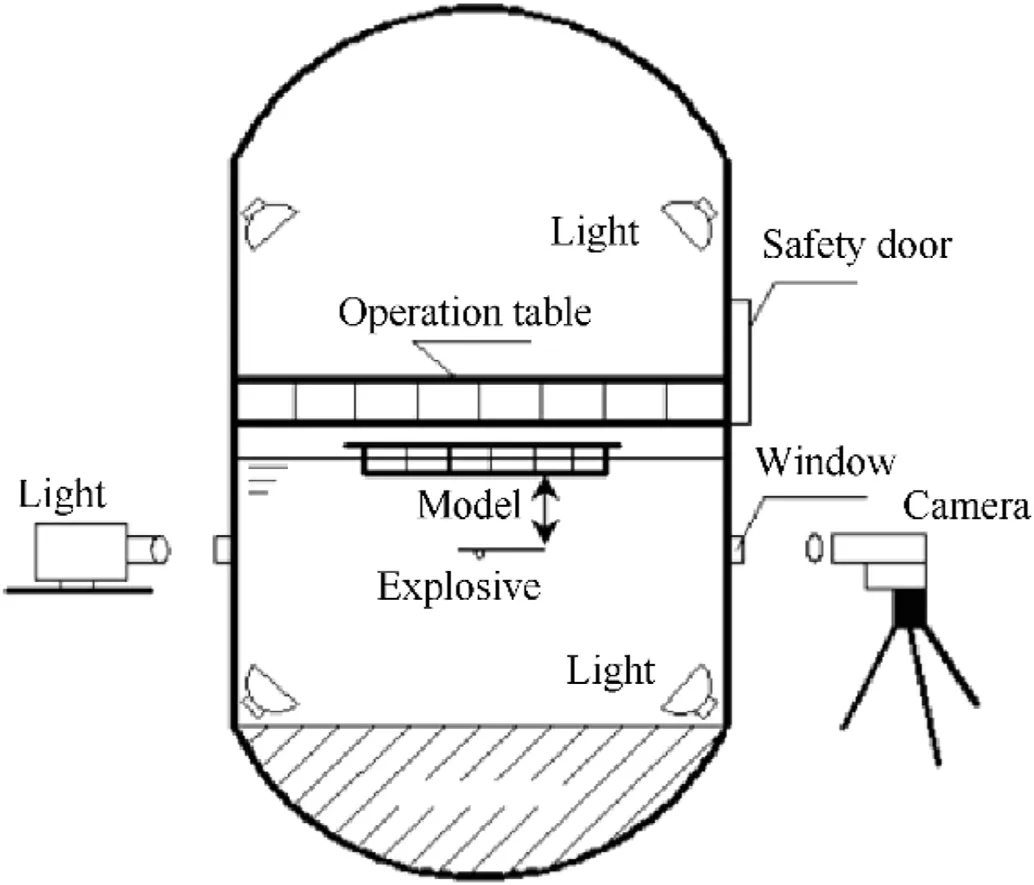
Fig. 5. Schematic diagram of underwater explosion (UNDEX) test set-up.
In all tests, movement of the hull girder was recorded using a FASTCAM Ultima APXI2 high-speed camera equipped with an image intensifier tube at a rate of 250 frames/s.
3. Results
3.1. Dynamic response of hull girder
The main observations were as follows: in all test cases, the girder model moved up and down in rigid-body motion with expansion and contraction of the explosion bubble, which caused hogging and sagging modes of elastic deformation.A smaller standoff distance or larger charge mass increased the deflection and deformation of the girder.The overall deformation of the girder was more obvious when the explosive was detonated directly below the midspan of the girder compared to detonation beside the bilge or other locations.When λ was close to 1,the girder underwent plastic sagging deformation and a plastic hinge formed at the midspan.Case 6 was selected as an example and a more detailed analysis of the girder movement was carried out.
As shown in Fig. 6, the girder moves with the expansion and contraction of the bubble, first hogging followed by sagging deformation.After detonation(0 ms),the shockwave propagates in a relatively short period of time and the bubble begins to rapidly expand, driving after flow and acting on the girder to produce hogging deformation. At 12 ms, a maximum hogging deformation of 23 mm(relative to the static equilibrium state)is reached at the midspan of the girder.As the bubble expands further due to inertia,pressure in the surrounding flow field regions gradually decreases and is lower than the atmospheric pressure. The pressure difference between the interior and the exterior of the flow field decreases the amount of hogging deformation and the girder tends toward the neutral position. At 28 ms, the bubble expands to its maximum radius and the girder returns to its neutral position,then falls into sagging deformation. Subsequently, the bubble begins to rapidly contract and the after flow further accelerates the sagging deformation of the girder. At 48 ms, maximum sagging of approximately 69 mm occurs at the midspan of girder.At this time,the pressure in the flow field is greater than the external pressure.At 52 ms,the bubble collapses and a jet formed,resulting in slight hogging of the girder;however, the jet is not powerful enough for complete transformation from plastic sagging to hogging. Finally,permanent sagging damage occurs and a fixed plastic hinge forms at the midspan of the girder.
To avoid the influence of bending deformation of the hull girder,the position of the stationary point of the girder (located at about one-quarter span from the free end of the girder)is analyzed using high-speed photography. The rigid-body motion of the hull girder is characterized by the change in position of the stationary point.Considering test cases 2 and 7,the rigid-body reciprocating motion of the stationary point occurs at a maximum displacement of about 10 mm during the first response cycle of 120 ms.The displacement of the rigid body is determined by the explosion intensity. When the stand-off distance is reduced from 0.85 m to 0.2 m, the maximum rigid-body displacement increases from 10 mm to 17 mm, as shown in Fig. 7.
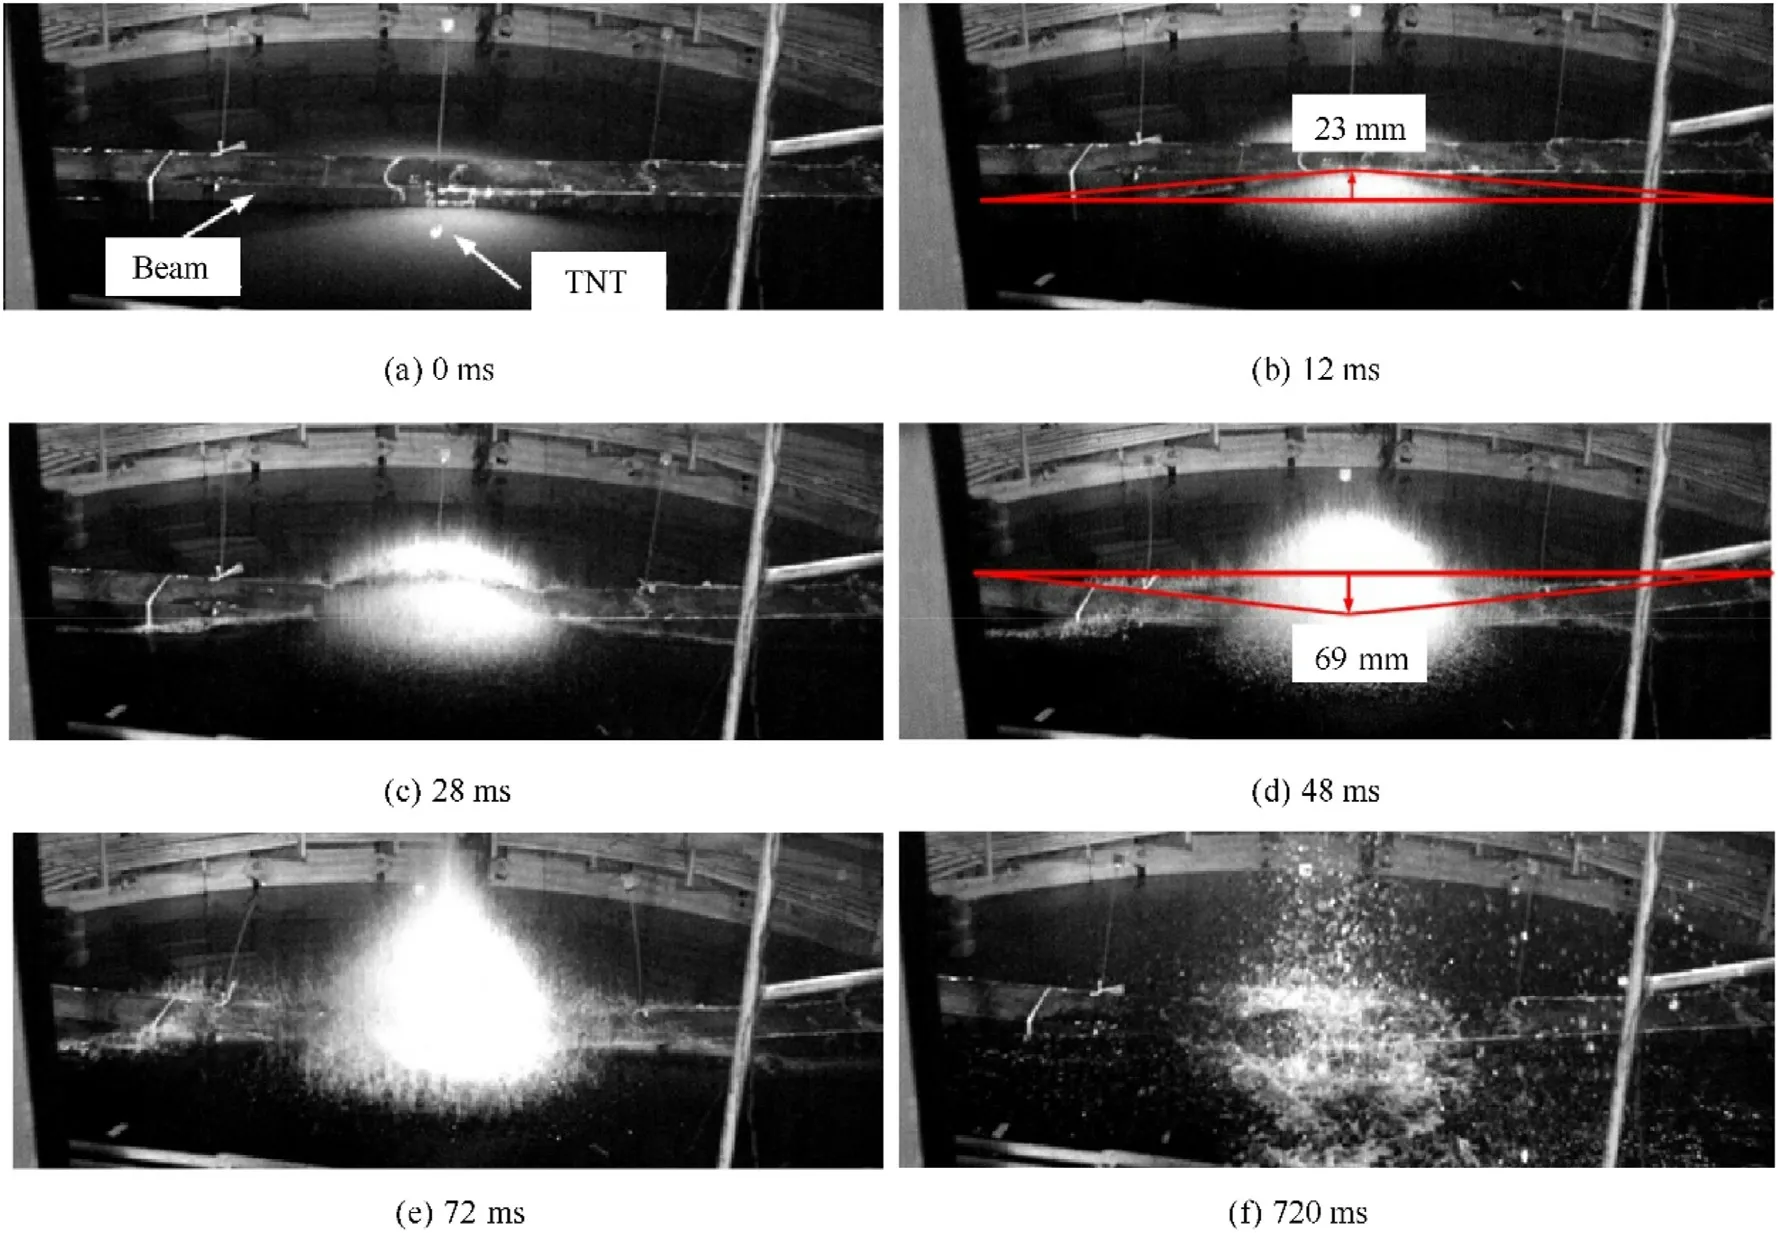
Fig. 6. Dynamic response of girder for case 6 (W = 6 g, R = 0.3 m, and λ = 1.06).

Fig. 7. Rigid-body displacement curves for test cases 2 and 7.
In all other test cases,the hull girder follows a similar movement pattern,which is controlled by the combination of after flow caused by bubble pulsation and the difference between the internal and external pressure of the fluid.The response process of a hull girder subjected to near-field explosion has been previously analyzed using both numerical and theoretical methods [14,15]. When an underwater explosion bubble pulsates in the near field below a rigid boundary, a concave distribution of low-pressure area will form in the flow field between the rigid boundary and the bubble and the low-pressure range will vary as the bubble expands and contracts.When λ is close to 1,the low-pressure range is maximum.The hull girder is more likely to be damaged by sagging plastic deformation under the combined action of external atmospheric pressure and the low-pressure region in the flow field around the girder.
3.2. Girder deformation
The final deformation of the hull girder in each case is as follows: In cases 1-4, the hull girder does not undergo any obvious plastic deformation, including overall and local deformation; In case 5, the girder exhibits no obvious overall deformation;however,slight buckling of the plate panel occurs in the middle of the deck; In cases 6-8, the girder sags and a fixed plastic hinge forms at the midspan of the hull girder, with a maximum sagging deformation of 138 mm, 118 mm, and 18 mm, respectively; In addition, the bottom of the middle cabin shows evidence of deformation in the form of a recess, the upper deck and the side shell at the midspan exhibit buckling distortion; Local cracks of different length appear at the connection between the upper deck and the side shell, indicating obvious stress concentrations at the connection; Structural failure is most likely to occur from the side roof, which leads to overall instability of the structure. The final damage states of each model are illustrated in Fig. 8-10.
Fig.11 shows the cross section of the girder midspan in case 7.When the girder is subjected to an explosion load,various degrees of concave deformation occur in the side plates, bilge strakes, and bottom plate,and an obvious outward bulge can be observed in the upper deck.A 3D laser scanner(VTOP7870H)was used to scan and model the middle section of the girder.Deformation characteristics of the girder outer plates were extracted,as shown in Fig.12.In case 7, the bottom plate undergoes large inner concave deformation,with a maximum deformation of about -27.5 mm. Inner concave deformation of the bilge strakes and side plates caused by compatible deformation is about -10.5 mm and -7.9 mm,respectively.The overall sagging deformation leads to instability of the deck plate and obvious buckling failure of the structure,with a maximum deformation of about 59.9 mm.The final deformation of the girder midspan structure is shown in Fig.13.
Table 2 lists the statistical analysis results of the girder response in all test cases, where L and fBdenote the length and first-order wet frequency of the girder, respectively, and wmaxdenotes the final vertical plastic deformation of the girder.When 2 <λ <4,the value of fb/fBis close to 1 and 2rmax/L is approximately 0.14, indicating a whipping response with no obvious plastic deformation.When 0.7 <λ <2,the response changes from whipping to sagging,resulting in buckling of the side shell and grillage and plastic deformation of the bottom plate. When λ = 1, wmaxreaches the maximum value.When λ=1 and the charge mass changes from 6 g to 25 g and fb/fBvaries from 0.89 to 0.56,the overall vertical plastic deformation of the girder decreases;however,the amount of local plastic deformation of the bottom plate increases, with serious cracking of the stringer deck.Thus,when R/rmaxis close to 1 and the bubble pulsation frequency is close to the first-order wet frequency of the girder, the explosion bubble will cause significant sagging damage of the hull. When the bubble pulsation frequency differs greatly from the first-order wet frequency of the girder,even when the charge mass is large, the overall deformation to the girder caused by the UNDEX is reduced and the damage is localized to the bottom of the hull girder.
4. Data analysis
4.1. Analysis of explosion load
Underwater explosion loads in the flow field were measured with pressure sensor P1 in all test cases. Fig. 14 shows a typical pressure history curve of the flow field at P1 in case 2.The distance between the sensor and the explosive is 1 m.The pressure at P1 in the flow field has a cut-off value with an obvious negative pressure phase due to the presence of the free surface.The measuring point was in the nonlinear reflection region and affected by the pressure reflection at the boundary of the water tank. Without considering pressure reflected off the boundary, there are three obvious peaks in the pressure history curve. The first peak (7.158 MPa) is the overpressure of the initial shock wave and the second and third peaks correspond to the first and second pulsation of the bubble,with values of 1.212 MPa and 0.220 MPa,which are 16.9%and 3.1%of the first peak, respectively.
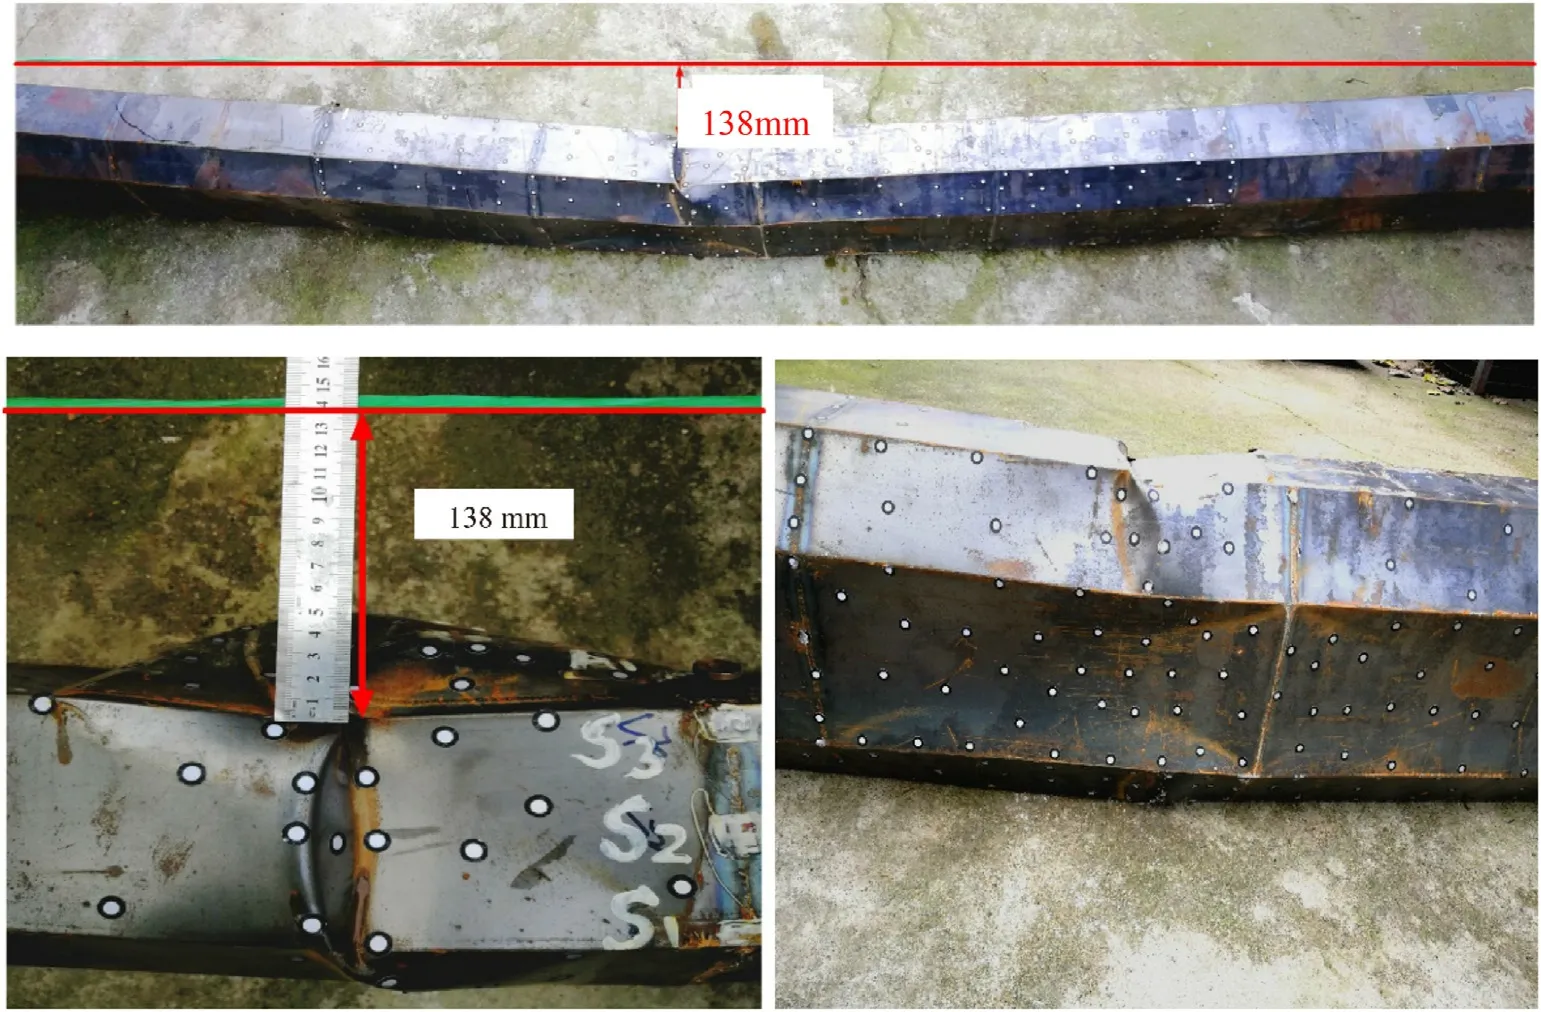
Fig. 8. Hull girder model with sagging damage (case 6).
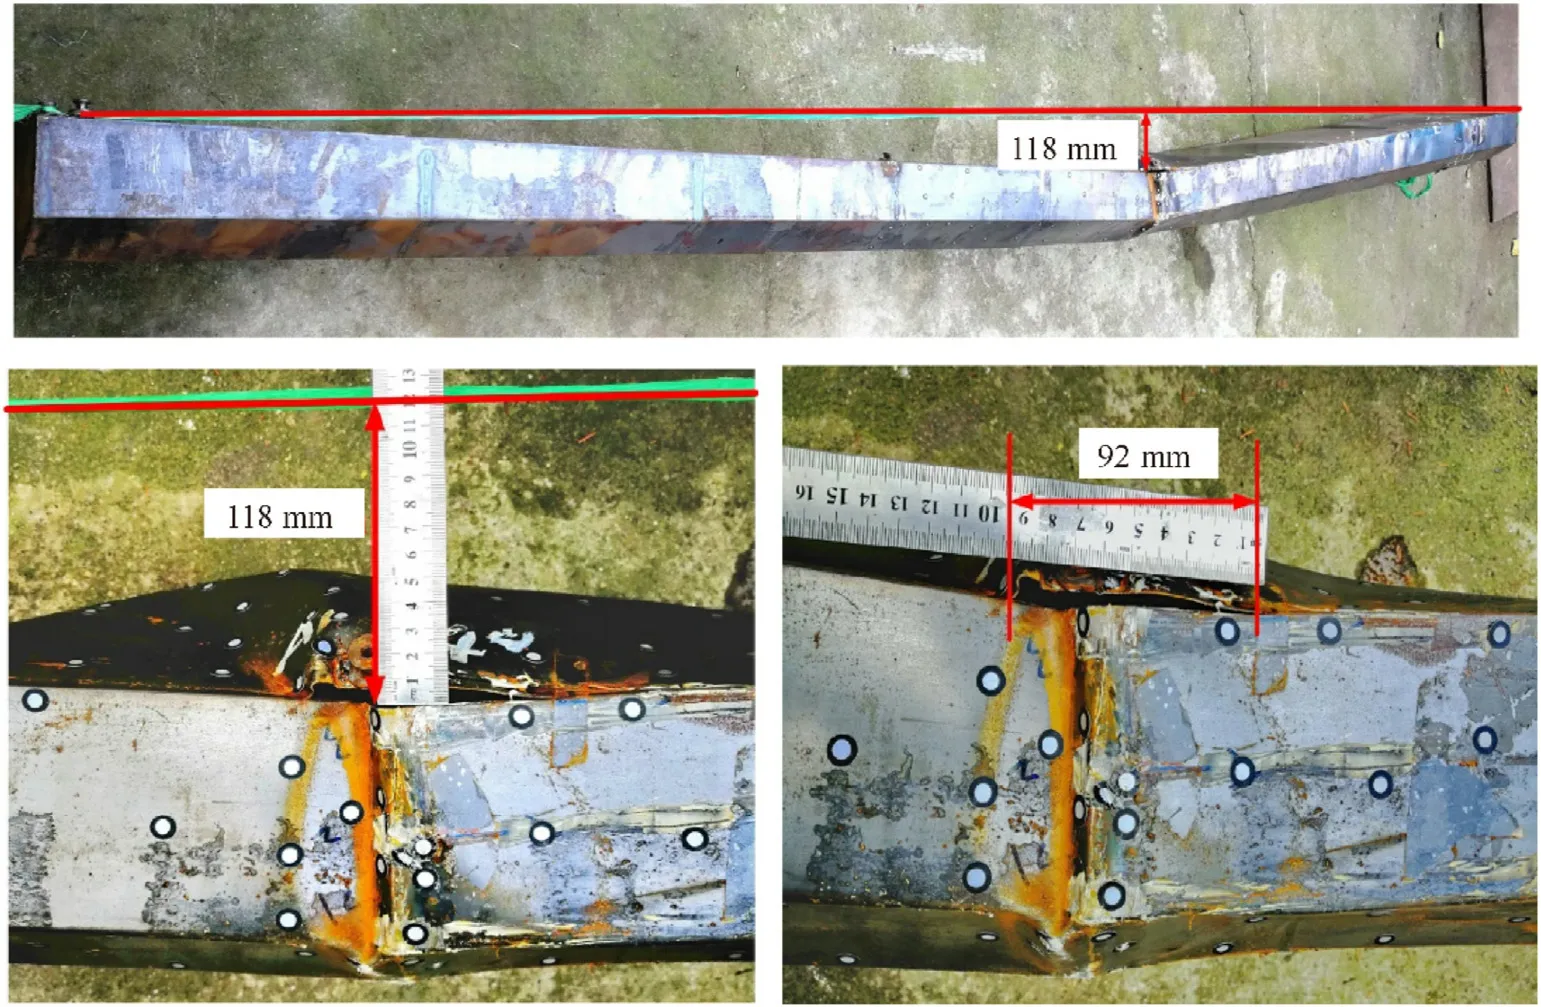
Fig. 9. Hull girder model with sagging damage (case 7).
In all test cases, the TNT charge was located just beneath the girder. When detonation occurs, the structural boundary and free surface will affect the bubble pulsation. During tests, the pressure sensor recorded the period of bubble pulsation.Taking parameter λ as the variable, we studied the effect of λ on the period of first bubble pulsation. Herein, we discuss the effect of the free surface and the structural boundary on the bubble pulsation in the near field. The results are presented in Table 3.
When λ is close to 1,the bottom of the girder and the free surface have an obvious effect on the bubble pulsation. The test values of the first pulsation period are approximately 10% lower than empirical values previously reported in the literature [23,24]. The non-spherical bubble expands and contracts. When λ >2, the boundaries will have less influence on bubble pulsation, and the difference between the experimental value and the empirical value is less than 5%.Under this condition,the bubble can be considered to behave like a sphere. This rule can be used as a criterion for applying the theoretical spherical bubble model.

Fig.10. Hull girder model with sagging damage (case 8).
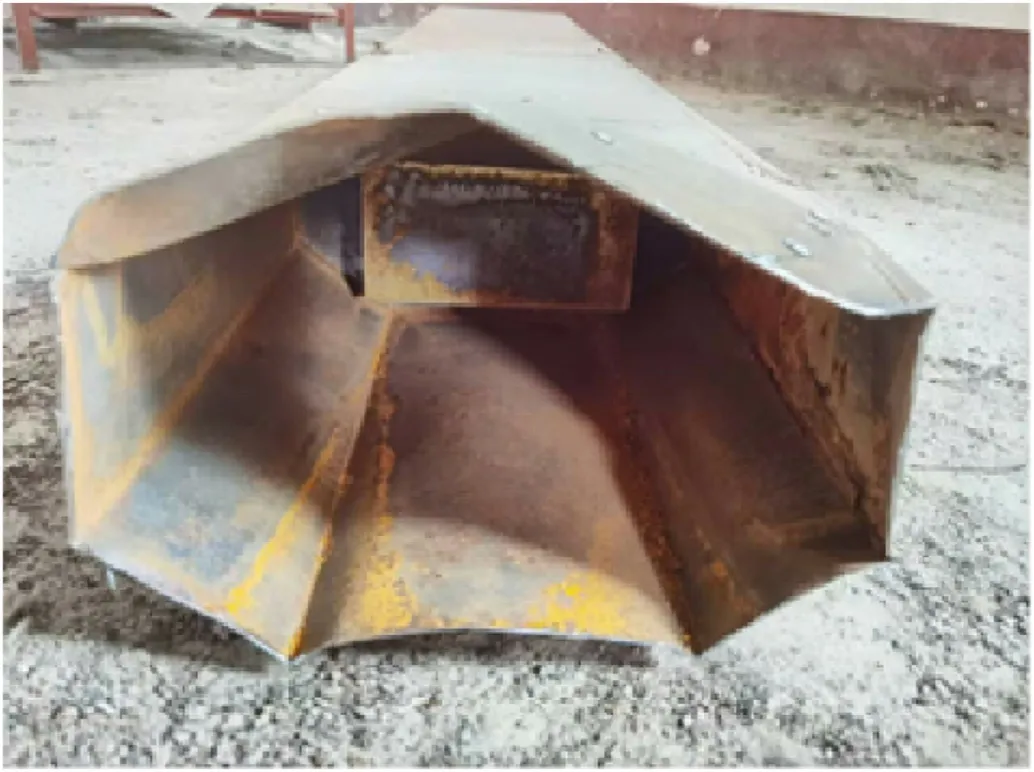
Fig.11. Trapezoidal cross section of hull girder at midspan (case 7).
4.2. Strain analysis
4.2.1. General response process
Strain responses at measuring points S1-S8 were analyzed in each test case.The results for case 2 are shown in Fig.15.All strain data were filtered using a low-pass filter according to the same rules. The cut-off frequency of the filter was 100 Hz. At all measuring points,the strain varied periodically with the expansion and contraction of the bubble. Response frequencies of all measuring points were close to the first-order wet frequency of the girder, indicating that movement of girder is dominated by the overall low-order harmonic motion.Peak strain values were below 2000 με.
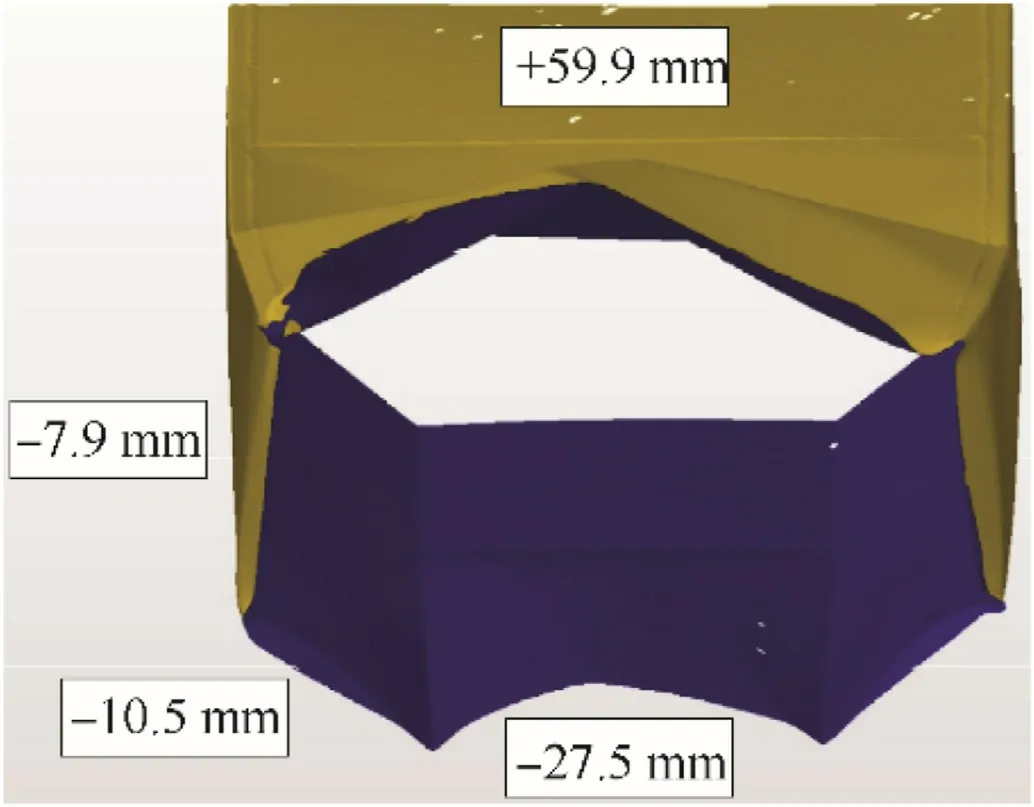
Fig. 12. Three-dimensional scan of girder midspan structure (case7; positive values represent outer convex deformation and negative values represent inner concave deformation).

Fig.13. Diagram of girder deflection at midspan.
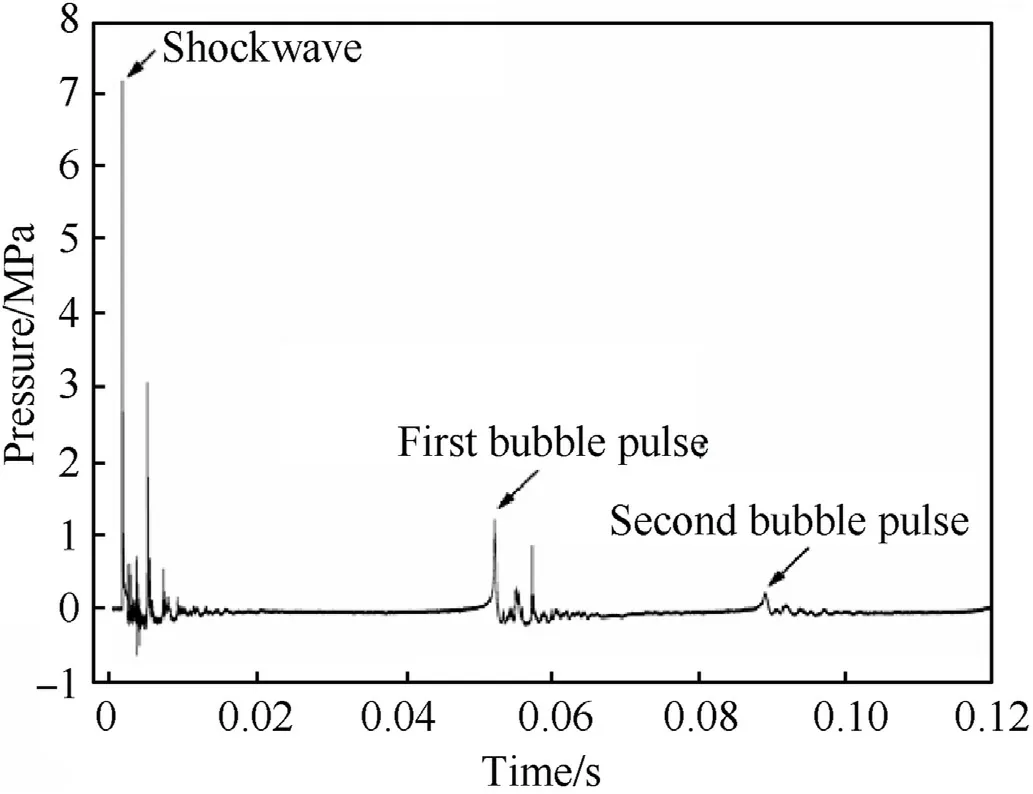
Fig.14. Pressure history at measuring point P1 in the flow field (case 2).

Fig.15. Strain history at measuring points S1-S8 in case 2 (charge mass of 6 g positioned 0.85 m below the midpoint of the girder).

Fig.16. Strain histories at measuring points S4 and S5 (cases 6-8).
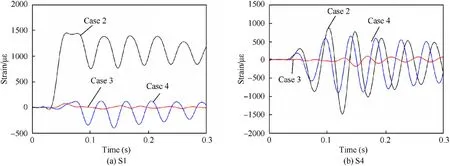
Fig.17. Strain history curves at measuring points S1 and S4 in cases 2-4.
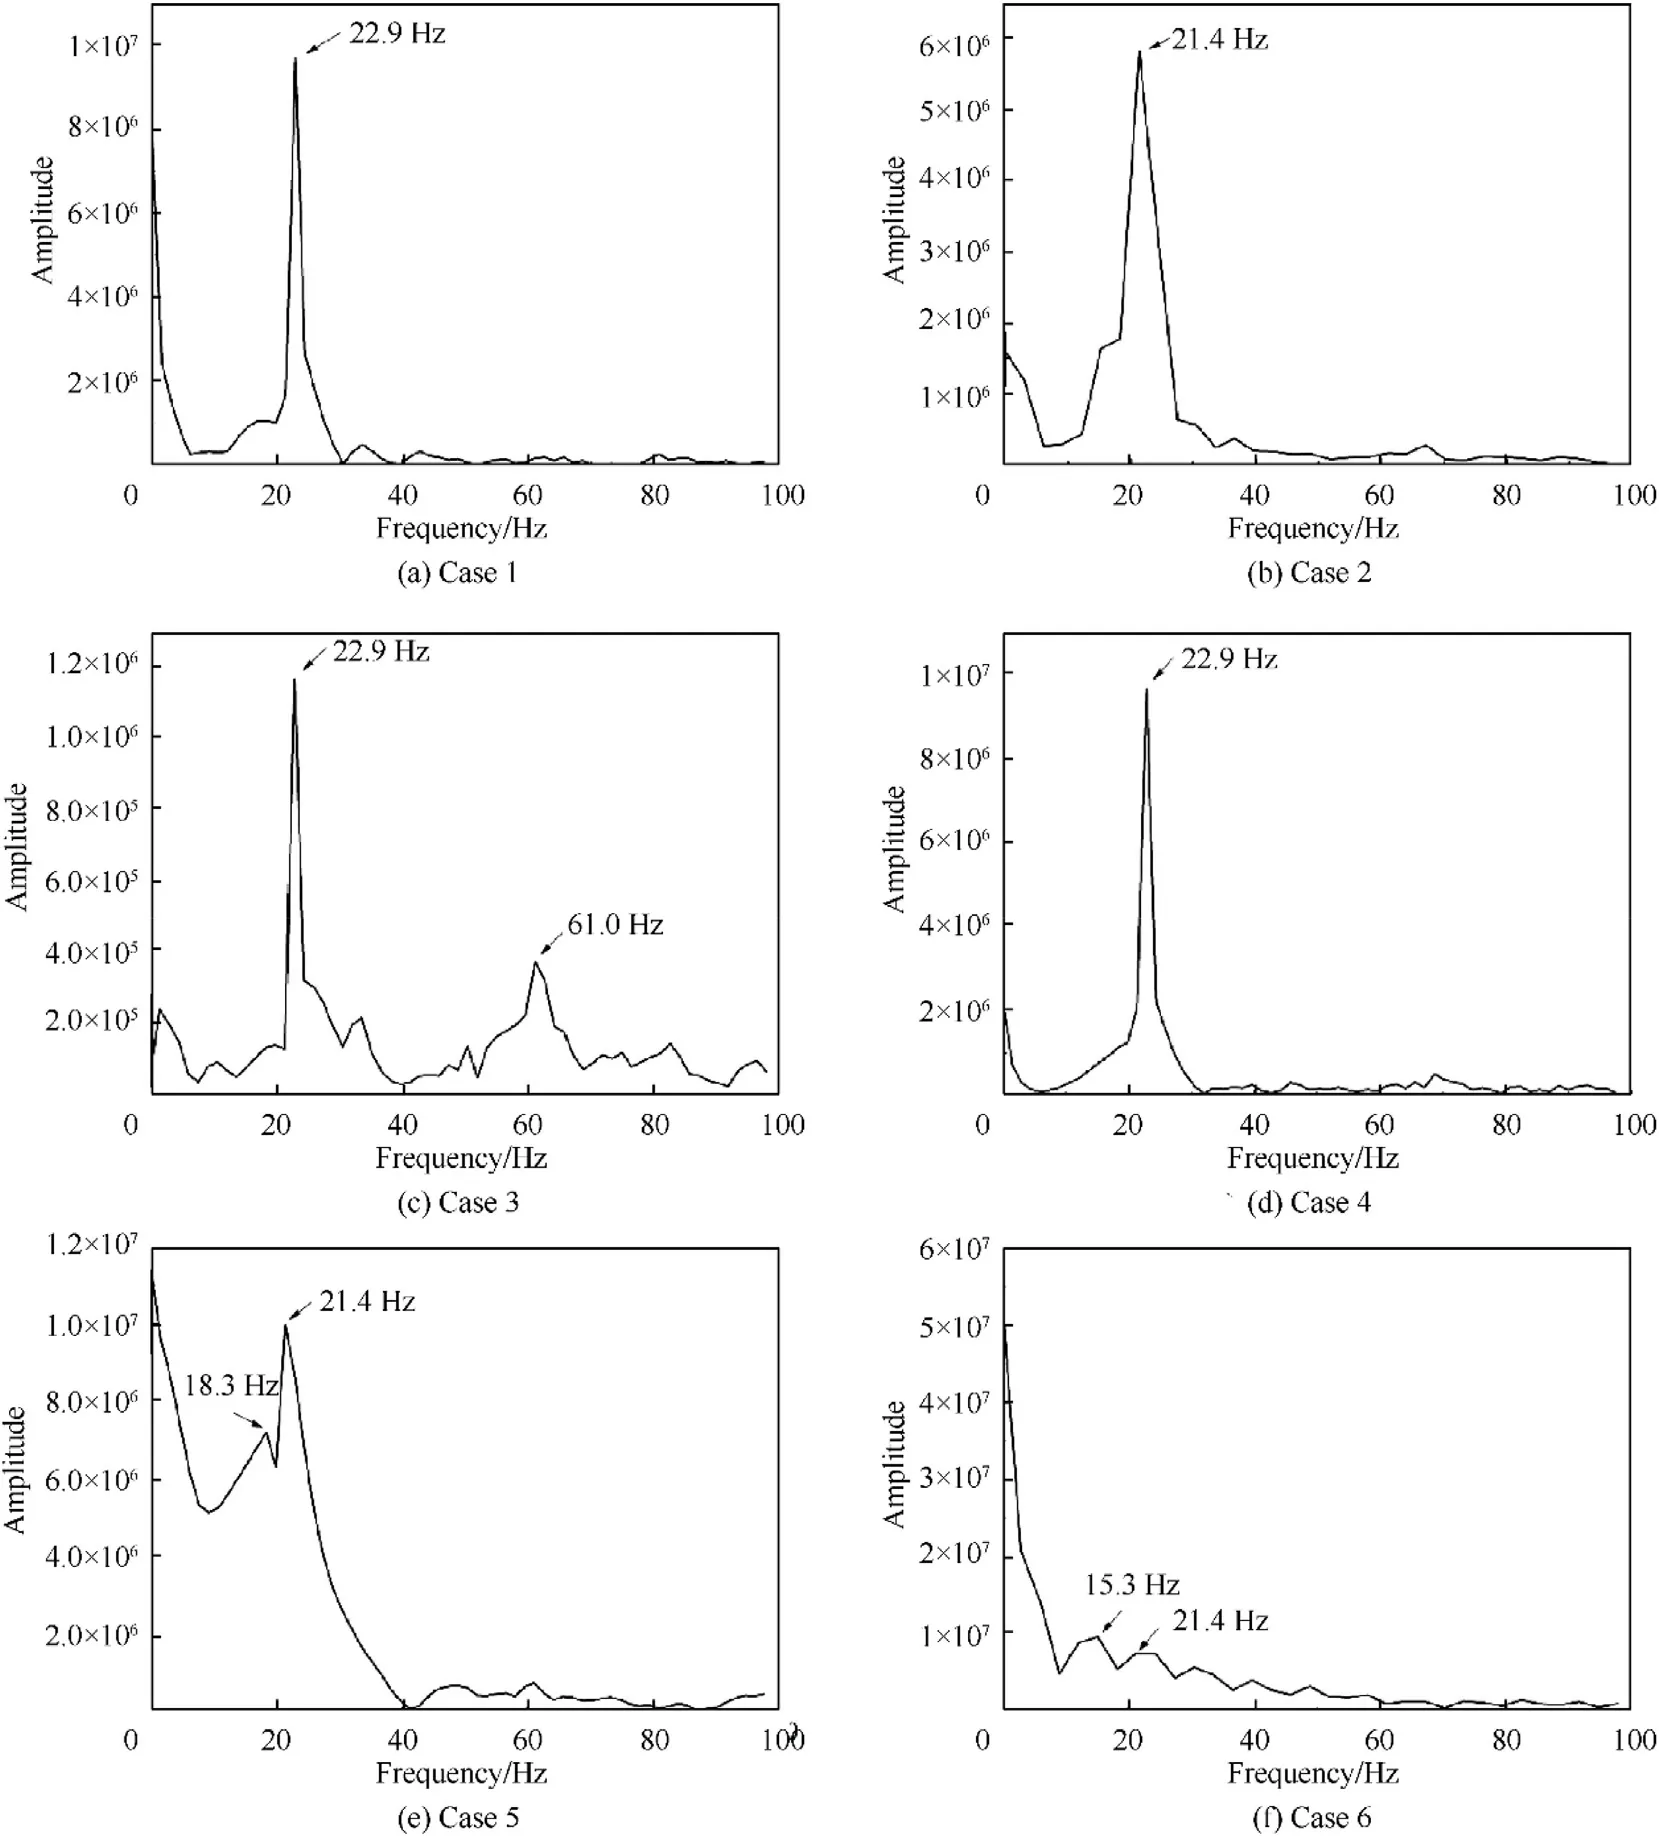
Fig.18. Strain frequency response at measuring point S4 for cases 1-6.
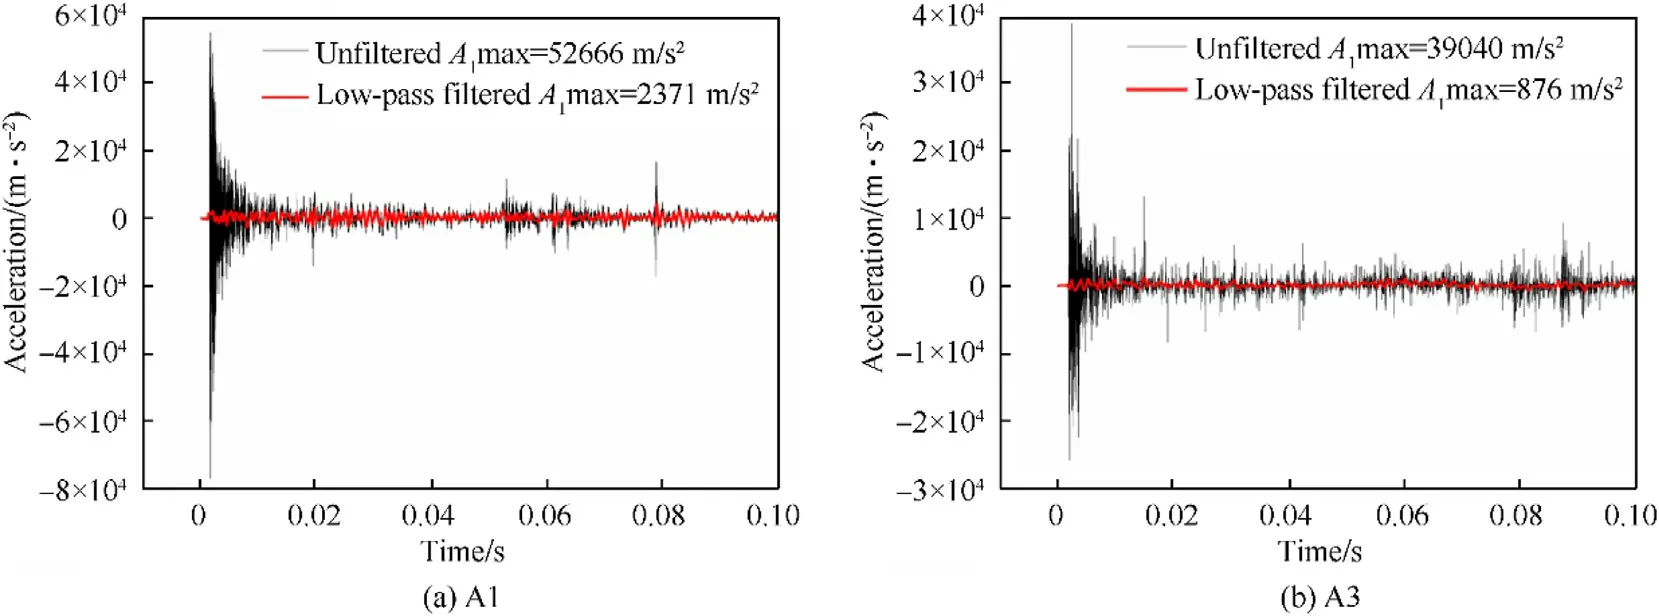
Fig.19. Acceleration history of accelerometers A1 and A3 in case 2.
In Fig.15(a),the response at S1 is opposite to those at S2 and S3,which were located on each side of the neutral axis of the transverse section of the midship. The maximum residual strain at S1,which was located near the bilge,were approximately 1000 με;S2 was positioned close to the neutral axis, which exhibited a relatively small elastic response; S3 was located close to the deck stringer, which has a relatively strong structure and therefore,exhibited a small response with a small residual strain of approximately-80 με.
In Fig.15(b),strains distributed along the longitudinal direction of the girder (at points S4-S8) were controlled by a synchronous periodic response.The amplitude of the response was largest at S4,which was located at the midspan of the girder.Towards the end of the girder, the strain amplitude gradually decreased. After stabilization, residual strains at S4 and S5 were -30 με and 300 με,respectively, while the residual strains at S6-S8 were close to 0,indicating that the final damaged regions of the girder are primarily concentrated between S4 and S5.The two ends of the girder were subjected to elastic deformation, as illustrated Figs. 8-10.
4.2.2. Effects of λ on strain
The girder strain process can be divided into three stages:hogging, sagging, and post-stabilization. The response characteristics at S4 and S5 during each stage are presented in Table 4 and Fig. 16. For the same case, the peak strain at S4 and S5 during sagging deformation is generally larger than those during the hogging stage,and the ratio S4/S5 exceeds 2,thus,sagging damage can be clearly observed. As the bubbles expand and contract, the girder first changes from hogging to sagging; however, the jet created when the bubble collapse drives the girder back into hogging deformation again,partially counteracting the sagging caused by bubble pulsation. When λ ≥1, the strain peak increases nonlinearly as λ decreases.When λ=1(cases 6 and 8),the first hogging deformation peaks of the girder are equivalent in the shock wave and bubble expansion stages. However, during the bubble contraction stage, sagging deformation rapidly occurs at the midspan at S4, and a larger charge mass will result in more serious sagging damage. When λ = 0.70 (case 7), the bubble touches the bottom of the girder during expansion, and does not fully expand into a sphere. The sagging strain at S4 is smaller in case 7 than in cases 6 and 8. However, the residual strain at S4 is maximum(17,458 με)due to the jet impact as the bubble collapses.It is worth noting that the strain values of all measuring points not only reflect the overall deformation of the girder, but also the local deformation, as shown in Figs. 8-10.
4.2.3. Effect of detonation position
In addition to parameter λ,the detonation position will have an important influence on the dynamic response of the hull girder,even with the same explosive mass and stand-off distance. In this section,we focus on the effect of detonation position on the girder response,taking test cases 2-4 as examples.In all three cases,the charge mass is 6 g and the stand-off distance is 0.85 m. The explosive is detonated below the midspan in case 2, under the quarterspan in case 3,and beside the bilge with a 45°attack angle in case 4.Table 5 presents the peak strains at S1,S3,S4,S6,and S8 during three stages: hogging, sagging, and stabilization. Fig. 17 shows the strain histories at S1 and S4.

Table 2 Test parameters and girder response.

Table 3 Effect of R/rmax on period of bubble oscillation.

Table 4 Peak value of strain during different dynamic response phases in each test case.

Table 5 Comparison of peak strains of different phases at typical measuring points in test cases 2-4.
Comparing the peak strains at the measuring points,in general,case 2 > case 4 > case 3. The strain value decreases as the detonation position moves further away. The bow and stern of the girder are subjected to elastic deformation.Point S4 in case 2 and S6 in case 3 are a similar distance from the detonation position;however, the strain is 3-5 times higher at S4. Compared with points S4-S8, which were arranged longitudinally along the deck,the peak strains at S1-S3, which were arranged on the side shell,are larger, and the structure yields and buckles more easily under the explosion load,especially at S1,which is located on the bilge of the hull.At the same explosion intensity,detonation directly below the midspan produces a more obvious whipping response compared with other detonation positions. Case 4 presents the minimum distance between the explosive and the hull structure;however, the corresponding response amplitude was not maximum. Detonation directly below the midspan of the girder produces the most overall damage.
4.3. Frequency response
To study the frequency response characteristics of the girder,the strain at measuring point S4 in cases 1-6 was considered. The effects of stand-off distance and detonation position on the frequency response are discussed.
As shown in Fig.18,in cases 1-4,the overall motion of the hull girder is elastic deformation due to a relatively large stand-off distance. Resonance occurs between the girder and the bubble since the first bubble pulsation frequency is close to the first-order wet frequency of the hull girder.The girder response is dominated by the first-order modal response and the peak frequency is 22 Hz.In case 3,two peaks occur in the frequency response curve of S4,at 22.9 Hz and 61.0 Hz, corresponding to the first-order and secondorder wet frequency of the hull girder, respectively. The girder undergoes both first-order and second-order coupled motion. In cases 5 and 6, the girder structure yields as the stand-off distance decreases and a plastic hinge forms at the midspan, which decreases the first-order response frequency.The resonant peak in the frequency response gradually moves to the lower frequency region.
4.4. Acceleration response
In all cases, the acceleration responses at the three measuring points on the hull girder deck were severe, and peak values occurred during the initial shock wave and bubble collapse phase.Fig.19 shows the acceleration histories of accelerometers A1 and A3 in case 2.The peak acceleration reaches 4000-5000 g in the shock wave phase, indicating an intense response; whereas, the peak acceleration after bubble collapse is less than the 20%of the peak of the shock wave phase. After low-pass filtering of the original data using a cut-off frequency of 2000 Hz, the amplitude of the acceleration curve significantly decreased.The filtered acceleration peak was less than 5% of the original value in the shock wave phase,approximately 20% of the value in the bubble collapse phase. The results indicate that the impulse response induced by the shock wave is mainly a high-frequency response,whereas bubble collapse produces a significant, relatively low-frequency response.
To further study the frequency response characteristics of the hull girder, an spectrum analysis of the acceleration signal was performed. Fig. 20(a) and (b) shows the acceleration and velocity shock spectra for accelerometer A3. The positive and negative curves correspond to the upward and downward movement of thegirder. The spectral acceleration curves show that the acceleration increases rapidly in the range of 1-22 Hz and the peak (approximately 1000 m/s2)appears at 22 Hz,which corresponds to the firstorder wet frequency of the girder. The spectral acceleration increases steadily with increasing frequency in the range 40-5000 Hz, and the peak is approximately 7000 m/s2. Above 5000 Hz, the spectral acceleration drops slightly and stabilizes at approximately 2700 m/s2. The velocity curve shows that the maximum positive spectral velocity is 7 m/s at 22 Hz. As the frequency increases, the spectral velocity curve follows a downward trend.Above 100 Hz,the spectral velocity is less than 1 m/s,which indicates that high-frequency responses contribute very little to the overall velocity and displacement of the girder.
High-intensity explosions may distort the accelerometer data,therefore, the test cases with a lower explosion intensity (cases 1-5) were selected for analyzing the response spectrum characteristics of A3, as shown in Fig. 21. All spectral acceleration peaks are above 6800 m/s2. The peak acceleration is highest in case 4(close to 14,000 m/s2), owing to the short distance between point A3 and the explosive.Except for case 3,all peak spectral velocities at point A3 were above 3.5 m/s since the detonation occurs just below the midspan of the girder resulting in overall deformation of the girder.Moreover,the detonation position was relatively close to point A3 in all cases, therefore, the response velocity and displacement were both higher at that point. However, in case 3,detonation occurred far away from point A3, and was close to the stagnation point of the girder motion, thus, the peak spectral velocity was low, approximately 0.8 m/s.
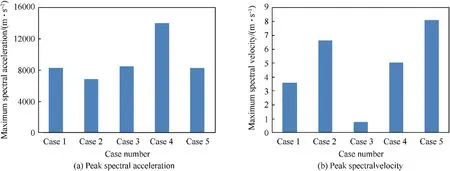
Fig. 21. Comparison of spectral acceleration and velocity of sensor A3 in cases 1-5.
5. Discussion and conclusions
Based on our analysis of the dynamic response of a hull girder model subjected to a near field UNDEX,it can be concluded that the low-pressure regions of the flow field at the bottom of the girder and coupled resonance are the main causes of sagging damage, as previously demonstrated[13,14].The damage mechanisms are also relevant to real ships.Warships, such as the destroyer, frigate,and so on, often have a slender shape to meet mobility requirements.Therefore, the first-order wet frequency of the warship will be around 1-3 Hz,which is close to the pulsation frequency of bubbles formed by the explosion of conventional weapons in water. This creates the basic conditions for coupling between the explosion bubble and the warship. The weight distribution of a warship can be typically characterized by a large weight in the middle and smaller weights at the ends, which exacerbates sagging bending during bubble pulsation. In addition, when the explosion of an underwater weapon satisfies R/rmax<2 and 2rmax/L is close to 0.2,warships are also likely to suffer sagging damage similar to the hull girder model.Numerical simulations were previously performed to study the overall deformation characteristics of certain types of warships subjected to underwater explosion bubbles and the sagging damage mode was confirmed [9,19]. In both previous studies, the explosion conditions were within the range of conditions associated with sagging damage of the girder in this paper:R/rmax<2 and 2rmax/L of approximately 0.2.
This paper presented an experimental study of the overall sagging and hogging damage modes of a hull girder. The effects of certain parameters on the dynamic response of the girder were discussed. The main conclusions can be summarized as follows:
(1) When a near field UNDEX occurs directly below the midspan of a hull girder, the girder will undergo a hogging and sagging deformation with a rigid-body motion.As the explosion bubble rapidly contracts, sagging damage of the girder will occur. The main causes of sagging damage to the girder are vertical bending due to low-pressure region in the flow field at the bottom of the girder that forms during bubble pulsation and resonant coupling between the girder and the bubble.
(2) First-order motion of the slender hull girder is stimulated when the first-order wet frequency of the girder is close to that of the explosion bubble pulsation.When 2 ≤λ ≤4,the whipping response of the girder occurs;however,no obvious plastic damage is observed. When 1 ≤λ<2, the bubble pulsation causes significant sagging deformation of the girder. As λ decreases, the amount of sagging deformation increases.As λ decreases further(0.7 ≤λ<1),the jet impact force produced by the collapsing bubble may reduce the sagging deformation. With increasing explosion intensity,the damage mode will likely switch from sagging to hogging,with obvious buckling deformation and cracking.
(3) The initial shock wave predominantly produces a highfrequency acceleration response and contributes very little to the overall velocity and displacement of the girder.Although the peak value of acceleration caused by the bubble pulsation is less than 10% of the acceleration caused by the shock wave, the low-frequency response induced by bubble pulsation significantly contributes to the velocity and displacement of the girder.
(4) By changing the detonation position, the main response mode of the girder can be shifted from a first-order response to a multi-order superposed response. When the girder structure is plastically deformed or yields under loading,the value of first-order response frequency decreases.
(5) According to our analysis of structural deformation, strain,and shock environment under the same explosion intensity,the most severe damage to the girder will occur when the explosion is just below the midspan,followed by a 45°attack angle, and finally, explosions below the quarterspan cause the least damage.
Declaration of competing interest
The authors declare that they have no known competing financial interests or personal relationships that could have appeared to influence the work reported in this paper.
Acknowledgements
This work was supported by the National Natural Science Foundation of China (Grant No. 51679244). The authors wish to thank the reviewers for their careful, unbiased and constructive suggestions, which led to this revised manuscript.
- Defence Technology的其它文章
- Evaluation method and optimization strategies of resilience for air &space defense system of systems based on kill network theory and improved self-information quantity
- Angular disturbance prediction for countermeasure launcher in active protection system of moving armored vehicle based on an ensemble learning method
- Study on jet formation behavior and optimization of trunconical hypercumulation shaped charge structure
- Trans-scale study on the thermal response and initiation of ternary fluoropolymer-matrix reactive materials under shock loading
- Camouflaged people detection based on a semi-supervised search identification network
- A super resolution target separation and reconstruction approach for single channel sar against deceptive jamming

