A Robust Indoor Localization Algorithm Based on Polynomial Fitting and Gaussian Mixed Model
Long Cheng,Peng Zhao,Dacheng Wei,Yan Wang
Department of Computer and Communication Engineering,Northeastern University,Qinhuangdao 066004,China
Abstract: Wireless sensor network(WSN)positioning has a good effect on indoor positioning,so it has received extensive attention in the field of positioning.Non-line-of sight(NLOS)is a primary challenge in indoor complex environment.In this paper,a robust localization algorithm based on Gaussian mixture model and fitting polynomial is proposed to solve the problem of NLOS error.Firstly,fitting polynomials are used to predict the measured values.The residuals of predicted and measured values are clustered by Gaussian mixture model (GMM).The LOS probability and NLOS probability are calculated according to the clustering centers.The measured values are filtered by Kalman filter (KF),variable parameter unscented Kalman filter(VPUKF)and variable parameter particle filter (VPPF) in turn.The distance value processed by KF and VPUKF and the distance value processed by KF,VPUKF and VPPF are combined according to probability.Finally,the maximum likelihood method is used to calculate the position coordinate estimation.Through simulation comparison,the proposed algorithm has better positioning accuracy than several comparison algorithms in this paper.And it shows strong robustness in strong NLOS environment.
Keywordst: wireless sensor network; indoor localization; NLOS environment; gaussian mixture model(GMM);fitting polynomial
I.INTRODUCTION
Wireless sensor network (WSN) is composed of sensor nodes with limited power.With the rapid development of information technology,WSN is more and more widely used.Node localization technology is an important application of WSN.
Node positioning technology is to obtain measurement data through beacon nodes.These numerical values will be used to estimate the coordinates of moving targets through some algorithm.Common ranging methods include arrival time (TOA) [1],arrival time difference (TDOA) [2],received signal strength(RSS)[3],and arrival angle(AOA)[4].The localization algorithm based on ranging will locate through the distance information.There are also some algorithms based on non-ranging,such as centroid localization algorithm,multi-sequence positioning(MSP),etc.Line of sight (LOS) noise and non-line of sight (NLOS)noise will be produced in the process of WSN positioning.The LOS error is the measurement error when there is no obstacle between the moving target and the beacon node.LOS error can be filtered by extended Kalman filter (EKF) filtering and other filters.Due to the complex propagation environment,signals are often blocked by obstacles during propagation.Obstacles will cause the signal to propagation in the NLOS path.Therefore,there will be NLOS error in the measurement data.NLOS error is the main reason affecting the positioning accuracy of WSN.So,overcoming NLOS noise has become a major challenge in the field of indoor localization research.
Some effective algorithms to reduce NLOS noise are proposed.Polynomial fitting in[5]is a classification method.The data before the current time is fitted into a curve.The curve is used to predict the measured value.The residual will be obtained through the predicted value and the actual measured value.Then,the disparity can be used to determine whether the LOS or the NLOS is,the author filters and combines the classified data,and the result has high precision.Polynomial fitting method can classify the measurement data well and has low complexity.Mixture Gaussian fitting(MGF)in[6]can cluster according to the input residual value to obtain LOS probability and NLOS probability,which can provide a method for the combination of LOS data and NLOS data.At present,some filtering algorithms can also get good results.Particle filter(PF)has a good estimation effect in dealing with nonlinear systems,and its accuracy can approach the optimal estimation.Unscented Kalman filter (UKF)can overcome the problem of high-order nonlinear error introduced by extended Kalman filter.UKF has high calculation accuracy.The filtering part of the proposed algorithm improves both UKF and PF.Finally,it is verified that the proposed algorithm can achieve high positioning accuracy under strong NLOS environment.
In this paper,an algorithm based on polynomial fitting classification filtering and clustering probability combination is proposed,and it combines variable parameter PF and variable parameter UKF.The characteristics of the proposed algorithm are as follows.
1.The proposed algorithm does not discard any measurements,because there is also available information in NLOS measurements.The predicted value is obtained by polynomial fitting curve.The residual error between the predicted value and the actual measured value is used to judge whether the NLOS error of the actual measured value is too large.If the error is too large,it will be corrected through the predicted value.
2.Variable parameter UKF is proposed.In the traditional UKF,the scaling parameterλis fixed.So,when the measurement data with different error degrees pass through the UKF,the filtering effect is very different.UKF is improved in the proposed algorithm.A threshold is set to distinguish the influence of noise on the measurement data.The two types of measured values are filtered with the UKF of different parameterλ.This overcomes the problem that sometimes the filtering result of UKF deviates greatly or the filtering effect is not obvious.
3.The proposed algorithm is an algorithm that processes the LOS measurement and NLOS measurement separately.However,the discrimination algorithm used to distinguish LOS or NLOS is not used in the proposed algorithm.The processing method of serial arrangement of three different filters is adopted.The distance values of different outputs are used as LOS part and NLOS part.This method avoids misjudgment caused by decision algorithm.
The organization of this paper is as follows.Section II discusses the related work.The third part is the establishment of the system model.The proposed algorithm is shown in Section IV.And the fifth and sixth parts are the experiment and final conclusions,respectively.
II.RELATED WORKS
Some classical filters have good results in LOS data processing,but the effect of filtering NLOS measurements is not very good.Then some algorithms and frameworks are proposed.[7] is the improvement of PDA algorithm.PDA adopts the idea of grouping under the framework of EKF.The measurements are grouped before processing.Each set of data is then discriminated and the group with NLOS errors is abandoned.The rest of the groups are assigned various probabilities and correlated with probability data.No statistical knowledge of NLOS errors is assumed,and the effect of PDA is much better than that of EKF alone.MJPDA in[8] is an improvement on JPDA in [9].Compared with traditional JPDA,MJPDA will produce more particles subject to Gaussian distribution before data association and update.MJPDA has good robustness in strong NLOS environment.The accuracy is also improved.In [10],IMM filters LOS noise and NLOS noise with EKF respectively,and then the filter results are interacted through mode probabilities.However,with the aggravation of NLOS error,the robustness and accuracy of IMM are not very good.The robust EKF(REKF)algorithm proposed in [11] replaces EKF in IMM with REKF,which improves the performance of the algorithm.The modified generalized probability data association(MGPDA)in[12]integrates IMM-EKF,hypothesis test and probabilistic data association.First,some NLOS errors are eliminated through IMM-EKF,and then the remaining results are grouped and NLOS judged.Then,the value with NLOS error is processed according to different situations,and finally combined according to the probability.The core of the above algorithms is to improve or combine some traditional filters to reduce NLOS noise.The accuracy and robustness are improved a lot.
UWB signal has strong penetration ability,low energy consumption and high time-domain resolution.So,localization based on UWB technology has attracted extensive attention.Some NLOS recognition and suppression techniques are often used in UWB positioning.A method that can identify different NLOS channels is proposed in paper [13].The appropriate NLOS range will be selected for localization estimation by the identified channel information.At the same time,the Taylor series robust least-square method with equation constraints is proposed to suppress NLOS measurement errors.The method in[13]is a NLOS recognition and mitigation algorithm.It does not rely on a priori NLOS knowledge,has remarkable performance and good robustness.In [14],a positioning framework for channel detection is proposed based on UWB.The system extracts the parameters in UWB measurement data through the extension of high-resolution R-IMAX algorithm.Kim parks algorithm is used to cluster the possible target positions,so as to estimate each target node more robustly.In this algorithm,the existence of multiple clusters is considered,which enhances the robustness of the location framework to outliers.It has good positioning accuracy in LOS,NLOS and mixed scenes.In paper[15],circularly polarized antenna,genetic algorithm,and machine learning method are introduced to construct an indoor positioning service UWB system with adaptive NLOS suppression.The proposed genetic algorithm can effectively optimize the position of anchor in the UWB system to minimize the average root mean square error(RMSE)of each tag position in complex multipath district.The algorithm can effectively alleviate errors caused by multipath and NLOS effects.
In paper [16],the author adds the sparsity of distance measurement deviation to the traditional cost function,obtains the sparsity promoting regularization formula.and develops a general constrained regularization formula by defining the cost function.The algorithm also combines two positive semidefinite programming.A general framework to mitigate NLOS effect is developed.This method does not need to identify LOS and NLOS but uses two regularization optimization formulas to locate.The collaborative localization algorithm in LOS/NLOS hybrid environment in paper[17]makes use of the spatial geometric characteristics of NLOS deviation to optimize the ability to identify LOS channels and positioning accuracy.The algorithm is an iterative positioning algorithm assisted by cooperative LOS recognition.In paper[18],a UWB localization algorithm in NLOS environment based on semidefinite programming is proposed.It does not need to distinguish LOS from NLOS,nor does it need NLOS error information.Without discarding any ranging information,SDP is effectively applied to solve the WSN localization problem in NLOS environment,and the better localization accuracy is achieved.
Paper[19]introduces the popular neural network for indoor positioning and realizes accurate indoor positioning by combining CSI and neural network.FCNN,CNN and GCNN based on CSI are designed.Although the accuracy of these algorithms is improved,the complexity is also increased.In[20],a position estimation unit scheme based on artificial neural network is designed.The training of the system only needs to be carried out under LOS conditions,to facilitate rapid deployment in the new environment.It can identify whether there is NLOS in the time of arrival measurement,so as to eliminate the wrong position estimation and has strong robustness.Compared with other existing positioning systems,this scheme requires less beacon nodes,which improves the efficiency and cost.
III.SYSTEM MODEL
Firstly,M fixed beacon nodes are deployed in the localization area,and their coordinates are represented by (xi,yi),i=1,...,M.At time k,the coordinate of the mobile node is(x(k),y(k)),k=1,...N.The moving target will move in the localization range.During the movement of the moving target,there will be random obstacles between the moving target and the beacon node.So,the measured values between the moving target and the beacon node will be converted between LOS and NLOS.In this paper,TOA measurement method is used to obtain the distance measurement value.The distance measurement value between the moving target and the i-th beacon station at time k can be expressed as follows:
When the moving target and the beacon node are in the LOS environment,there is no NLOS error,that is,nNLOS=0.At this time,the distance measurement value is
if the beacon node and the mobile node are in the NLOS environment,there will be NLOS error.At present,the measured distance is as follows:
where,nLOSis the measurement noise,it follows a Gaussian distribution with a mean of 0 and a standard deviation ofnLOS.The probability density function(PDF)of LOS is
nNLOSis caused by obstacles between mobile nodes and base stations.In this paper,the NLOS error is subject to the Gaussian distribution with the mean value ofµand the standard deviation ofσNLOS,the uniform distribution with the parameters ofuAanduBand the exponential distribution with the parameter ofλrespectively.The probability density functions are as follows:
During the research,we consulted the literature [21].Literature[21]makes a scientific analysis and discussion on NLOS error,which provides support for our research model and makes our research more convincing.
IV.PROPOSED METHOD
4.1 General Concept
According to the flow chart shown in Figure 1,we can see that L measurement data are fitted before formally processing the distance measurement values.Then,when the distance measurement at time k is to be processed,the L data before time k will be fitted first.After obtaining the fitted curve,the distance valuei(k)can be predicted according to the curve.The residualri(k)is obtained by subtractingi(k)andi(k).The residuals of each beacon node are stored.The residual values of each beacon node at the k-moment are used as the input of Gaussian mixture model(GMM).The LOS probability and NLOS probability at the current time can be calculated by clustering the centers of LOS and NLOS residual.In the filtering section,the measurements are processed by the Kalman filter (KF),variable parameter Kalman filter (VPUKF)and variable parameter particle filter (VPPF) in turn.The distance value processed by KF and VPUKF is assumed to be the LOS part,and the distance value processed by KF,VPUKF and VPPF is assumed to be the NLOS part.The proposed algorithm does not use the judgment of LOS and NLOS,but the probability is adopted to combine LOS and NLOS.This can avoid errors caused by misjudgment.The processed value of the LOS part and the NLOS part are combined by LOS probability and NLOS probability.After all the distance measured values are processed as described above,the final position coordinates are obtained by maximum likelihood estimation.
4.2 Obtaining Residuals by Fitting Polynomials
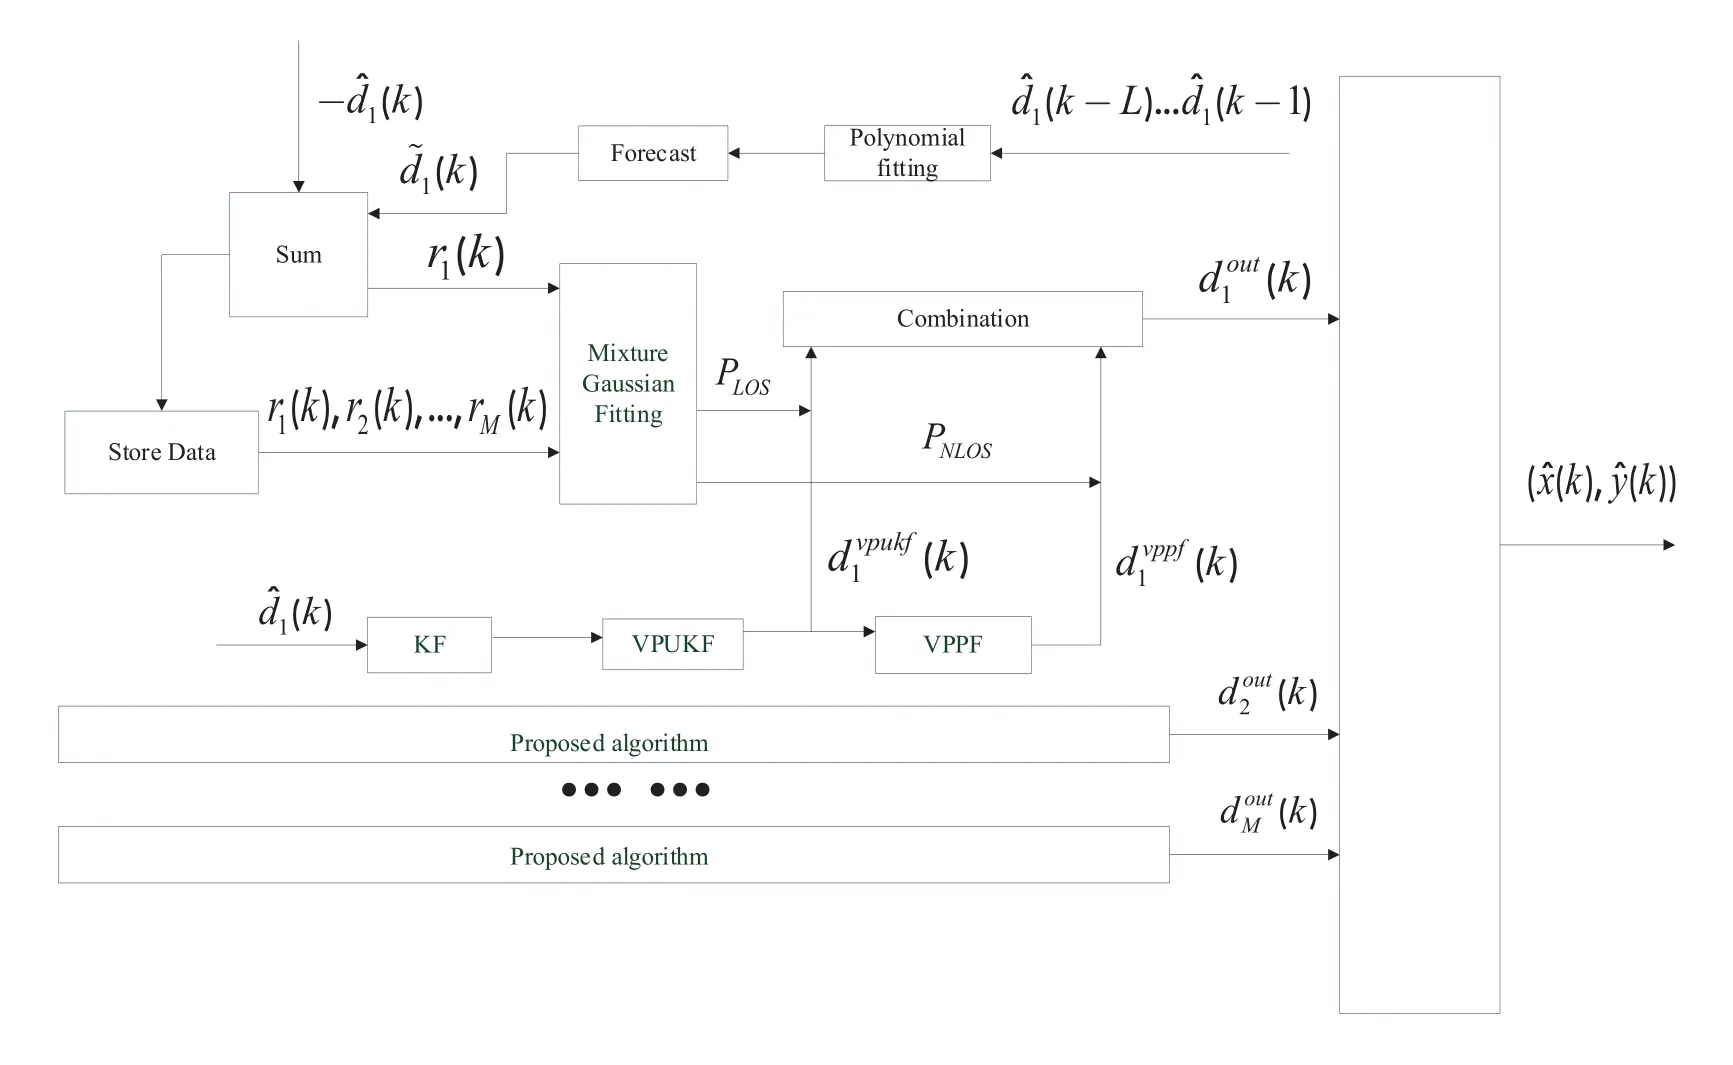
Figure 1.Flow chart of the proposed algorithm.
The so-called curve fitting is to construct a curve by fitting the actual measurements.The curve does not have to go through each measured value point,but just the curve passes through these measured value points and makes it optimal in a sense.First,the measured data is obtained.The secondary polynomial is used to fit measurements from the k-L moment to the k-1 moment to obtain the fitted curve.The distance value at next time is then predicted by the curve.The residual is obtained by subtracting the measured value from the predicted value.
The specific steps of the algorithm are as follows:Step 1: The L measured values before time k .obtained by the nodes are(x),x=k −L...k −1,x is the time step.Based on these measurements,a functionc(x) can be constructed as following n-th fitting polynomial(n ≤L).
where,a0,a1...an−1,anare then+1 coefficients of this polynomial and are unknown.The coefficients are obtained by the least square principle.The specific method is to minimize the sum of squares of the deviationsc(x)−(x)of the above fitting polynomial at each data point,as shown below:
since Φ is a function aboutaj,j=0,1,2...n.To find the minimum value of Φ,we can find the derivative of Φ aboutajand make it zero.The specific process is as follows:
then+1 coefficients can be obtained by solving the Eq.(8).The fitting curve we need can be obtained by substituting them intoc(x),as below:
Step 2:The measured value at time k will be predicted using the fitting curve.The one-step distance prediction value of the i-th beacon node at time k is:
c(k|k −1) refers to the value of k-time curve.The difference between the predicted and measured values is shown below:
In this paper,a method is proposed to correct the measurement value of large error by the residual judgment.The comparison of residuals with thresholds is used to determine whether the corresponding measurement error is too large.If the error is too large,the measurement is corrected by the predicted value.In addition,VPUKF in section 4.4 uses different parameters for different types of measured values.Here,the residuals of the first five times of each time will be averaged.This is the basis for VPUKF classification.
4.3 Mixture Gaussian Fitting(MGF)
4.3.1 Gaussian Mixture Model(GMM)Gaussian mixture model is a widely used clustering algorithm.The clustering methods of GMM and kmeans are similar.But one obvious difference is that the GMM performs soft classification,while the kmeans performs hard classification.GMM will tell us the probability of which set each data belongs to,and k-means will not.The theoretical basis of GMM is the central limit theorem in probability theory.The core step is to project the data in the sample onto several Gaussian models,the probability on each Gaussian model will be obtained respectively.Each Gaussian model is regarded as a class.Then the class with the highest probability is used as the decision result.Each Gaussian model includes three parameters: mean,variance and weight.We approximate the probability density function of NLOS by adjusting these three parameters.In parameter estimation,the commonly used method is the maximum likelihood method.Firstly,the residuals calculated above are used to establish the mixed Gaussian distribution.We get the likelihood function by taking the logarithm of the mixed Gaussian distribution.However,the likelihood function is a nonlinear function.So,it is necessary to use the expectation maximization(EM)method to obtain the estimation of unknown parameters.EM algorithm divides the solution into two steps.The first step is to determine the a posteriori probability according to the parameters.The parameters need to be initialized during the first calculation;The second step is to update the parameters based on the posteriori probability.Repeat these two steps until the fluctuation is small and approximately reaches the extreme value.
4.3.2 Mixture Gaussian Fitting(MGF)
MGF is a NLOS soft recognition method based on GMM.Its input is the residual obtained from the previous fitting polynomial,and its output is the probability of LOS and NLOS.The specific steps are as follows:Step 1: Firstly,the residualsri(k)are taken from the storage module.The current residuals and the residuals before the current moment are used to fit the mixed Gaussian distribution.It is as follows:
α=(α1,α2...,αD) represents the vector of position parameters in Gaussian distribution.The parameter vectorαqof each distribution contains three parameters,namely meanµq,standard deviationσqand probabilityξq.Although the purpose of this algorithm is to classify LOS and NLOS,the proposed uses five Gaussian functions to fit the residuals of beacon nodes.So,the value of D is 5.The first two categories are used to represent the clustering centers of LOS and NLOS respectively.The reason is as follows: when grouped into five categories,more data with large residuals can be regarded as NLOS.The NLOS error of LOS class is also smaller,so the accuracy is higher.Step 2: After fitting the Gaussian mixture distribution,three parameters in each distribution must be calculated.So,it is necessary to take the logarithm to the Gaussian mixture distribution to establish the likelihood functionLki(α).
Step 3: Then EM algorithm is used to maximize the likelihood function,and then the parameter is solved.EM algorithm first needs an initial valueαt.The proposed generates the class center by running k-means as the initial condition and estimates the next parameterαt+1from the initial parameter.Then,the updated parameters are iterated until the difference between the parameters of the two iterations reaches a set threshold.The EM algorithm includes E-step and M-step.The specific steps are as follows: E-step.The posterior probability is calculated according to the current parametersξq,µqandσq.
M-step.Then calculate the new parameter by the probability Υtq(ri(k))calculated in E-step.
Then replace the above three new parameters back to the likelihood function to judge whether the threshold conditions are met.If not,the above iteration is continued.Finally,the parameters can be obtained.Step 4:After obtaining the cluster centers of each node,the LOS and NLOS probabilities of each data are calculated according to them for subsequent data combination.To calculate the probability,the distance between each data and each cluster center is obtained first,and then the membership degree is obtained.The specific calculation process is shown in Eq.(18)∼Eq.(21).
4.4 Filter Processing
The probability of LOS and NLOS of each data has been calculated by polynomial fitting and Gaussian mixture model.Next,LOS and NLOS filtering processing will be performed.The three filters KF,VPUKF and VPPF are arranged in series.The data to be processed is passed through the three filters in turn.By default,KF and VPUKF are used to filter the LOS noise,and PF is mainly used to filter NLOS error.Therefore,the distance value processed by VPUKF and KF is taken as LOS part and the distance value processed by KF,VPUKF and PF is taken as NLOS part.The specific processes of processing data by the three filters will be introduced below.
4.4.1 Kalman Filter(KF)
Kalman filter is a classical filter.It is an optimal autoregressive data processing algorithm.It is the most efficient and even the most useful to solve most problems.In this paper,it is used in the algorithm of reducing LOS error.First,we need to establish the state space model as follows.
By default,the speedvi(k)of the mobile node is 1.The state vector composed of the measured distance from the mobile node to the beacon node and the moving speed is as follows:
when the mobile node moves,it can be described by the following formula:
in Eq.(24),yi(k −1|k −1)represents the state at time k-1.yi(k|k−1)represents the state at time k predicted by the state at time k-1.Similarly,Pi(k|k −1)is the error covariance matrix predicted according to the error covariance matrixPi(k −1|k −1)at k-1 time.The Kalman gain is
where,H=[1 0] is the observation matrix.R is the observation error covariance matrix.The residual of measurement and Kalman prediction is
Step 2: Kalman update.In this step,the predicted value needs to be corrected according to the Kalman gain and residual obtained above.The state estimation and error covariance matrix update are shown in Eq.(28)and Eq.(29).
this is the process of estimating the k-time state from the measured value at k-1 time through two steps of Kalman prediction and update.If the Kalman filter is applied to the whole moving process of the mobile node,it needs to constantly predict and update until the end of the move.
4.4.2 Variable Parameter Unscented Kalman Filter(VPUKF)
It is not enough to filter out LOS errors with KF alone,so a VPUKF is connected in series.Different from the traditional UKF,the parameters of VPUKF change according to different error of input values.This improvement makes the filter more flexible and better adapt to different measured values.The state equation and observation equation of the system are:
wgandvgare Gaussian white noise,and their covariance matrices areQgandRgrespectively.f(·) andh(·)are nonlinear state equation functions and nonlinear observation equation functions,respectively.Step 1: The dimension of the state vector is m=1.First,we need to obtain 2m+1 Sigama points.Sigma points are generated according to the following rule:
The most difference between the VPUKF proposed in this paper and the traditional UKF is that the parameterλof VPUKF is variable.A threshold is set to determine whether the average residual calculated in section 4.2 is too large.When VPUKF processes data with small deviations,one parameter is set.The other parameter is set when processing data with large deviations.Step 2: One-step prediction of 2m+1 sigma points:
Step 3: In this step,the predicted state vector and covariance matrix are obtained by weighting the predicted sigma points.The weight calculation method is shown in Eq.(34).
the function of is to control the distribution state of sampling points.Usually,a small positive number is selected,which is made to be 1 in this paper.βis a non-negative weight coefficient,which is taken as 0 in this paper.Subscripts n and c represent state and covariance,respectively.The one-step prediction of system state and covariance obtained by sigma point weighting is
Step 4:The one-step prediction state value and covariance are used to generate a new set of sigma points again.
Step 5: The sigma points predicted by Eq.(37) are substituted into the observation equation to obtain the observation.
Step 6: For the observation and prediction values of the sigma points set obtained in step 5,the observation values and covariance predicted by the system are obtained by weighted summation.
Step 7: Calculate Kalman gain matrix.
Step 8: Calculate the status update and covariance update of the system.
where,zkis the input value of the filter.
4.4.3 Variable Parameter Particle Filter(VPPF)VPPF also makes some internal changes based on the traditional PF.A threshold is set,and then,the error degree of the average residual of each beacon node is determined according to the threshold.According to the error degree of each group of data,we set different particle numbers.VPPF is more flexible and adaptable than the traditional PF with fixed particle number.The specific filtering process is as follows.Step 1: Initialize particle swarm.V particlesu(j)(k),j=1,2,...,Vare generated around the first measured value of the measured data.In this paper,the number of particles has two corresponding values according to the average error of the measured data.At the initial moment,the first measured value is assigned to the V particles.The difference between the distance of each particle from the node and the measured distance is calculated.
in the calculation of weight,Gaussian function is generally used,and it is also used in this paper.The weight is obtained by substituting the above difference into Gaussian function.
where,σis the standard deviation of NLOS error.Step 2: Predict the particles according to the previous time.The prediction method in this paper is to add a Gaussian random noise with mean value of 0 and standard deviation of to each particle.
where,nrrepresents random noise.According to the predicted particles and the actual measured values,the residual between them is calculated by Eq.(45).The weightψ(j)can be obtained by substituting the residual into Eq.(46).The normalization of weights is as follows
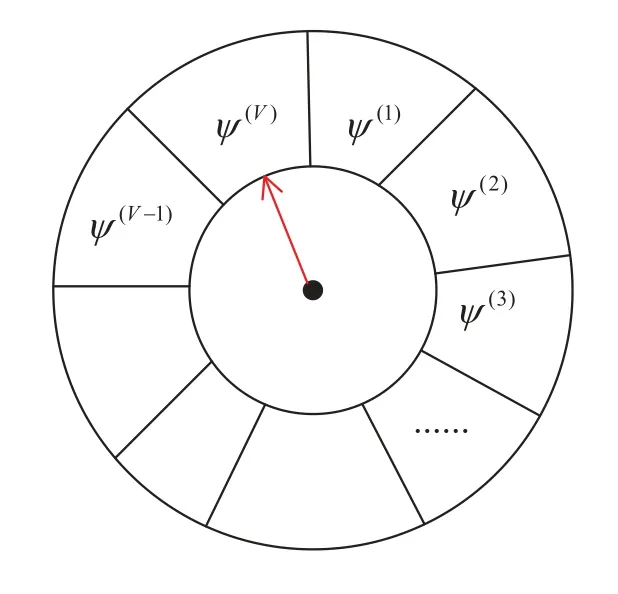
Figure 2.Turntable diagram.
Step 3: Resampling or updating.The purpose of resampling is to erase particles with small weight and replicate particles with large weight.The random resampling method is used.The specific process is as follows.A threshold is set firstly.In this paper,the threshold is not fixed,but a random number related to the maximum weight.Although this setting method may copy the particles with small weight,it also ensures the diversity of particles to a certain extent.Then,a random number from 1 to V is generated as the index of the weight,which is compared with the threshold.If the number is smaller than the threshold,it will be discarded.And the next weight is compared until it is greater than the threshold.The particle corresponding to the weight is stored as a new particle.To better explain the idea of resampling here,the principle of resampling is better explained with the turntable in Figure 2.
As shown in Figure 2,the rotary table is divided into V parts,and these V intervals represent V weightsψ(1)toψ(V)respectively.The greater the weight,the greater the radian of the interval,and the greater the probability that the random number will fall in the corresponding interval.To realize the multiple replications of particles with large weight and the elimination of particles with small weight.
After updating the particles,the average distance of all particles is our final estimate.
4.5 Combination of LOS and NLOS and Final Localization Estimation
In this paper,the distance value output by VPUKF is taken as the LOS part and the distance value of VPPF output is taken as the NLOS part.By combining them with the LOS probability and NLOS probability calculated in section 4.3.The final processing result of the distance measurement value can be obtained.
where,dvppfi(k) represents the distance value output by VPPF anddvpukfi(k)represents the distance value output by VPUKF.
After processing all the distance measurements,the estimated coordinates of the moving target need to be calculated according to these measurements.The relationship between the distance measurement and the mobile node coordinates is as follows:
in this paper,the maximum likelihood algorithm is used to calculate the final position estimation.Eq.(51)is rewritten as AX=b,where:
Then the final positioning coordinate of the moving target is:
V.SIMULATION AND EXPERIMENT
5.1 Simulation
5.1.1 Scene Settings We use the MATLAB platform to simulate the environment.The scene is set as a 100 100m area in which mobile nodes move.In this paper,eight fixed beacon nodes are set in this environment.The LOS environment or NLOS environment is randomly generated according to the NLOS probability.To simulate the localization more comprehensively in complex environment,the NLOS noise is subject to Gaussian distribution,exponential distribution,and uniform distribution respectively.The LOS noise is set as a Gaussian distribution with a mean value of 0.We let the mobile node move along the trajectory shown in Figure 3 in this area.It has moved a total of 80 steps.We start tracking from the 21st step,and the first 20 steps are used for fitting.After that,we get the relationship between each distributed parameter and tracking error through 1000 Monte Carlo experiments to observe the robustness and accuracy of the algorithm.And EKF[22],REKF [11],IMM-REKF [11],IMM-EKF [10]and MJPDA [8] are added to the simulation to compare with the algorithm proposed in this paper.
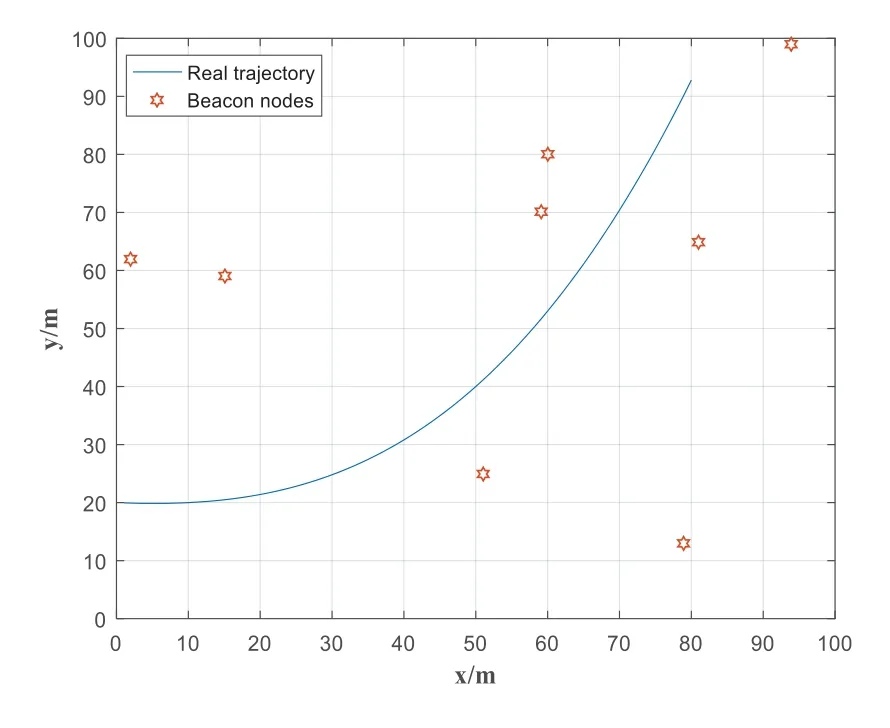
Figure 3.Simulation scenario.
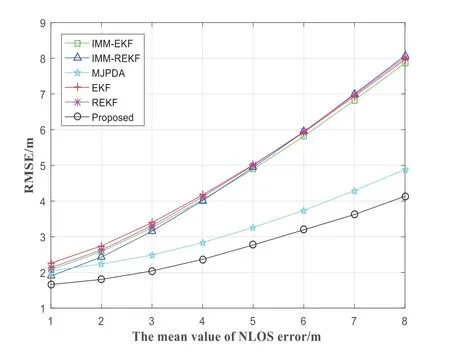
Figure 4.The RMSE varies with the change of mean valueµnlos of NLOS error.
We use root mean square error(RMSE)and cumulative distribution function(CDF)as the evaluation criteria of algorithm performance.As shown below:
Eq.(55)is the mean error distance(MED),from which we can obtain the cumulative distribution function.
5.1.2 Simulation Result
This part mainly shows that when NLOS obeys different distributions,the robustness and accuracy of each algorithm change with the distribution parameters.
Gaussian DistributionFirstly,Gaussian distributionand Gaussian distributionare regarded as the NLOS error and LOS error respectively,and the parameters are shown in the Table 1.
Figure 4 shows the comparison of the positioning efficiency of several algorithms under different NLOS mean values.As the mean value of NLOS error increases from 1 to 8,the RMSE of the IMM-EKF,IMM-REKF,MJPDA,EKF,REKF and proposed increases as well.However,the positioning error of the proposed algorithm is minimal.With the increase of the mean value of NLOS error,the positioning accuracy of the proposed decreases more slowly than that of other algorithms.The average blunder of the IMMEKF,IMM-REKF,MJPDA,EKF,REKF and proposed are 4.6679m,4.6816m,3.2226m,4.8016m,4.768m and 2.6996m respectively.And compared with IMMEKF,IMM-REKF,MJPDA,EKF and REKF,the average positioning error of the proposed can be reduced by 42.17%,42.34%,16.23%,43.78%and 43.38%,respectively.

Table 1.The default parameters for Gaussian distribution.
In Figure 5,the RMSE of the IMM-EKF,IMMREKF,MJPDA,EKF,REKF and proposed changes with the standard deviation of the NLOS errors.When the standard deviation of NLOS errors varies from 1 to 8,the RMSE of the EKF,IMM-EKF,REKF and proposed increases all the time.The RMSE of the IMMREKF and MJPDA first decreased slightly and then increased slightly.The RMSE curves of the MJPDA and proposed algorithm are significantly lower than other RMSE curves in the Figure 5.The average localization error of the IMM-EKF,IMM-REKF,MJPDA,EKF,REKF and proposed are 8.1118m,8.1059m,4.9668m,8.4581m,8.3690m and 4.4399m respectively.And the average localization precision of the proposed is about 45.27%,45.23%,10.61%,47.51% and 46.95% better than that of the IMM-EKF,IMM-REKF,MJPDA,EKF and REKF respectively.
In this paper,whether there is an NLOS environment between mobile nodes and beacon nodes is randomly set according to a certain probability.The Figure 6 shows the influence of the variety of NLOS probability on the positioning efficiency of each algorithm.As the NLOS probability increases from 0.4 to 0.9,the RMSE of the IMM-EKF,IMM-REKF,MJPDA,EKF,REKF and proposed increases gradually.When the NLOS probability reaches 0.9,the RMSE of the proposed algorithm is about 4m,which shows good robustness.The proposed increases the average localization accuracy to 3.3633m.And the average positioning error of the IMM-EKF,IMM-REKF,MJPDA,EKF and REKF are 5.9475m,5.8893m,3.8260m,6.1223m and 6.0333m.The average positioning error of the proposed is about 43.45%,42.89%,12.09%,45.06%and 44.25%lower than that of the IMM-EKF,IMM-REKF,MJPDA,EKF and REKF respectively.
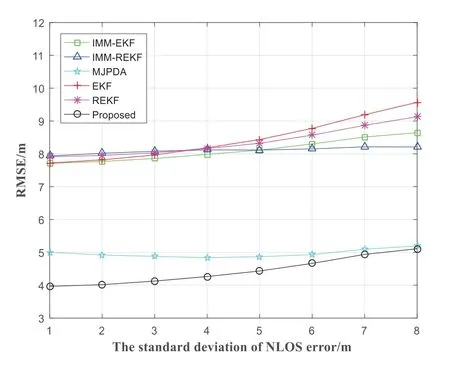
Figure 5.The RMSE varies with the change of standard deviation σnlos of NLOS error.
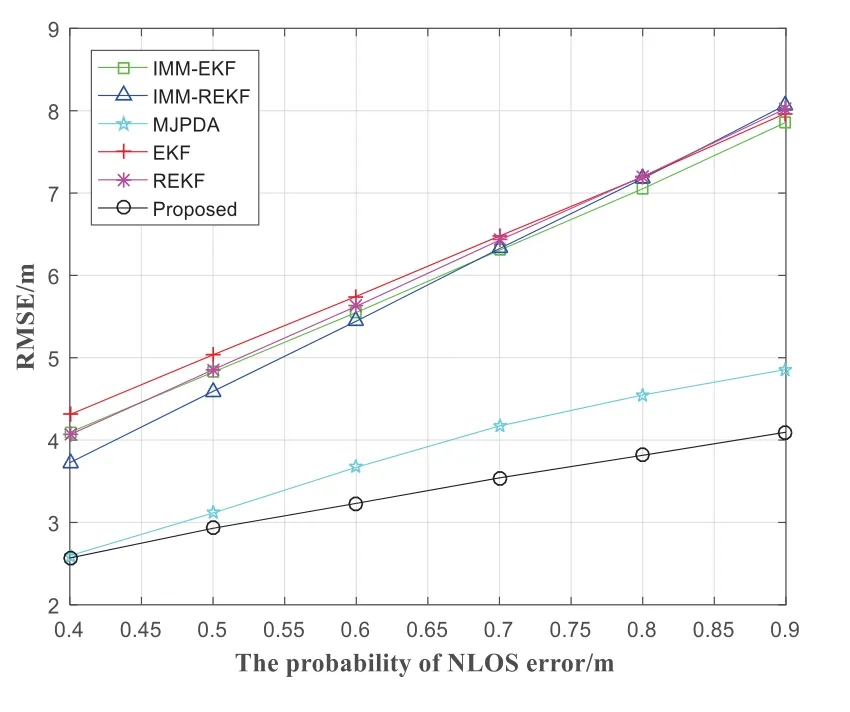
Figure 6.The RMSE varies with the change of NLOS probability thr.
The standard deviation of LOS error also affects the positioning accuracy.Figure 7 shows the change of RMSE with the change of LOS standard deviation.The RMSE of the IMM-EKF,IMM-REKF,MJPDA,EKF and REKF increased a little.The average localization error of the MJPDA and proposed are 5.1175m and 4.3599m,which are significantly lower than that of the IMM-EKF,IMM-REKF,EKF and REKF,which are 8.2219m,8.2535m,8.2961m and 8.2215m.Compared with the IMM-EKF,IMM-REKF,MJPDA,EKF and REKF,the proposed promotes the localization precision by 46.97%,47.18%,14.80%,47.45% and 46.97%.
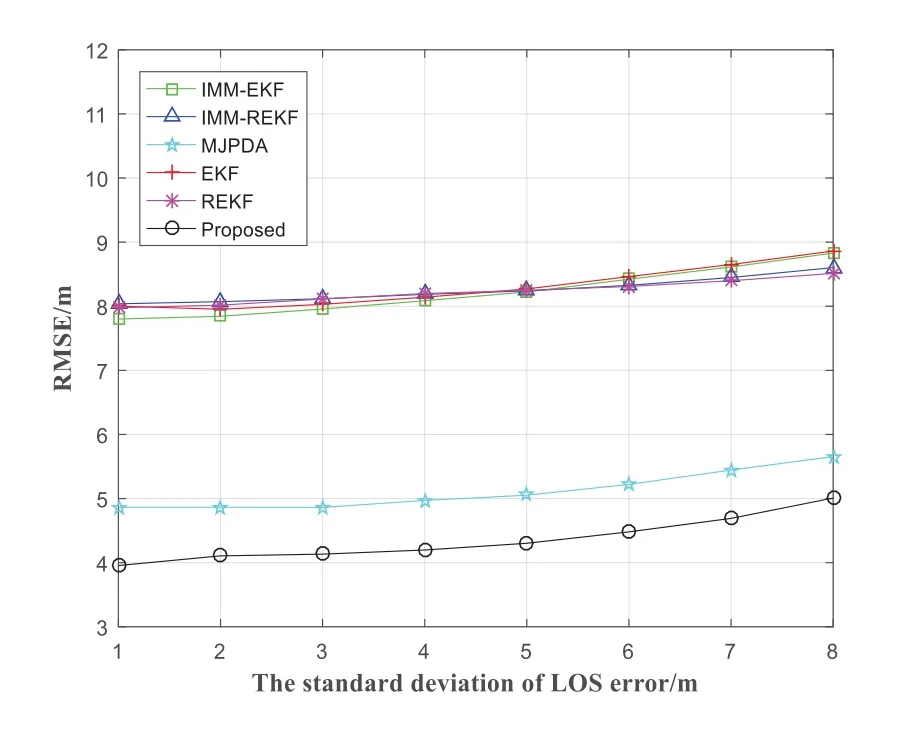
Figure 7.The RMSE varies with the change of standard deviation σlos of LOS error.
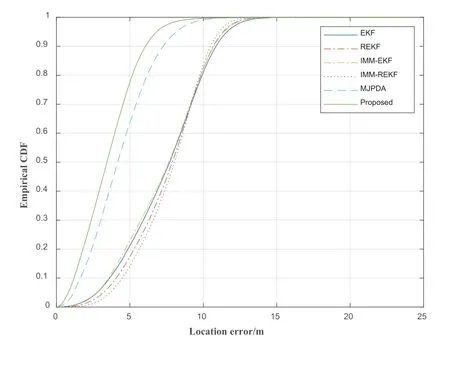
Figure 8.The CDF varies with the change of localization error.
Figure 8 is the CDF diagram drawn according to MED.From Figure 8,the 90%positioning blunder of the REKF,EKF,MJPDA,IMM-EKF,IMM-REKF and proposed is less than 10.68m,10.87m,7.27m,10.72m,10.49m and 6.07m respectively.
Exponential DistributionIn this part,NLOS errors are assumed to follow an exponential distribution with parameter,and the LOS error still follows the Gaussian distribution with mean value of 0.The parameters are shown in the Table 2.
Since the mean value and standard deviation of ex-ponential distribution are equal to parameterλ,only the value of parameterλis given in the Table 2.
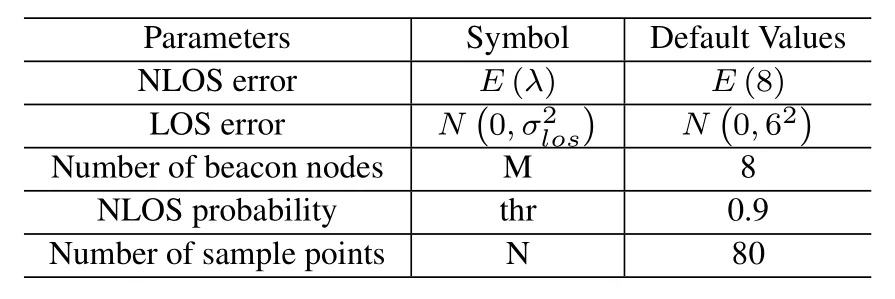
Table 2.The default parameters for exponential distribution.
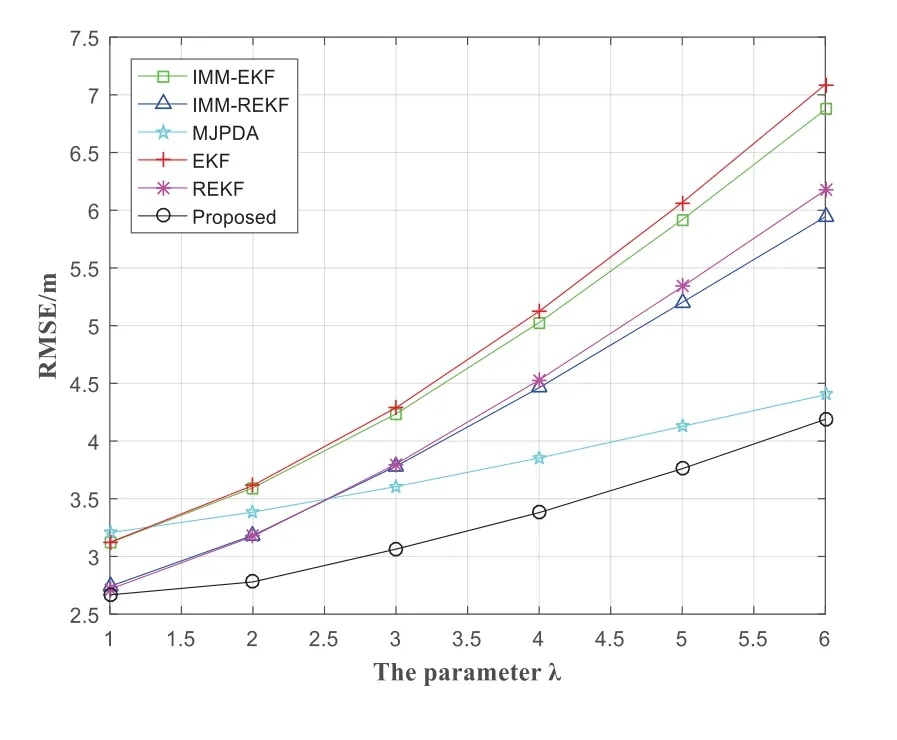
Figure 9.The RMSE varies with the change of parameter λ of exponential distribution.
Figure 9 shows the variety of RMSE of the IMMEKF,IMM-REKF,MJPDA,EKF,REKF and proposed with the variety of parameterλ.When the parameterλof exponential distribution changes from 1 to 6,the RMSE of the IMM-EKF,IMM-REKF,MJPDA,EKF,REKF and proposed are raising.But the positioning precision of the proposed is high,and the accuracy decreases slowly with the increase of parameters,which shows good robustness.The average positioning error of the IMM-EKF,IMM-REKF,MJPDA,EKF,REKF and proposed are 4.7942m,4.2185m,3.7628m,4.8842m,4.2885m and 3.3062m respectively.And the average positioning error of the proposed is about 31.04%,21.63%,12.13%,32.31%and 22.91%lower than that of the IMM-EKF,IMM-REKF,MJPDA,EKF and REKF respectively.
To demonstrate the influence of the change of NLOS probability on the positioning accuracy of the IMMEKF,IMM-REKF,MJPDA,EKF,REKF and proposed when the NLOS error follows the exponential distribution.Figure 8 shows the RMSE transformation of the IMM-EKF,IMM-REKF,MJPDA,EKF,REKF and proposed when the NLOS probability ranges from 0.4 to 0.9.The RMSE of the IMM-EKF,IMM-REKF,MJPDA,EKF,REKF and proposed increased.The increase of the proposed is very small,and the positioning error is always low.The average localization error of the proposed is 2.908m,which is lower than that of the IMM-EKF,IMM-REKF,MJPDA,EKF and REKF,which are 3.7855m,3.3018m,3.4778m,3.8363m and 3.3252m.Compared with the IMMEKF,IMM-REKF,MJPDA,EKF and REKF,the error of the proposed can be reduced by 23.18%,11.93%,16.38%,24.20%and 12.55%,respectively.
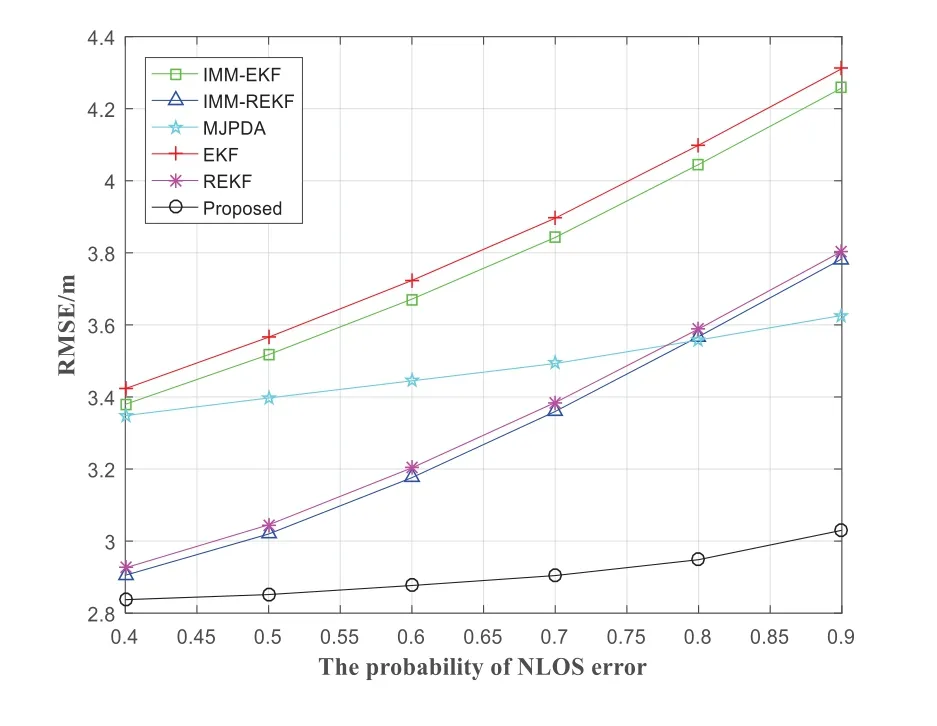
Figure 10.The RMSE varies with the change of NLOS probability thr.
As the NLOS error follows the exponential distribution,the RMSE of the IMM-EKF,IMM-REKF,MJPDA,EKF,REKF and proposed changes with the change of LOS error,as shown in Figure 11.The RMSE of the IMM-EKF,IMM-REKF,MJPDA,EKF,REKF and proposed increases gradually in the process of LOS error standard deviation from 3 to 9.The average positioning error of the IMM-EKF,IMM-REKF,MJPDA,EKF,REKF and proposed are 4.2687m,3.7799m,3.6380m,4.3274m,3.8083m and 3.1120m respectively.And the average positioning error of the proposed is about 27.10%,17.67%,14.46%,28.09%and 18.28% lower than that of the IMM-EKF,IMMREKF,MJPDA,EKF and REKF respectively.
The CDF of positioning error is shown in Figure 12.In Figure 12,the 90% positioning error of the proposed is less than 4.476m.The 90% error of the REKF,EKF,MJPDA,IMM-EKF and IMM-REKF and is less than 5.718m,6.489m,5.526m,6.418m and 53687m respectively.In contrast,the positioning error of the proposed is smaller.
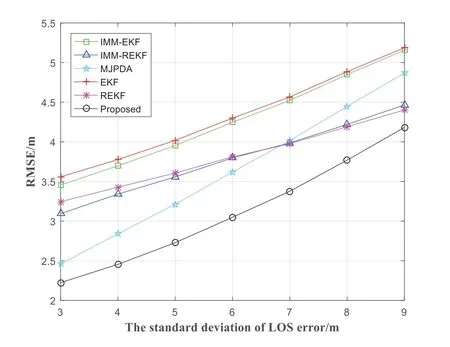
Figure 11.The RMSE varies with the change of standard deviation σnlos of LOS error.
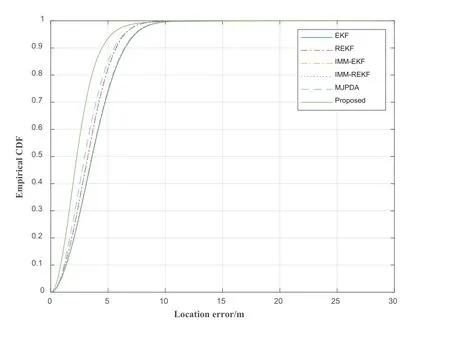
Figure 12.The CDF varies with the change of localization error.
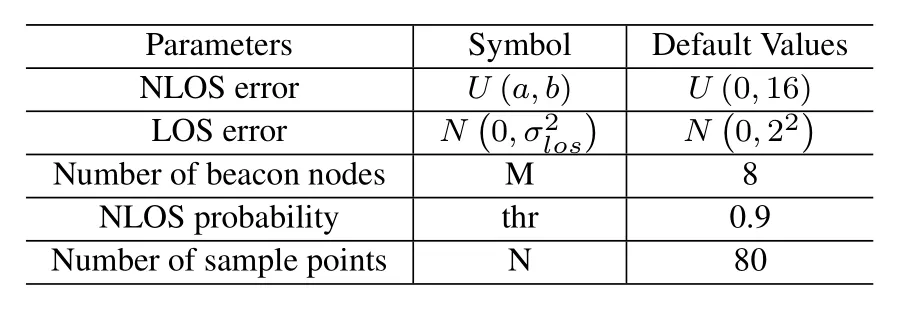
Table 3.The default parameters for uniform distribution.
Uniform DistributionHere,the uniform distributionU(a,b) is regarded as the NLOS error,and the Gaussian distributionN(0,σ2los)is still regarded as the line-of sight error part.Their default parameters are shown in Table 3.
The mean value and standard deviation of uniform distribution are shown in Eq.(56)and Eq.(57)respectively.
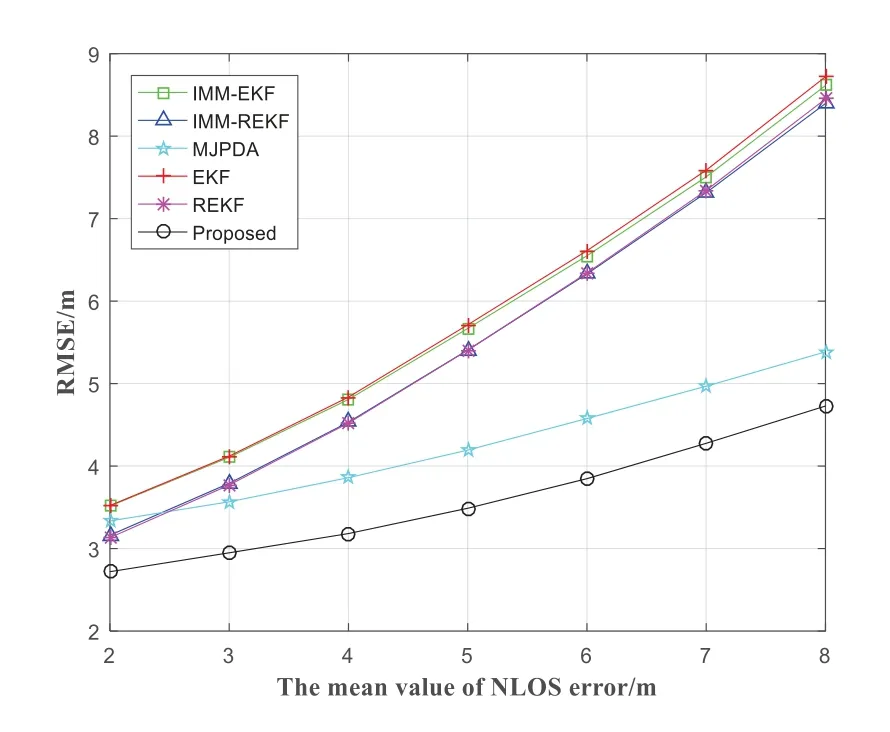
Figure 13.The RMSE varies with the change of mean valueµnlos of NLOS error.
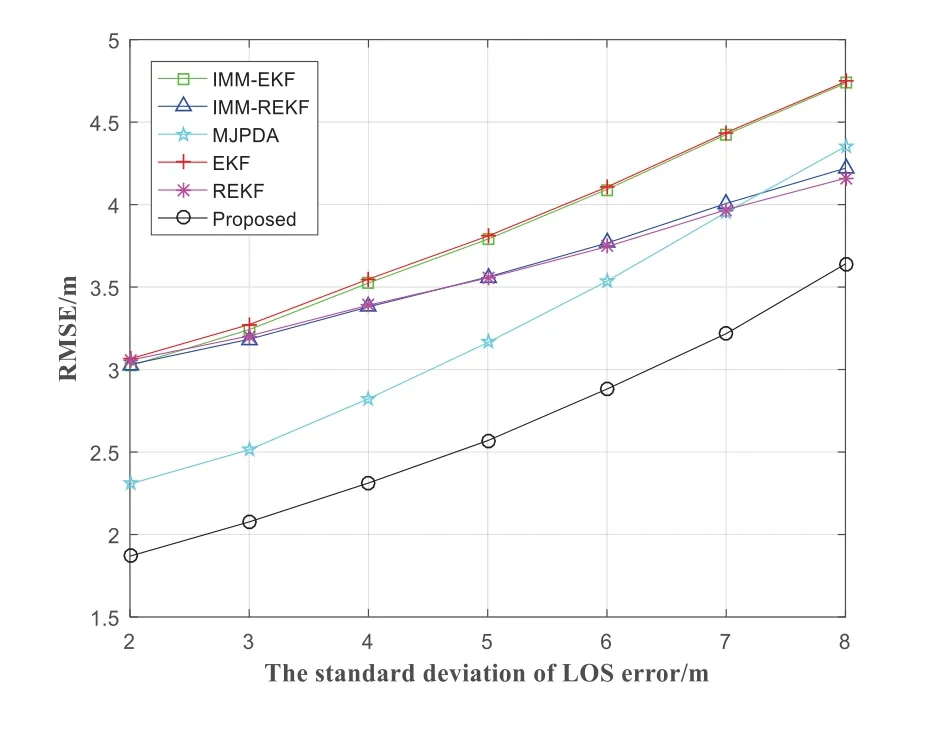
Figure 14.The RMSE varies with the change of standard deviation σnlos of LOS error.
Figure 13 presents the variety of RMSE of the IMMEKF,IMM-REKF,MJPDA,EKF,REKF and proposed with the variety of the mean value of NLOS error.From the Figure 13,the larger the probability of NLOS errors is,the larger the RMSE of the EKF,REKF,MJPDA,IMM-EKF,IMM-REKF and proposed is.The mean value of NLOS error ranges from 2 to 8.The average positioning accuracy of the IMM-EKF,IMM-REKF,MJPDA,EKF,REKF and proposed are 5.8239m,5.5614m,4.2691m,5.8729m,5.5661m and 3.5984m respectively.And the average positioning error of the proposed is about 38.21%,35.30%,15.71%,38.73%and 35.35%lower than that of the IMM-EKF,IMM-REKF,MJPDA,EKF and REKF respectively.
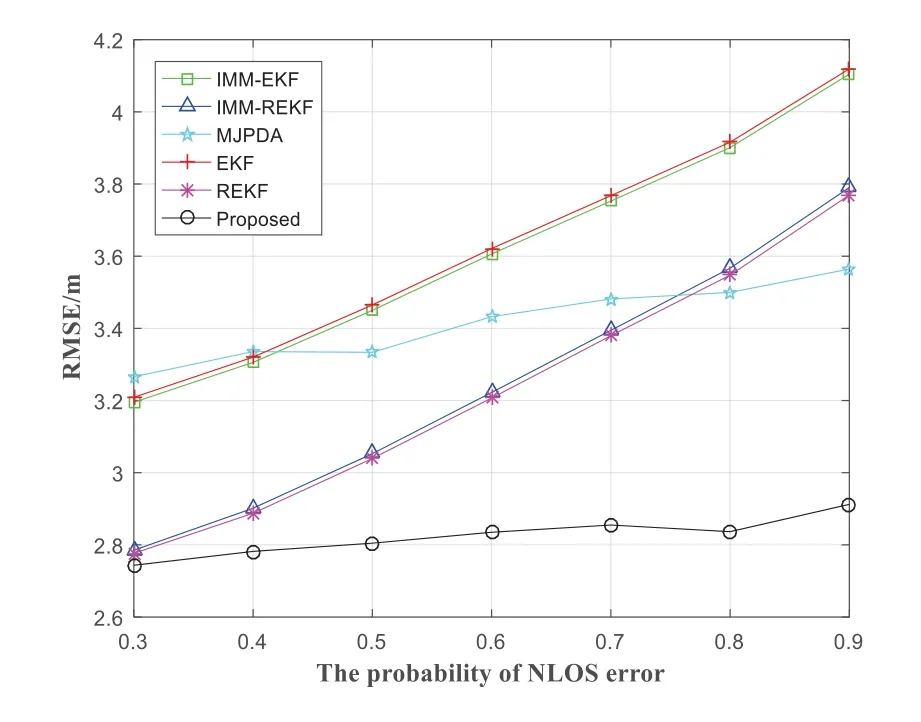
Figure 15.The RMSE varies with the change of NLOS probability.
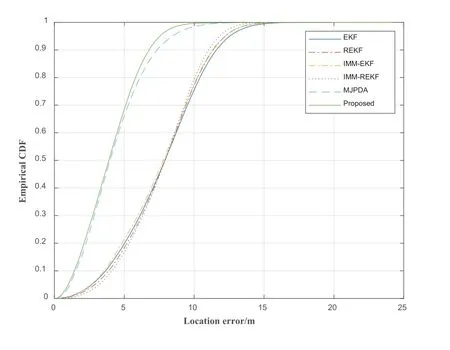
Figure 16.The CDF varies with the change of localization error.
The RMSE of the IMM-EKF,IMM-REKF,MJPDA,EKF,REKF and proposed with the standard deviation of the LOS error when the NLOS error obeys the uniform distribution,as shown in Figure 14.The RMSE of the IMM-EKF,IMM-REKF,MJPDA,EKF,REKF and proposed increased with the standard deviation of LOS error from 2 to 8.And the RMSE of proposed is lowest.The average localization accuracy of the proposed is 2.6526m.The average localization accuracy of the IMM-EKF,IMM-REKF,MJPDA,EKF and REKF are 3.8331m,3.5927m,3.2351m,3.8547m,3.5829m respectively.Compare with IMMEKF,IMM-REKF,MJPDA,EKF and REKF,the average positioning error of the proposed can be reduced by 30.80%,26.17%,18.01%,31.19%and 25.97%,respectively.
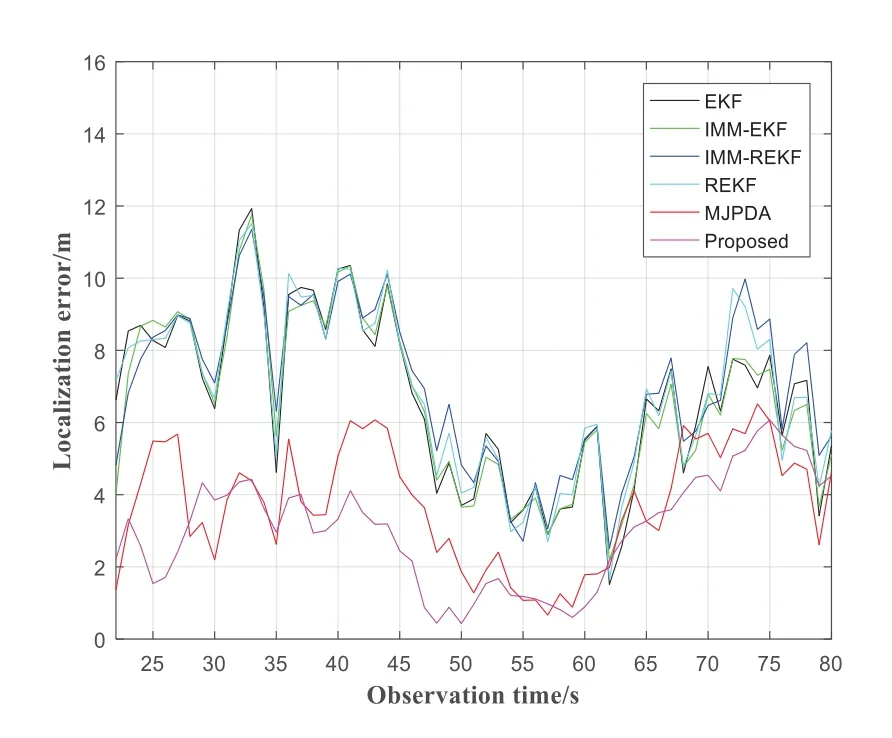
Figure 17.The localization error versus the observation time.
Figure 15 shows the variety of positioning accuracy of each algorithm under different NLOS probabilities.As the probability of NLOS error increases from 0.3 to 0.9,the localization blunders of the IMM-EKF,IMM-REKF,MJPDA,EKF,REKF and proposed are gradually raising.The positioning errors of MJPDA and proposed rise slowly.The average positioning blunder of the IMM-EKF,IMM-REKF,MJPDA,EKF,REKF and proposed are 3.6166m,3.2449m,3.4163m,3.6311m,3.2294m and 2.8241m respectively.And compare with IMM-EKF,IMM-REKF,MJPDA,EKF and REKF,the average positioning error of the proposed can be reduced by 21.91%,12.97%,17.33%,22.22%and 12.55%,respectively.
In Figure 16,the 90% positioning error of the proposed is less than 6.779m.The 90% localization error of the EKF,REKF,MJPDA,IMM-EKF and IMMREKF is lower than 11.600m,11.360m,7.365m,11.330m and 11.040m respectively.Overall,the proposed algorithm’s localization accuracy is better than EKF,MJPDA,REKF,IMM-EKF and IMM-REKF.
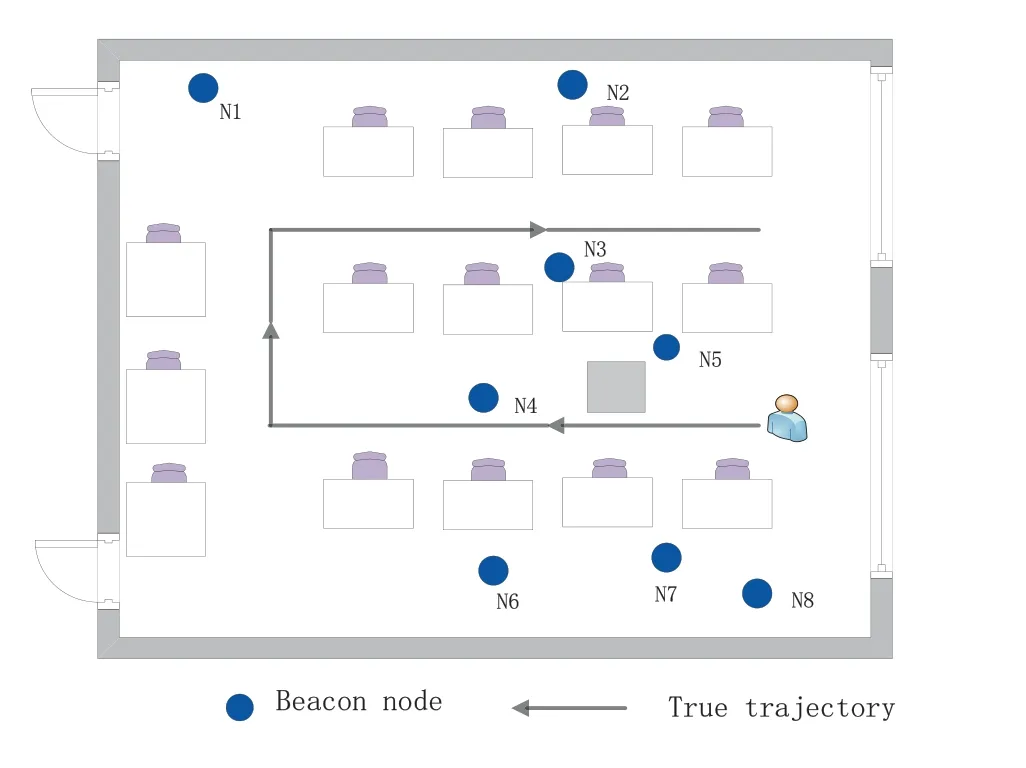
Figure 18.Experimental environment.
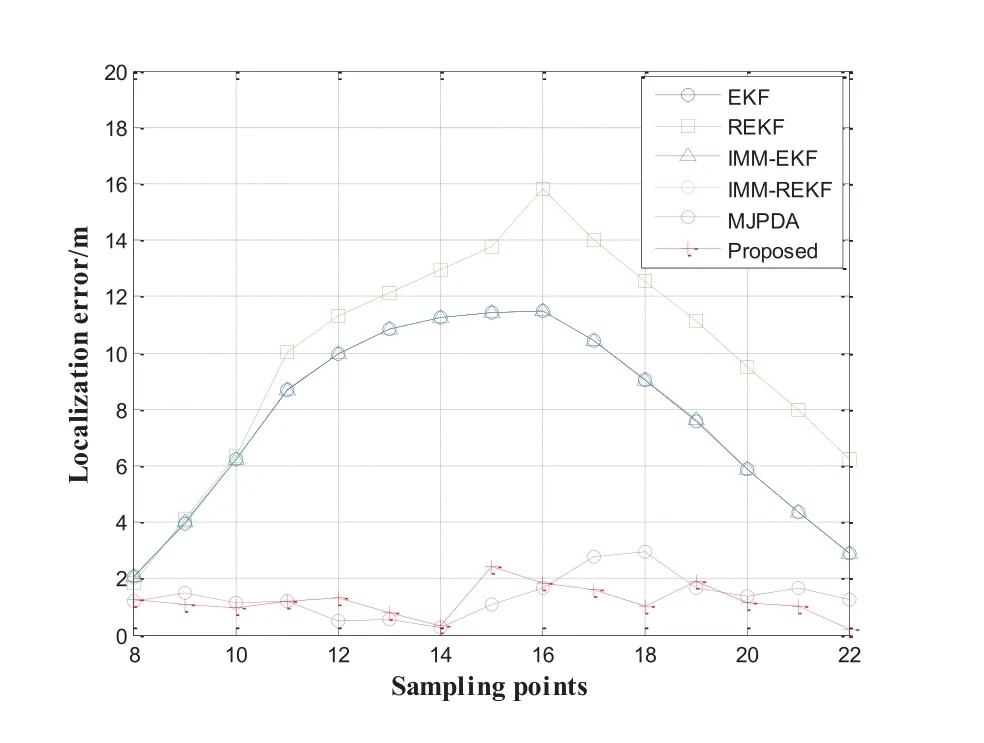
Figure 19.The localization error at each sampling points.
Figure 17 shows the change of localization error of each algorithm with observation time under the default parameters.The NLOS noise in the scene setting follows the normal distribution,and it is randomly generated under the default parameters according to NLOS probability.The error is calculated once per second,so the curve in the figure fluctuates greatly.From 22s to 80s,the positioning error of the proposed algorithm is lower than that of other algorithms at most times.In this scenario,the average errors of the MJPDA,REKF,IMM-REKF,IMM-EKF,EKF and proposed are 3.7334m,6.8645m,7.0232m,6.5920m,6.6975m and 3.0153m respectively.
5.2 Experiment
5.2.1 Experimental Condition We conducted experiments in an indoor environment.Due to the good performance of UWB,it is more and more widely used in the field of positioning.Therefore,in this experiment,the signal transmission between nodes also adopts UWB.We have prepared two UWB nodes,one of which is connected to the mobile power supply for pedestrians to hold.Another UWB node is connected to the computer and fixed in a preset position.In the process of pedestrian movement,the beacon node will continue to receive data.The experimental environment is the indoor environment as shown in Figure 18.The coordinates of beacon nodes are set as N1 (0.8,12.8),N2 (6.4,12.8),N3 (6.4,6.4),N4(4.8,4.8),N5(7.2,5.6),N6(4,0.8),N7(7.2,1.6)and N8(8,0.8).Pedestrians will move along the real track shown in the figure.The whole track has 22 steps,each of which is 80cm.The beacon node will continuously collect data,and we will keep 25 data for each step,and then take the average value.
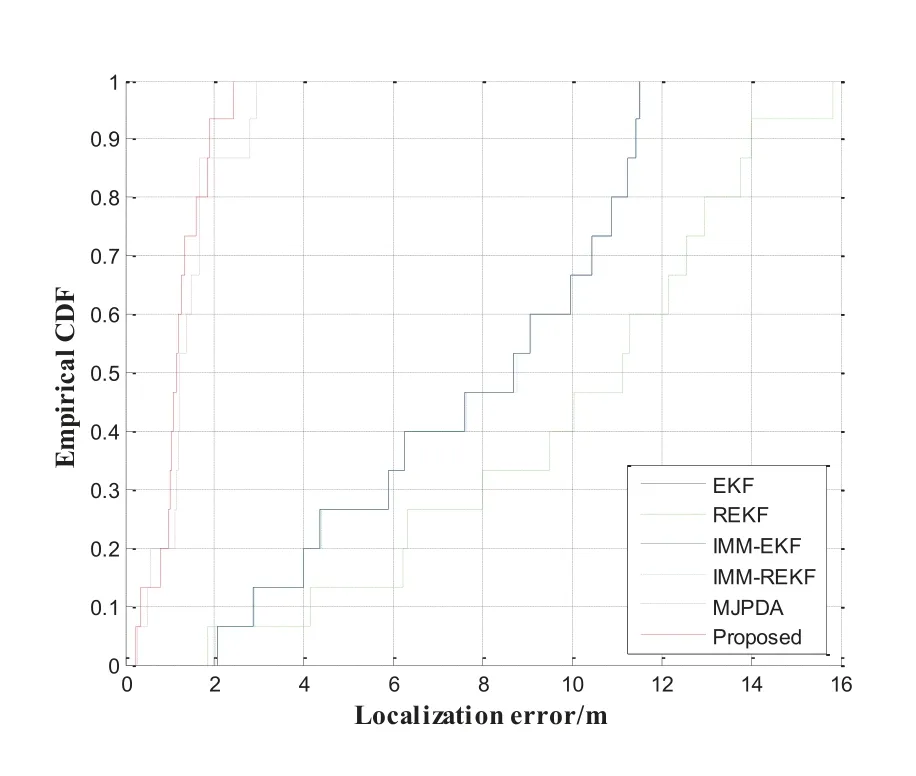
Figure 20.The CDF versus the localization error.
5.2.2 Experimental Result
Figure 19 shows the positioning error of each step.It can be seen from the figure that the positioning effect of the proposed algorithm and MJPDA is obviously better than that of other algorithms.The average errors of the MJPDA,REKF,IMM-REKF,IMM-EKF,EKF and proposed are 1.3847m,9.9821m,7.7571m,7.7487m,7.7481m and 1.2060m.In Figure 20,the 90% positioning error of the proposed is less than 1.889m.The 90% localization error of the EKF,REKF,MJPDA,IMM-EKF and IMM-REKF is lower than 11.440m,14.001m,2.792m,11.440m and 11.441m respectively.
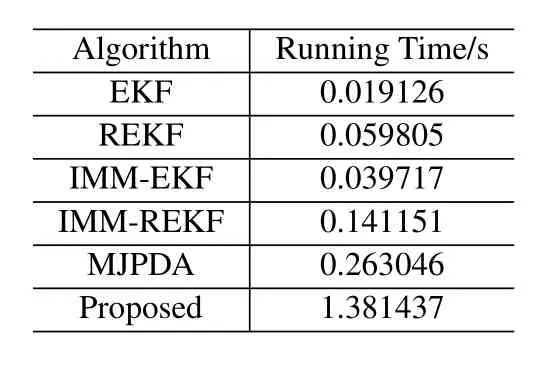
Table 4.Total computational time.
5.2.3 Limitations of the Proposed Algorithm
The disadvantage of the algorithm proposed in this paper is the high time complexity.Table 4 below shows the running time of each algorithm in the experiment.The proposed algorithm takes a long time,which is due to the long convergence time of EM algorithm.In the later research,we will focus on reducing the workload caused by EM algorithm.
VI.CONCLUSION
The algorithm proposed in this paper is a LOS/NLOS hybrid localization algorithm integrating polynomial fitting,GMM clustering algorithm,KF,variable parameter UKF and variable parameter PF.Firstly,the polynomial fitting algorithm is used to obtain the residual between the predicted value and the actual measured value.The measured value is judged once with the residual,and the measured value with too large error is corrected.Then GMM will cluster these residual values.LOS probability and NLOS probability are obtained through measured values and cluster centers.The next step is to mitigate the measurement noise.The measured values are filtered by KF,VPUKF and VPPF in turn.The distance value output by VPUKF and the distance value output by VPPF are combined by LOS probability and NLOS probability.Finally,the position coordinates are obtained by the maximum likelihood method.Through simulation,the positioning efficiency of the proposed algorithm is significantly better than EKF,REKF,IMM-EKF,IMMREKF and MJPDA.Moreover,it shows strong robustness under the condition of strong NLOS distance.
ACKNOWLEDGEMENT
This work was supported by the National Natural Science Foundation of China under Grant No.62273083 and No.61973069,Natural Science Foundation of Hebei Province under Grant No.F2020501012.
- China Communications的其它文章
- Quality-Aware Massive Content Delivery in Digital Twin-Enabled Edge Networks
- Edge-Coordinated Energy-Efficient Video Analytics for Digital Twin in 6G
- Unpredictability of Digital Twin for Connected Vehicles
- Endogenous Security-Aware Resource Management for Digital Twin and 6G Edge Intelligence Integrated Smart Park
- Digital Twin-Assisted Knowledge Distillation Framework for Heterogeneous Federated Learning
- Design and Implementation of Secure and Reliable Information Interaction Architecture for Digital Twins

