Generation of irregular particle packing with prescribed statistical distribution,spatial arrangement,and volume fraction
Libing Du ,Xinrong Liu ,Yafeng Han ,Zhiyun Deng
a School of Civil Engineering,Chongqing University,Chongqing,400045,China
b School of Geoscience and Technology,Southwest Petroleum University,Chengdu,610500,China
c School of River and Ocean Engineering,Chongqing Jiaotong University,Chongqing,400074,China
d State Key Laboratory of Hydroscience and Engineering,Tsinghua University,Beijing,100084,China
Keywords:Minkowski sum Optimised advance front method (OAFM)Spatial arrangement Irregular particle packing Statistical distribution
ABSTRACT A method for packing irregular particles with a prescribed volume fraction is proposed.Furthermore,the generated granular material adheres to the prescribed statistical distribution and satisfies the desired complex spatial arrangement.First,the irregular geometries of the realistic particles were obtained from the original particle images.Second,the Minkowski sum was used to check the overlap between irregular particles and place an irregular particle in contact with other particles.Third,the optimised advance front method (OAFM) generated irregular particle packing with the prescribed statistical distribution and volume fraction based on the Minkowski sum.Moreover,the signed distance function was introduced to pack the particles in accordance with the desired spatial arrangement.Finally,seven biaxial tests were performed using the UDEC software,which demonstrated the accuracy and potential usefulness of the proposed method.It can model granular material efficiently and reflect the mesostructural characteristics of complex granular materials.This method has a wide range of applications where discrete modelling of granular media is necessary.
1.Introduction
Granular materials are widely distributed in nature.Composed of particles with irregular geometries,granular materials have a complex statistical distribution and a complicated spatial arrangement depending on their geological origin (Blikra et al.,2006;Dunning,2011;Shugar and Clague,2011;Ren et al.,2018).The shape,static distribution,and spatial arrangement of particle assemblies significantly influence their macroscopic and microscopic mechanical behaviours (Peña et al.,2007;Yan and Dong,2011;Athanasios et al.,2014;Amirrahmat et al.,2019;Nguyen et al.,2021;Peng et al.,2021;Yan and Regueiro,2021;Deng et al.,2022;Pillai and Gali,2022;Xu et al.,2022).This further affects the long-term stability of the granular materials.Therefore,it is necessary to model the mesostructural characteristics of complex granular materials.For example,the generated granular material should have realistic irregular geometries,adhere to the prescribed static distribution,follow the target volume fraction,and satisfy the desired spatial arrangement.
Current modelling methods for granular materials can be divided into two categories: constructive packing and dynamic packing methods(O’Sullivan,2011;Ilin and Bernacki,2016;Recarey et al.,2019).The constructive packing method packs particles sequentially by utilising pure geometrical calculations.The dynamic packing method changes all the particle positions using the discrete element method (DEM).Therefore,it is widely used to model granular materials.Checking the overlap between particles and placing a particle in contact with other fixed particles when using the constructive packing method is challenging.Therefore,the constructive method can only pack simple geometries such as circles (Feng et al.,2003;Bagi,2005),ellipses (Feng et al.,2003;Bagi,2005;Du et al.,2021),and regular polygons (Morales et al.,2017;Li et al.,2018;Morfa et al.,2018).However,by approximating irregular particles with several overlapping spheres (Ilin and Bernacki,2016;Yang et al.,2016) or several nonoverlapping spheres,it can successfully pack irregular particles(Xu et al.,2016a,b).However,the computational time is long,and the volume fraction(defined as the ratio of particle volume to domain volume)is low.Moreover,the constructive method cannot produce a prescribed volume fraction.
The dynamic packing method continually changes all the particle positions,as well as rotates the particles and is capable of producing the highest volume fraction(Donev et al.,2004;Delaney et al.,2005;Birgin et al.,2016;Kerimov et al.,2018).However,it incurs high computational costs and cannot follow a prescribed distribution for particle orientation.Moreover,it cannot satisfy certain spatial arrangements.Its application to simple shapes,such as circles,ellipses,polygons,poly-arc (Peña et al.,2008;Azema et al.,2009;Ma et al.,2019),and superellipsoids (Wellmann and Wriggers,2011,2012),has been extensively studied.Due to the tremendous increase in computing power,the overlapping ball clump(Azéma and Radjai,2010;Matsushima and Chang,2011)and nonoverlapping ball cluster(Fu et al.,2017;Peng et al.,2020;Suhr and Six,2020;Xu and Guo,2020;Nan et al.,2021)are often used to model irregular particles.However,as the number of particles and morphology complexity increase,the computational cost increases exponentially.For example,it took 11 weeks for the dynamic method to generate realistic particle packing using 26,683 particles based on realistic sand particle morphologies (Qian et al.,2016).Moreover,if there is no overlap between particles,the dynamic method cannot pack particles with a prescribed volume fraction.
There are other methods for packing realistic particles.Galindo-Torres et al.(2010) created packs of spherical polygons based on Voronoi diagrams and Minkowski sums.Mollon and Zhao (2012,2013,2014) generated the Voronoi polygon with the prescribed distribution for orientation and size using the inverse Monte Carlo method,and placed a realistic particle in the polygon by combining the theory of random fields and a Fourier-shape description.In addition,to pack particles such as pebbles,Wang et al.(2019)generated convexity by the weighted Voronoi tessellation and constructed pebble packing by cubic-polynomial curve fitting.The Voronoi diagram can create polygons with the prescribed distributions for particle size and particle orientation by iteratively moving the seeds and iteratively changing the radius.However,the Voronoi diagram is costly and cannot generate large-scale granular materials.The conditional model and level set method were used to pack realistic particles based on X-ray images (Tahmasebi,2018,2019;Tahmasebi and Sahimi,2018).However,they required considerable computational time.For example,the detection and correction of mismatched locations are costly.The volume fraction generated by this method was the same as that of the original X-ray images.Therefore,the desired volume fractions cannot be produced.
As noted above,the constructive method can quickly pack simple particles with a prescribed distribution at a fast packing speed,but the generated packing has a low volume fraction.While the dynamic method can generate irregular particle packing with a high volume fraction but at a low packing speed,the generated packing cannot adhere to a prescribed distribution for particle orientation and satisfy a desired spatial arrangement.The particle packing generated by other methods cannot satisfy the prescribed statistical distribution and the desired spatial arrangement.Moreover,the computational time for irregular particle packing generated by other methods is costly.
This paper proposes a method for packing irregular particles with the desired volume fraction at a high packing speed.Meanwhile,the generated packing of irregular particles can adhere to the prescribed statistical distribution for particle size,particle orientation,and aspect ratio and satisfies the desired spatial arrangement.Accordingly,the Minkowski sum is introduced to check the overlap between irregular particles and place an irregular particle in contact with other particles.Based on the Minkowski sum,a new advance front method(AFM)is proposed to pack irregular particles with a prescribed statistical distribution at a high packing speed.Moreover,the new AFM introduces a signed distance function to control the particle dimensions with the prescribed spatial arrangement.Because the volume fraction depends on the particle angle and packing boundary,a prescribed volume fraction can be generated by tuning the optimal angle and packing boundaries.
The remainder of this paper is organised as follows.A geometric database for realistic irregular particles is established in Section 2.In Section 3,the Minkowski sum is introduced to detect the intersection between irregular particles and place an irregular particle in contact with other particles.In Section 4,a new method is proposed to pack irregular particles with the prescribed statistical distribution,spatial arrangement,and volume fraction.The biaxial tests of granular materials generated by the proposed method are investigated using the UDEC software in Section 5.Finally,the conclusions are drawn in Section 6.
2.Geometry database for irregular particle
As shown in Fig.1,a geometry database of realistic irregular particles was established using digital graphics processing.If there are enough samples of realistic particles,the established geometry database can accurately represent realistic irregular particles.Therefore,this study establishes a geometry database that includes 3716 geometries of realistic irregular particles.
The shape descriptors of irregular particles are shown in Fig.2,whereSis the smallest possible dimension of irregular particles(obtained by minimising the rotation angle α,see Fig.2a),andLis the dimension of the particle.In this study,Swas used to characterise the particle size.The rotation angle α corresponded to the particle orientation.L/Sis the aspect ratio λ.The roughness descriptor proposed below is called the regularity:

wherePis the perimeter,andPconis the convex perimeter generated by the nonconvex particle vertex.
The circularity in Fig.2c is defined as

whereRcircis the radius of the minimum circumscribed circle,andRinscis the radius of the largest inscribed circle in the particle.Circularity describes the overall shape of a particle.Rcircis very useful for simplifying the overlap check between particles.
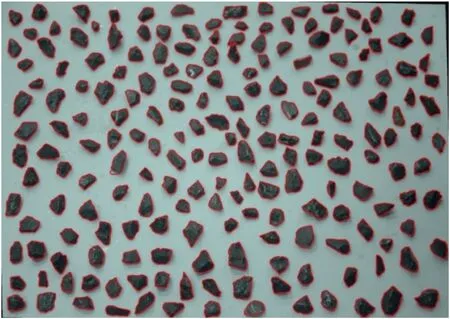
Fig.1.Geometry of realistic particles used to establish a geometry database.
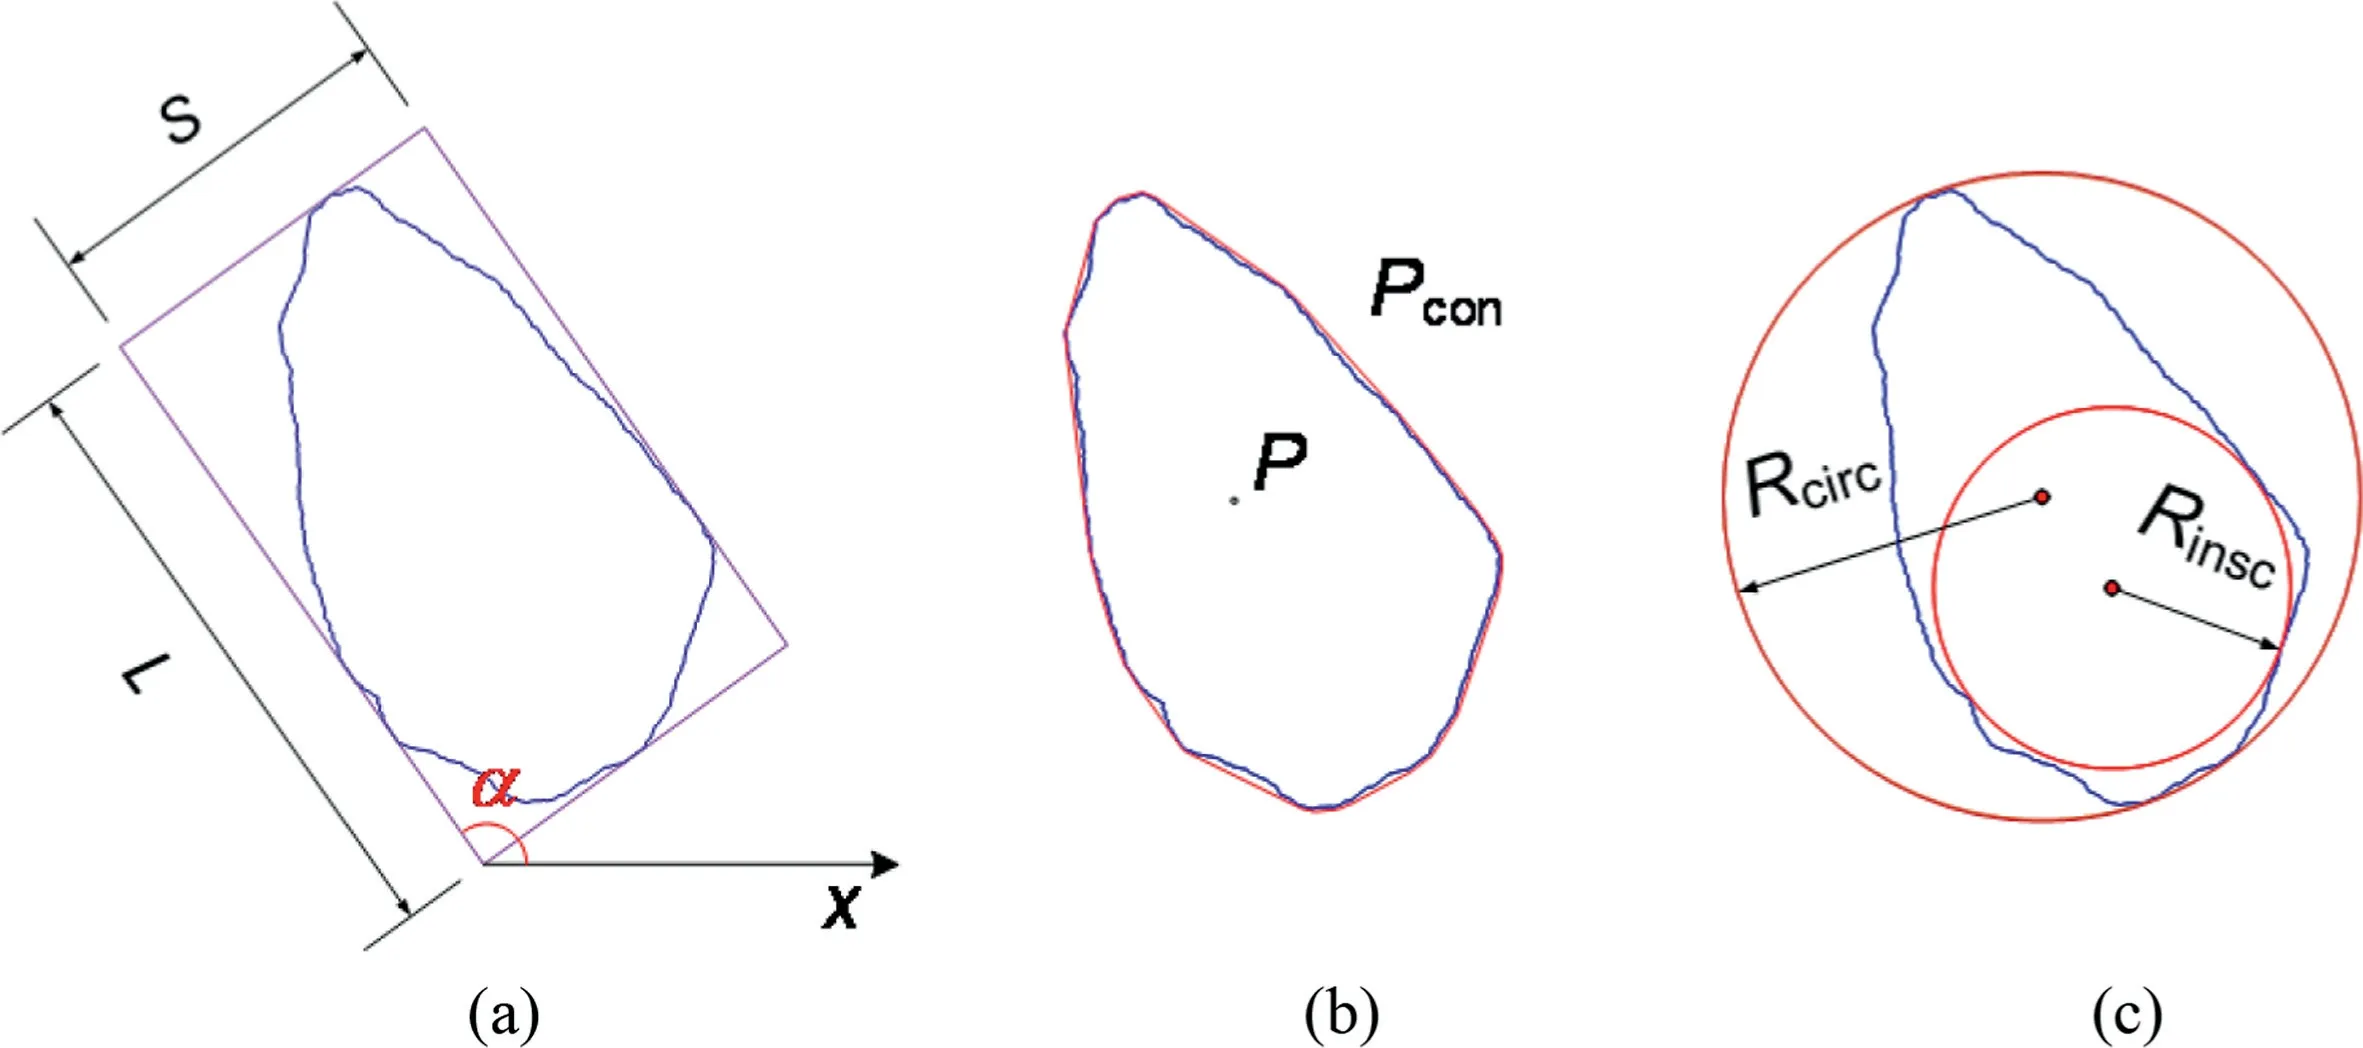
Fig.2.Shape descriptors of an illustrative particle: (a) Aspect ratio and particle orientation;(b) Regularity;and (c) Circularity.
As shown in Fig.2b and Eq.(1),a realistic particle is typically nonconvex.The generated convex particle has the same particle sizeS,particle orientation α,and aspect ratio λ as the realistic particle.There is a one-to-one correspondence between realistic and convex particles.Generated packing with convex particles makes it easy to pack realistic particles by replacing convex particles with the corresponding particles.
Before packing the realistic particle,it is necessary to standardise its geometry by translation,scaling,and rotation.The processing flow of the standard is illustrated in Fig.3.First,the centre of the particle is translated to the origin.Second,the geometry is scaled with the origin as the base point until the particle sizeSequals one unit.Finally,the geometry is rotated clockwise around the origin to the orientation angle α.Thus,the long axis coincides with thex-axis,and its width is equal to the aspect ratioL/S.Therefore,all geometries were standardised to establish a standard geometry database of realistic irregular particles.
Pseudocode 1 in Appendix A and Fig.4 illustrate the generation of an irregular particle with target particle sizeSTarget,particle orientation αTarget,and aspect ratio λTargetbased on the established standard geometry.First,select a suitable geometry with the aspect ratio as λTarget;second,scale the geometry chosen withSTarget;finally,rotate the scaled geometry with αTarget.Thus,the target particle is generated.
λTargetcan be replaced by another shape descriptor.Pseudocode 1 can then generate more complex particles with other target shape descriptors.For example,λTargetcan be replaced by circularity or regularity.
3.Packing irregular particles by the Minkowski sum
3.1.Overlap detection between irregular particles
The Minkowski sum is used to check whether the two convex polygons intersect each other.For convex polygons A and B,the Minkowski sum of A⊕B is calculated as

whereais the vertex in polygon A,bis the vertex in polygon B,andcis the set of points generated by the sum between the vertices in A and B.The convex generated by the Minkowski sum of A⊕B is convex polygon C.The Minkowski sum A⊕-B is often used to check the overlap between convex polygons A and B.Convex-B is created by rotating convex polygon B 180º.
An overlap check between convex polygons A and B is shown in Fig.5.The key is to determine whether the origin is in convex polygon CA⊕-Bor not.This affects the sign of the directed areaAiof ΔOPiPi+1.Triangle ΔOPiPi+1is formed by the originO(0,0)and the verticesPi(xi,yi) andPi+1(xi+1,yi+1) in convex polygon CA⊕-B.VerticesPiandPi+1are sorted counterclockwise.The directed areaAiof ΔOPiPi+1is as follows:


Fig.3.Process of standardising a realistic geometry.
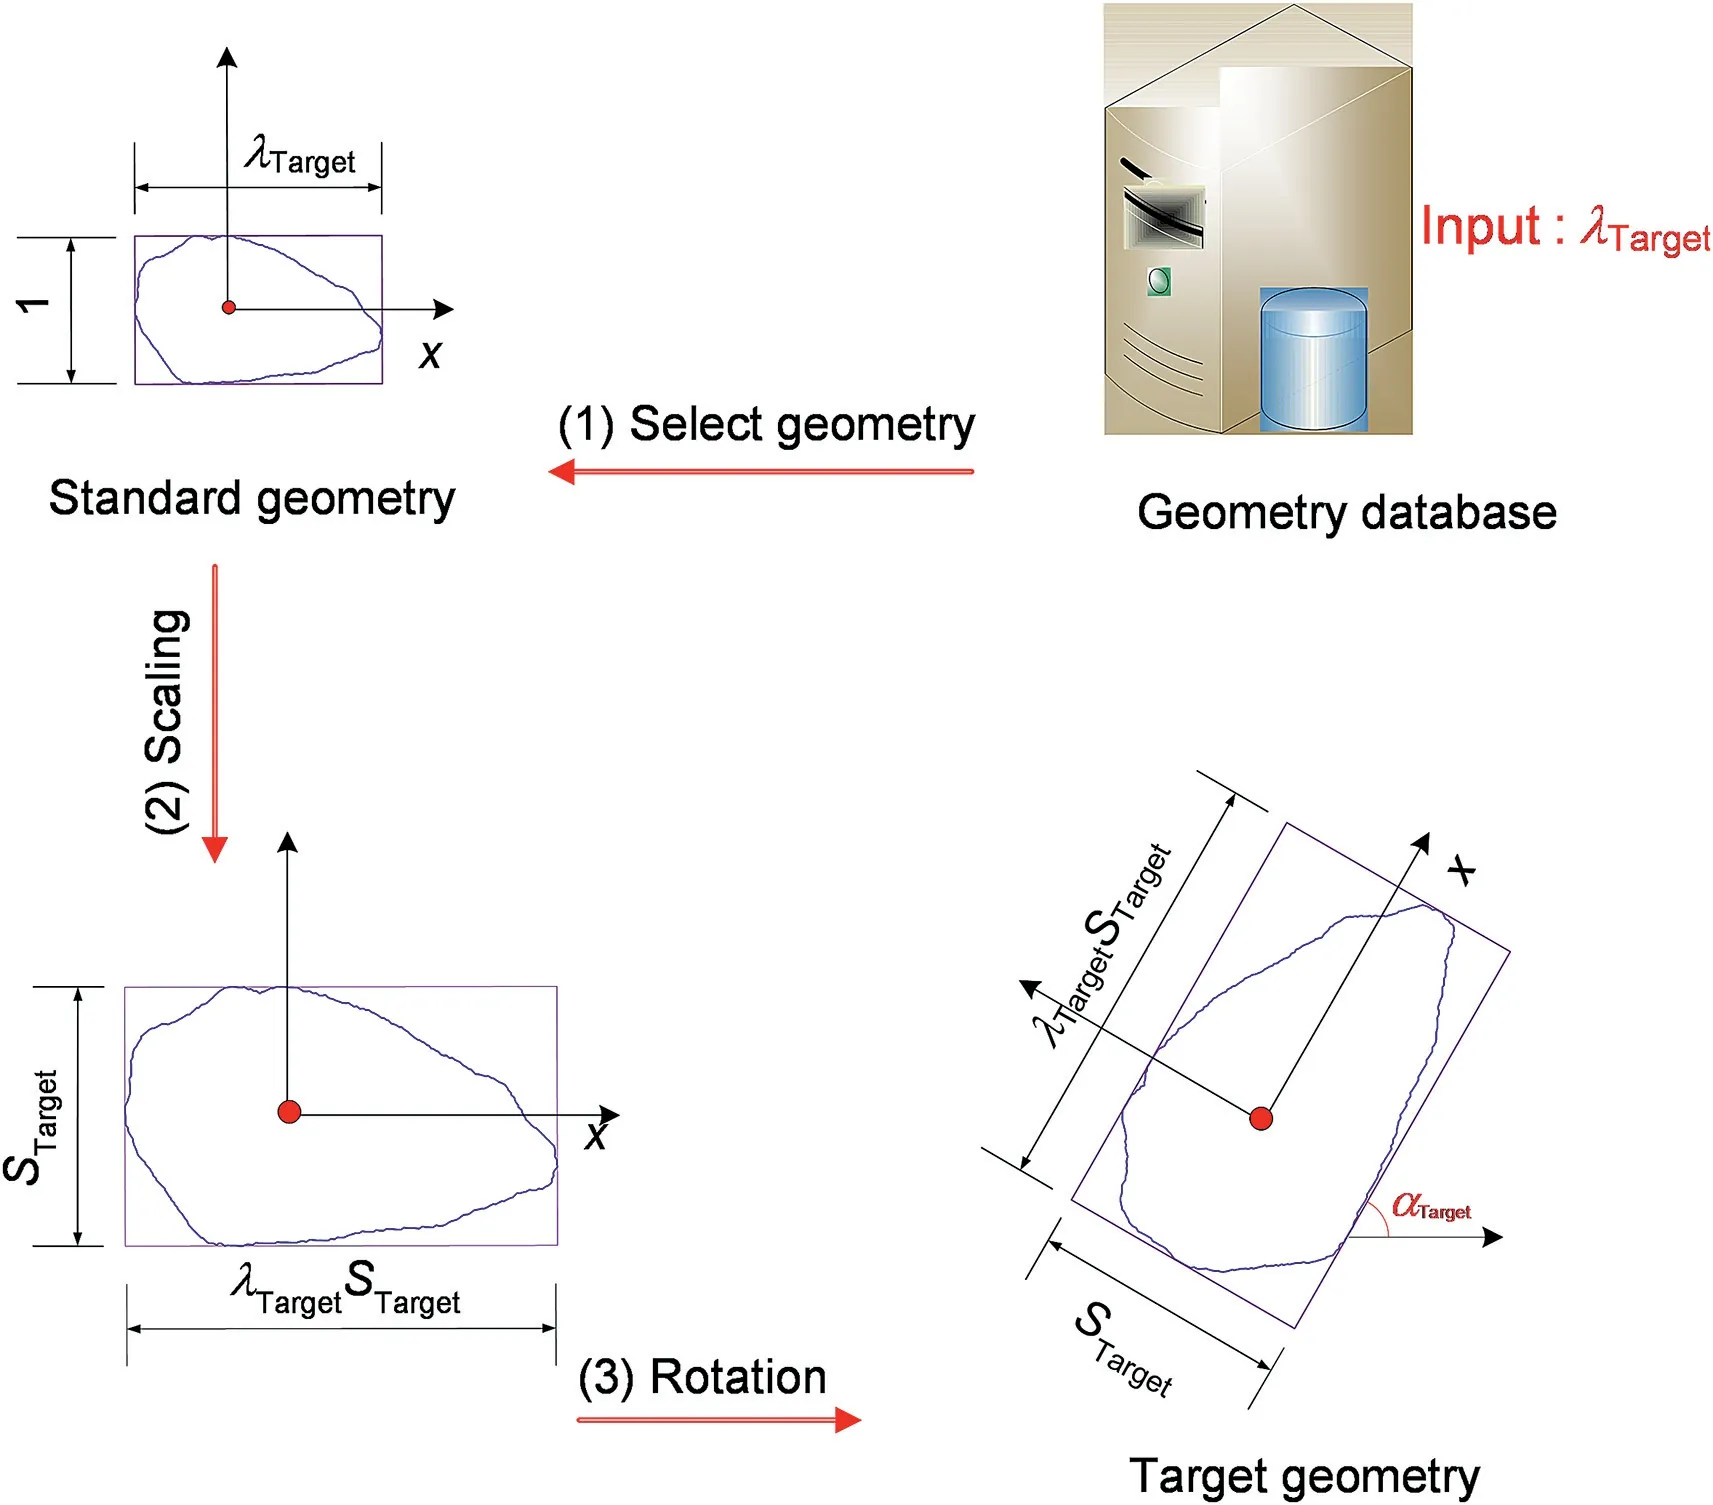
Fig.4.Constructing a target geometry.
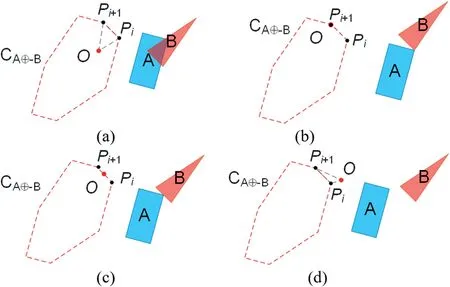
Fig.5.Overlap check between convex polygons A and B based on Minkowski sum A⊕-B:(a)Convex polygon A intersects with convex polygon B,and origin O is in the convex polygon CA⊕-B;(b) A vertex of polygon A is tangent to a vertex of B,and origin O is at the vertex of convex polygon CA⊕-B;(c)A vertex of polygon A is tangent to one edge of B,and origin O is on the edge of convex polygon CA⊕-B;(d)Convex polygon A separates from B,and origin O is outside convex polygon CA⊕-B.
If allAi>0,the origin is inside CA⊕-B;conversely,ifAi<0,the origin is outside CA⊕-B;and ifAi=0,the origin is on the edgePiPi+1of convex CA⊕-B.Therefore,it is easy to check the overlap between convex polygons A and B usingAi.Pseudocode 2 in Appendix A summarises the details of the overlap check between convex polygons A and B.The outputIntersect=-1,0,and 1 indicate different contact states.
3.2.Placing an irregular particle in contact with other particles
The moving path of the centre of particle A is generated when it moves along the boundary of particle B.The moving path can be used to place particle A in contact with other particles.Two moving paths of particle A,sliding along particles B and C,are constructed.The intersection points of the two moving paths are the possible centres of particle A,where particle A can contact particles B and C.
The moving path of the centre sliding along a convex polygon can be constructed by the Minkowski sum A⊕-New’,as shown in Fig.6.First,a convex polygon New’is formed by moving the centre of convex-New to the originO.Second,convex-New’ is generated by rotating convex-New’ 180ºaround the origin.Finally,the moving path is constructed using the Minkowski sum A⊕-New′.
As shown in Fig.7,there are three cases of placing a convex polygon in contact with other convex polygons or lines in two dimensions (2D): a convex polygon in contact with two convex polygons,a convex polygon in contact with a convex polygon and a line,and a convex polygon in contact with two lines.
Pseudocode 3 in Appendix A and Fig.7a show the details of how to place a convex polygonNewin contact with convex polygons A and B.IntersectionsT1andT2correspond to convex polygons CA⊕-New’and CB⊕-New’,respectively,and either may be the centreN.In this study,the particle was packed counterclockwise.Hence,a suitable centreNmakes the directed area of ΔABNlarger.
Pseudocode 4 in Appendix A and Fig.7b illustrate how to place a convex polygonNewin contact with convex polygon A and lineL1L2.LineL1L2is not convex,and it cannot be used to construct the moving path of the centre directly sliding along lineL1L2.An auxiliary pointMis added beneath the lineL1L2to construct triangle ΔL1L2M,which makes it easy to find the final convex-New in contact with ΔL1L2Mand convex polygon A,as shown in Pseudocode 2.The auxiliary pointMis located on the vertical bisector of lineL1L2,and the distance from pointMto lineL1L2is the half-length ofL1L2.
Pseudocode 5 in Appendix A and Fig.7c demonstrate how to place a convex polygonNewin contact with linesL1L2andL2L3.By adding two auxiliary pointsM1andM2,the two auxiliary triangles ΔL1L2M1and ΔL2L3M2are constructed to replaceL1L2andL2L3,respectively.The locus of centre sliding along ΔL1L2M1is CTri1⊕-New’,and the locus of centre sliding along ΔL2L3M2is CTri2⊕-New’.The intersectionsT1andT2of loci CTri1⊕-New’and CTri2⊕-New’are possible positions of the centreN.A suitable centreNcreates a larger directed area of ΔL1L2Nand ΔL2L3N.As shown in Fig.7c,pointT2is selected as the centreNin convex-New.
4.Packing irregular particles with the prescribed statistical distribution,spatial arrangement,and volume fraction
Feng et al.(2003) proposed an AFM for packing disks.Utilising AFM,scholars(Feng et al.,2003;Suhr and Six,2017;Xu et al.,2017)proposed a wrapper method for packing simple polygons and ellipses.However,the wrapper method requires considerable computational time to check the overlap between particles and the packing of particles.Therefore,the current AFM can only pack disks and ellipses at a high packing speed but cannot efficiently pack irregular particles.
This paper proposes a new method for packing irregular particles faster based on the Minkowski sum.Additionally,the generated packing can simultaneously satisfy the desired statistical distribution,spatial arrangement,and volume fraction.
4.1.Packing irregular particles with the prescribed statistical distribution
First,a new AFM for packing irregular particles is proposed by combining AFM with the Minkowski sum.As with other constructive methods,the proposed AFM can pack irregular particles with a prescribed statistical distribution.
The proposed AFM for packing irregular particles in a rectangular region is shown in Fig.8.First,the closed advancing front is divided into two independent arrays (arraysBackandFront).Second,the overlap check of particles is limited to a circular domain,speeding up the overlap detection between particles.The pack direction is from left to right,and the definitions of each part are as follows:
(1) The arrayFrontincludes the right boundary and particles generated in the last row.According to the order of generation,Front(1) is the first in the arrayFrontand one initial boundary for packing the particleNew.
(2) The arrayBackconsists of the left boundary and particles generated in the current row.According to the order of generation,Back(end) is the last of the arrayBackand another initial boundary for packing the particleNew.
(3) The overlap check domain is a circular domain whose centre is the centre of particleNewand radius isRNew+max(RFchoose,RBchoose).RNewis the radius of the minimum circumscribed circle of particleNew.ParticlesFchooseandBchoosebelong to the arraysFrontandBack,respectively.Both are selected boundaries for the packing particleNew.RFchooseis the radius of the minimum circumscribed circle of particleFchoose,andRBchooseis the radius of the circumscribed circle of particleBchoose.If a packed particle is located in the circular domain,the overlap between particleNewand the packed particle is checked (except for particlesFchooseandBchoose).Pseudocode 6 in Appendix A shows the detailed process of the proposed AFM.
(4) The packing boundariesFchooseandBchoosegenerate the initial particleNew.Suppose that the generated particleNewintersectsFront(k) andBack(j).In this case,the packing boundaries are changed asFchoose=Front(k)andBchoose=Back(j),and particleNewis regenerated until the generated particle does not intersect withFrontandBack.
A packing example is shown in Fig.8,where the new particle generated by the initial boundariesFront(1) andBack(end) is particleNew’,which intersects with particleFront(2).Then,Front(2)is selected as the packing boundary to place particleNewagain.
After packing the particleNew,the arraysFrontandBackare changed to pack the next particle.There are three different overlap situations:the particleNewintersects with arrayFront,arrayBack,and the top boundary.The changed arrays,FrontandBack,in the three cases can be seen in Fig.9.
The basic steps of the proposed AFM are illustrated in Fig.10.First,the initial arrayFrontconsists of the bottom and right boundaries,and the initial arrayBackis the left boundary.Second,the desired irregular particleNis generated using Pseudocode 1.Third,the particleNis packed in contact with arraysFrontandBackthrough Pseudocode 6.Then,arraysFrontandBackfor packing the next particle by the number of packing rows are changed,regardless of whetherFront(1)is the right boundary.Fourth,the packing is complete if the number of particles generated in the current row is zero.
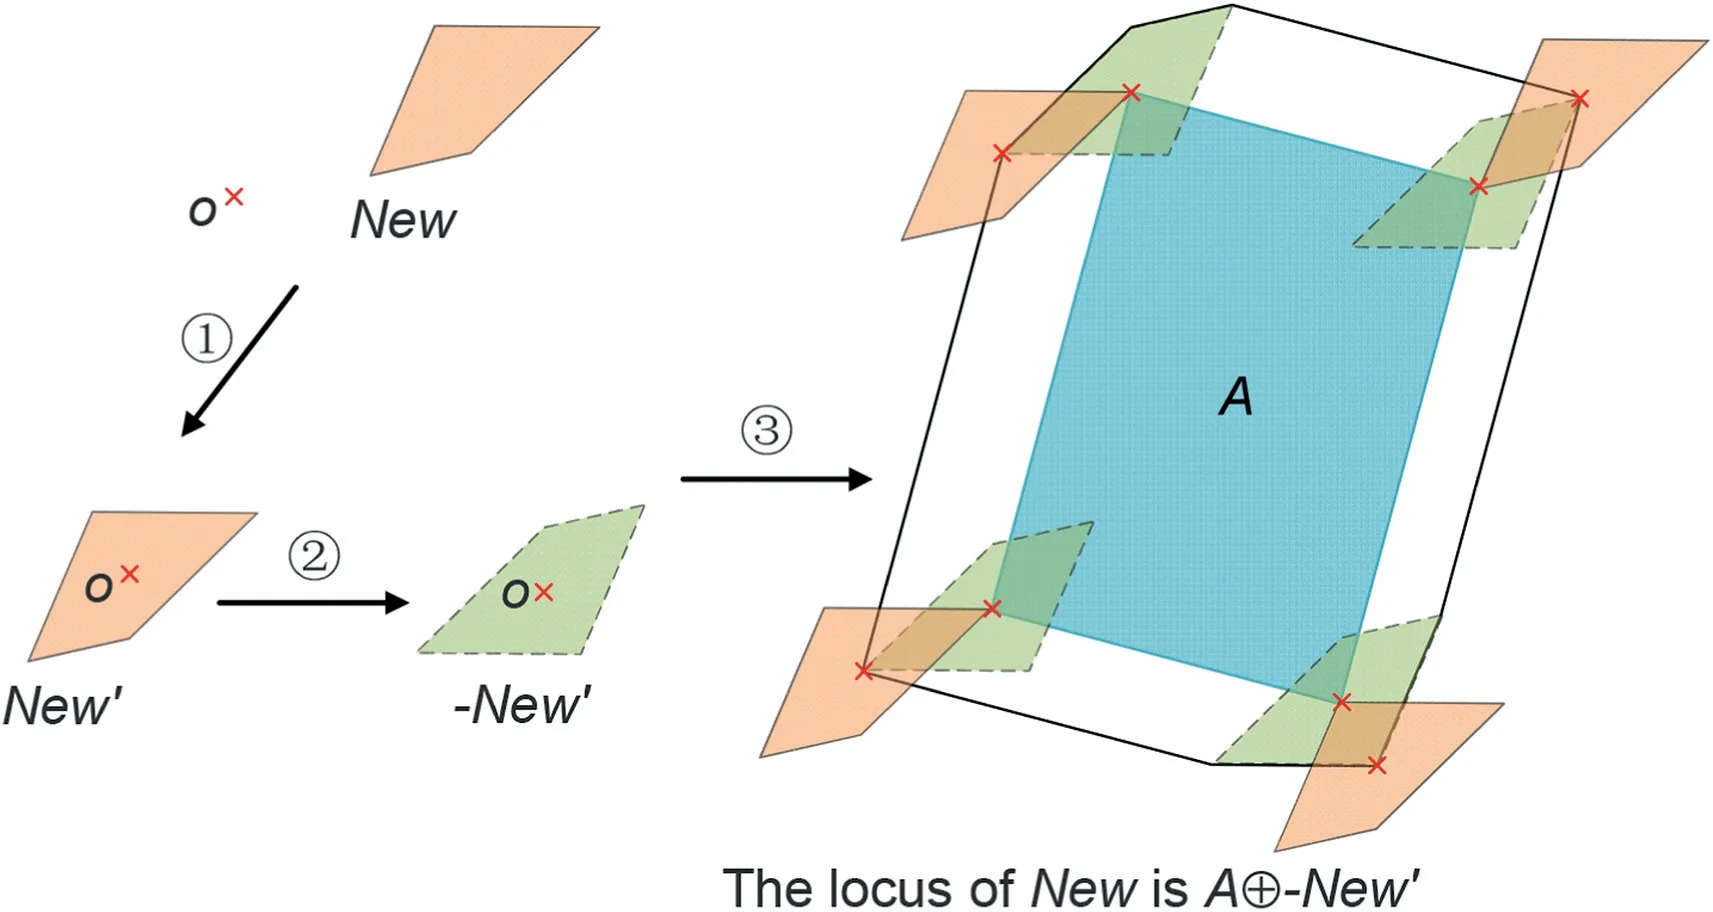
Fig.6.Moving path generated by the centre of convex_New sliding along the convex polygon A.
As a result,irregular convex packing,which adheres to the prescribed statistic distribution for particle size,particle orientation,and aspect ratio is achieved.Practical particle packing is generated by replacing the convex particle with the corresponding realistic particle.
The various methods described in this paper were implemented in a single programme pack called Granular_Gen2D in MATLAB.The input parameter is the geometry of the domain and the prescribed distribution for the particle size,aspect ratio,and particle orientation angle.In this paper,all results were run on a machine with an Intel Processor i7-6700 K,16 GB of RAM,and a Windows 7 operating system.
Several packs of rectangles with different aspect ratios were generated by the proposed AFM in a 200 mm square domain.The aspect ratio λ is constant.The particle orientation α is uniformly distributed from 0 to 2π.The particle size varies uniformly from 0.5 mm to 2 mm.Table 1 shows the results of the rectangle packing.
Table 1 shows that AFM can generate packs with a large number of rectangles at a high packing speed.The speed of packing rectangles is 880-1100 particles/s,and the volume fraction generated is 0.41-0.72.As the aspect ratio increased,the packing speed decreased,and the volume fraction decreased rapidly.
The proposed AFM is also suitable for packing involving irregular convex structures.Several packing tests for packing particles with different edges were conducted in a square 200 mm × 200 mm domain.The packing tests had the same prescribed distributions for particle size,particle orientation,and aspect ratio.The aspect ratio is a constant of 1,the orientation angle α is uniformly distributed from 0 to 2π,and the particle size uniformly varies from 0.5 mm to 2 mm.
The packing results are presented in Table 2.As the edges increased from 3 to 40,the packing speed decreased from 1155.95 particles/s to 247.79 particles/s.Furthermore,the packing speed is still high for particles with 40 edges.
Under the same volume fraction and particle-level statistics,the proposed AFM can generate the same particle packing in different packing domains.The generated granular materials had comparable contact networks.Four square packing tests were performed in four domains:40 mm×80 mm,60 mm× 120 mm,80 mm× 160 mm,and 100 mm × 200 mm.The particle orientation angle was uniformly distributed from 0 to 2π.The particle size uniformly varied from 0.5 to 2 mm.
The coordinate number is the average number of contacts per particle.As shown in Fig.11,the proposed AFM generates similar particle packings in four different domains,given that the particlelevel statistics are the same.The generated particle packings have the same coordinate number,the same distribution of contacts per particle,and a comparable particle orientation distribution.Therefore,the generated packings can have similar contact networks.
Table 3 presents the packing results for each domain.As the packing domain size increased,the number of particles increased,and the volume fraction and coordinate number first increased and then stabilised.The generated particle packing had the minimum number of particles and uniform particle orientation distribution within the 40 mm × 80 mm domain.
4.2.Packing irregular particles with the prescribed spatial arrangement
The signed distance function dist(p) represents a complicated boundary.If pointpis inside the geometry,then the dist(p)sign is negative and vice versa.The complicated boundary can be simplified as a set of line segments in 2D.Then,the distance function of the complex geometry can be calculated by the minimum distance from pointpto the line segments (Persson,2005).
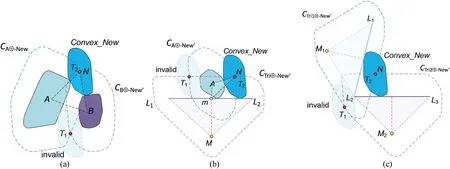
Fig.7.Three cases of placing a convex_New in 2D: (a) Convex_New in contact with two convex polygons;(b) Convex_New in contact with a convex polygon and a line;and (c)Convex_New in contact with two lines.
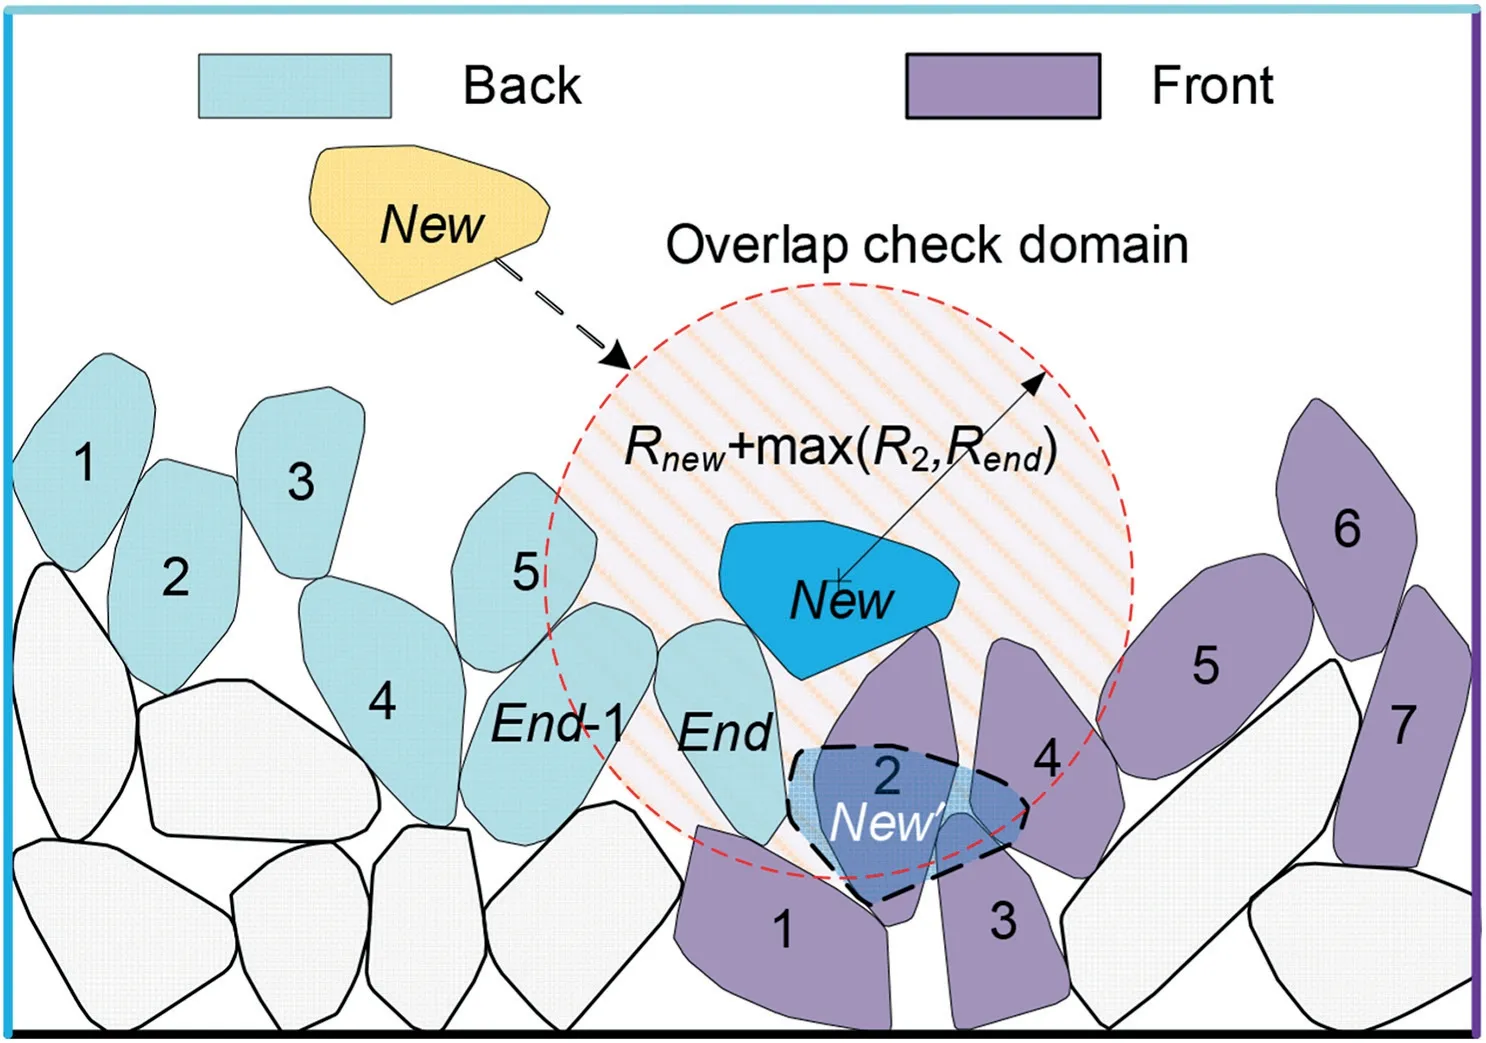
Fig.8.Schematic of the proposed AFM for irregular particles.

In this study,separate projections are used for regionsAandBat signed distances distA(p)and distB(p),respectively.As shown in Eqs.(5)-(7),the three functions combine the signed distance function of two regions to generate the signed distance function of a more complicated region.As shown in Fig.12a and b,a cow-like geometry is formed in several regions.Using Eqs.(5)-(7),the signed distance of the cow geometry is created,as shown in Fig.12c.The signed distance can accurately represent the original geometry of the cow.
The signed distance function can be used to control the particle size,orientation,and aspect ratio of irregular particles to facilitate conformance to the prescribed spatial arrangement.Before placing an irregular particle in contact with the packing boundaries,the centre of the irregular particles is unclear and cannot easily be used to control the particle dimensions.
Fortunately,the packing boundariesFchooseandBchooseare fixed,which provides a rough estimate of the particleNewcentre.The rough location of the particle centre and the signed distance function can provide the particle dimensions with the prescribed spatial arrangement.Pseudocode 7 in Appendix A explains how to generate the particleNewwith a prescribed spatial arrangement for the required particle size.
Pseudocode 7 also generates particles with a prescribed spatial arrangement for a given particle orientation and aspect ratio.Moreover,Pseudocode 7 can be added before Pseudocode 6 in the flow chart of the proposed AFM,as shown in Fig.10.Then,the packed irregular particles can satisfy the prescribed spatial arrangement.
4.3.Packing irregular particles with the prescribed volume fraction
Unfortunately,AFM is a constructive method that does not allow particle rotation and motion.Therefore,as can be seen inTables 1 and 2,AFM has a high packing speed but produces a low volume fraction.
The optimised AFM(OAFM)is proposed to increase the volume fraction by optimising the packing boundaries and particle orientation.Furthermore,by tuning the parameters,OAFM can generate a prescribed volume fraction.The following is a detailed description of the OAFM.
4.3.1.Optimising packing boundary
The OAFM allows particle motion along a local advancing front to generate a high volume fraction.The local advancing frontLocalhas 2Nlocboundaries.LocalselectsNlocparticles from the arrayFrontandNlocparticles from the arrayBack.The AFM packs a particle in contact with two adjacent boundaries;thus,there are 2Nloc-1 combinations for packing particleNewon the local advancing front.The optimal boundary combination produces particleNewwith minimum potential energy.The steps for selecting the optimal boundaries are as follows:
(1) Step 1: construct a local advancing frontLocalwith 2Nlocmembers
The construction can be divided into four cases according to the number of arraysBackandFront:
(i) WhenNBack>NlocandNFront>Nloc,Localis constructed by theNlocmembers from the arrayBack(NBack-Nloc+1)-Back(end) andNlocmembers from the arrayFront(1)-Front(Nloc).
(ii) WhenNBack
(iii) WhenNBack>Nloc,NFront
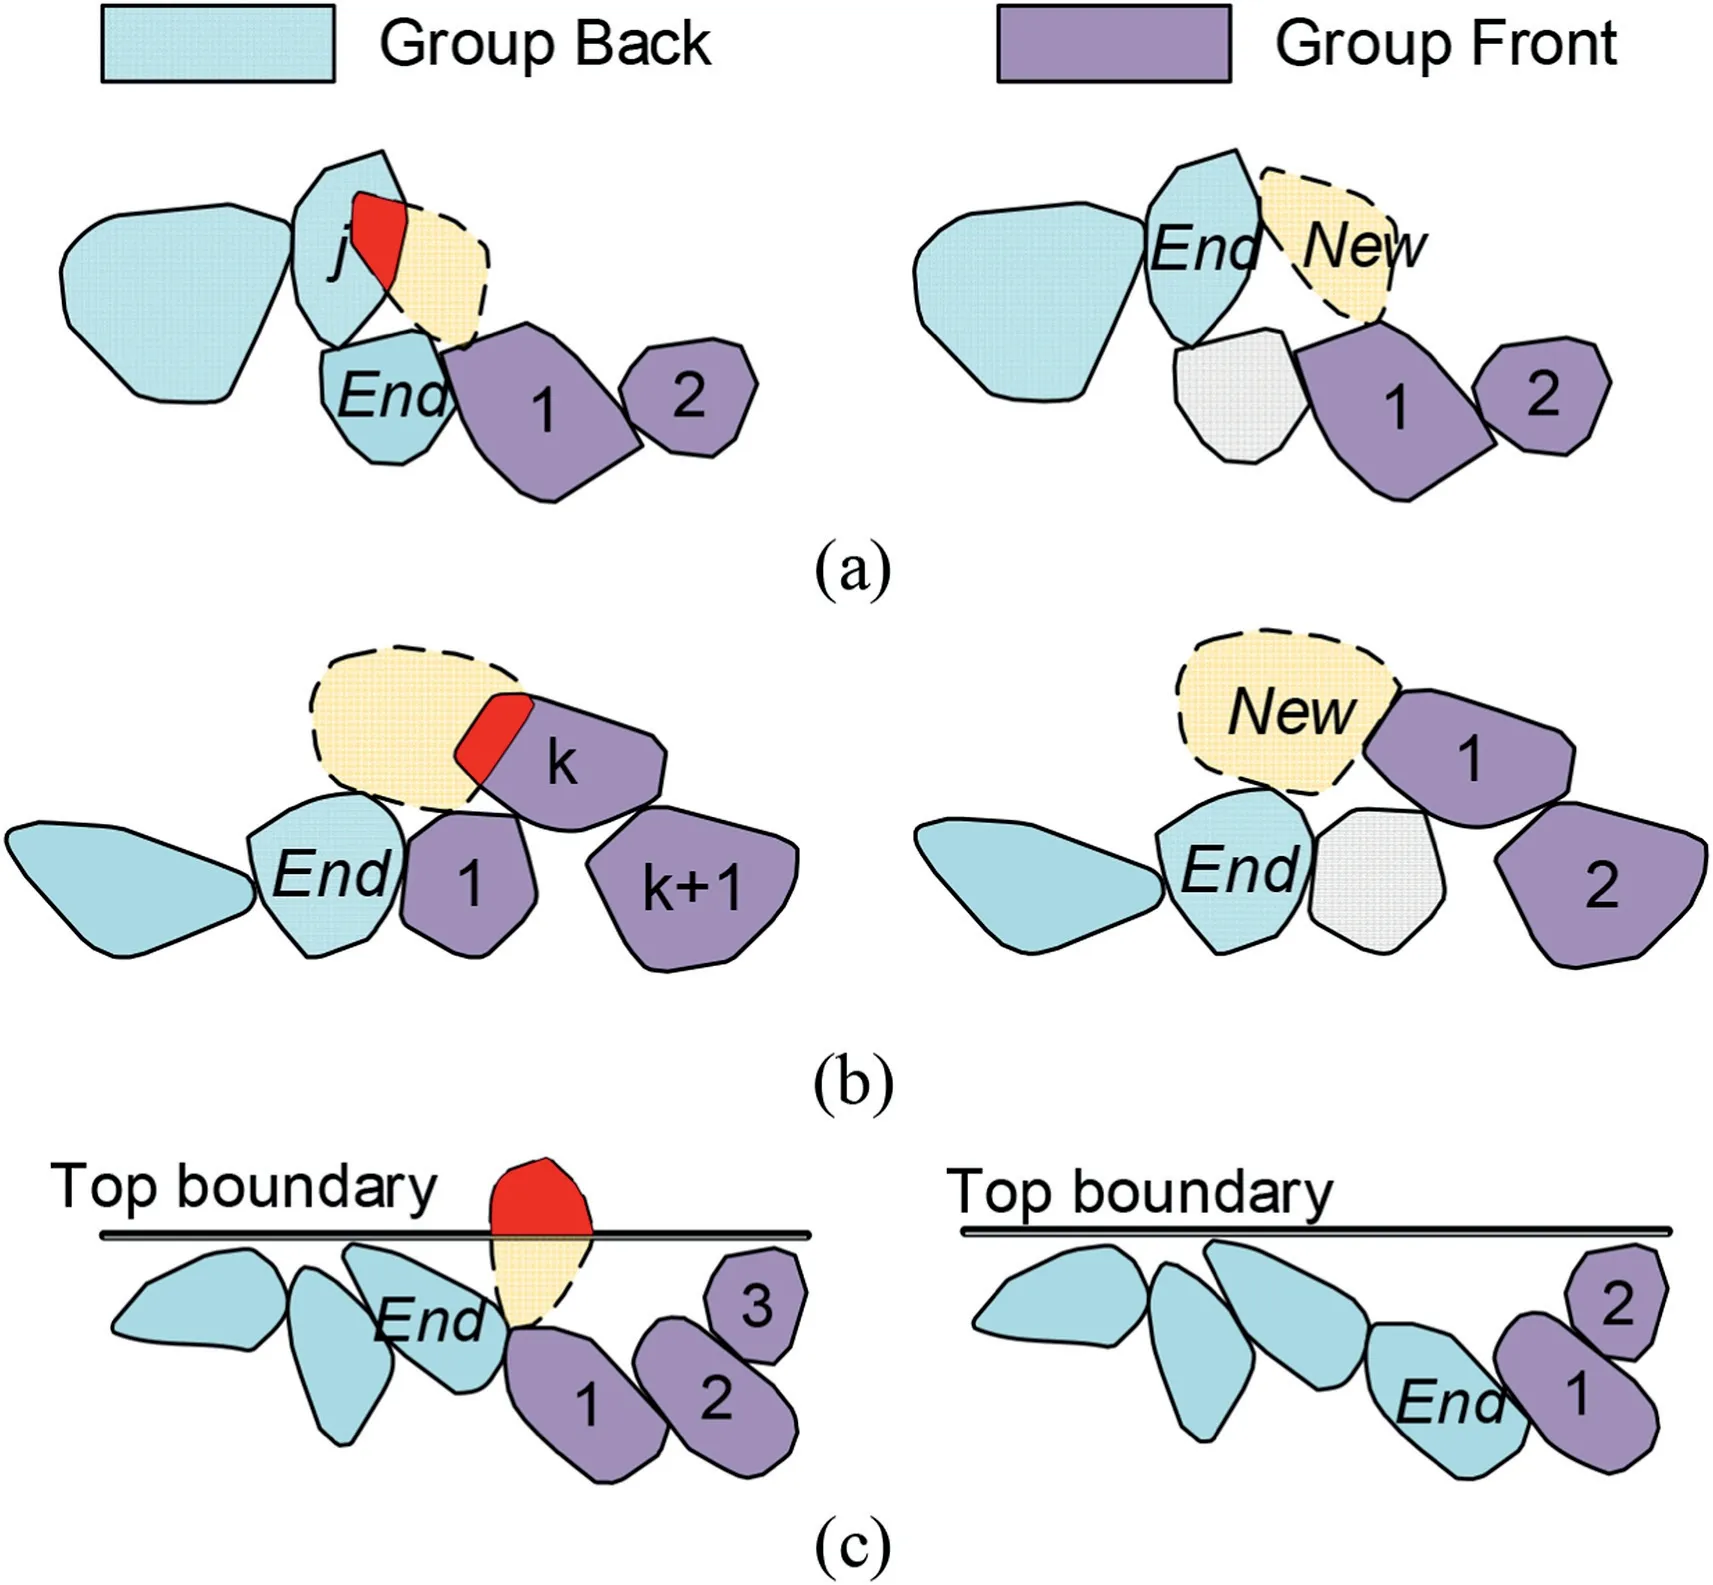
Fig.9.Three cases of particle New intersecting with the particle in advancing front: (a)Particle New intersects with the jth particle of array Back;(b)Particle New intersects with the kth particle of array Front;and (c) Particle New intersects with the top boundary.
(iv) WhenNBack+NFront≤2Nloc,Localis constructed by arraysBackandFront.
An illustration of boundary optimisation is shown in Fig.13.It isNloc=4,and there are eight boundaries in the local advancing front.After making the local advancing frontLocal,FrontandBackare changed by deleting these boundaries inLocal.
(2) Step 2: Select the optimal packing boundaries
On local advancing frontLocal,there are 2Nloc-1 initial particlesNigenerated by the AFM.The optimal particleNewis the particlePoptimal,which has the minimum potential energy.The optimal boundaries areoptimalandoptimal+1 in the local advancing front.As shown in Fig.13c,the optimal particle isP1,and the first and second local advancing fronts are the optimal boundaries.
(3) Step 3:Based on the optimal packing boundaries,change the arraysFrontandBack,and pack the new particle
The local advancing front is segmented into two parts according to the optimal packing boundaries,iandi+1.The 1 toimembers are added to the end of arrayBack,and the rest are added to the beginning of the arrayFront.Then,particleNewis packed by the changed arraysFrontandBack.
As shown in Fig.13a and d,there is an apparent difference between the original advancing front and the changed advancing front(arraysBackandFront).Pseudocode 8 in Appendix A indicates the essential details for selecting the optimal packing boundaries.
The optimisation parameter for optimising the packing boundaries isNloc(half-size of the local advancing front).The generated volume fraction increases asNlocincreases.The packing boundaries can be optimised by replacing Pseudocode 6 with Pseudocode 8,as shown in Fig.10.
4.3.2.Optimising particle orientation
AFM does not allow particle rotation;thus,it cannot pack particles with a high volume fraction.As illustrated in Fig.14a and b,the packing position of particleNewvaries with the particle orientation α.There is an optimal orientation αoptimalfor placing particleNewwith minimum potential energy.The optimal particle orientation αoptimalis the key to increasing the volume fraction.
In this study,the optimal orientation αoptimalselected from several optional angles was not a result of particle rotation.To obtain the optimal orientation αoptimal,an orientation set αiwithNangleangles was established(0<αi<180º,i=1,2,…,Nangle).The orientation set αigeneratesNangletrial particlesPi.The optimal particlePoptimalhas minimum potential energy.The corresponding optimal particle orientation αoptimalis the optimal angle.To ensure that the optimal angle αoptimalsatisfies the desired distribution,orientation set αishould be constantly changed by the current distribution.
Pseudocode 9 in Appendix A explains how to select the optimal angle αoptimaland make it follow a prescribed distribution.
The number of binsNbindivides the angle set αiintoNbinbins with a uniform width.A largerNbindecreases the difference between the generated and prescribed distributions;the defaultNbin=24.Thus,the prescribed probabilitypro_Tjand generated probabilitypro_Gjare generated.For a binBjwithpro_Gj-pro_Tj<0,it is necessary to add angles to follow the target distribution;therefore,orientation set αiwill selectNjangles randomly in binBj.In addition,asNangleand the absolute value ofpro_Gj-pro_Tjincrease,the selectedNjincreases.
The particle orientation was optimised by replacing Pseudocode 6 with Pseudocode 9,as shown in Fig.10.As a result,optimising the particle orientation can increase the volume fraction,and the generated particle packing can follow the prescribed distribution for particle orientation.The optimisation parameter isNangle(the number of orientation set angles αi).AsNangleincreases,the volume fraction increases.There areNangle-1 invalid packings for packing a particle,thus an increase inNanglewill decrease the packing rate.
4.3.3.Optimising both packing boundaries and particle orientation
Optimising the packing boundaries and particle orientation can increase the volume fraction generated by AFM.Moreover,optimising the packing boundaries and optimising the particle orientation are performed independently.By optimising the packing boundaries before selecting the optimal particle orientation,this study optimised both packing boundaries and particle orientation.Then,four different packing methods were constructed by optimising the packing boundaries and the particle orientation.
Several packing tests were generated using four different packing methods in a square 200 mm × 200 mm domain.The particle shape is the same rectangle for each packing test,and the particle size is uniformly distributed from 0.5 mm to 2 mm.The particle orientation α is uniformly distributed from 0ºto 180º,and the aspect ratio is constant.The number of orientation setsNangleis 24,and the half-size of the local advancing frontNlocis 20.Fig.15 shows the packing results.
As shown in Fig.15a,compared to the packing result generated by no optimisation,the volume fraction generated by optimising the boundary and optimising the orientation angle has nearly the same increment.The increment is 0.05-0.2.The volume fraction decreased as the aspect ratio increased.But the increment of volume fraction generated by optimisation increased as the aspect ratio increased.Moreover,the improved volume fraction created by the optimised boundary and the optimised orientation can be superimposed.The increment in volume fraction generated by optimising both boundary and particle orientation is 0.1-0.25 and is the most significant increment.However,the packing speed drastically decreased,as shown in Fig.15b and Table 2.Optimising both the packing boundary and particle orientation results in the highest volume fraction and lowest packing speed.The highest volume fraction was 0.831 for several packing tests.
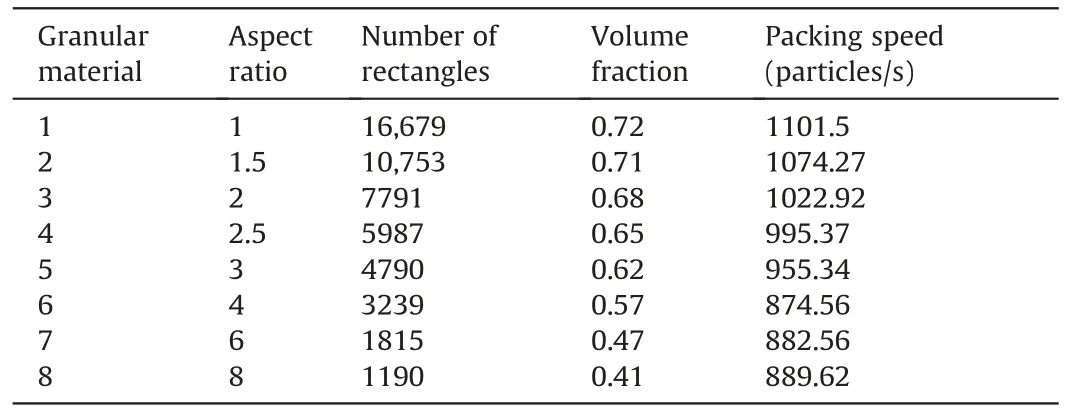
Table 1 Packing results of rectangle packs with different aspect ratios.
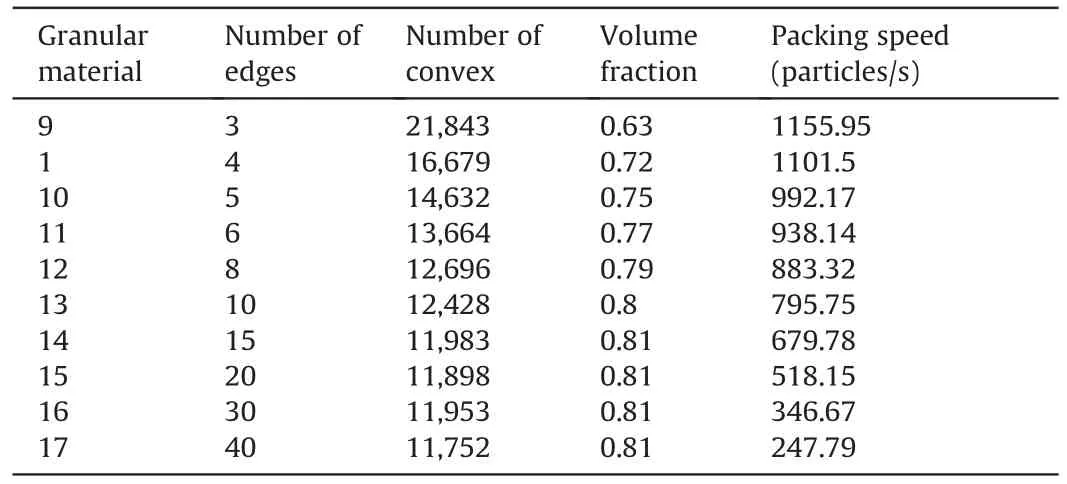
Table 2 Packing results of convex structure with different edges.

Table 3 Packing results in different packing domains.
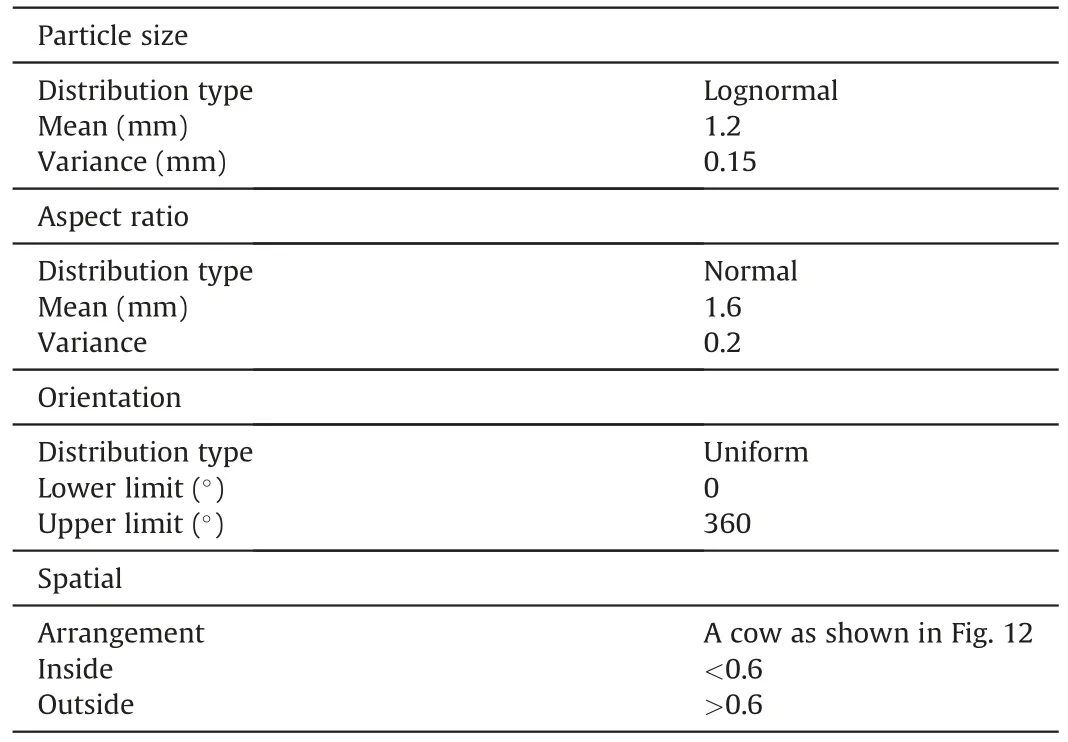
Table 4 Parameter of distribution generated in the example.
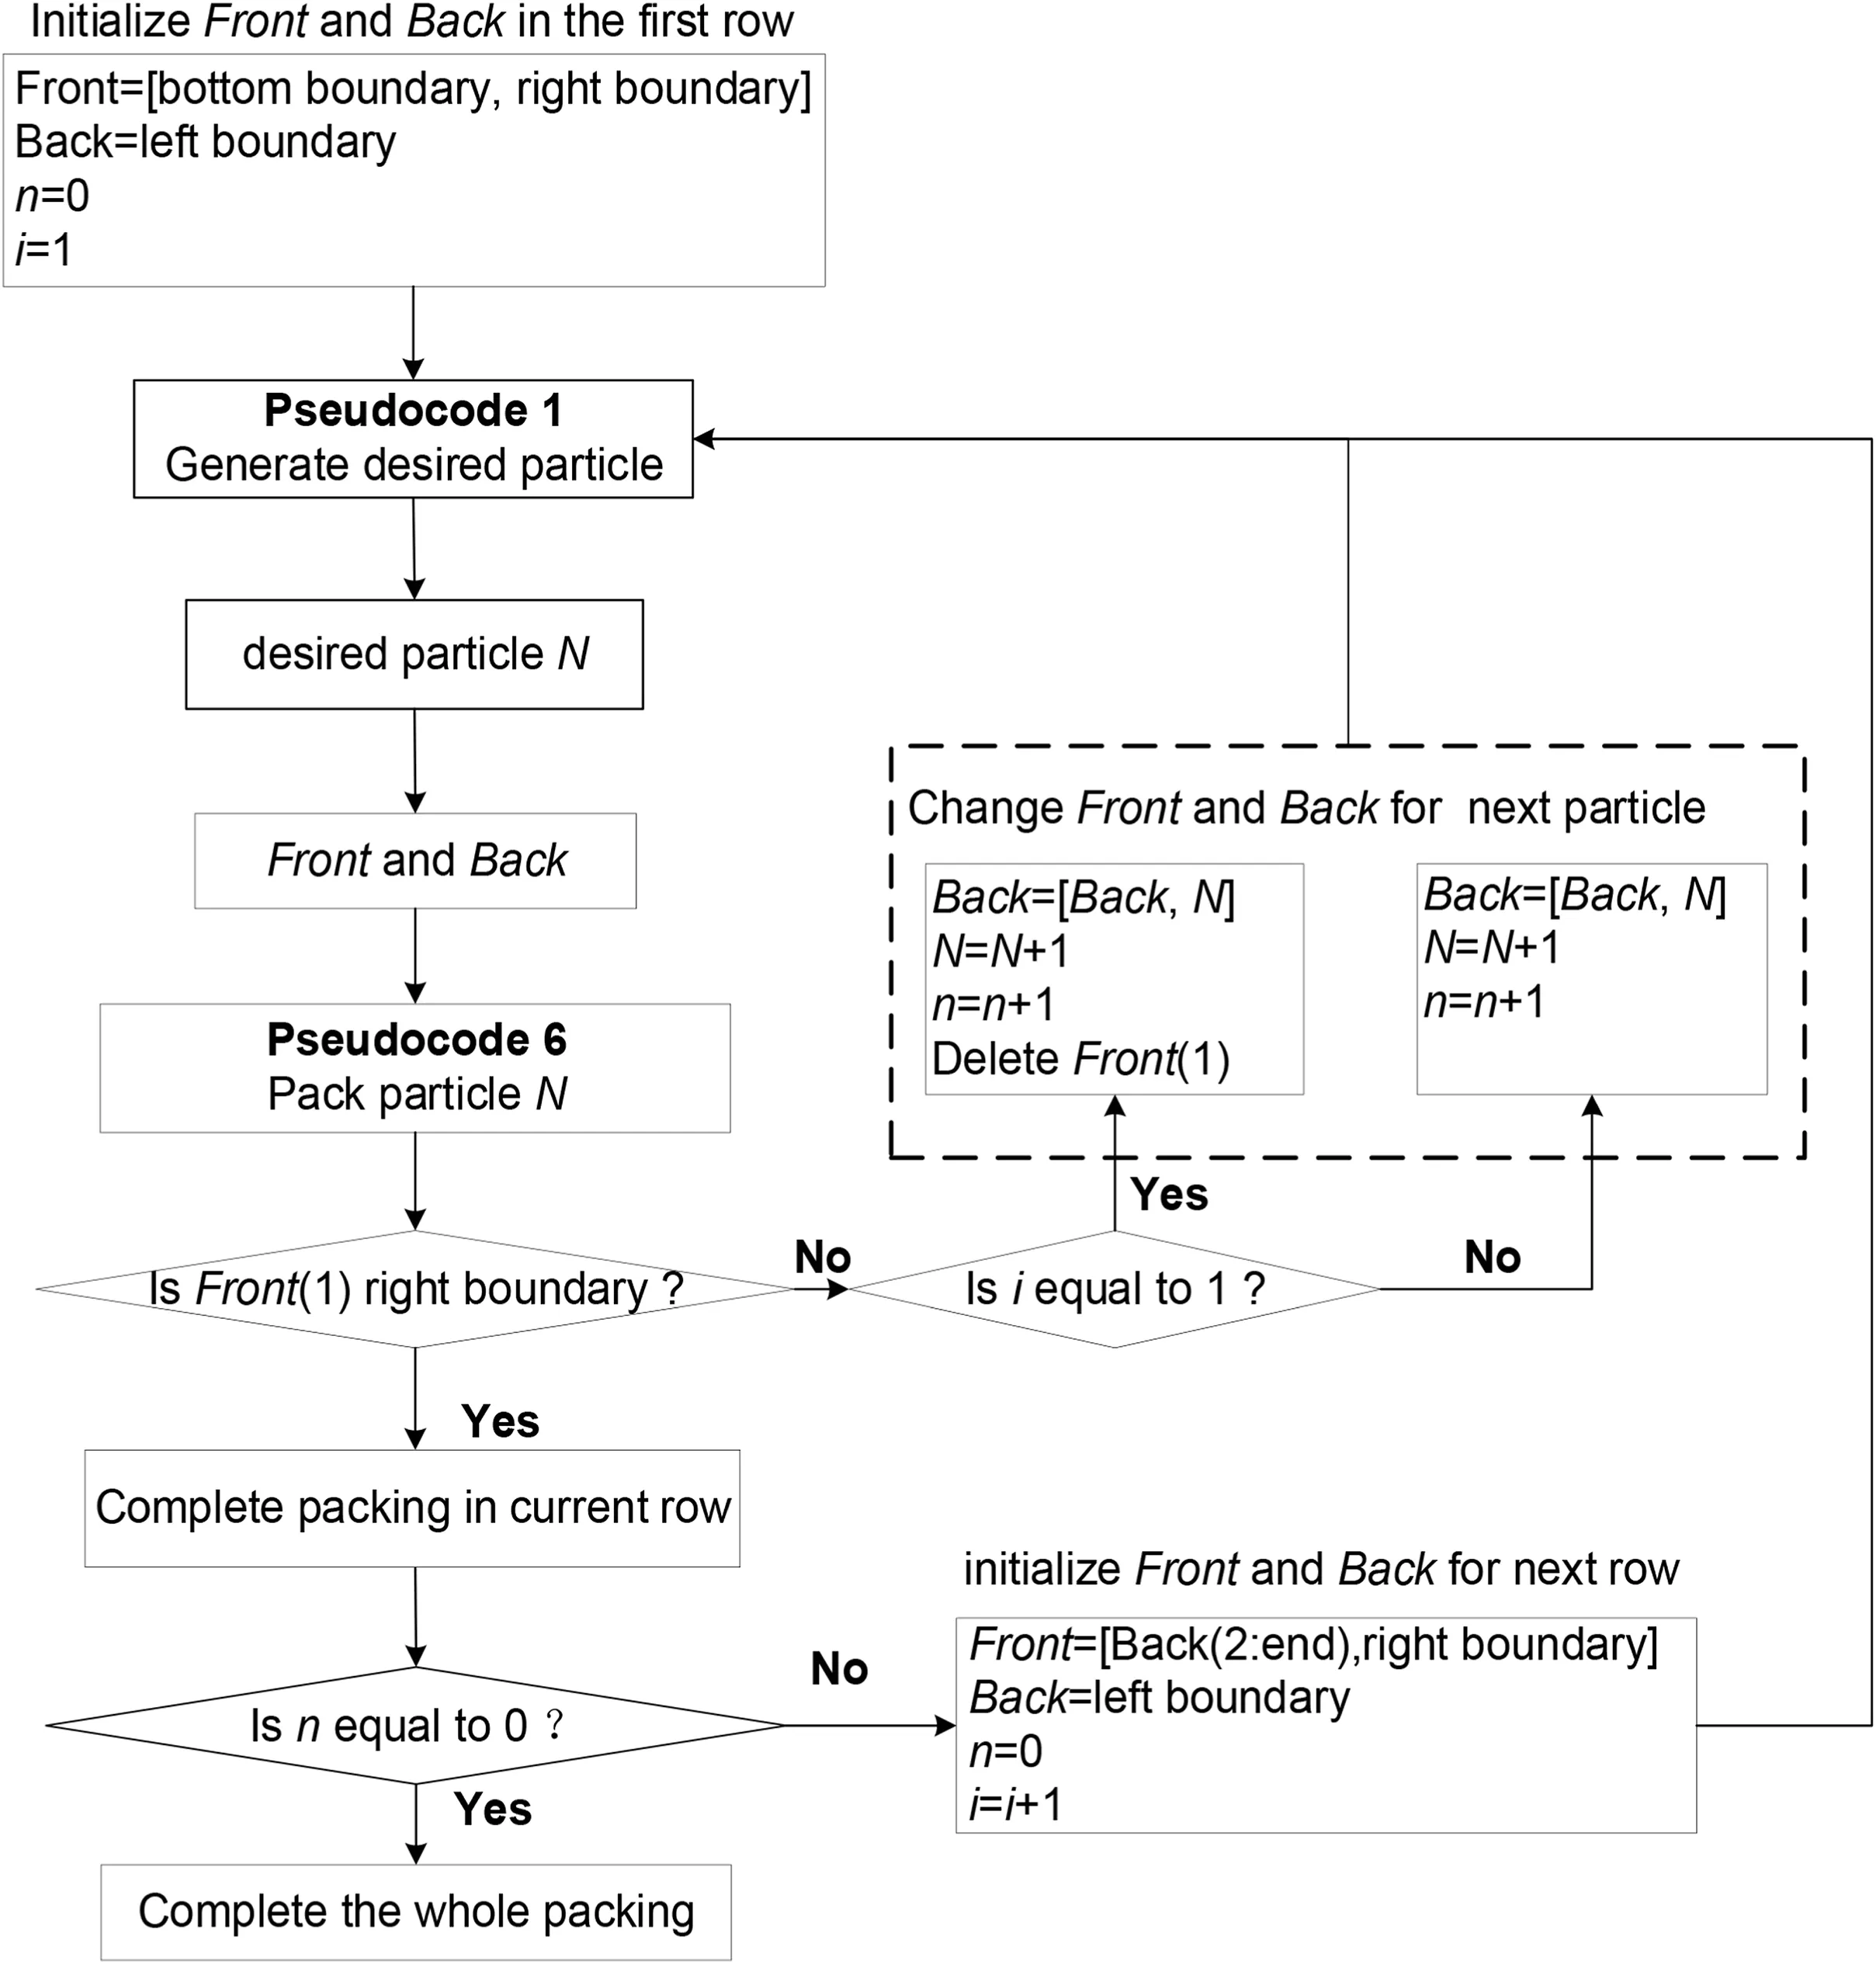
Fig.10.Flow chart of the AFM for packing irregular particles. N is the total number of generated particles, n is the number of particles generated in the current row,and i is the number of packing rows.Front(1)is the first of the group Front,Back(end)is the last of the array Back.Back=[Back,N]indicates that particle N is added to the end of the array Back.Back(2:end) contains all the particles in the array Back.
4.3.4.Tuning parameters for generating the prescribed volume fraction
The optimal parametersNangleandNlocare the key factors for increasing the volume fraction.WhenNangle=1 andNloc=1,there is no optimisation.WhenNangle=1 andNloc>1,the packing method only optimises the packing boundary,WhenNangle>1 andNloc=1,the packing method only optimises the particle angle;and whenNangle>1 andNloc>1,the packing method optimises both the packing boundary and particle orientation.
In a square domain,several packing tests are generated using different optimal parameters,i.e.NangleandNloc.For each packing test,the uniform particle size was between 0.5 mm and 2 mm,uniform particle orientation varied from 0ºto 180º,and the aspect ratio was 1.5.As shown in Fig.16a,the volume fraction generated increases with increases inNangleandNloc.AsNangleandNlocreach a certain level,the generated volume fraction reaches the maximum value and remains largely the same.
The volume fraction generated withNangle=1 andNloc=1 is the lower limitVlower.The volume fraction generated withNangle=24 andNloc=20 may be the upper limitVupper.By tuningNangleandNloc,the volume fraction generated can be almost equal to the prescribed volume fraction in the range fromVlowertoVupper.
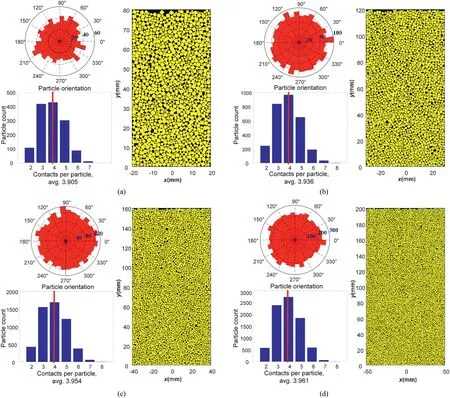
Fig.11.Particle packings and contact works in four rectangle domains:(a)1301 particles in the domains with a size of 40 mm×80 mm;(b)2894 particles in domains with a size of 60 mm × 120 mm;(c) 5260 particles in the domains with a size of 80 mm × 160 mm;and (d) 8203 particles in the domains with a size of 100 mm × 200 mm.
Notably,the particle geometries,distribution of particle orientation,aspect ratio,and particle size restrictVlowerandVupper.Therefore,the volume fraction generated byNangleandNloccannot exceed this range.The easiest way to obtain a prescribed volume fraction is to conduct several packing tests with different values ofNangleandNlocand then plot the contour of the volume fraction aboutNangleandNloc.Then,the suitableNangleandNlocfor generating the prescribed volume fraction can be selected.It is beneficial to model granular materials with a specified density,such as loose and dense granular materials.
Above all,the proposed OAFM can pack irregular particles with the prescribed statistical distribution,desired spatial arrangement,and target volume fraction.The proposed AFM is a basic version of OAFM,and it can pack particles at the highest packing speed but generates the lowest volume fraction.
However,it is difficult to use the Minkowski sum to pack nonconvex particles directly;therefore,the proposed method cannot pack them directly.Fortunately,nonconvexity can be simplified as a convexity.The convexity is generated by the nonconvex particle vertex and wraps the entire nonconvex particle.Then,based on the convex packing generated by the proposed OAFM and the geometry database established in Section 2,a nonconvex packing can be constructed by replacing the convex packing with the corresponding nonconvexpacking in the geometry database.In addition,the generated nonconvex packing adheres tothe same prescribed statistical distribution,spatial arrangement,and volume fraction as the convex packing.

Fig.12.Signed distance to the complex boundary of the cow: (a) The black-and-white graph of a cow;(b) The polylines of the cow;and (c) The contour of signed distance to the complex boundary of the cow.
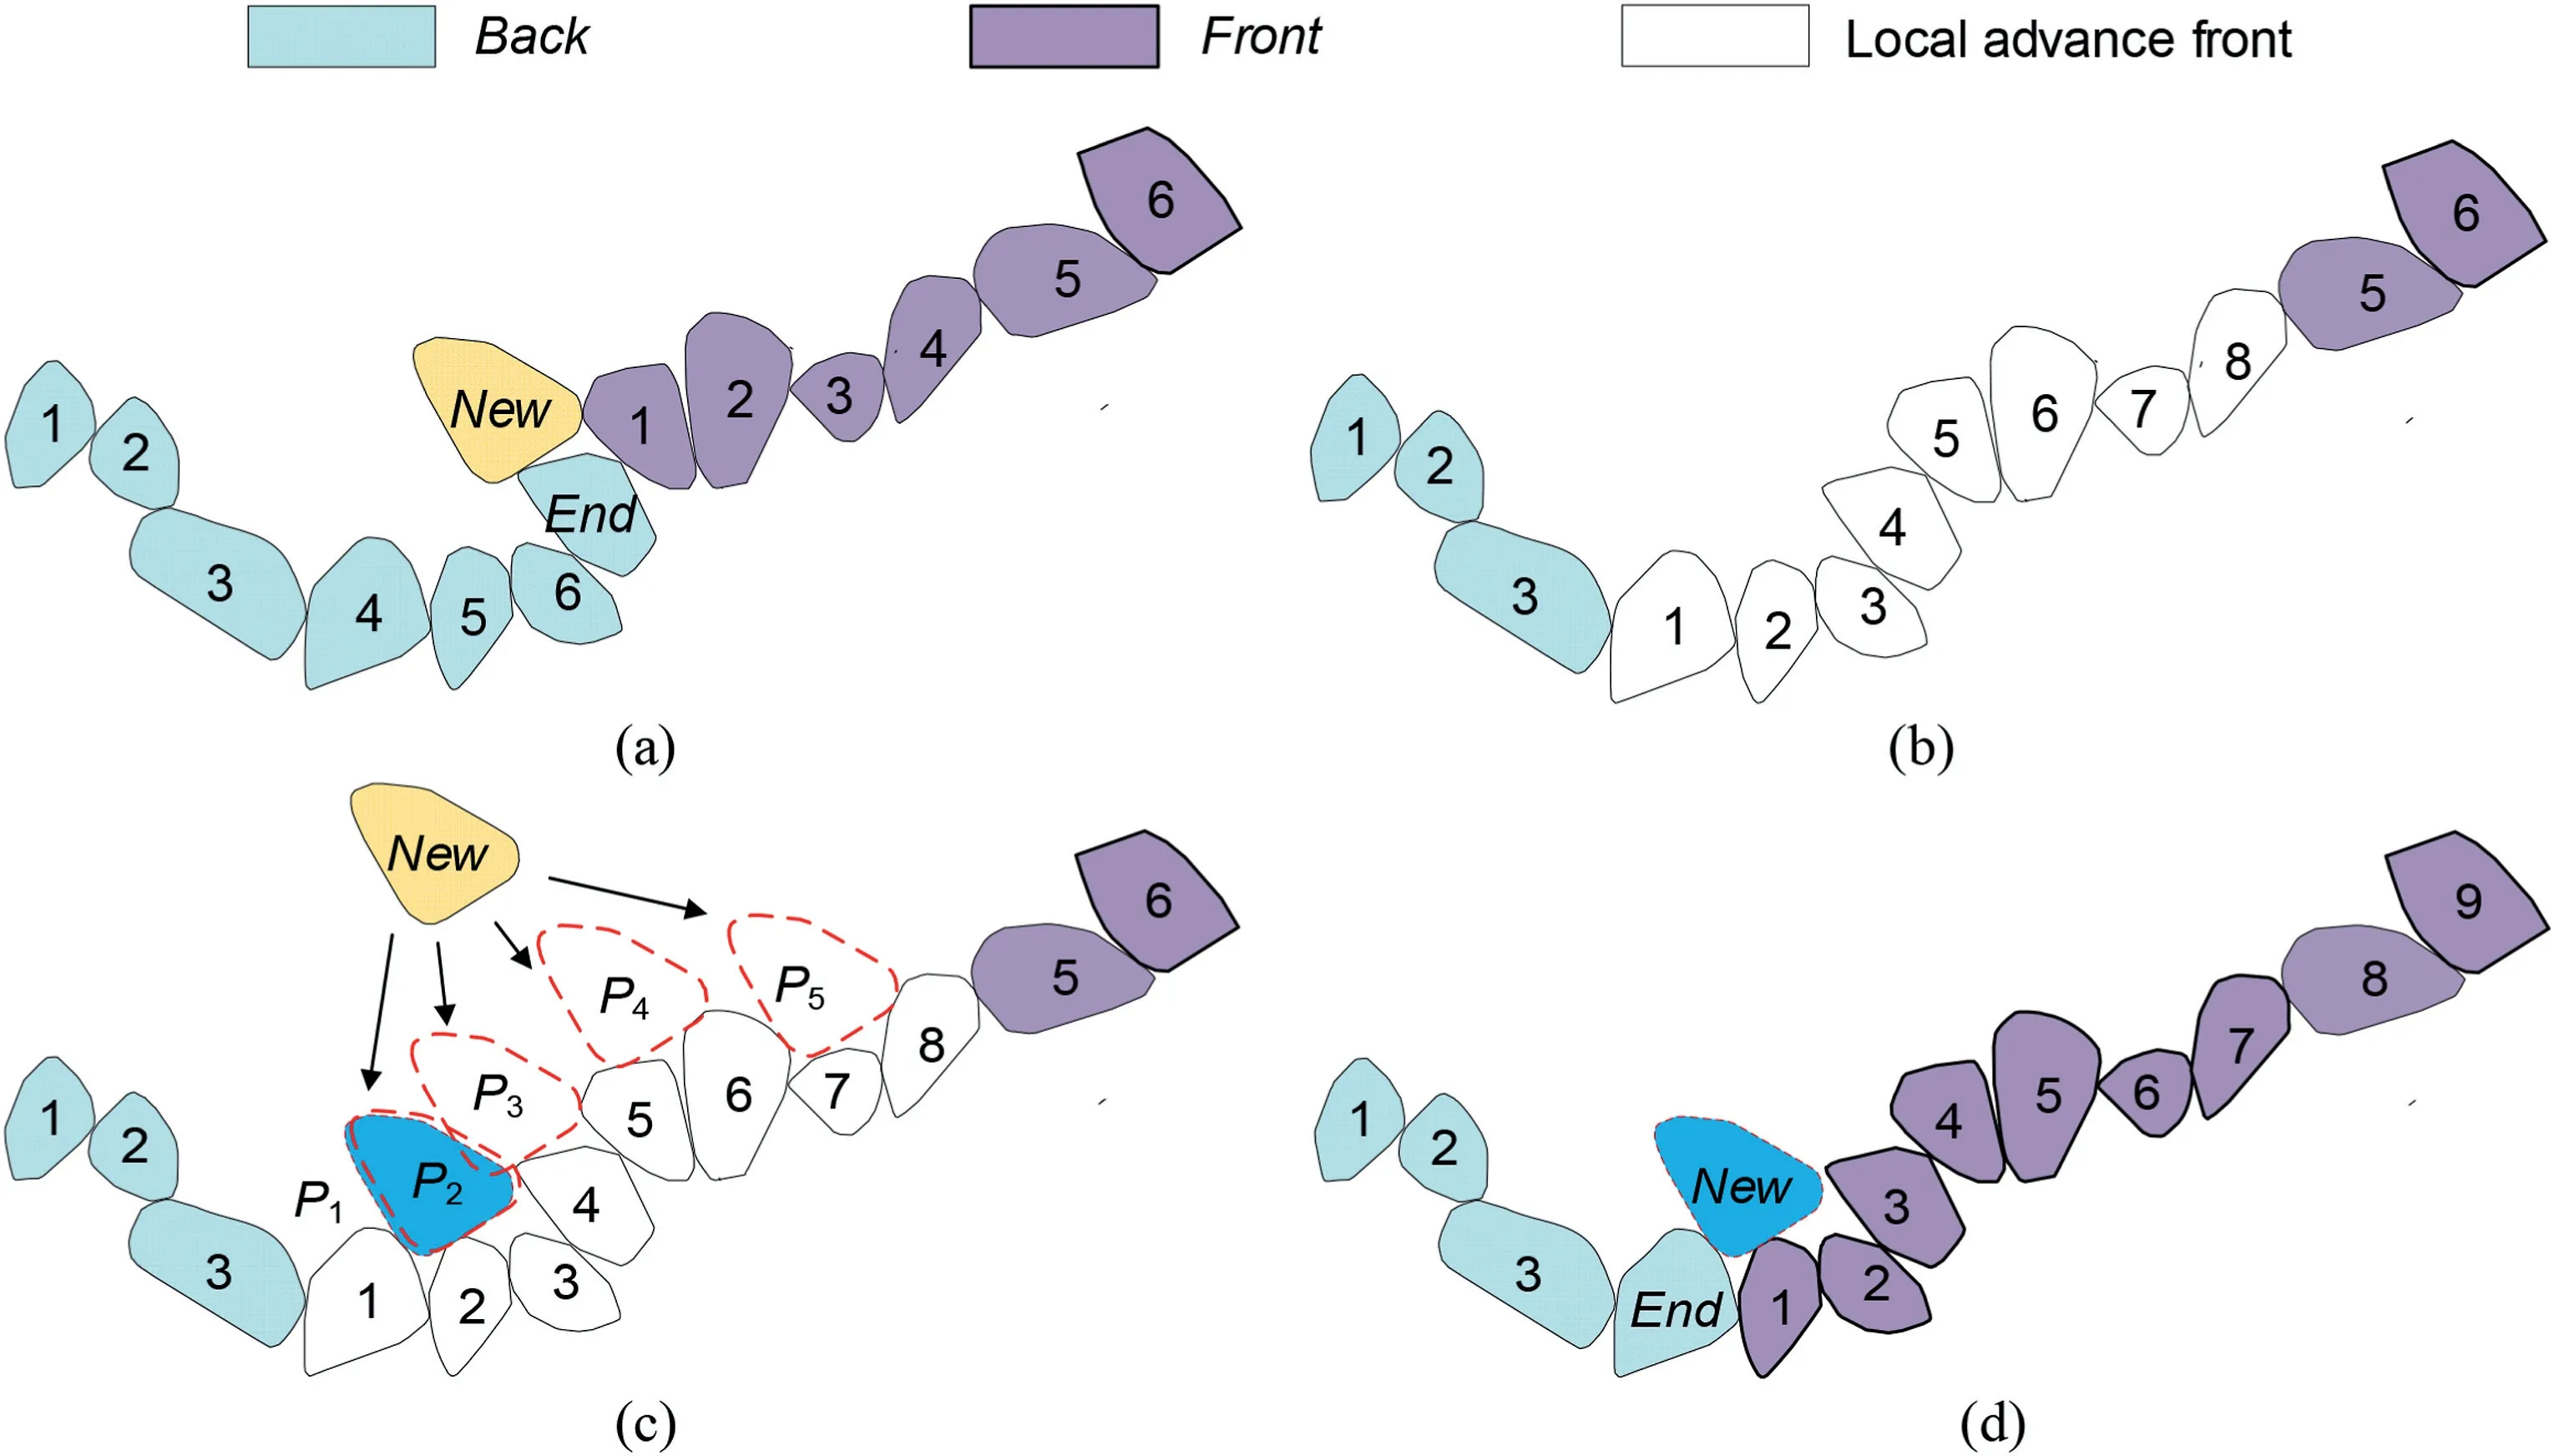
Fig.13.Schematic of boundary optimisation: (a) The original packing boundary;(b) The local advancing front;(c) Selection of the optimal packing boundaries;and (d) Packing particle New and changing arrays Back and Front.
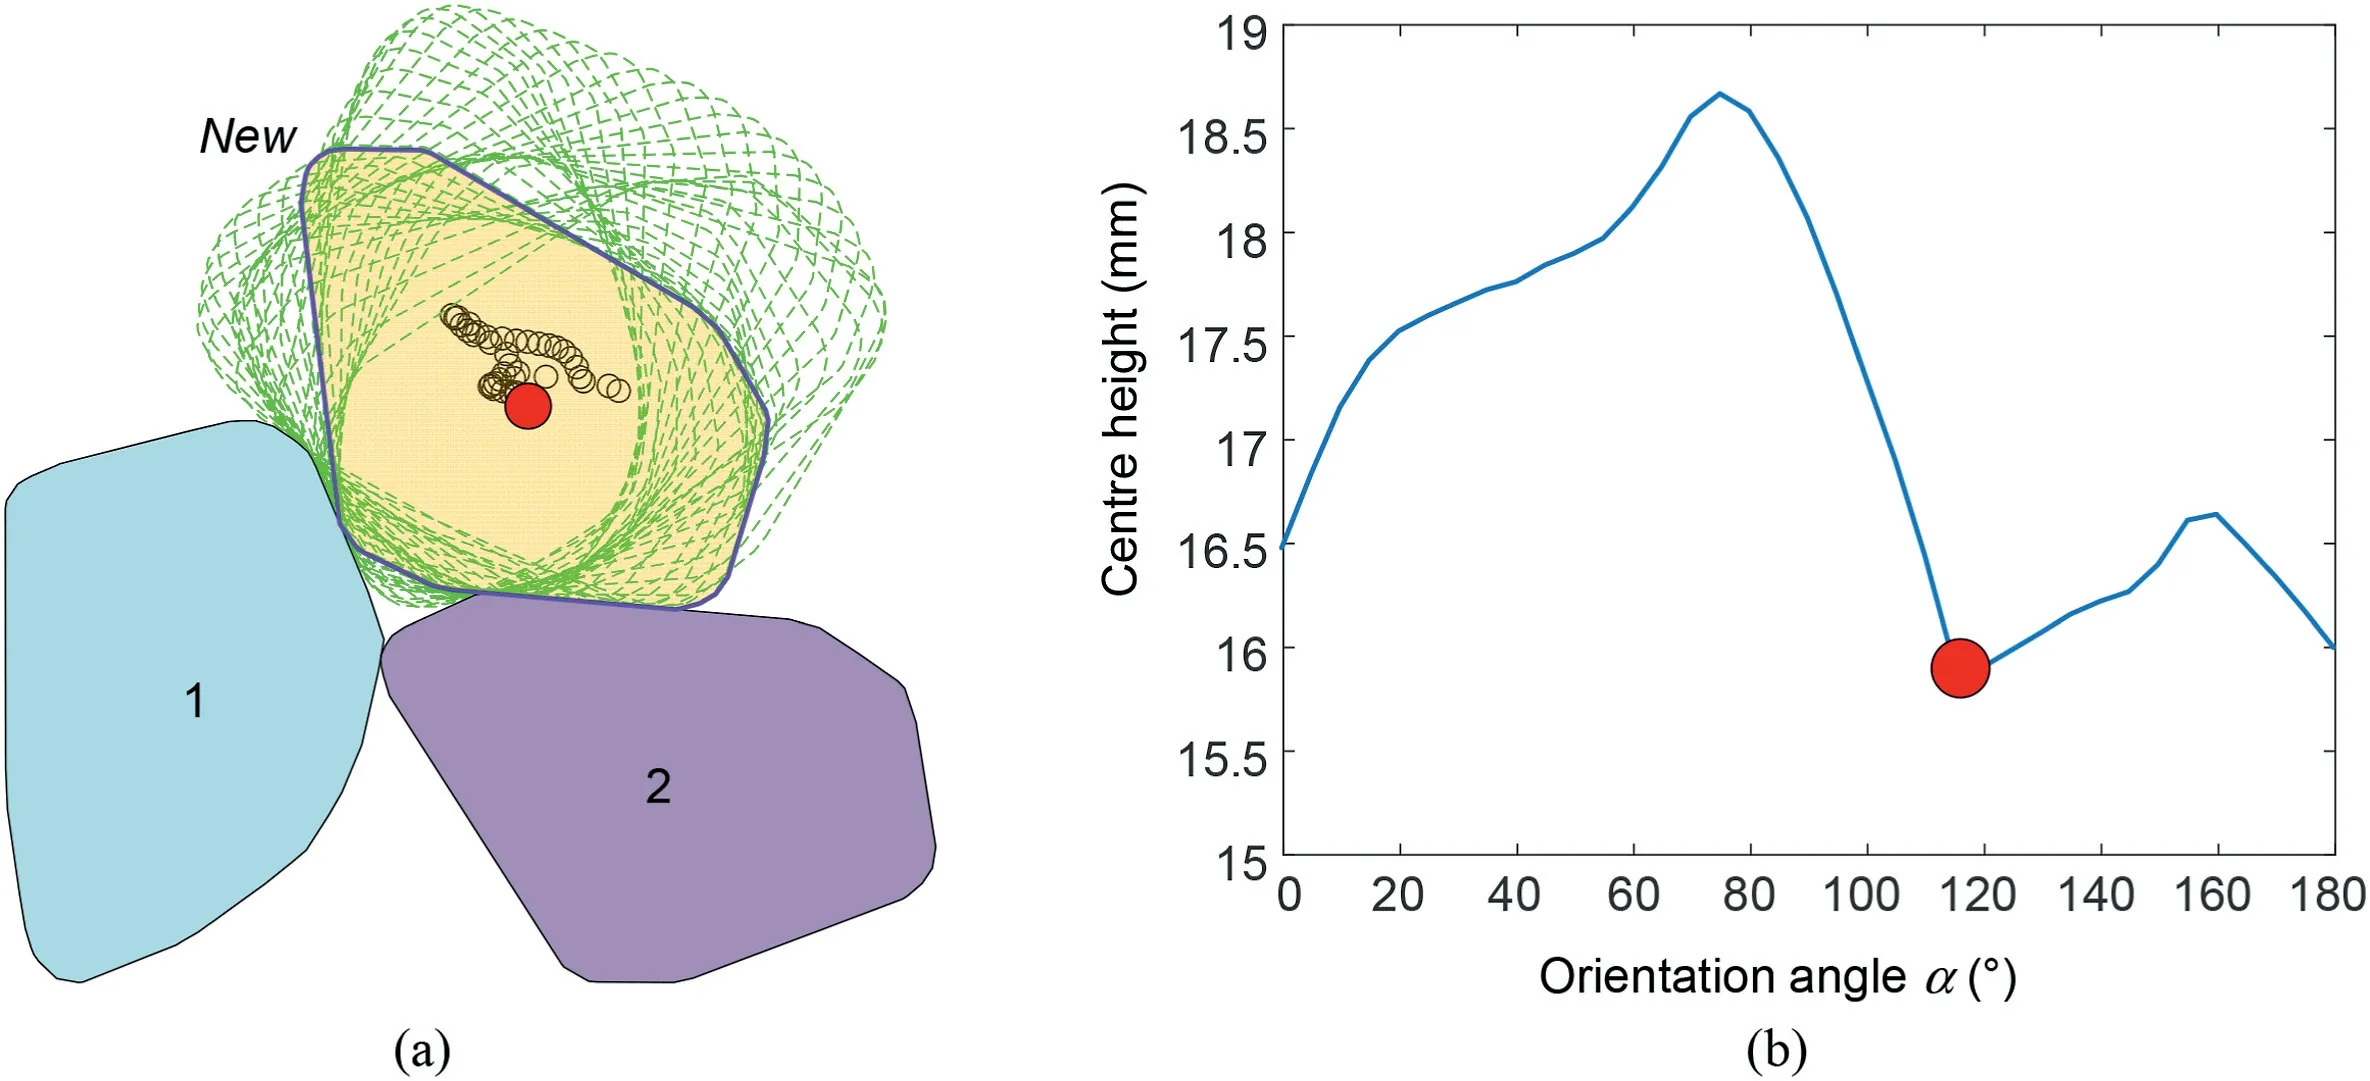
Fig.14.Influence of particle orientation on placing a particle in contact with others:(a)The generated particles with different orientation angles;and(b)The height of particle New centre versus the orientation angle α.
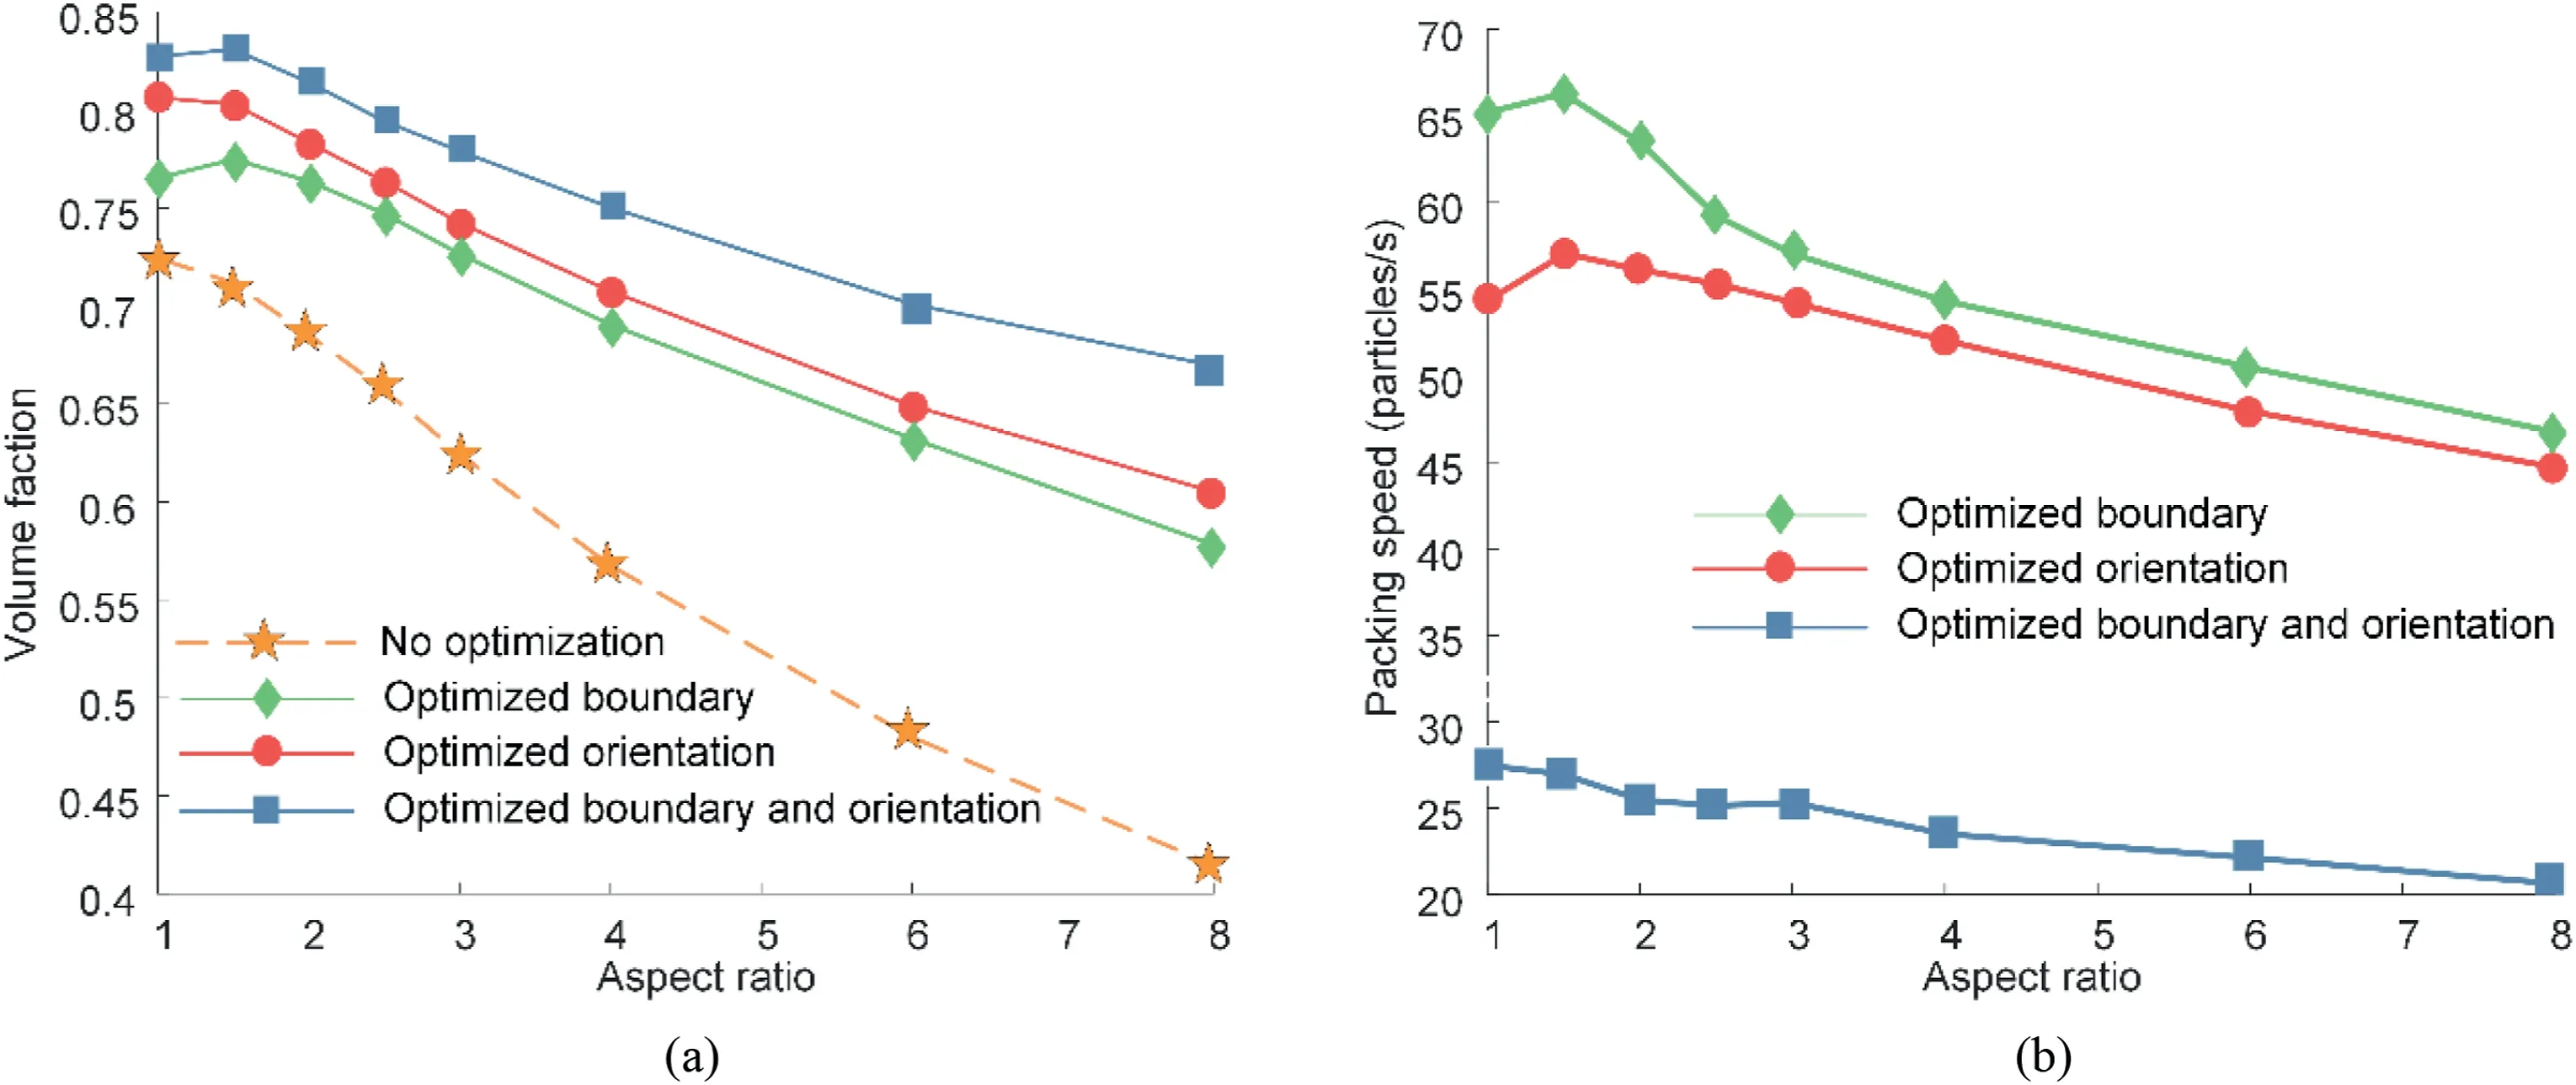
Fig.15.(a) Volume fraction and (b) packing speed generated by different packing methods.
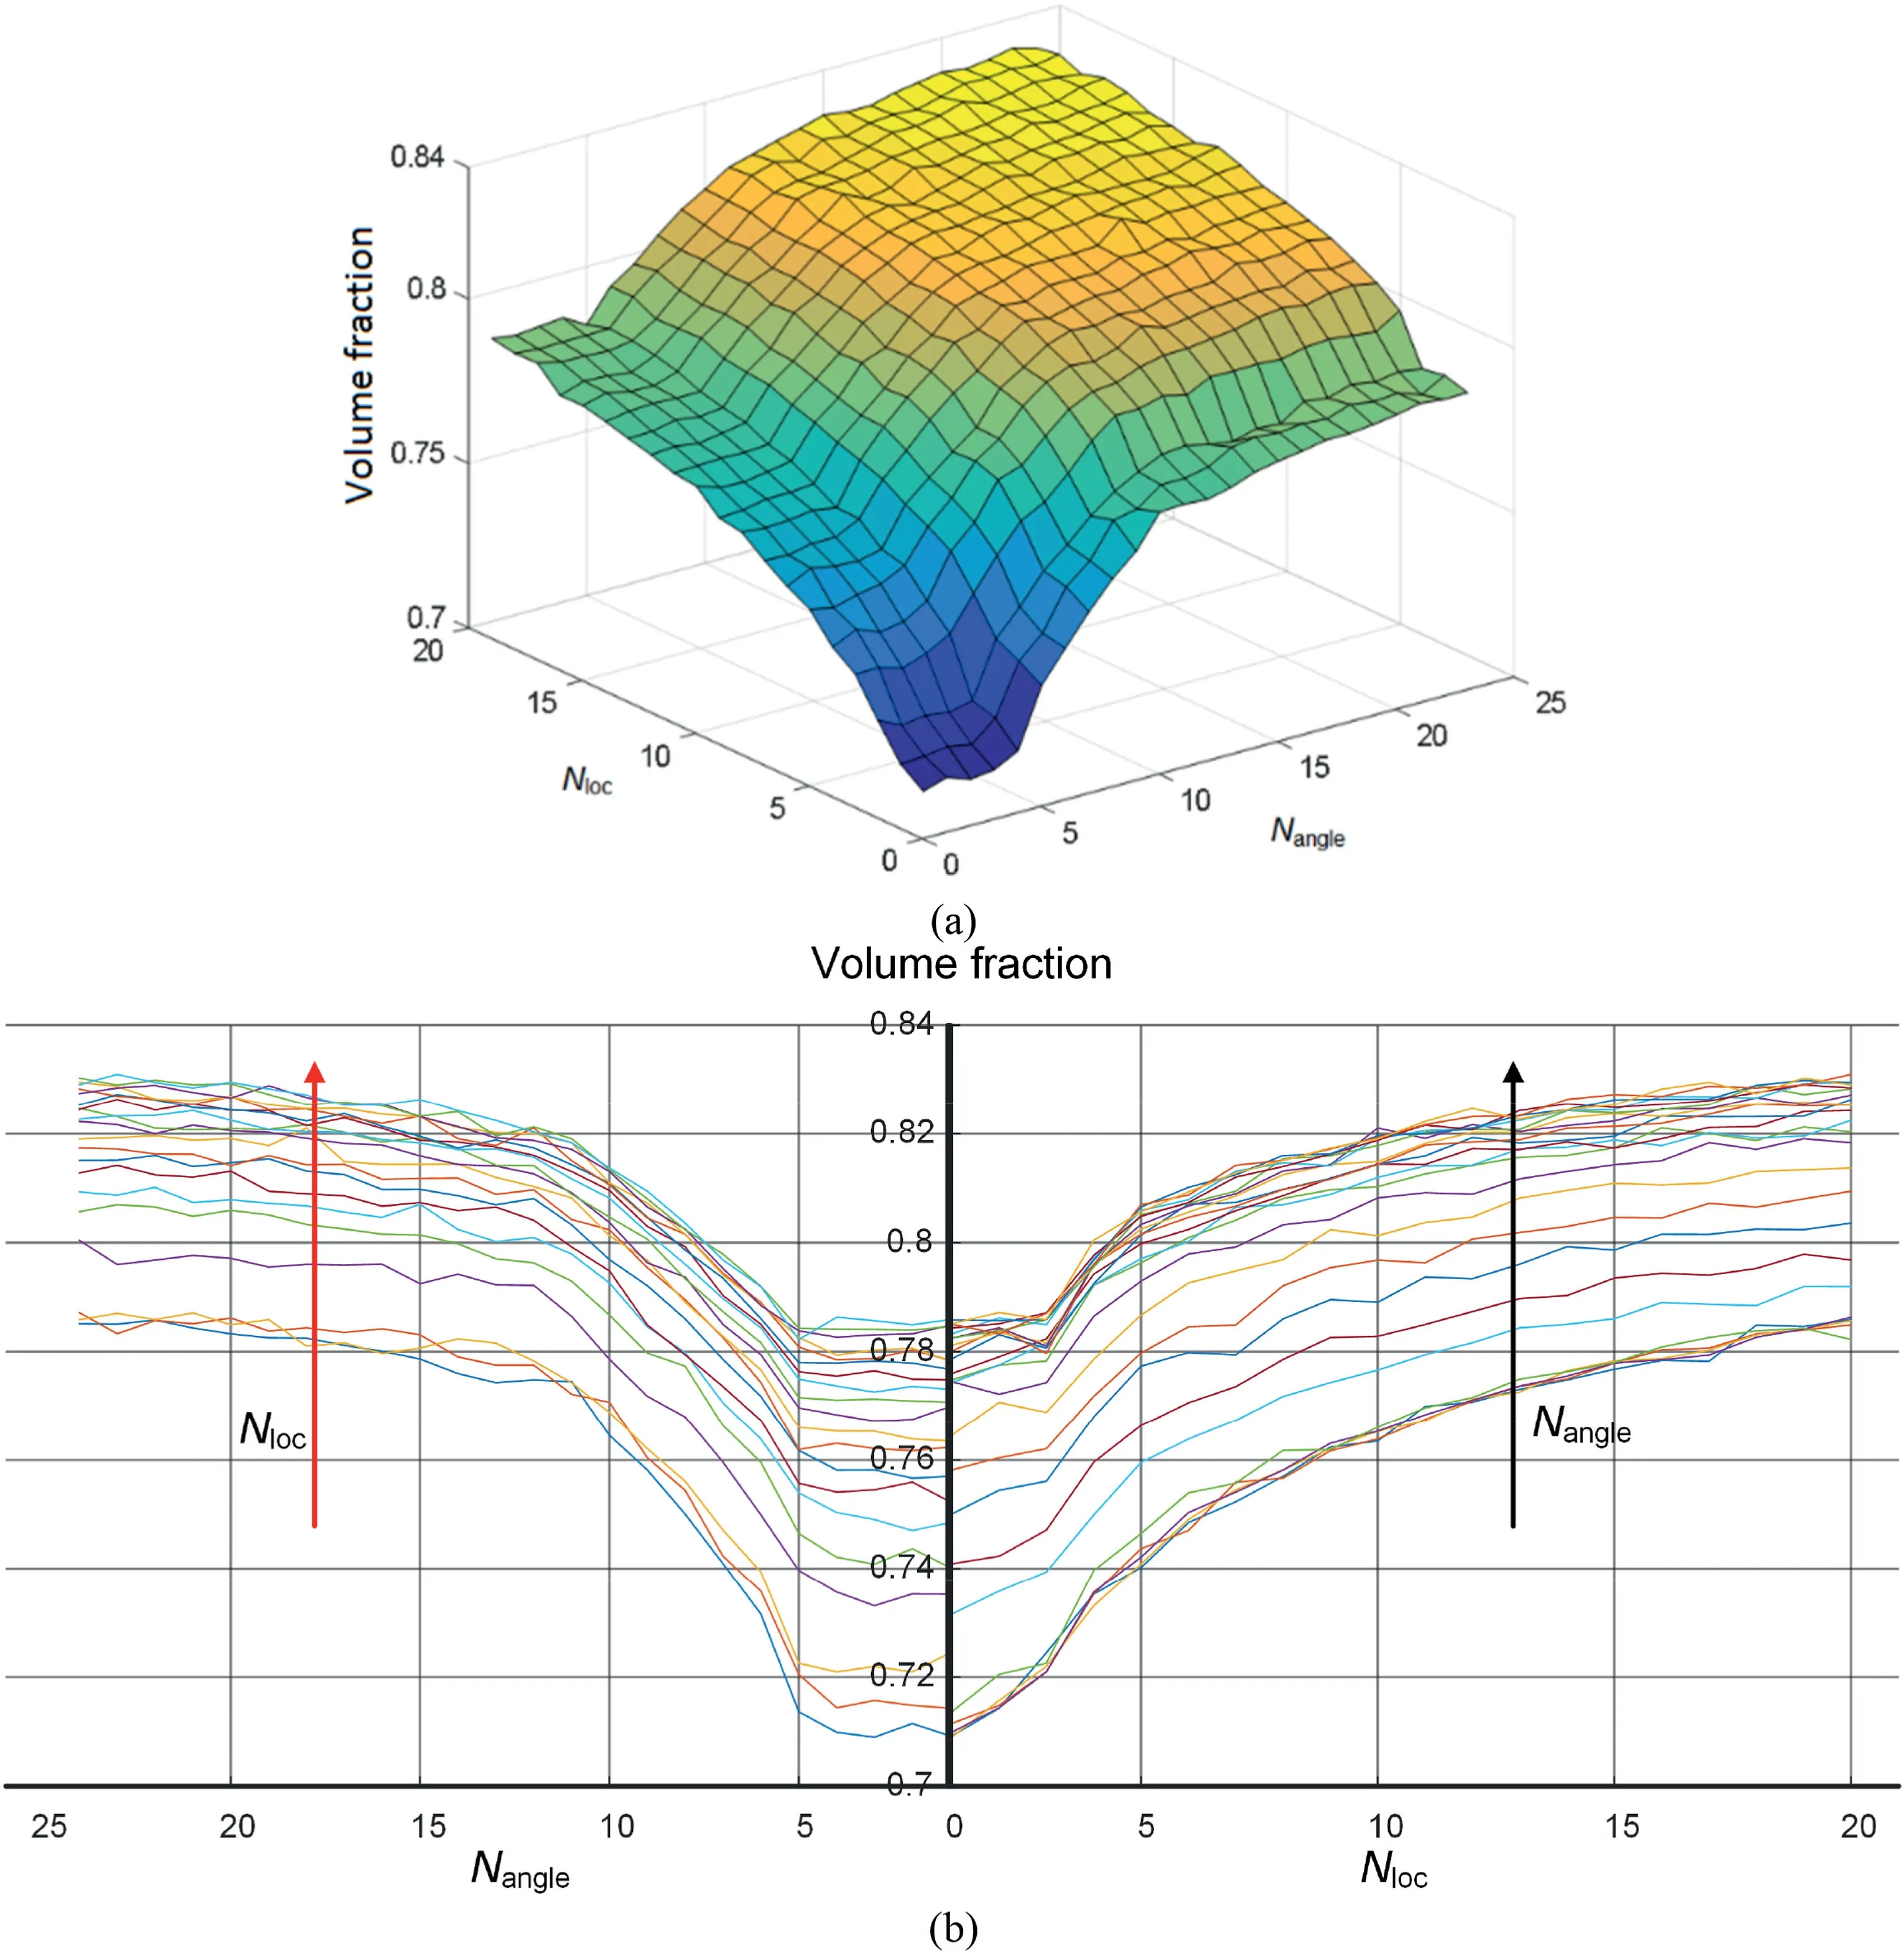
Fig.16.Volume fraction in relation with the tuned parameters Nangle and Nloc:(a)The volume fraction contour;and(b) The selected Nangle and Nloc for the target volume fraction.
4.4.Examples
Irregular particle packing with the prescribed statistical distribution,spatial arrangement,and volume fraction was utilised.The example is packed in a square 200 mm × 200 mm domain.The particle sizeSfollows a lognormal distribution,aspect ratio λ has a normal distribution,and orientation angle α exhibits a uniform distribution.The optimal parameters wereNangle=24 andNloc=20.
Based on the geometry database established in Section 2,the proposed OAFM generated an irregular particle packing with the prescribed statistical distribution and the desired spatial arrangement,as shown in Table 4.If the particle is inside the black region,the particle size will be less than 0.6 mm and vice versa.The generated irregular convex packing and corresponding nonconvex packing are presented in Fig.17b and c,respectively.
In Fig.17,the proposed OAFM packs 15,046 irregular particles in 2311 s,and the generated volume fraction is 0.819.A large number of edges in irregular convex polygons significantly decreased the packing rate.Thus,it is easy to find the cow in Fig.17a,which shows that the generatedparticlesizecorrespondstothedesiredspatialarrangement.
The nonconvex particle packing in Fig.17b is constructed by replacing the irregular convex packing in Fig.17a with the corresponding nonconvex packing in the standard geometry database.The generated nonconvex packing can represent the geometries of realistic grains more accurately.Furthermore,the generated nonconvex packing exhibits the same prescribed statistical distribution,spatial arrangement,and a similar volume fraction.After replacing the convex with nonconvex packing,the volume fraction decreases from 0.819 to 0.788,which is still considerably high.
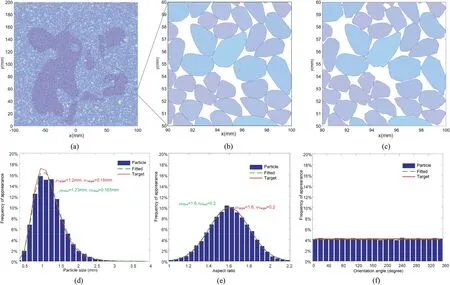
Fig.17.Dense irregular particle packing with the prescribed statistical distribution and desired spatial arrangement: (a) Packing with the prescribed spatial arrangement and statistical distribution;(b) The zoom of irregular convex packing;(c) The zoom of irregular nonconvex packing;(d) The obtained distribution for particle size;(e) The obtained distribution for aspect ratio;and (f) The obtained distribution for particle orientation.
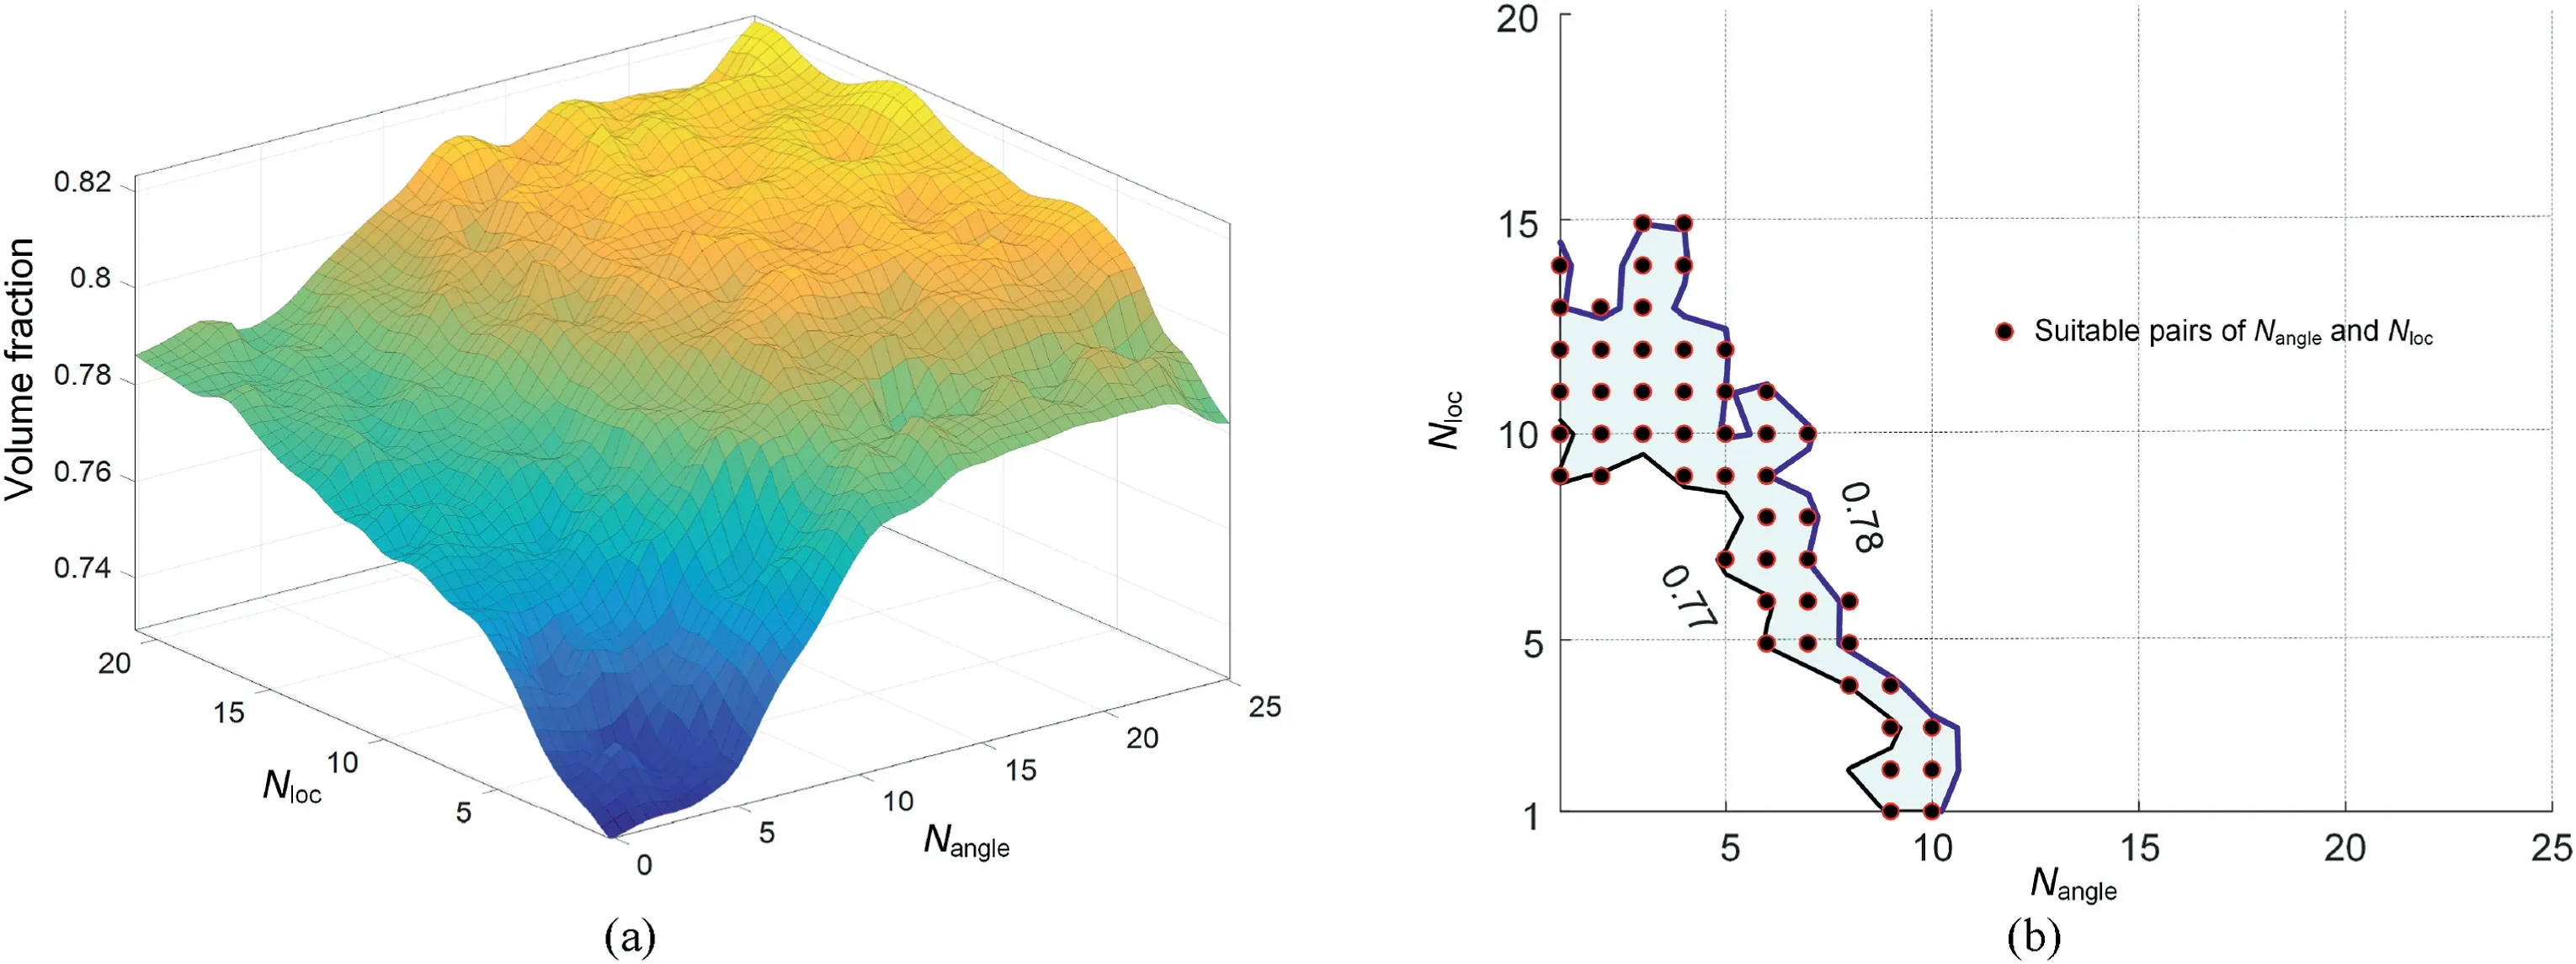
Fig.18.Effect of Nangle and Nloc on the volume fraction: (a) The contour volume fraction;and (b) The region of Nangle and Nloc for the target volume fraction.
As shown in Fig.17d-f,the obtained distributions for particle sizeS,aspect ratio λ,and orientation α are in good agreement with the prescribed statistical distribution in Table 4.The L2error between the obtained and target distributions for particle size is only 3.21%.Notably,the L2error for particle size depends on the critical size that determines the spatial arrangement.The L2error for the aspect ratio λ was only 0.74%.The L2error for the particle orientation α was also obtained,and the target was only 0.46%.
The volume fraction contours with different optimal parameters,NangleandNloc,are shown in Fig.18a.It is easy to obtain a target volume fraction based on the generated contour using suitableNangleandNloc.For example,if the targetVtargetvaries from 0.77 to 0.78,suitableNangleandNloccan easily be found,as shown in Fig.18b.There are severalNangleandNlocpairs for producing the target volume fraction.
The method proposed in this paper can generate irregular particle packing with a target volume fraction.The generated packing can adhere to the prescribed statistical distribution and satisfy the desired spatial arrangement.Furthermore,Table 5 shows the improvements in the proposed method compared with existing methods.The proposed method shows a noticeable improvementin packing granular materials.It can model irregular granular material with a high volume fraction at a high packing speed.The generated packing can represent the desired volume fraction,prescribed statistical distribution,and target spatial arrangement.
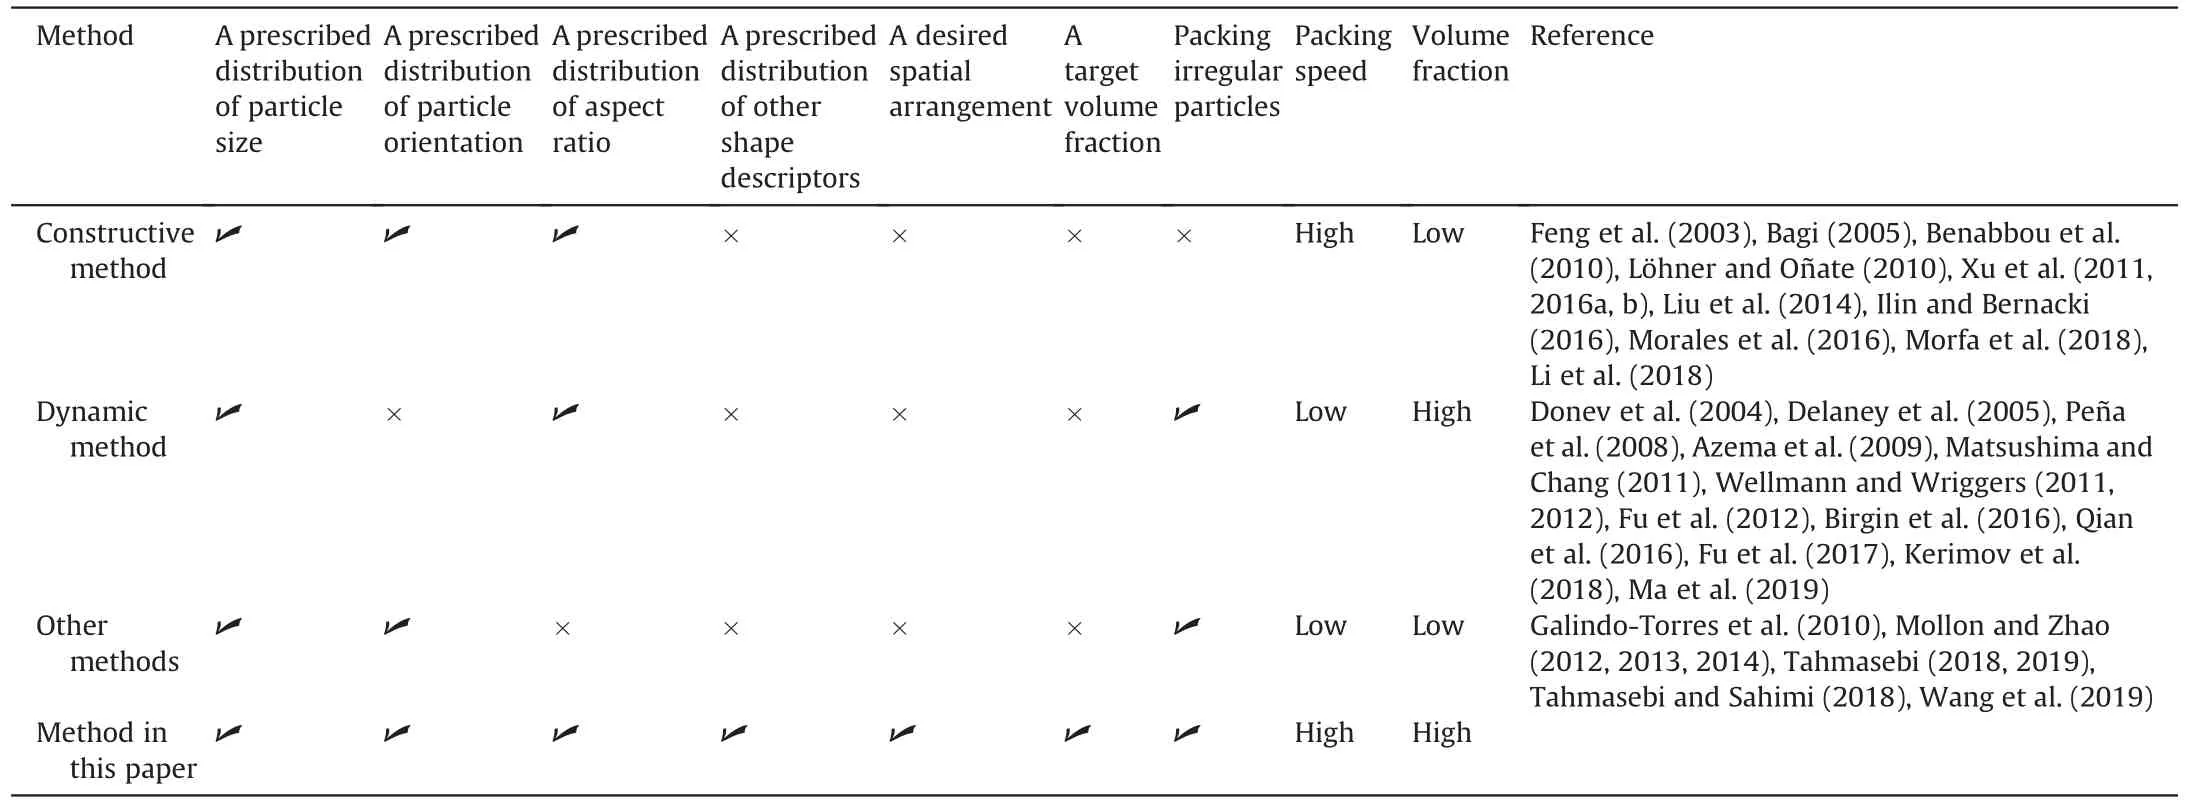
Table 5 Improvements of the proposed method.
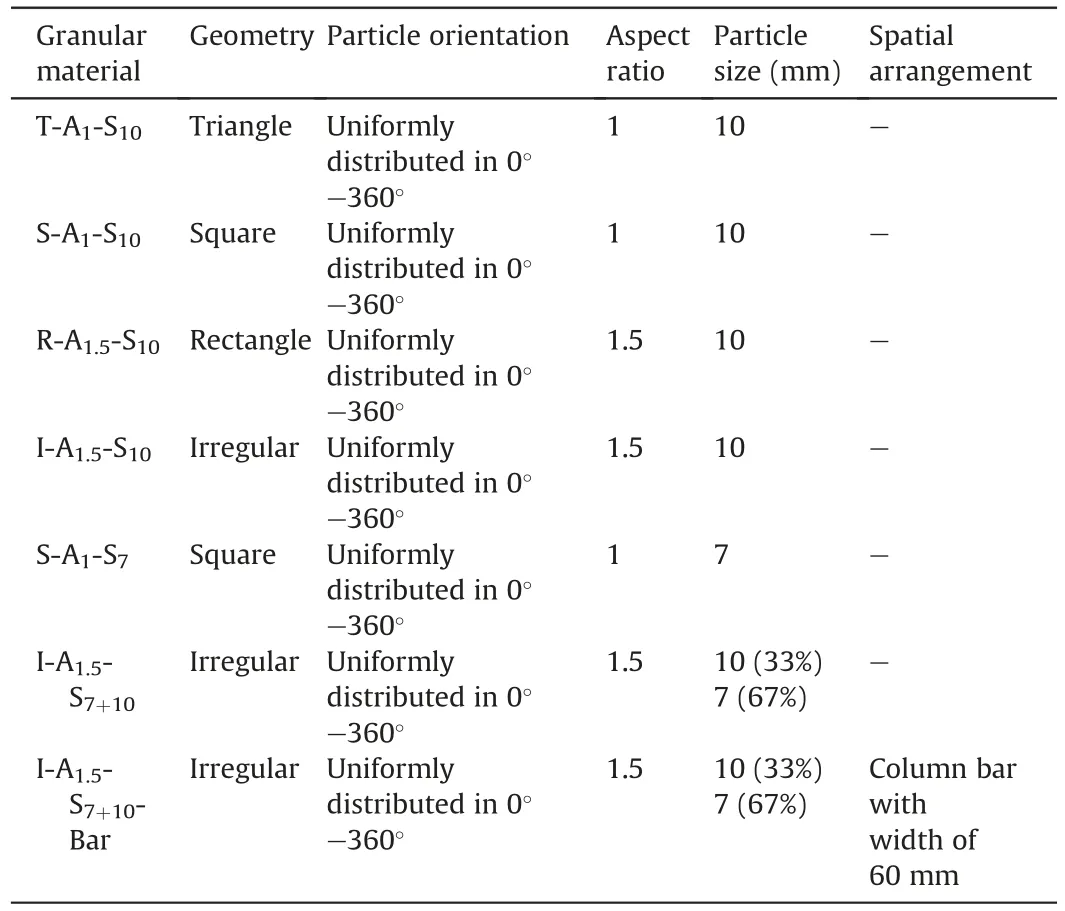
Table 6 Geometries and prescribed distributions for granular material.
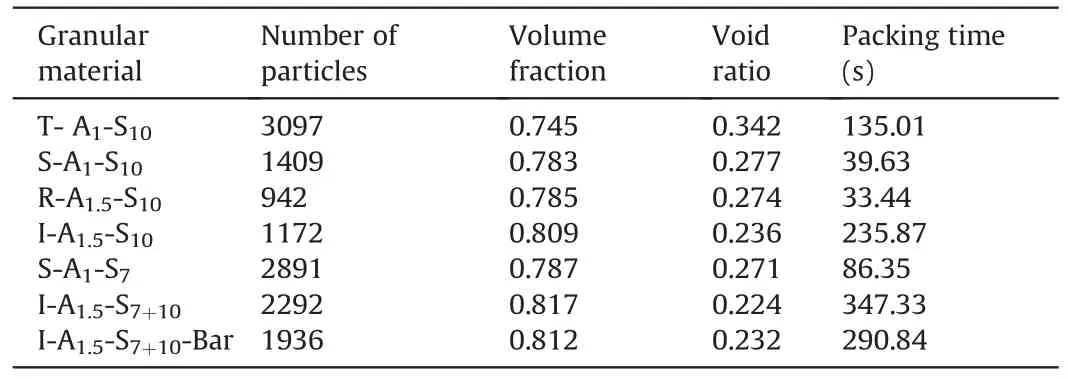
Table 7 Packing results of different granular materials.
5.Biaxial tests of granular material in UDEC
The proposed method was applied to the mechanical analysis of granular materials.The proposed OAFM generated seven specimens with different particle geometries,aspect ratios,and spatial arrangements.Furthermore,seven biaxial test simulations were performed using the discrete element software UDEC.
5.1.Biaxial specimens
All the specimens had a height of 600 mm and a diameter of 300 mm.There are four particle geometries in the seven specimens:triangles,squares,rectangles,and irregular convexities from the geometry database established in Section 2.The particle geometry,statistical distribution,and spatial arrangement of the seven specimens are listed in Table 6.
The proposed OAFM model was used to model the seven specimens.Table 7 shows the packing results,including the number of particles,volume fraction,void ratio (the ratio of void volume to solid volume),and packing time.The granular material T-A1-S10was composed of triangle particles with a aspect ratio of 1 and a size of 10 mm.The granular material T-A1-S10had the lowest volume fraction.It can be found from Table 7 that,as the number of edges increased,the granular material I-A1.5-S7+10generated the highest volume fraction.The number of edges,particle shape diversity,and spatial arrangement significantly influence the volume fraction.The generated granular materials are shown in Fig.19.
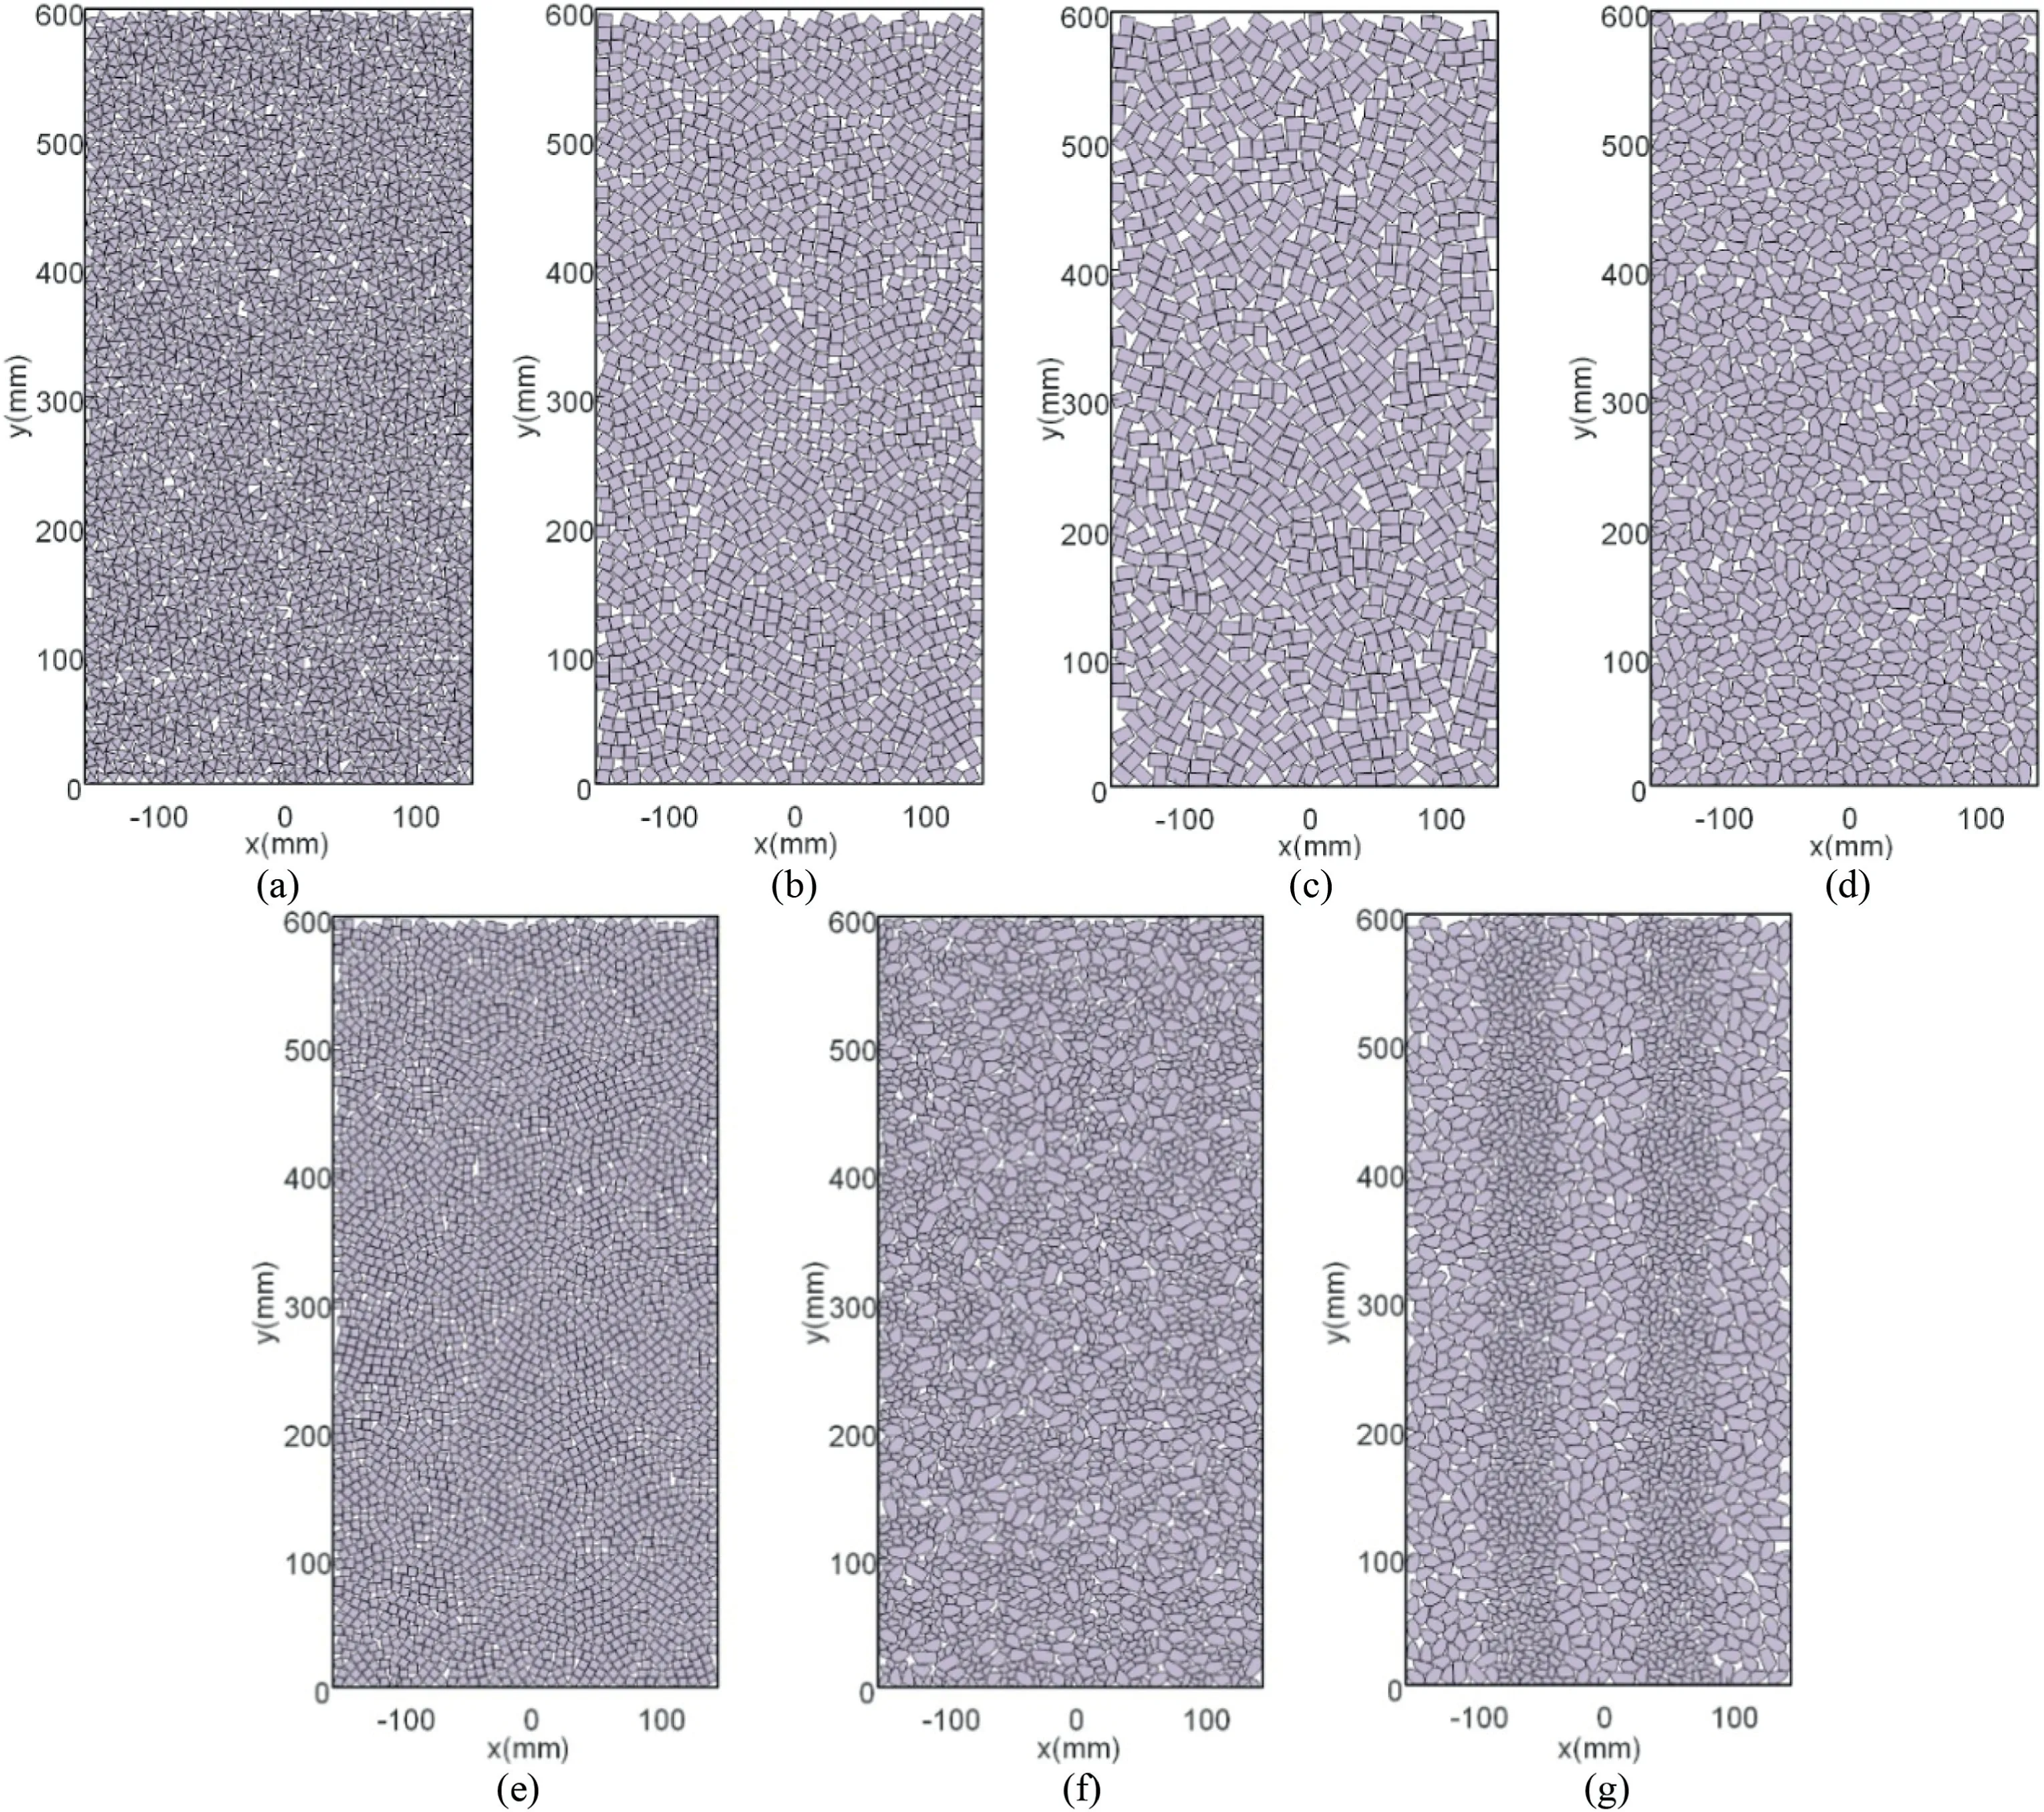
Fig.19.Specimens for seven biaxial tests: (a) T-A1-S10;(b) S-A1-S10;(c) R-A1.5-S10,(d) I-A1.5-S10;(e) S-A1-S7;(f) I-A1.5-S7+10;and (g) I-A1.5-S7+10-Bar.
Packing with smaller particles may generate a higher volume fraction.The irregular particle packings in Fig.19d,f and g generated a higher volume fraction than those with regular particle shapes.
5.2.Biaxial tests
The contact law between the particles was defined by the Coulomb slip model.Local damping is used to reproduce the energy losses in the granular material.The local damping coefficient η is linked to the critical damping fraction ξ according to Eq.(8).The critical damping fraction ξ corresponds to the restitution coefficient,e,according to Eq.(9).The quasistaticefor the glass particles was set toe=0.6(Imre et al.,2008;Louati,2016).From Eqs.(8)and(9),the local damping coefficient is calculated as η=0.5.

As shown in Fig.20,there are several rectangles with a size of 2.5 mm×2.5 mm on each side of the specimen.The rectangles are used as a membrane with a thickness of 2.5 mm.The tension and cohesion of the membrane were set to 1000 MPa to avoid breakage.The confining pressure applied to the flexible membrane boundary was 1000 kPa.The membrane properties were obtained from the online materials information resource Matweb database(MatWeb,1998).The axial loading velocity was 1 mm/s,which corresponded to a strain rate of 0.0017.The maximum axial strain was 20%.
Furthermore,with reference to the simulation properties of granular material in biaxial tests(Peña et al.,2007;Kawamoto et al.,2018;Ma et al.,2019),the final simulation parameters used in the numerical biaxial compression test are listed in Table 8.
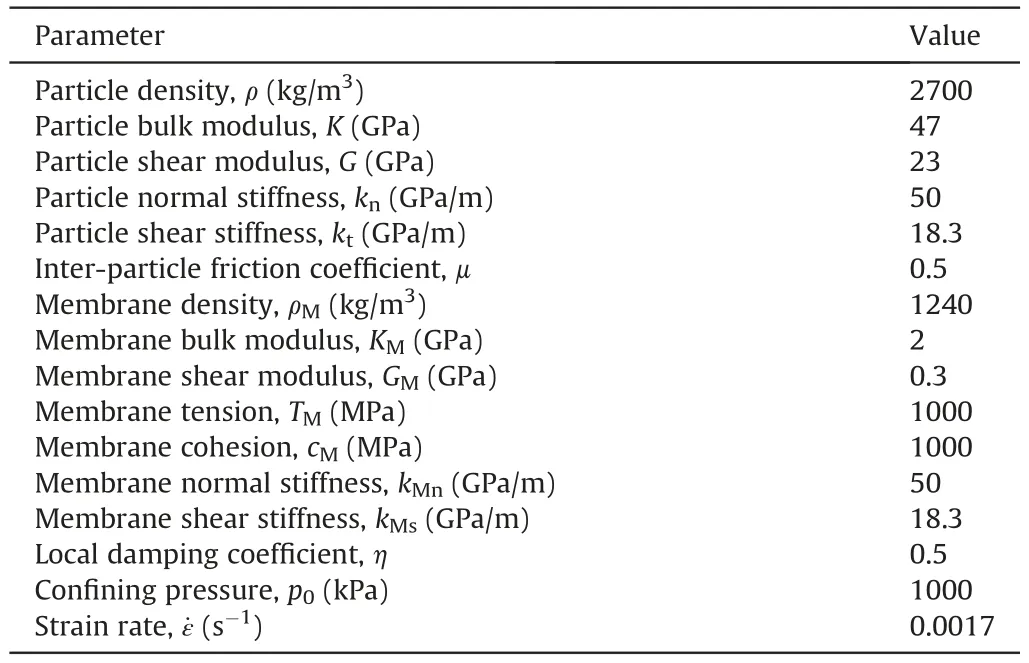
Table 8 Simulation parameters used in the numerical biaxial compression test.
The kinematic behaviour of particles can reveal the onset of microshear bands(MSBs) in granular materials.The relative particle translation gradient(RPTG)is introduced to expose the onset of strain localisation,as in similar works (Amirrahmat et al.,2019).RPTG relates a particle translation vector (δ) to that of all neighbouring particles in contact with that particle(δ1,δ2,…,δn)by the second-order norm of vector differences:

whereRPTGiis the magnitude of the relative translation for a neighbouring particle,ncis the number of contacting particles,andRPTGis the average of allRPTGi.The RPTG for all specimens at an axial strain of 20%is shown in Fig.21.
The shear band is line-shaped in Fig.21a,b,d,f,and g and Xshaped in Fig.21c and e.The rectangular particle can resist more rotation than the square,triangle,and realistic grain particles.The shear band for the granular material R-A1.5-S10was X-shaped.The shear bands for T-A1-S10shown in Fig.21a and S-A1-S7shown in Fig.21e can support more axial strain than the other granular materials.The RPTG of granular materials is similar to that of sheared granular materials with natural sand (Amirrahmat et al.,2019).
Axial strain ε1versus principal stress ratio (PSR) σ1/σ3and volumetric strain εVare shown in Fig.22.The maximum PSRs for the seven specimens are almost equal,but they appear at different axial strains ε1.The stress-strain curve and the volume-strain curve shapes are consistent with those in the literature(Kawamoto et al.,2018;Amirrahmat et al.,2019;Yang et al.,2016).Moreover,the peak PSR in this study is close to that reported in the literature (Amirrahmat et al.,2019).In general,the granular material generated accurately represents the mechanical response of the natural granular material.
As shown in Fig.22,there were large fluctuations in the stressstrain curve.Unlike the particle flow code commonly used in the literature,this study used the UDEC to perform the biaxial test.This may explain the large fluctuations in the stress-strain curve.The particles in the literature are mostly similar to multiple overlapping balls,but the particles in the UDEC are polygons.Compared with the clump,the irregular polygons are less smooth and more difficult to rotate.In addition,the particles could not be broken in the UDEC.Therefore,there were considerable fluctuations in the stress-strain curves.However,the typical curve shape and magnitude are consistent with those in the existing literature,which validates the numerical simulation.
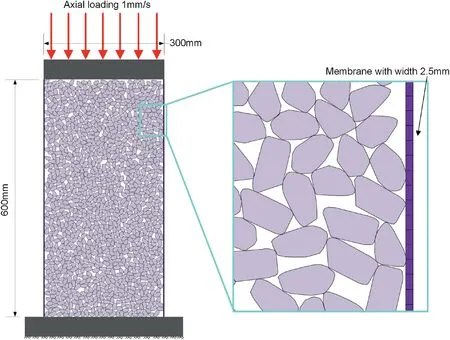
Fig.20.Discrete element model of biaxial compression tests in UDEC.
The strain hardening stage of T-A1-S10occurred between ε1=0%and ε1=10.62%,and εvdecreased until ε1=10.62% (Fig.22a).The PSR was the highest at ε1=10.62%,where the shear band continued to develop in parallel.For S-A1-S10and R-A1.5-S10,the rotation of the square and rectangle generates a sudden change in PSR,as shown in Fig.22b and c,respectively.Compared to the square and rectangle,the rotation of a realistic grain is easier.The PSR of I-A1.5-S10was smoother than that of S-A1-S10and R-A1.5-S10.The number of particles significantly affected the PSR and volumetric strain εV.Under the same particle size of 10 mm,T-A1-S10generated the smoothest curve of ε1versus PSR and the highest compression.
A smaller particle size not only increases the number of particles but also increases the volume fraction and the peak PSR,as it did for S-A1-S10(Fig.22b) and S-A1-S7(Fig.22e).I-A1.5-S10+7generated a larger volume fraction and strength than I-A1.5-S10.Compared to single particle sizes,multiple particle sizes can generate larger stiffness and PSR values.
The I-A1.5-S10+7-Bar (Fig.22g) has the same particle size and shape as I-A1.5-S10+7(Fig.22e),but it has a different spatial arrangement.The I-A1.5-S10+7-Bar separately places particles with sizes of 10 mm and 7 mm in the vertical bar.The spatial arrangement of I-A1.5-S10+7-Bar reduced the PSR slope and delayed axial strain ε1for the maximum PSR.Moreover,after reaching the maximum PSR,the PSR of I-A1.5-S10+7-Bar drastically decreased.Thus,a granular material with a uniform spatial arrangement can increase stiffness.In contrast,the concentration of a single particle size may decrease the stiffness and may result in sudden failure.
To calculate the shear band angle,the friction angle φ and maximum dilation angle ψmaxat the peak strength are determined using the obtained stress-strain curves and volumetric strain curves in Fig.22.They are calculated as follows (Bolton,1987;Lü et al.,2019):

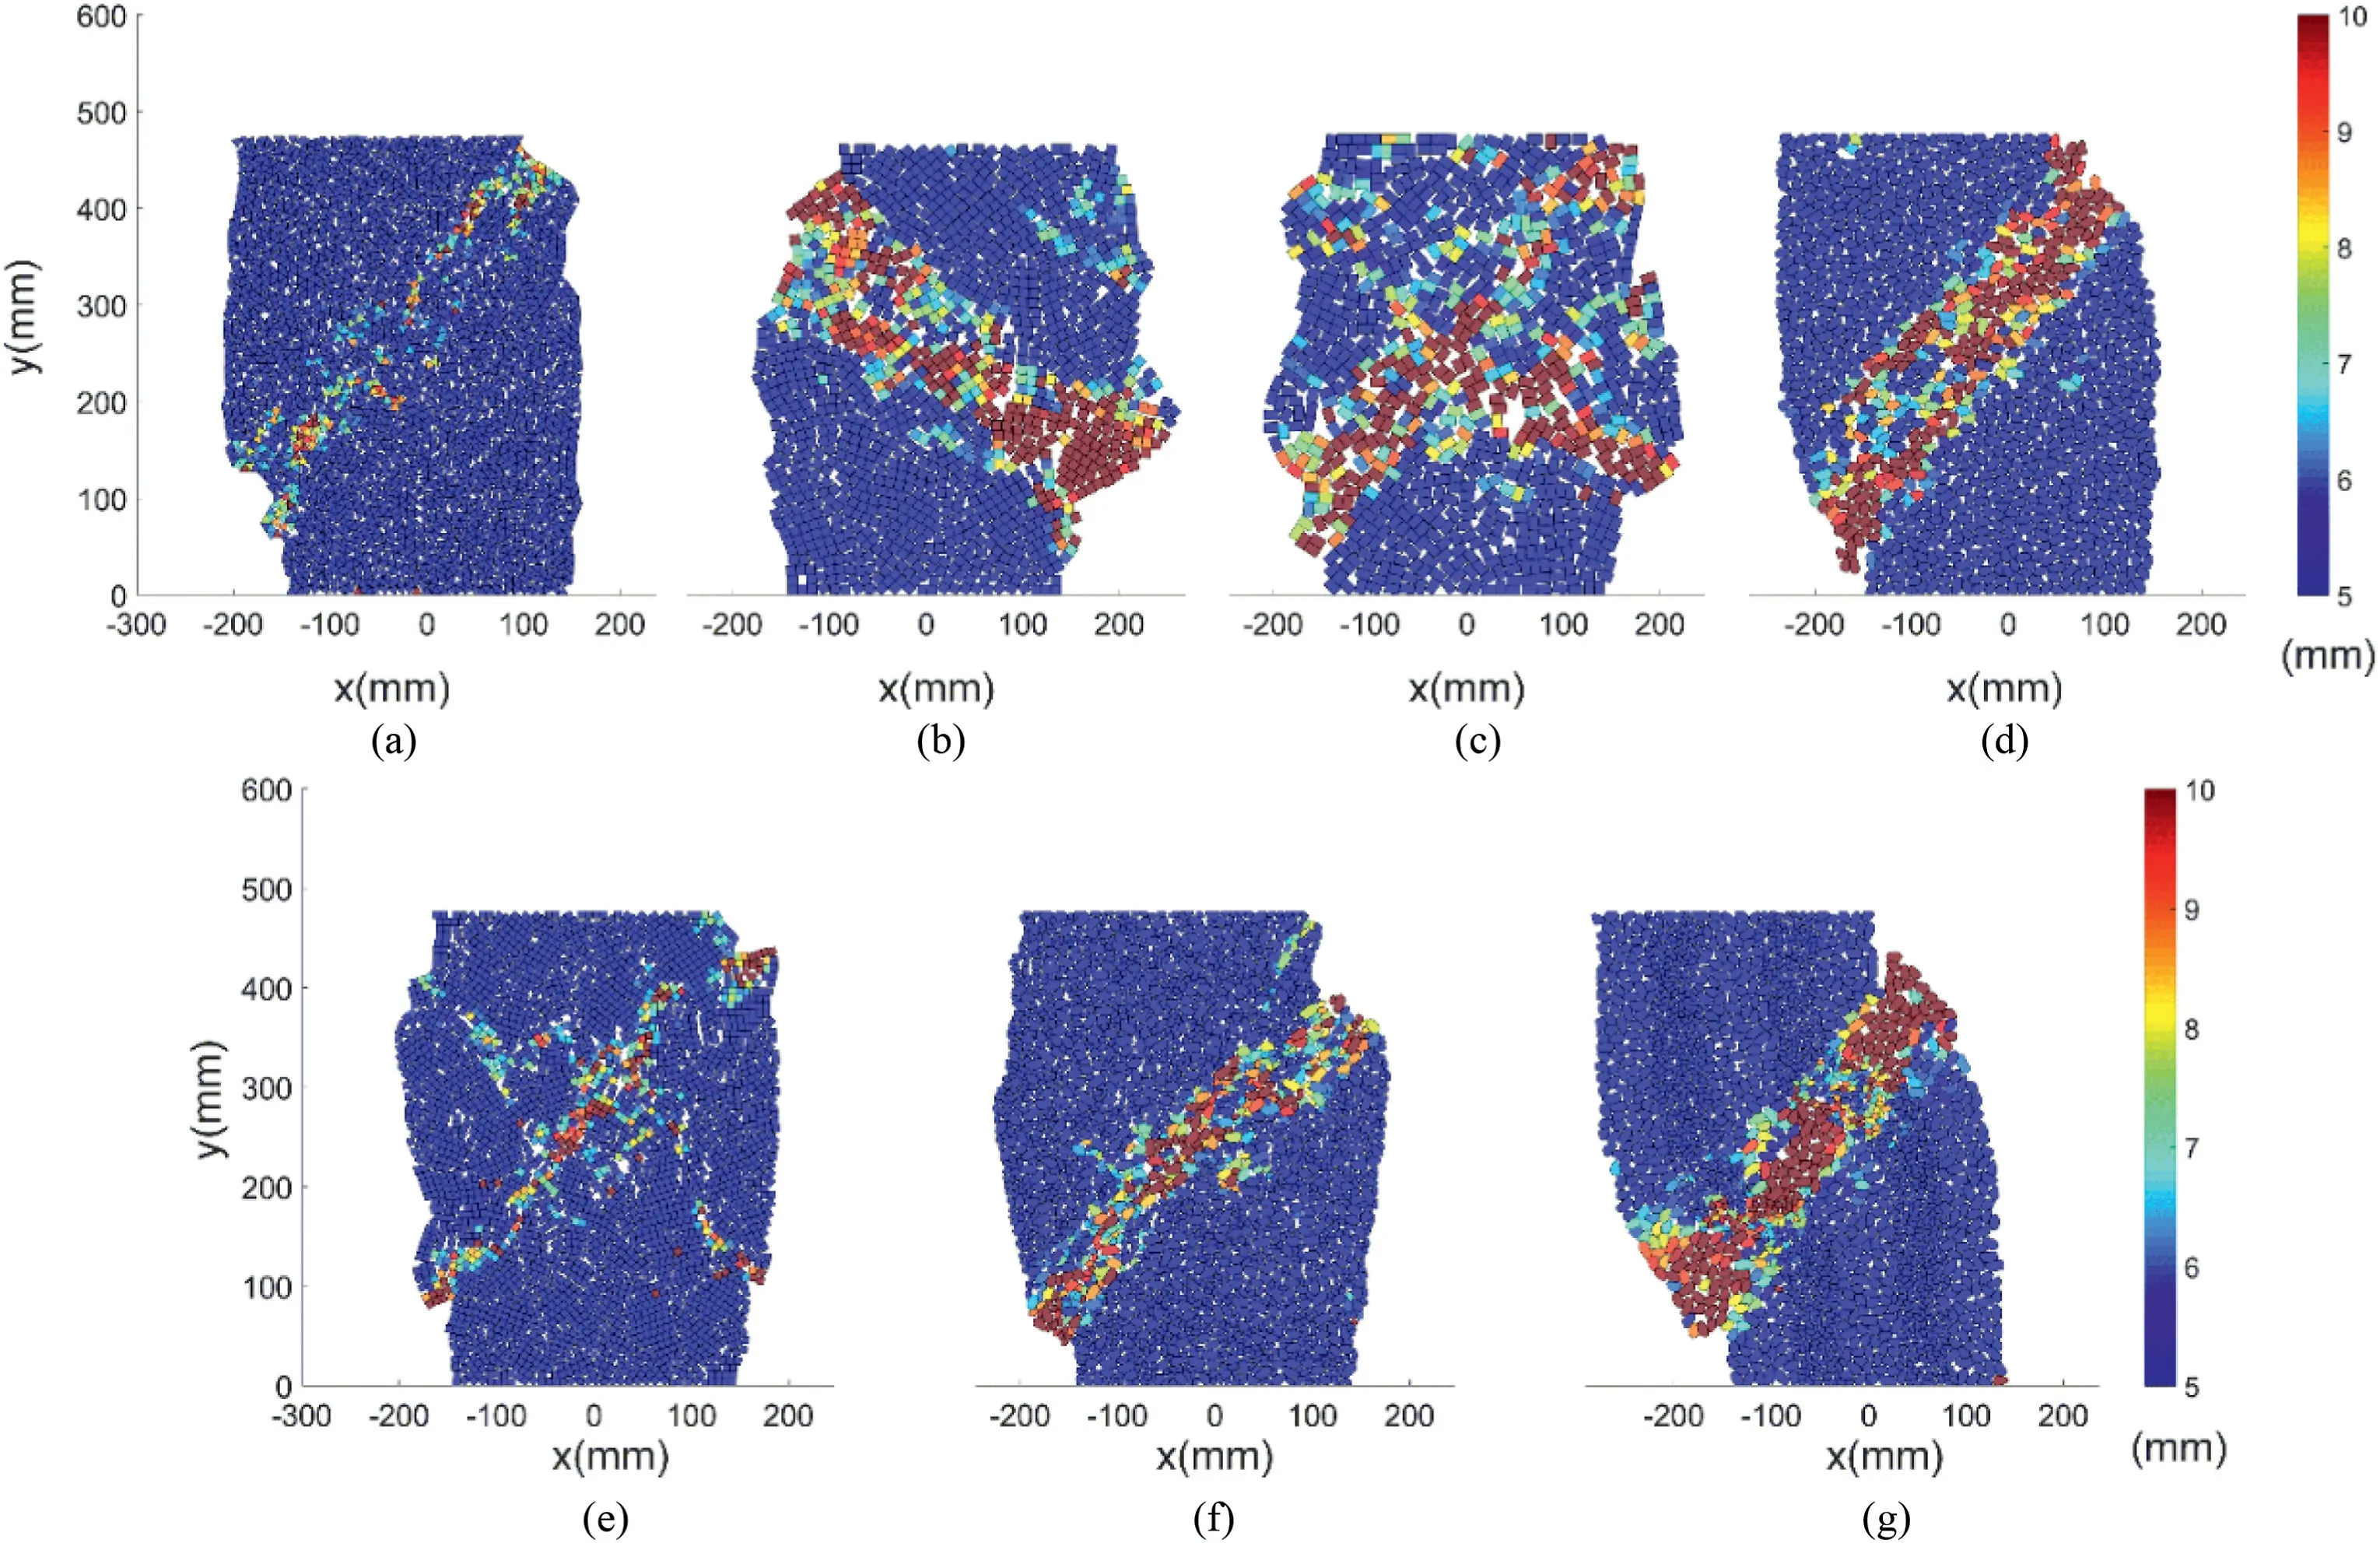
Fig.21.RPTG for the granular material composed of different geometries at axial strain 20%:(a)T-A1-S10;(b)S-A1-S10;(c)R-A1.5-S10,(d)I-A1.5-S10;(e)S-A1-S7;(f)I-A1.5-S7+10;and(g) I-A1.5-S7+10-Bar.
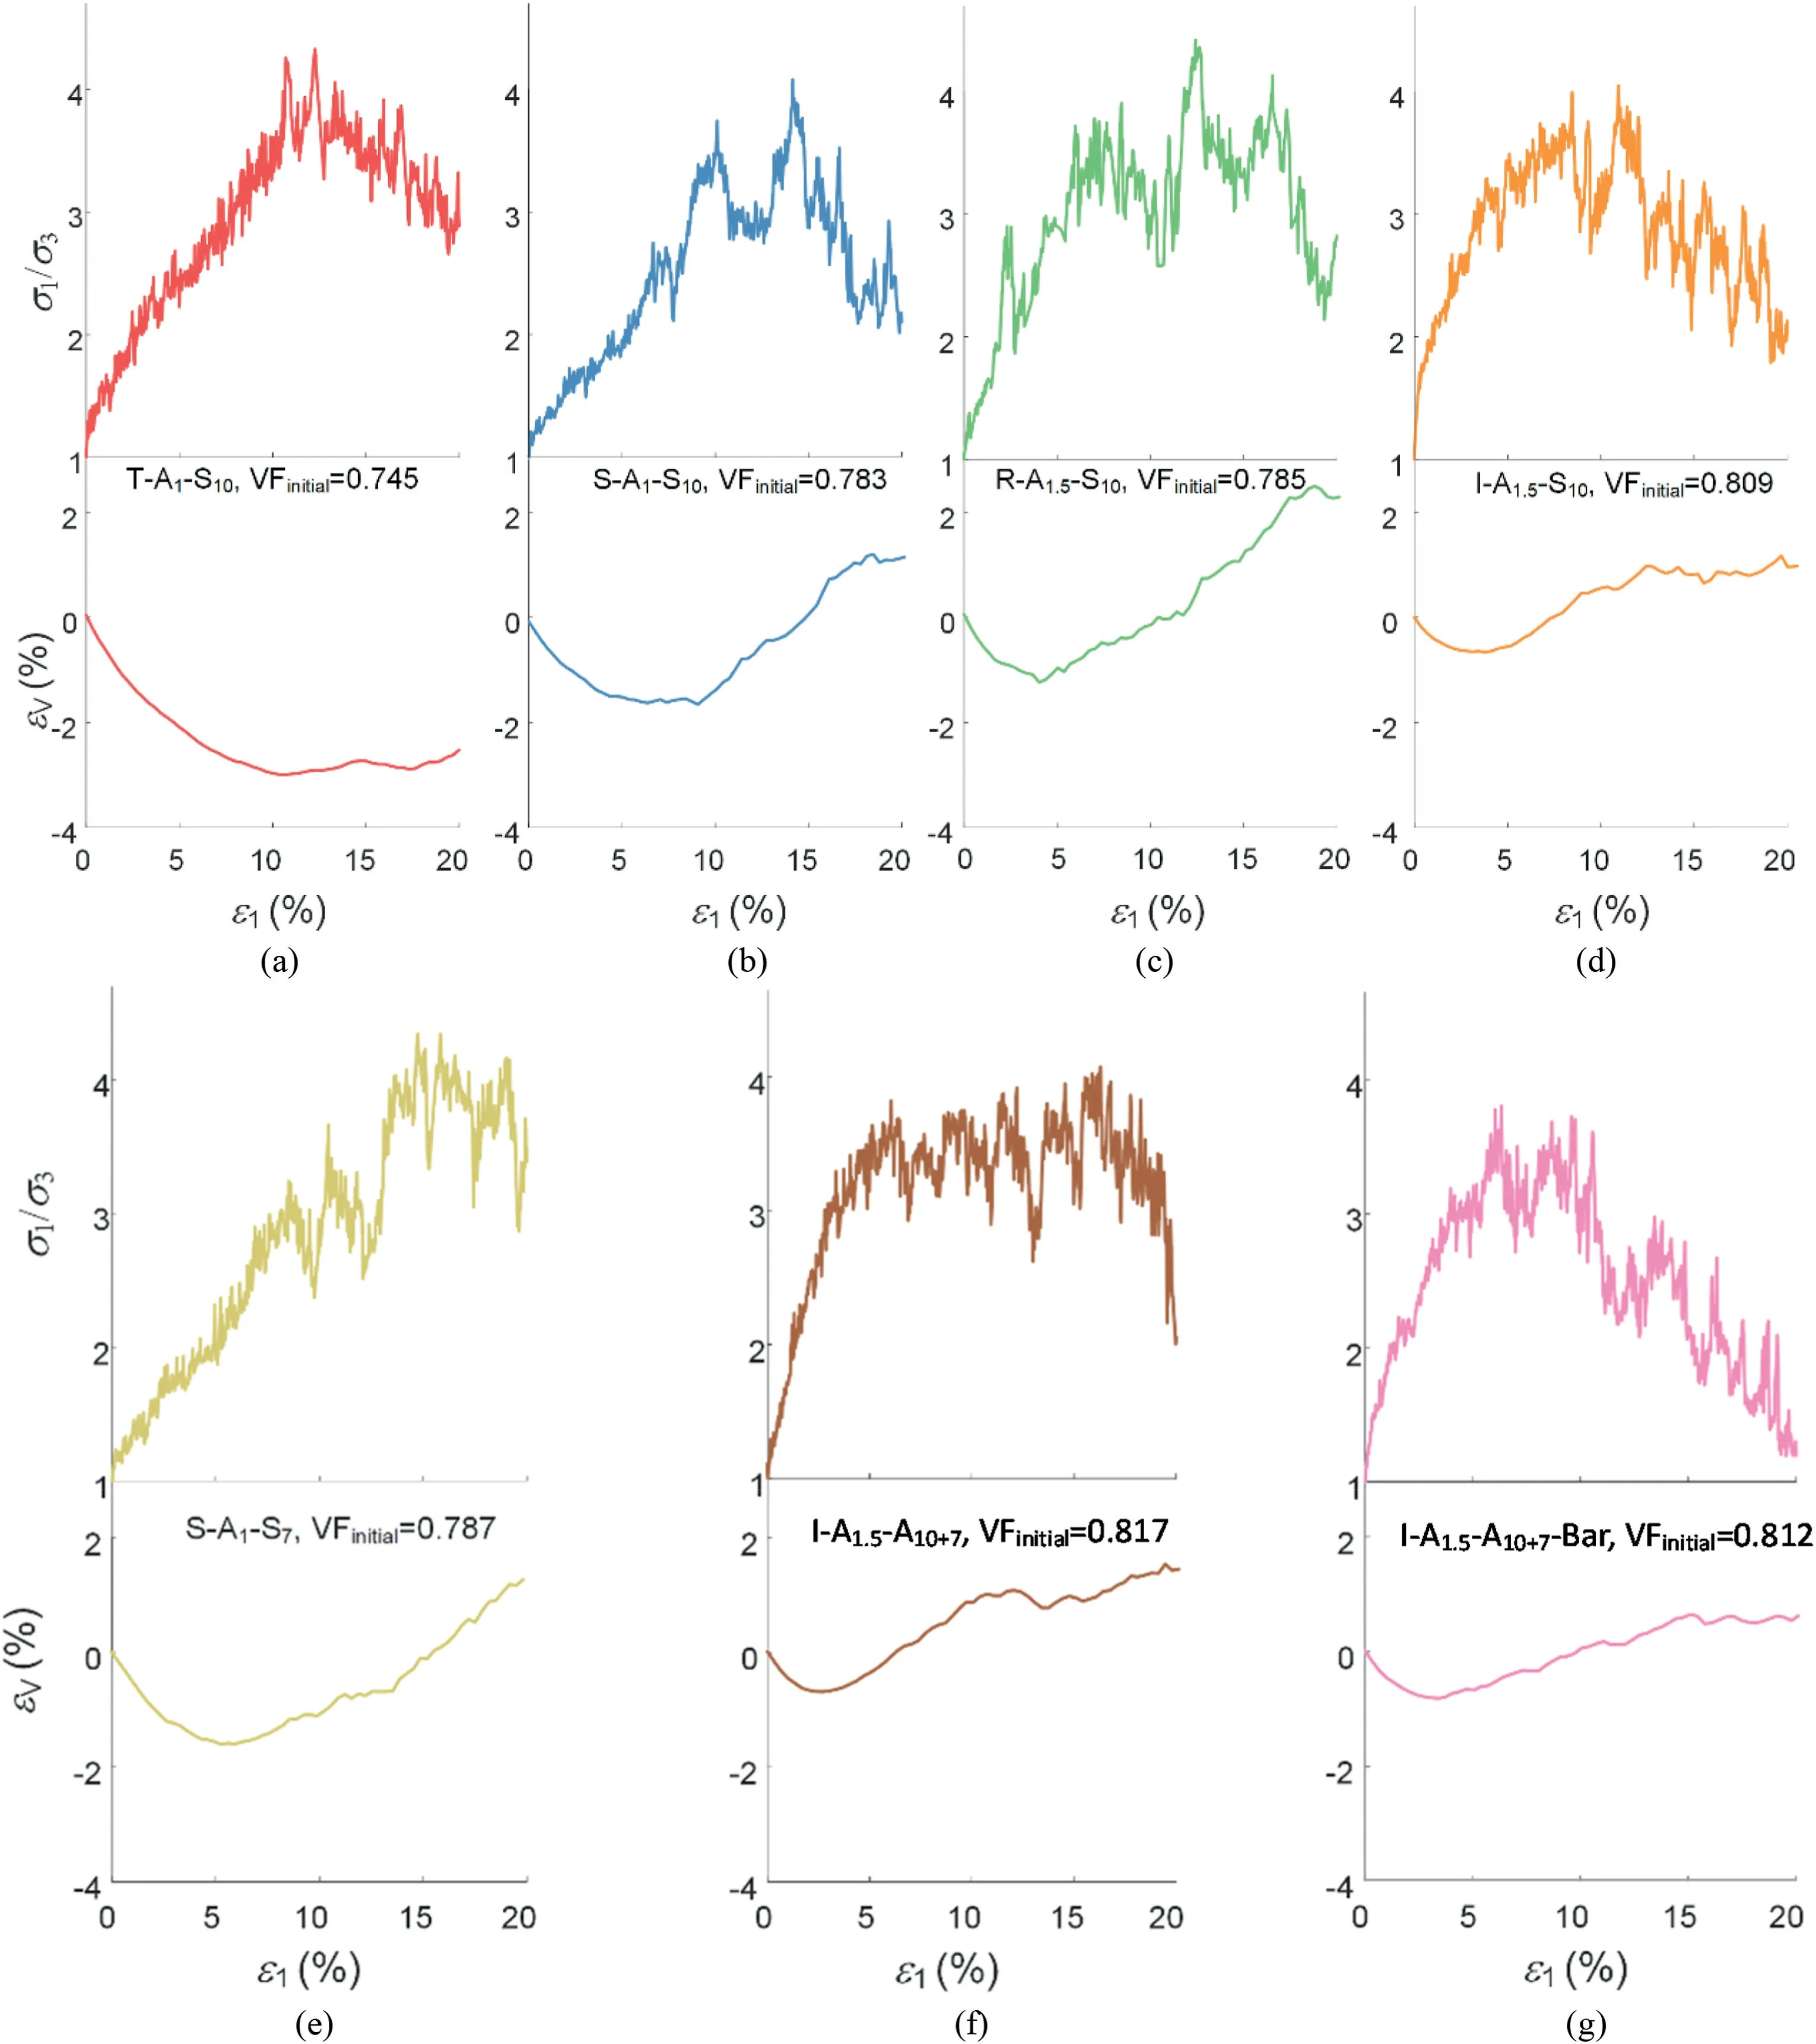
Fig.22.Axial strain ε1 versus principal stress ratio σ1/σ3 and volumetric strain εV:(a)T-A1-S10 with initial volume fraction of 0.745;(b)S-A1-S10 with initial volume fraction of 0.783;(c) R-A1.5-S10 with initial volume fraction of 0.785;(d) I-A1.5-S10 with initial volume fraction of 0.809;(e) S-A1-S7 with initial volume fraction of 0.787;(f) I-A1.5-S10+7 with initial volume fraction of 0.817;and (g) I-A1.5-S10+7-Bar with initial volume fraction of 0.812.
where(σ1)psand(σ3)psare the major and minor principal stresses at the peak state,respectively;ε1is the axial strain;and ε3is the lateral strain.The Mohr-Coulomb theory states that the shear band angle is π/4+φ/2.Roscoe’s theory indicates that the inclination angle is π/4+ψmax/2.Arthur’s theory indicates that the shear band angle is π/4+φ/4+ψmax/4.The formula was validated in previous studies (Vardoulakis,1980;Vermeer,1990).The numerical shear band angle θ and theoretical angles are shown in Table 9.
As shown in Table 9,the numerical shear band angle θ is close to Roscoe’s solution and lower than those of the Mohr-Coulomb and Arthur’s theories.The inclination angle θ is consistent with previous experimental (Vardoulakis,1980;Vermeer,1990) and simulation results (Lü et al.,2019).

Table 9 Shear band angles (º) calculated by different methods.

Table 10 Shear bandwidth and d50.
Further,the shear bandwidth can be obtained from the distribution of the RPTG.However,the RPTG is a property of a single particle and cannot directly display the distribution.Therefore,thisstudy proposes an average RPTG in a measuring circle to illustrate the RPTG distribution.The average RPTG can be calculated as
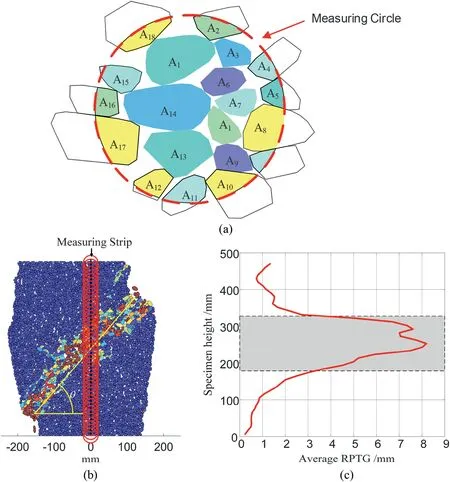
Fig.23.Measuring circle and average RPTG distribution:(a)A measuring circle and the intersecting areas;(b)The layout of the measuring strip;and(c)Average RPTG distribution across the shear band.

whereTaveris the average RPTG,Aiis the intersection area between particleiand the measuring circle,Tiis the RPTG of particlei,andnmis the number of particles intersecting with the measuring circle.A measuring circle and the intersecting areas are displayed in Fig.23a.
To quantify the shear bandwidth,a measuring strip was arranged to capture the average RPTG distribution,as shown in Fig.23b.The measuring strip had 48 measuring circles with a diameter of 40 mm.The obtained average RPTG is shown in Fig.23c.The shear bandwidth was computed from the particles,where the average RPTG was more than the mean value (Kawamoto et al.,2018).The mean value was 2 mm,as shown in Fig.23b.Therefore,the shear bandwidthTsis 110 mm,which is the grey stripe in Fig.23b.
The shear bandwidth was assumed to be proportional to the median diameterd50,and the ratio was 10-20.Thed50and shear band widths of the seven specimens are shown in Table 10.The shear bandwidthTsis 10-20 mm,which is consistent with previous numerical tests (Lü et al.,2019) and laboratory observation(Kawamoto et al.,2018).
Above all,the proposed method can be used to study the influence of various particle dimensions on the mechanical behaviour of granular materials.Notably,the simulation of the biaxial test does not consider the influence of particle breakage,which may result in deviations from the mechanical behaviour of real granular material (Suhr and Six,2017;Xu et al.,2017).Therefore,further research will focus on the effect of particle breakage on the mechanical behaviour of real granular materials.
6.Conclusions
This study proposes a method for packing irregular particles.Compared to other packing methods,the proposed method can pack irregular particles with a target volume fraction at a high packing speed.Additionally,the generated packing can simultaneously adhere to the prescribed statistical distribution and spatial arrangement.The main findings of this study can be summarised as follows:
(2) The proposed method can pack irregular particles with a prescribed statistical distribution at a high packing speed.The computer CPU was I7-6700k,and the operating environment was MATLAB2016b.Packing tests have indicated that the speed of the packing rectangle is 880-1100 particles per second,and the packing speed of the convex with 40 edges is 50 particles per second.
(3) The proposed method satisfied the prescribed spatial arrangement.Moreover,a realistic particle can be simplified as a convex particle that encloses a real particle.Utilising the simplified convex particles,the proposed method can generate nonconvex particle packing.Thus,the proposed method can accurately represent the complex geometries of natural granular materials.
(4) The proposed method improves the volume fraction by using the optimal orientation angle and packing boundaries.Moreover,the prescribed volume fraction can be generated by choosing the correct number of angles and correct size of the local advancing front.The volume fraction generated by the proposed method is higher than that generated by other packing methods.
(5) Biaxial tests conducted in the UDEC software demonstrate that the generated packs can be widely used to investigate the mechanical behaviour of granular materials.Under the same conditions,using granular material with a uniform spatial arrangement can increase the stiffness.The concentration of a single size may decrease the stiffness and cause drastic loss in stiffness.In contrast,granular material with smaller particle sizes may produce a smoother axial strain ε1versus PSR curve.The proposed method can be used to investigate the mechanical behaviour of granular materials.
The proposed OAFM and Minkowski sum are suitable for packing convex structures in 2D.The Minkowski sum is also suitable for packing convex polyhedrons in 3D.Further studies on the generation of irregular polyhedron packing in three dimensions(3D)will be conducted in the future,in addition to packing irregular polyhedrons with a prescribed statistical distribution and a desired spatial arrangement.
Declaration of competing interest
The authors declare that they have no known competing financial interests or personal relationships that could have appeared to influence the work reported in this paper.
Acknowledgments
The authors would like to acknowledge the financial support provided by the National Key R&D Program of China (Grant No.2018YFC1504802) and the National Natural Science Foundation of China (Grant Nos.41972266,12102230).
Appendix A.Supplementary data
Supplementary data to this article can be found online at https://doi.org/10.1016/j.jrmge.2022.03.009.
 Journal of Rock Mechanics and Geotechnical Engineering2023年2期
- Journal of Rock Mechanics and Geotechnical Engineering的其它文章
- On the critical particle size of soil with clogging potential in shield tunneling
- Strength and deformation characteristics of irregular columnar jointed rock mass: A combined experimental and theoretical study
- Spatial distribution and failure mechanism of water-induced landslides in the reservoir areas of Southwest China
- Characteristics of electromagnetic vector field generated from rock fracturing
- A multi-purpose prototype test system for mechanical behavior of tunnel supporting structure: Development and application
- Geotechnical investigation of low-plasticity organic soil treated with nano-calcium carbonate
