Characteristics of electromagnetic vector field generated from rock fracturing
Menghan Wei ,Dazhao Song,* ,Xueqiu He,c ,Quan Lou ,Liming Qiu ,Zhenlei Li
a Key Laboratory of Ministry of Education for Efficient Mining and Safety of Metal Mine,University of Science and Technology Beijing,Beijing,China
b School of Civil and Resources Engineering,University of Science and Technology Beijing,Beijing,China
c Zhong-An Academy of Safety Engineering,Beijing,China
d School of Municipal and Environmental Engineering,Henan University of Urban Construction,Pingdingshan,China
Keywords:Electromagnetic radiation Directionality Vector field Rock fracturing
ABSTRACT Rock fracturing is often accompanied by electromagnetic phenomenon.As a vector field,in addition to the intensity that is widely concerned,the generated electromagnetic field also has obvious directionality.To this end,a set of electromagnetic antennas capable of simultaneous three-axis measurement is used to monitor the electromagnetic vector field generated from rock fracturing based on Brazilian tests.The signal amplitude on each axis can represent the magnitude of actual magnetic flux density component on the three axes.The intensity and directional characteristics of electromagnetic signals received at different positions are studied using vector synthesis.The directionality of electromagnetic radiation measured using a three-axis electromagnetic antenna shows that the direction of the magnetic flux intensity generated by rock fracturing tends to be parallel to the crack surface,and the measured signal intensity is greater in a direction closer to the crack surface.
1.Introduction
Electromagnetic methods have been widely used in underground engineering to detect geological structures and monitor the stress state of rock masses (Li et al.,2010,2015;Qiu et al.,2017;Song et al.,2018).Considering the precursory characteristics of electromagnetic radiation,this technology is commonly used for time-series monitoring and early warning of dynamic disasters(Lu et al.,2019;Qiu et al.,2020);however,it has not yet been utilized in the space-time field.Numerous attempts have been made to determine stress direction based on a new understanding of the directionality of electromagnetic radiation.Lichtenberger (2005,2006)used electromagnetic radiation to evaluate the direction and amplitude of the maximum principal stress in a tunnel based on the assumption that the intensity of the electromagnetic radiation pulse is positively related to the shear stress magnitude.According to the similarity principle,this geophysical method was also applied to detecting the horizontal principal stress direction and identifying structurally active regions that could become potential faults (Greiling and Obermeyer,2010;Krumbholz et al.,2012;Das et al.,2020).Relatively few studies have been conducted on the directionality of electromagnetic radiation from rock dynamic disasters.
Electromagnetic radiation generated from dynamic disasters is directly related to the mechanical behaviors of rock masses.Effects related to locally loaded fractures(Han et al.,2016;Lin et al.,2021),deformation(Li et al.,2020),or friction(Tsutsumi and Shirai,2008;Leeman et al.,2014) have been documented in numerous studies.Many theories and models have been proposed for electromagnetic radiation with rock masses.The piezoelectric effect of quartz was first proposed to explain the electromagnetic radiation produced when rocks fracture (Kobayashi et al.,2014).However,this phenomenon is also observed in quartz-free rocks.The separation of bound charges between crack surfaces associated with microcracks is commonly regarded as the source of electromagnetic fields generated during rock fracturing(Mastrogiannis et al.,2015)as well as displacement or movement of free charges along the crack walls(Sharma et al.,2021).Hole charge carriers in minerals were considered by Freund (2002),Freund et al.(2021) as a potential mechanism for the electromagnetic source.Frid et al.(2003) and Rabinovitch et al.(2007)proposed a surface oscillation wave model in which electromagnetic radiation is caused by the oscillation of charge carriers.Crack propagation triggers a release of mechanical energy,causing atomic bonds at the crack tip to break,and the atoms along the crack wall become excited and oscillate around their steady positions.Oscillating atoms move with the surrounding atoms,moving in a direction parallel to the vibration direction and perpendicular to the crack growth direction,thereby generating surface oscillation waves.This model can theoretically supplement the directionality characteristics of generated electromagnetic field.
Some research results have described the directional characteristics of electromagnetic radiation on the laboratory scale.Experimental results (Takeuchi and Nagahama,2006;Rabinovitch et al.,2017) proved the directionality of electromagnetic radiation and indicated that the directionality of electromagnetic radiation is related to the direction of corresponding microcracks.Signal intensity depends on the angular relationship between crack and antenna.When the antenna is parallel to the crack direction,the maximum measured signal is obtained.Gade et al.(2017) also found that the radiated electromagnetic field during fracturing has significant directional characteristics during fracturing of brittle dielectric materials.The strongest signal can be detected in the direction parallel to the crack surface.As the angle between the crack surface and the sensor increased,the signal decreased significantly in energy,indicating the directionality of the electromagnetic field.Song et al.(2019)studied the effect of prefabricated cracks of different inclinations on electromagnetic signals.Li et al.(2016) used a fluxgate sensor to measure the magnetic field during uniaxial compression of coal and rock,and the results reflect the discrepancy in signals in different directions.However,measurement methods in these experiments require continuous changes in sensor or antenna arrangement and cannot simultaneously measure electromagnetic fields in multiple directions at the same location.To solve this problem,we developed a three-axis electromagnetic antenna for simultaneous measurement in multiple directions (Wei et al.,2021).
Four sets of three-axis electromagnetic antennas capable of simultaneous measurement in three directions are used for full monitoring.The Brazilian test with a relatively single failure mode is selected to examine the electromagnetic vector field generated by rock fracturing.Signals in the three directions are analyzed and compared in the time and frequency domains.Using a vector synthesis,the intensity and directional characteristics of the electromagnetic signals generated from rock fractures at different positions are studied.Results of this study provide more convenient methods for stress monitoring based on electromagnetic vector field and lay the foundation for feasibly using electromagnetic vectors to determine the orientation of rockburst and other dynamic disasters in underground engineering.
2.Experiment
2.1.Materials
Materials used in this study include basalt,limestone and quartz sandstone (hereafter referred to as sandstone).Table 1 shows the physical properties of the three types of rocks,and the results are averaged from multiple measurements.The texture,structure and mineral composition of the rocks are shown in Table 2.

Table 1 Physical properties of rock specimens.
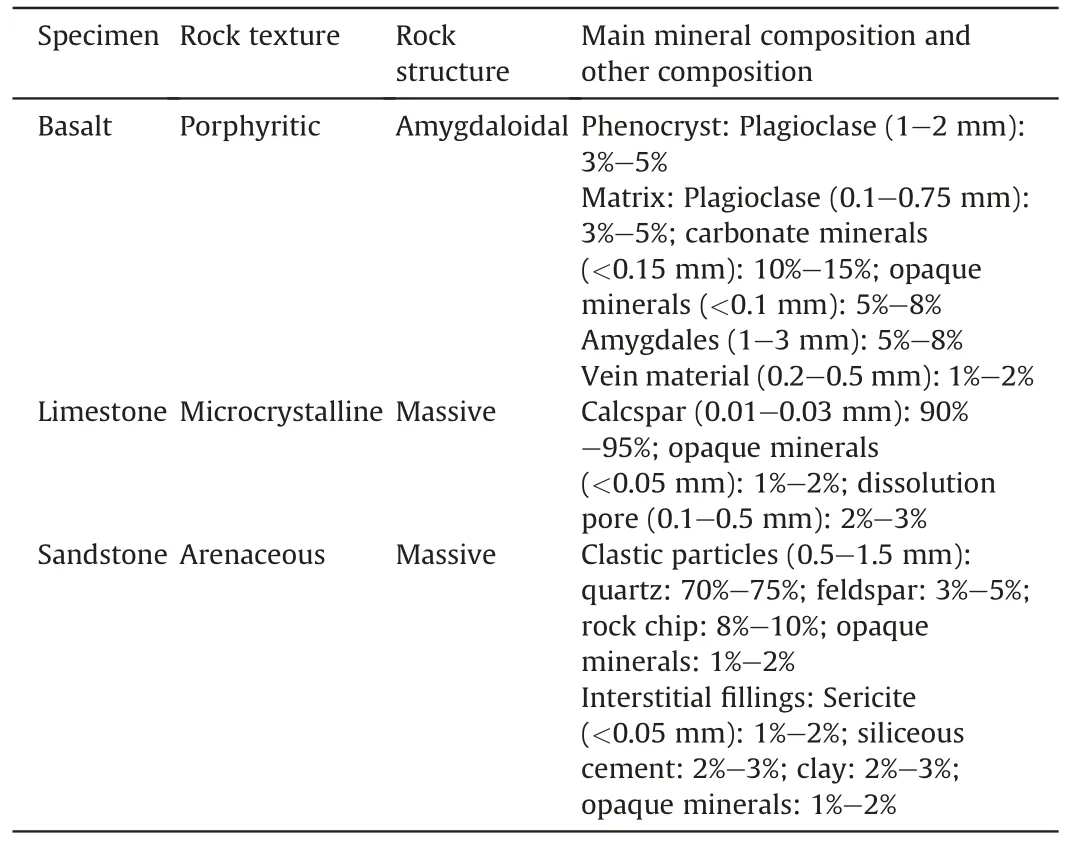
Table 2 Identification of rock and mineral components.
The three types of rocks were collected from the same engineering site.Then disc specimens with a height of 25 mm and a diameter of 50 mm were made for each rock type via coring,cutting and grinding.
2.2.Experimental set-up
The experimental set-up primarily includes four subsystems for shielding,load control,electromagnetic measurement,and data acquisition (Fig.1).
A GP1A detachable electromagnetic shielding box is used to reduce the substantial interference from the surrounding electromagnetic noise.Loading and signal measurements are performed in the shielding box,which also serves as ground potential.The shielding performance is as follows: 14 kHz ≥75 dB,100 kHz ≥95 dB,200 kHz ≥100 dB,50-103 MHz ≥110 dB,1-10 GHz ≥100 dB,10-18 GHz ≥80 dB.
The loading process is controlled using a YAW-600 microcomputer-controlled electro-hydraulic servo pressure testing machine,with a mainframe stiffness over 5000 kN/mm and maximum testing force of 600 kN.Load control,displacement control,and deformation control are the available loading modes.The load resolution is 3 N,and the displacement resolution is 0.3 μm.The deformation resolutions measured using an extensometer or a grating ruler are 0.03 μm and 0.1 μm,respectively.The selectable sampling frequency of the controller can be up to 1 kHz.
The electromagnetic measurement system consists of four groups of three-axis electromagnetic antennas.The antennas can simultaneously sense electromagnetic radiation in three directions(x,yandzaxes are orthogonal to each other).The measurement range is ±0.5 μT,with a frequency range from 200 Hz to 300 kHz.No additional amplifier is required,since the output signal is amplified inside the antenna,and the output voltage range is±2.5 V.The linear fitting relationship between the signal amplitude of each axis and the cosine of different angles are shown in Fig.2.The relationship between the three-axis electromagnetic antenna and the included angle is linear.
The data acquisition subsystem consists of a high-speed data acquisition instrument and a data storage and analysis server.Theacquisition instrument has 12 data acquisition channels,the highest sampling frequency is up to 10 MHz,the A/D conversion accuracy is 16-bit,and the input signal voltage range is ±5 V.
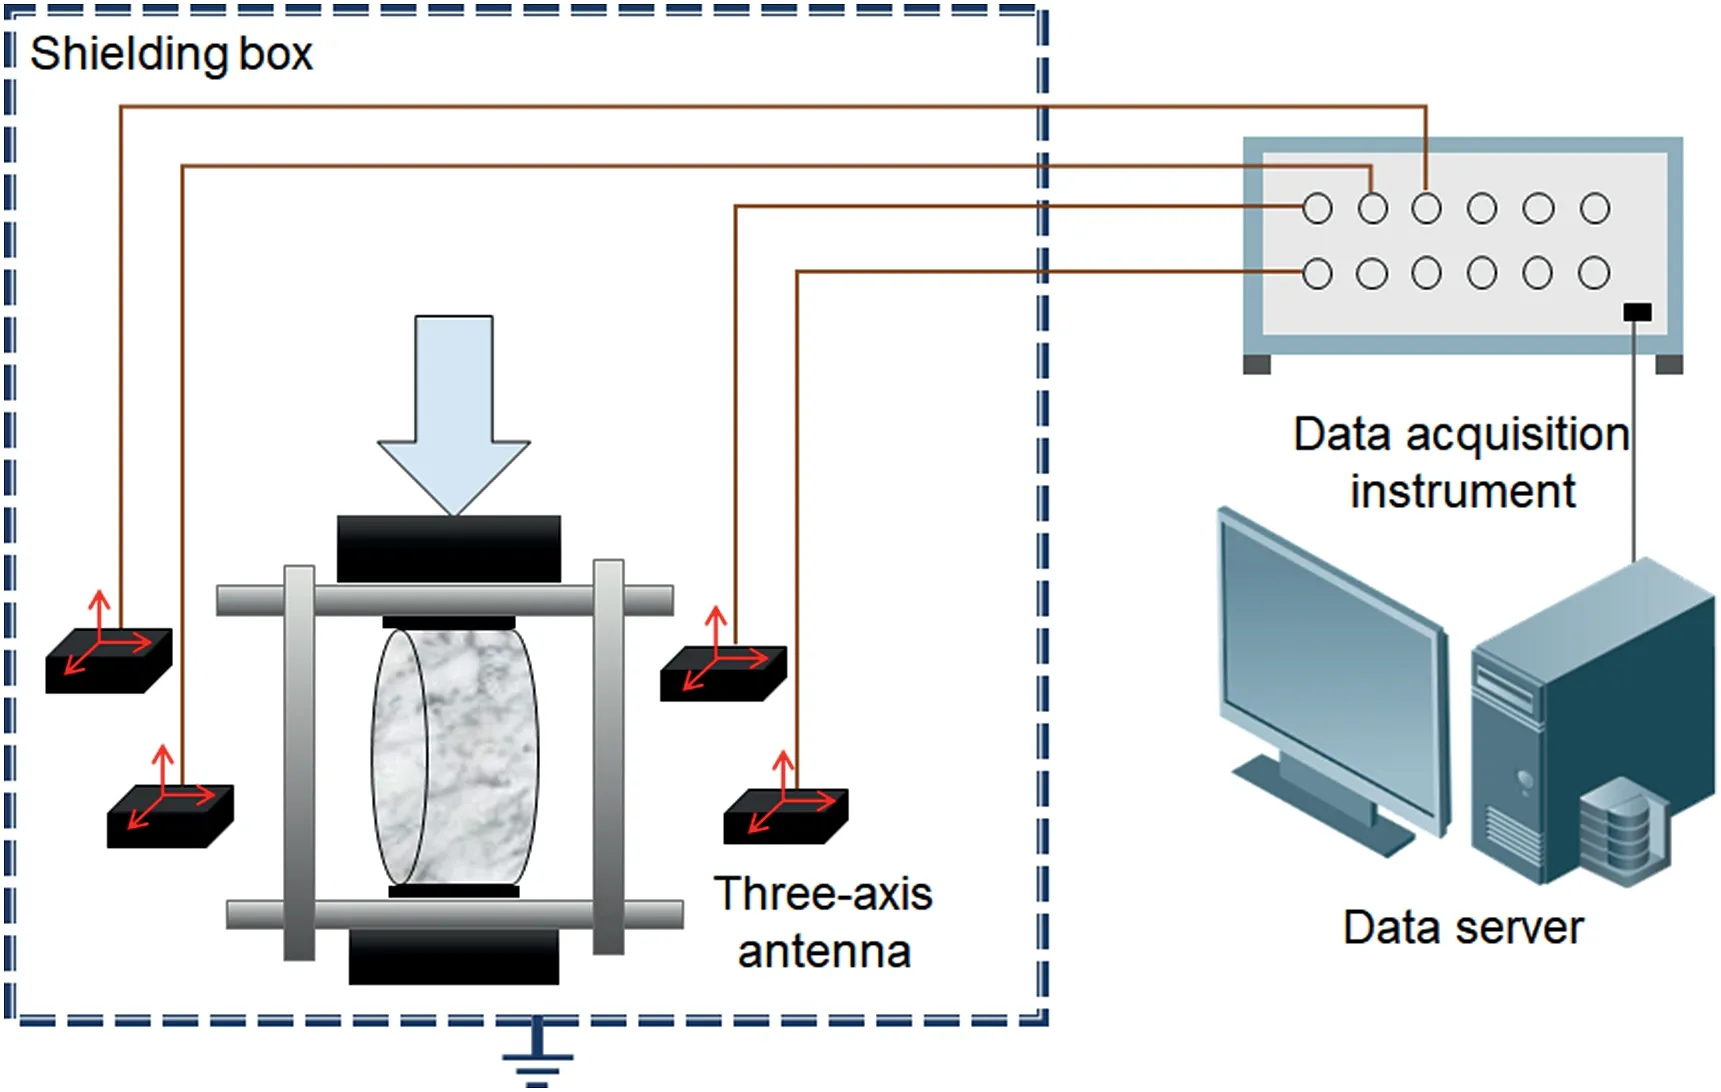
Fig.1.Experimental system diagram.
2.3.Experimental method
After the disc specimen is placed within the fixture,a total of 12 axes of the four groups of three-axis antennas are separately connected to the 12 channels of the acquisition instrument.The four antennas are centered symmetrically about the geometric center of the disc specimen (Fig.3a).Horizontal antennas are placed at the same height as the center of the specimen at a horizontal distance of 12 cm.In order to define the relative position of the three-axis antenna and the disc specimen,the coordinate system shown in Fig.3b is established,in which thex-axis is parallel to the blade of the fixture,they-axis is parallel to the end surface of the disc sample,and thez-axis is parallel to the loading direction.The three axes of each antenna must follow the coordinate system,i.e.the direction of each axis must be parallel to a certain axis of the coordinate system.
The displacement control method is applied to Brazilian test for the three types of rocks,and the loading velocity is set to 5 μm/s.The sampling frequency of acquisition is 2 MHz.The fixture has a base load when arranging the antennas,and the signals of all channels are collected and checked under this condition to ensure that there is no significant interference.After checking,the loading and signal acquisition are started simultaneously.Experiments are carried out at room temperature.When the specimen fractures,loading is automatically stopped according to the preset end conditions,the signal acquisition is manually stopped,the specimen fracturing is observed,and the necessary experimental parameters are recorded.
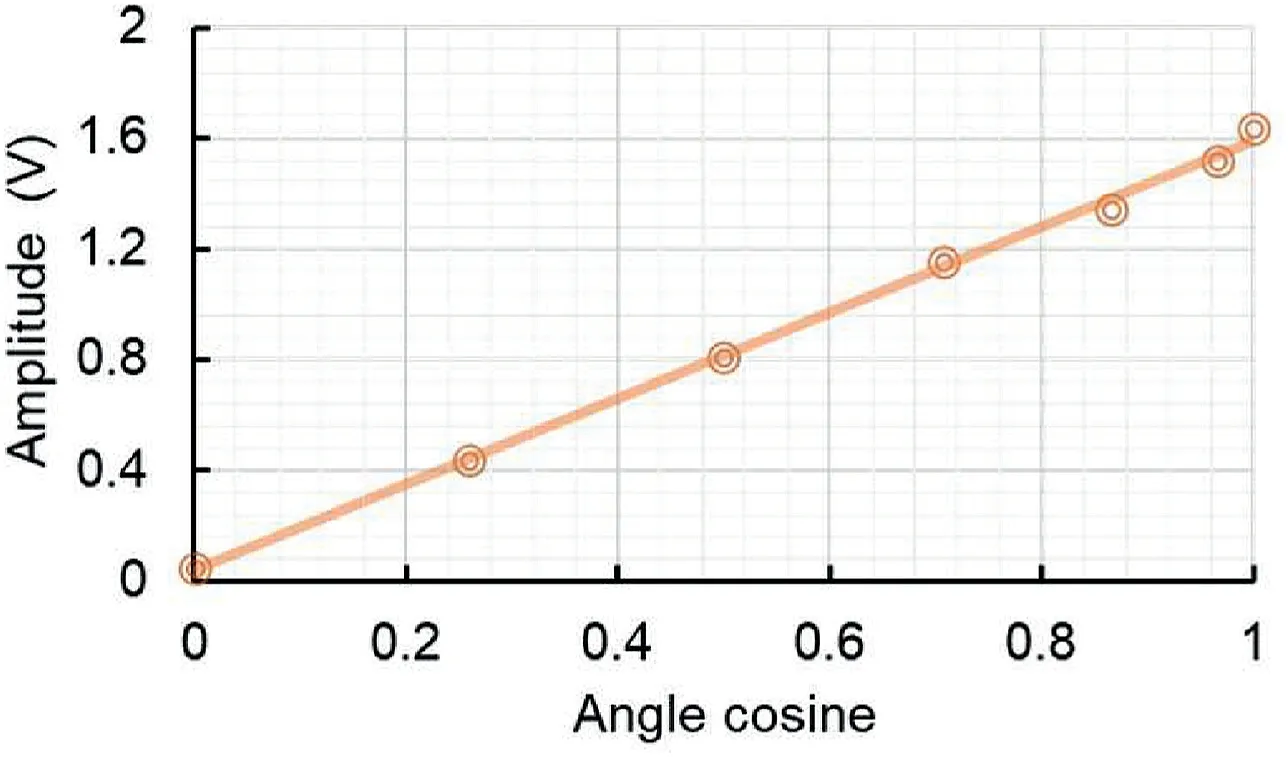
Fig.2.Relationship between the signal amplitude and the angle cosine.
3.Results
3.1.Electromagnetic response in the loading process
3.1.1.Load-electromagnetic response during the complete loading process
Fig.4 shows the typical load-axial displacement curves during the Brazilian tests on the three types of rocks.As the axial displacement increases gradually,the load curve goes through the development process of compaction stage,linear stage and peak drop,showing the characteristics of brittle fracture as a whole.There is no secondary loading process for this fracture mode.The failure mode of each specimen is consistent with the characteristics of the load-displacement curve,the crack surface is relatively smooth,and the position is basically in the plane where the center line of the two fixtures is located.
The parameters and results of the Brazilian test for the various rock types are listed in Table 3.The tensile strength is represented by the mean of the results of each experiment,and the ratio of the standard deviation to the mean is defined as the coefficient of variation.The tensile strength of each specimen is calculated by

Table 3 Parameters and results of Brazilian test on three rock types.

where σTSis the tensile strength;Pmis the peak load;andDandlare the diameter and thickness of the disc sample,respectively.
Due to the single failure mode of the specimen,the electromagnetic radiation signals generated during the experiment are also relatively simple and few.Fig.5 shows the loading curve and response curve of the three-axis electromagnetic antenna during the Brazilian test of the limestone specimen.At the moment when the rock disc splits,the load drops sharply,and a corresponding electromagnetic radiation signal is generated.The rest of the experimental process also shows the above characteristics.The signal response of the three-axis electromagnetic antenna is concentrated on the peak load and the load decrease stage after the peak.
3.1.2.Comparison of three-axis response of a single antenna
Signals measured by the three-axis electromagnetic antenna just before and after the peak load are plotted in Fig.6a.Signals processed by wavelet filtering do not fluctuate up and down near the zero axis.Also,the peaks and troughs are far apart,which are not sinusoidal or oscillating attenuation signals.Significant rise and decay times cannot be ignored in the signals of each channel.In spite of the inconsistent starting points,the rise time on each axis is basically the same;however,there are some differences in the decay times as well as the phases of signals.
The fast Fourier transform (FFT) is performed on the signals from the three-axis antenna,showing the frequency domain characteristics.The frequency bands of signals measured by the three-axis antenna are narrow and range from 0 to 30 kHz(Fig.6b).The amplitude-frequency distributions of the three-axis signals are basically the same.In particular,the dominant frequency of each axis is concentrated from 5 kHz to 10 kHz,centered at 7.95 kHz.The measured signals are proposed to be caused by the same fracture.The signal amplitude corresponding to the dominant frequency of each channel is slightly different.
The above results show that for a three-axis electromagnetic antenna,signals measured in thex-,y-andz-axis directions show significantly different response characteristics in the time domain.However,in the frequency domain,the frequency bands of the three channels are the same,and the dominant frequencies are relatively similar,even the amplitude-frequency distributions are similar.It can be reflected that the electromagnetic radiation signals generated by the same fracture differ in the three directions.The signal amplitudes of the three axes represent the magnitude of the actual electromagnetic radiation on thex,yandzaxes.
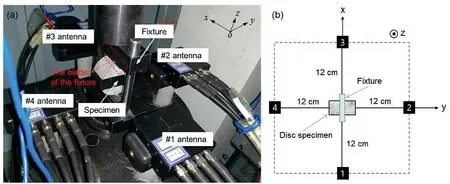
Fig.3.Electromagnetic measurement system: (a) Antenna layout,and (b) Coordinate system.
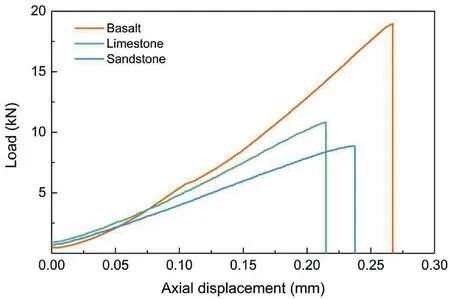
Fig.4.Typical load-axial displacement curves during the Brazilian tests.
3.2.Intensity of electromagnetic vector field generated from fracturing
3.2.1.Signal intensity of antennas at different locations
Signal intensities of the four antennas at different positions in the direction of each coordinate axis are counted for quantitative comparison.Here,intensity is defined as the maximum absolute value of obtained signals at the current measurement (Fig.7).
In addition to the significant differences in the signal intensities of the three axes of antennas,antennas at different positions also show significant differences.For the electromagnetic signals generated during Brazilian test on various rock types,the signal intensities measured by the #1 and #3 antennas have similar characteristics,and the distribution between three axes forms a‘V’shape.The signal intensity on they-axis is significantly less than that onx-andz-axis.However,for the #2 and #4 antennas,the signal intensity on the three axes does not show a consistent pattern for various rock types.
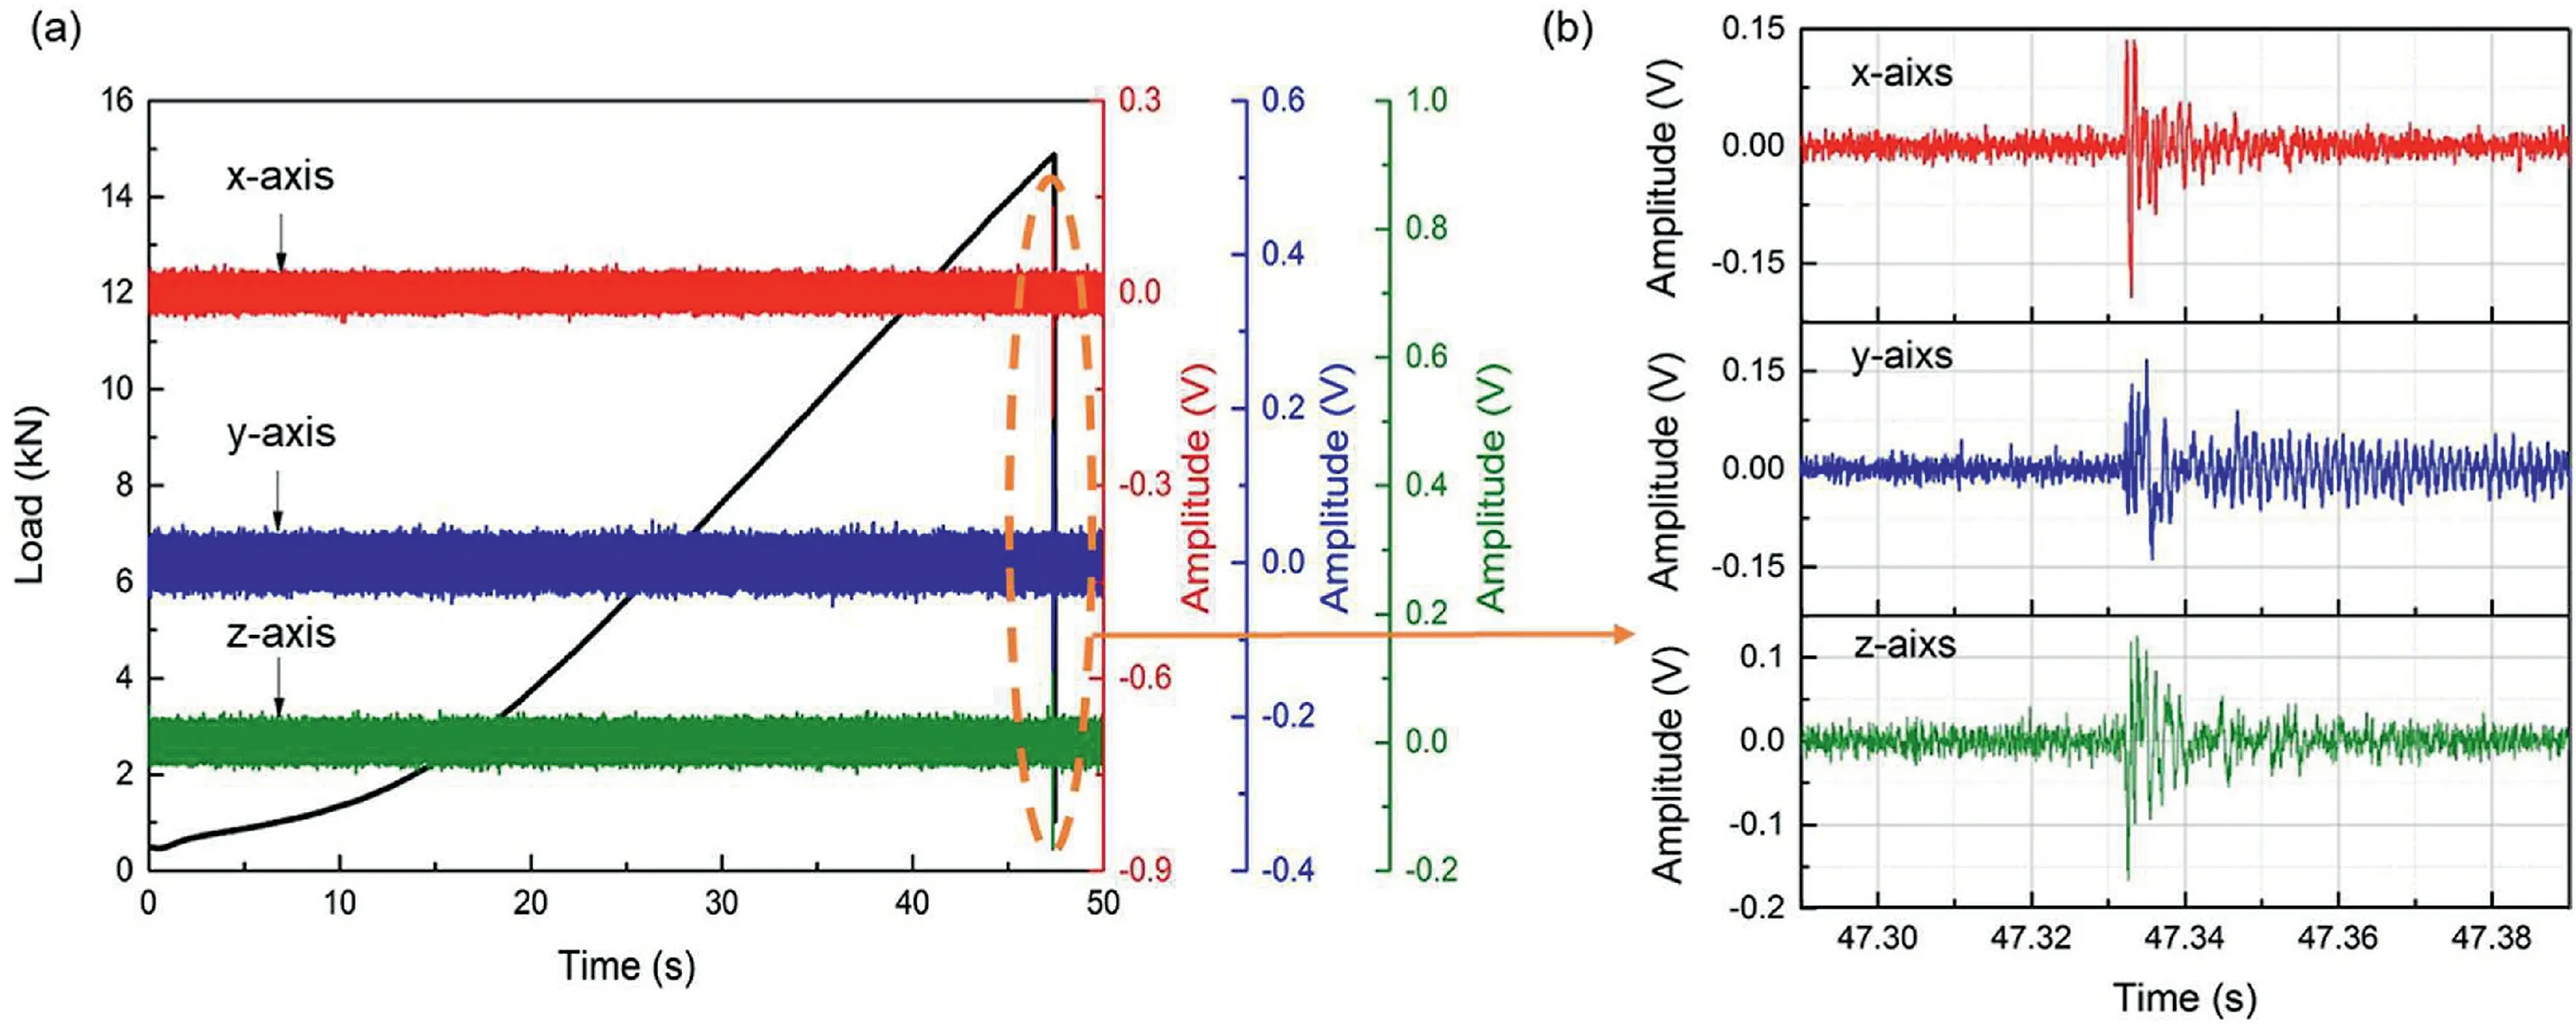
Fig.5.Typical load and electromagnetic radiation response curves for rock in the Brazilian test.
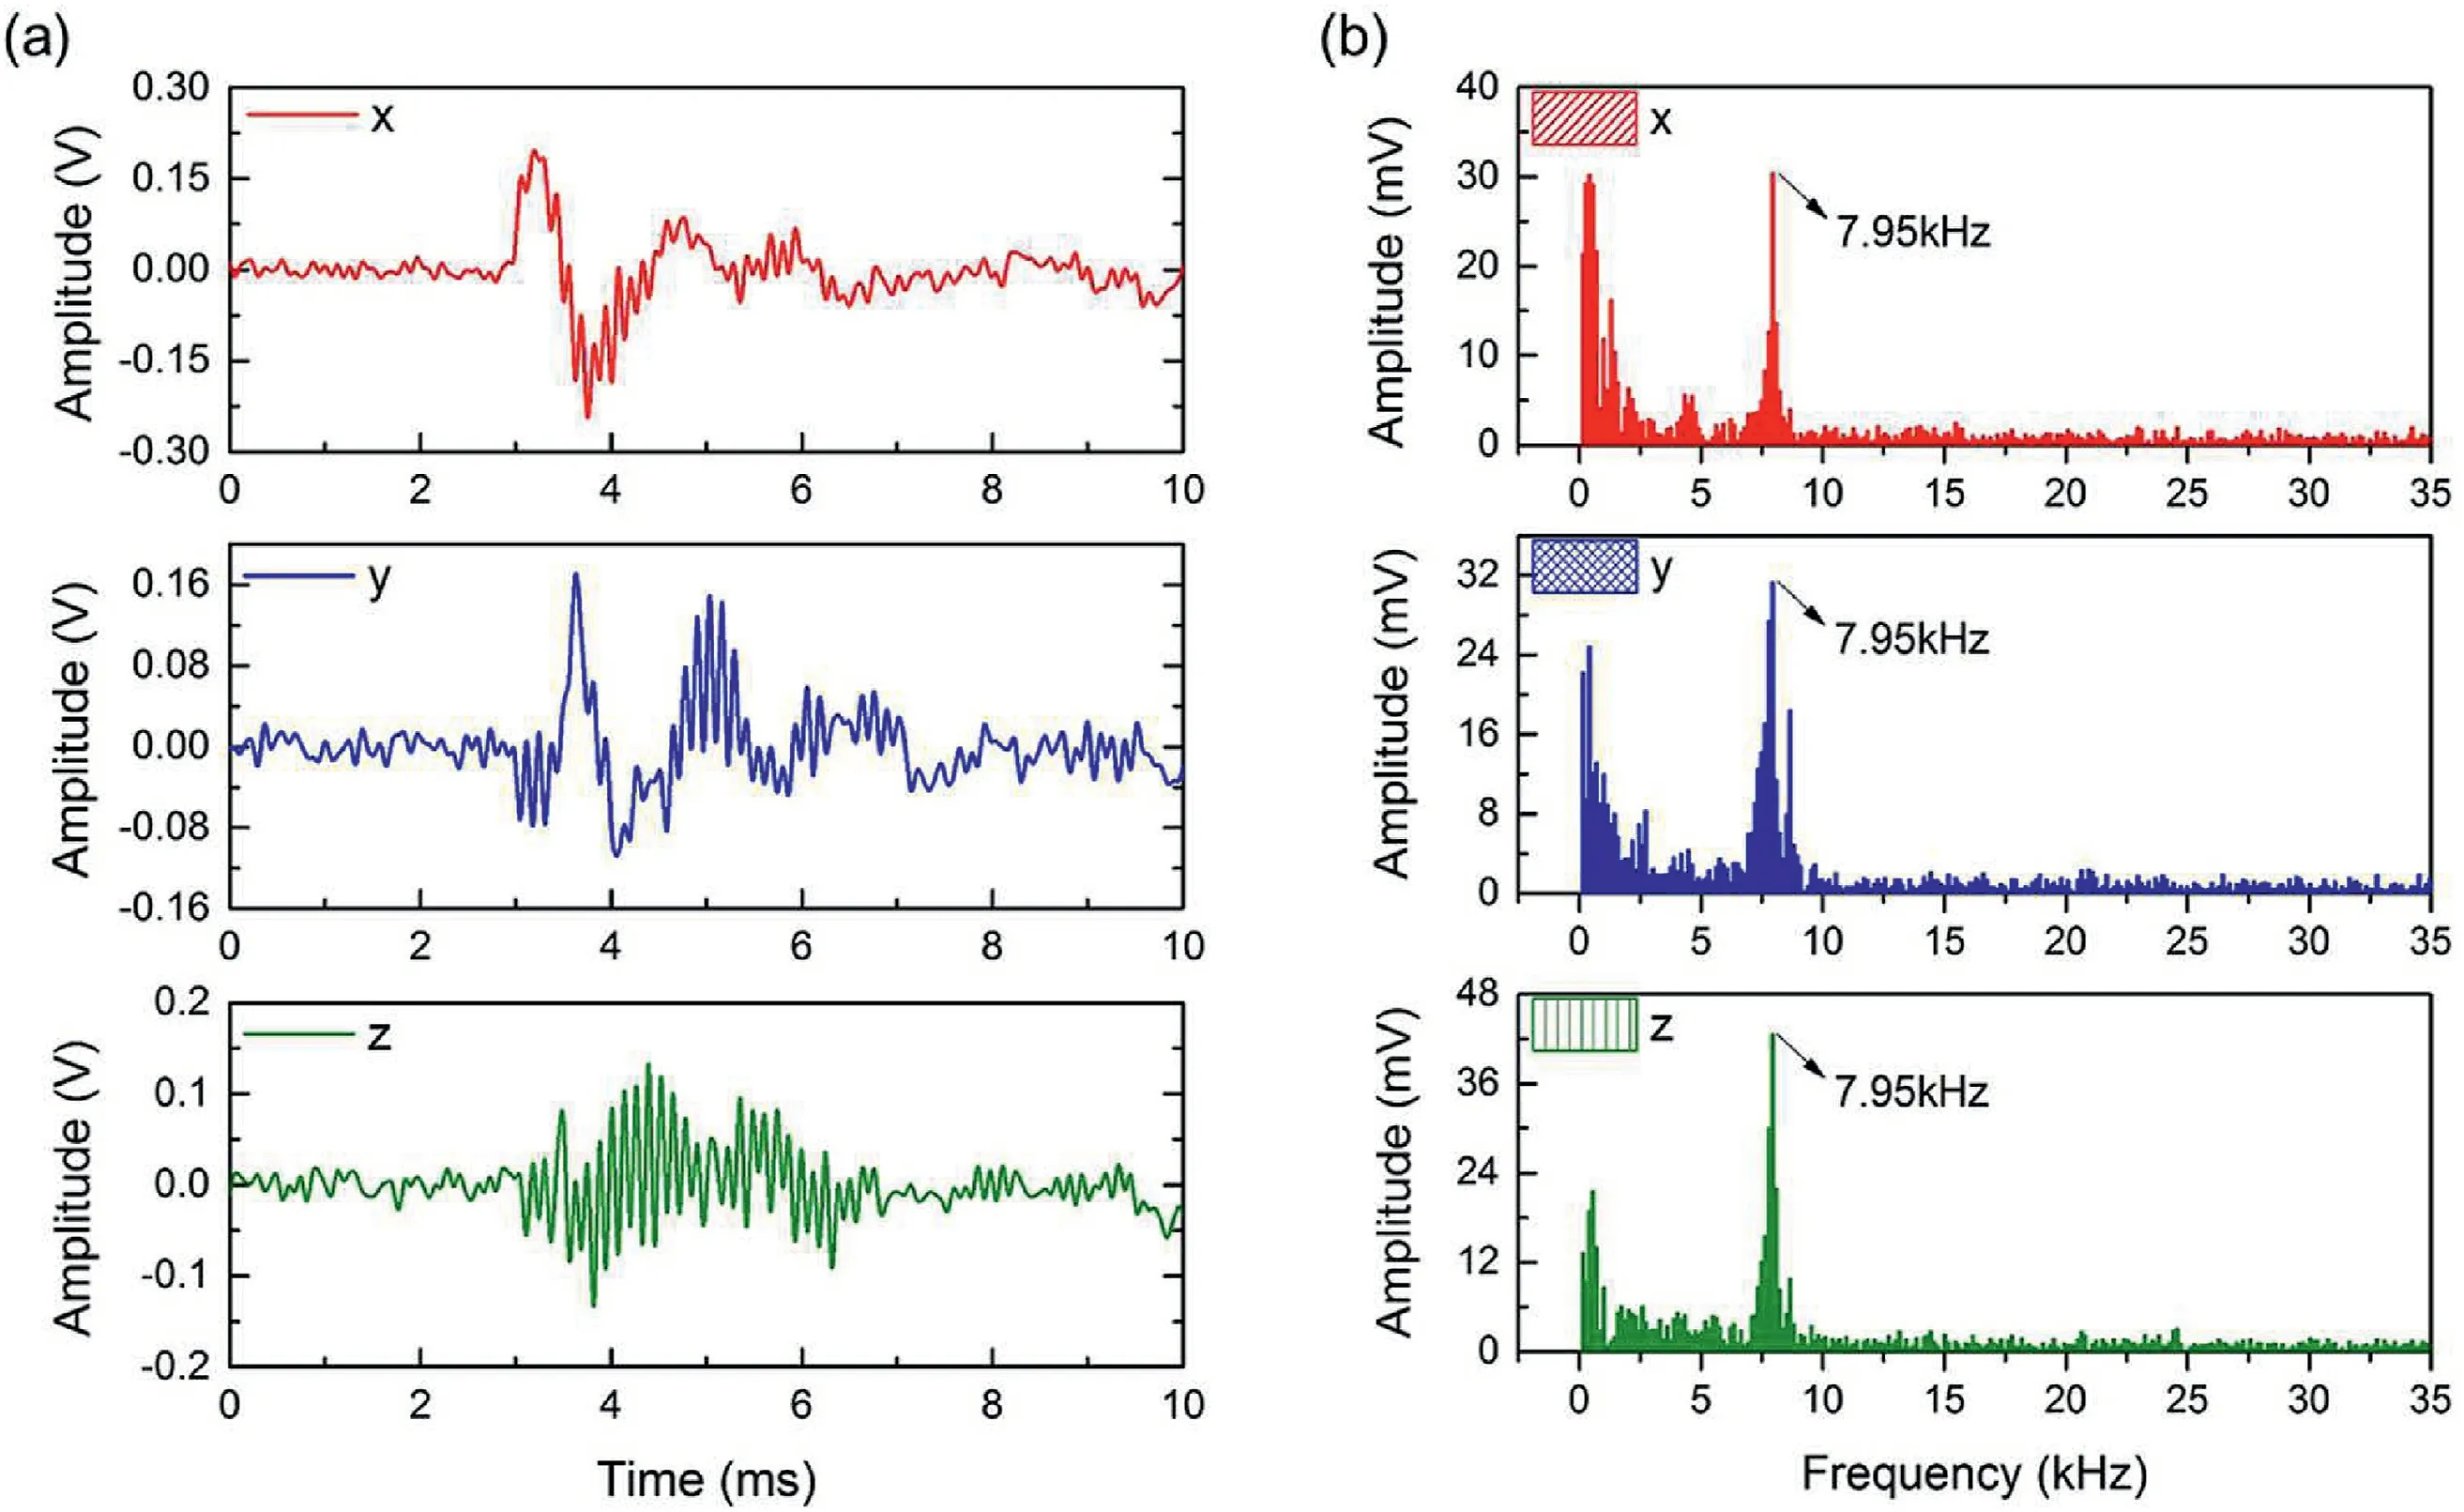
Fig.6.Electromagnetic signals in three directions generated from Brazilian test of shale: (a) Time domain,and (b) Frequency domain.
3.2.2.Total signal intensity of antennas at different positions
The signals from the three channels can be regarded as components of the electromagnetic vector in three orthogonal directions.Therefore,waveforms on the three axes of each antenna are subjected to vector synthesis to analyze differences at various positions.The modulus of the synthesized vector is regarded as the total amplitude.The synthesized signals at multiple measuring points generated by the three types of rocks are shown in Fig.8.
Taking limestone as an example,a certain similarity is visible in the signal curves of the four antennas.Before the specimen fractured,the total amplitudes show a low-level fluctuation near zero.At the moment when the splitting fracture occurs,the total amplitude of each antenna increases instantaneously.After reaching a certain peak,it quickly drops to a low value and then rises,beginning to fluctuate.Significant peaks in the total intensity curves are concentrated at the early stage.The peaks are few in number with a short duration as well as fluctuate and decay at lower values.Synthesized signals for basalt and limestone show similar characteristics.
The maximum values of the total intensity curve of each antenna in the Brazilian tests are extracted(Fig.9).For#2,#3 and#4 antennas,the maximum intensity level of the composite signal is equivalent,and the#1 antenna has a significantly larger total signal intensity.The difference in total intensity at symmetrical locations indicates that the electromagnetic vector field generated from the Brazilian test is not uniformly distributed around the crack.
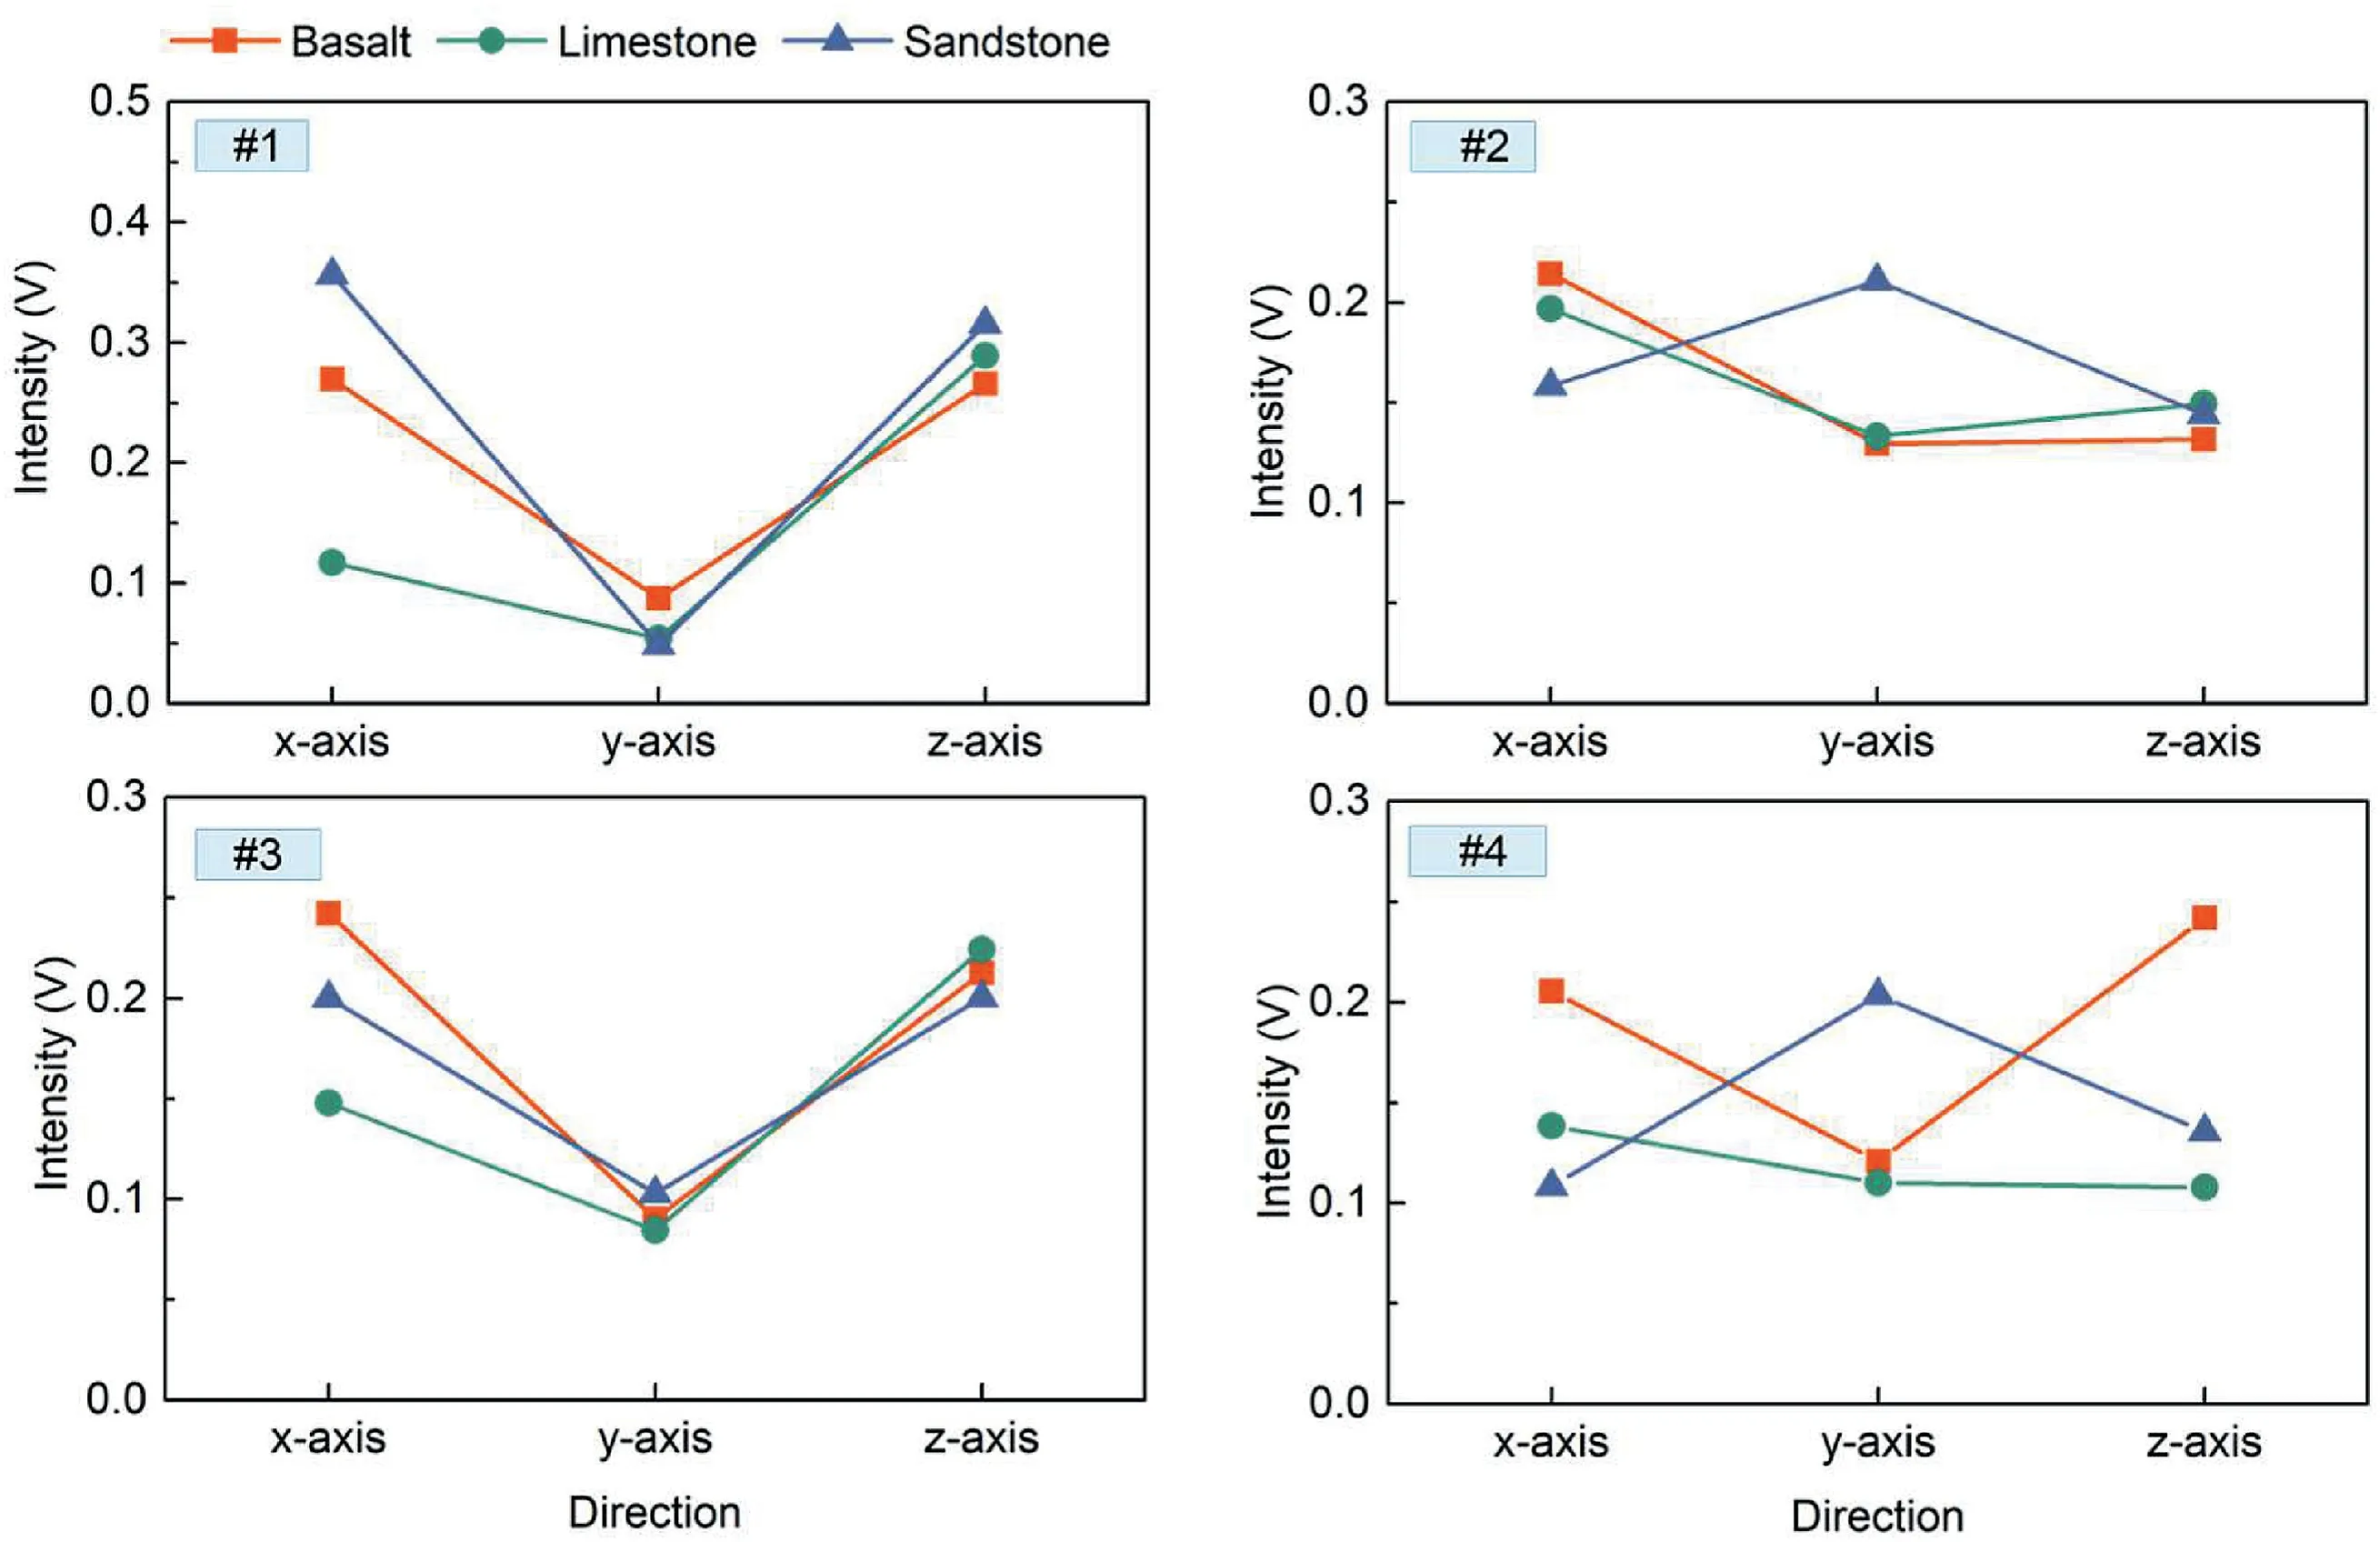
Fig.7.Signal intensity in each direction of antennas at different locations.
3.3.Directionality of electromagnetic vector field generated from fracturing
3.3.1.Electromagnetic vector directionality at different positions
For the synthesized signals,the Pearson correlation coefficients are obtained using two antennas as a group.Fig.10 shows the correlation coefficients of the synthesized signals between the antennas at different positions for different rock types.There are clear correlations between the synthesized signals of the antennas at each position,but the correlation degree varies for different specimens.The correlation coefficients follow similar patterns to the previous signal intensity distributions.Despite the same two pairs of symmetrical antennas,the #1-#3 antenna pair shows a more significant correlation compared to the#2-#4 antenna pair.The four antennas are divided into two symmetrical antenna pairs for comparison and analysis.
The signal amplitudes corresponding to the three axes when the antenna reaches the maximum value at each position are separately extracted to construct the vector Hmax=(Hx,Hy,Hz) of synthesized signals,which obeys the following spatial relationship:

where n is the normal vector for each plane;and α,β and γ are the angles between the vector and theOxy,OxzandOyzplanes formed by the three test axes,respectively.
Using Eq.(2),the angles between the magnetic flux density of each antenna position and the three planes based on the maximum of composite signals are obtained.The calculated results are listed in Table 4.
Although the synthetic signals of the three rock types show significantly different characteristics,the variation laws of the angle between the maximum value and the plane of different coordinate axes are similar.For the four antennas at different positions,the angle between the magnetic flux density and theOxzplane is the smallest.The angle of the #1-#3 symmetrical antenna pair with theOxzplane is significantly less than that of the #2-#4 symmetrical antenna pair.For the angle between theOxyandOxzplanes,the #1-#3 antenna pair is slightly larger than the #2-#4 antenna pair.
Fig.11 shows the statistical results of the azimuths of antennas at different positions for rock specimens fractured by Brazilian test.For the #1 and #3 antennas,the angle between the magnetic flux density and theOxzplane is significantly smaller than that of theOxyplane and theOyzplane.However,for the#2 and#4 antennas,the magnetic flux density has the same horizontal range as the angle between the three planes.
3.3.2.Crack surface position and electromagnetic vector direction
The correlation between electromagnetic radiation and cracks has been verified in experiments at various scales(Tian et al.,2020,2022;Wei et al.,2020).Differences in the intensity and direction of electromagnetic radiation signals at different positions are related to crack direction.Fig.12 shows the positional relationship between the crack surface of the rock disk as well as the four antennas and three test axes of antennas in this experiment.They-axis of the antenna is perpendicular to the crack surface,and the #2 and #4 antennas are on theOyzplane perpendicular to the crack surface,while#1 and#3 antennas are on theOxzplane parallel to the crack surface.The arrangement of the #3 antenna in the experiment makes its positive coordinate axis direction inconsistent with the other antennas.
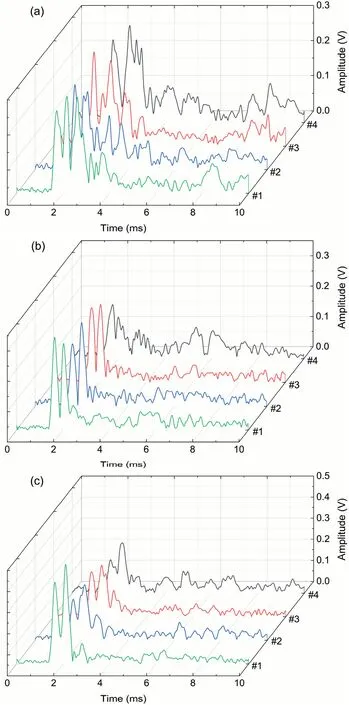
Fig.8.Synthesized signals of antenna at each position for(a)basalt,(b)limestone,and(c) sandstone.
According to the results in Table 4 and Fig.11,for the#2 and#4 antennas perpendicular to the crack surface,the angle between the magnetic flux density vector at the maximum of composite signals and the three coordinate axis planes is between 30ºand 40º.The magnetic flux density vector does not point directly at the center of the specimen.Although the crack initiates from the center,it continues to propagate upward or downward with the loading and eventually penetrates to form the crack surface.For the#1 and#3 antennas parallel to the crack surface,the included angle between the magnetic flux density vector and theOxzplane is significantly less than the other two coordinate axis planes.In other words,the direction of the magnetic flux density measured by the antenna is relatively parallel to the crack surface.Especially for #1 antenna,the angle between the magnetic induction flux density vector and theOxzplane is less than 10º,which is approximately parallel to the crack surface.Although previous research results did not provide specific data for comparison,the signal intensity of the#1 antenna is stronger than that of the #3 antenna,indicating that the signal intensity is greater in a direction close to parallel with the crack surface,which is verified by previous research results on fracture directionality (Takeuchi and Nagahama,2006;Gade and Sause,2017;Rabinovitch et al.,2017).Signal intensity of the #3 antenna is also slightly stronger than that of the #2 and #4 antennas.

Table 4 Angles between the maximum of composite signal of each antenna at different positions and the plane of different coordinate axes.
4.Discussion
4.1.Crack propagation and directionality during Brazilian test
The Brazilian test is an indirect tensile testing technique used to measure the tensile strength of brittle materials (such as concrete,glass and glass ceramics) under static loading (García et al.,2017).The fixed loading method used in our Brazilian test is shown in Fig.13a.The specimen and the block are in contact along the geometric boundary.Thus,a uniform load is applied in the contact area to compress the disc-shaped sample in the radial direction.A tensile stress is then introduced into the specimen perpendicular to the loading direction,which causes the specimen to fracture.Experiments are based on following assumptions: isotropic and homogeneous materials generate elastic deformation under load,and the tensile strength is less than the compressive strength and shear strength.The force diagram shown Fig.13b is derived from the elastic mechanical solution of a concentrically compressed disc problem under a concentrated force(Li et al.,2015a,b).According to linear elastic superposition,the stress state of a disc specimen can be superimposed by a pair of symmetrical line loadsPand tensile stresses evenly distributed on the disc circumference with the magnitude of 2P/(πdl).The superimposed result is that the disc circumference is free.
In the coordinate system,for any pointM(x,y) in the disc,the stress components are
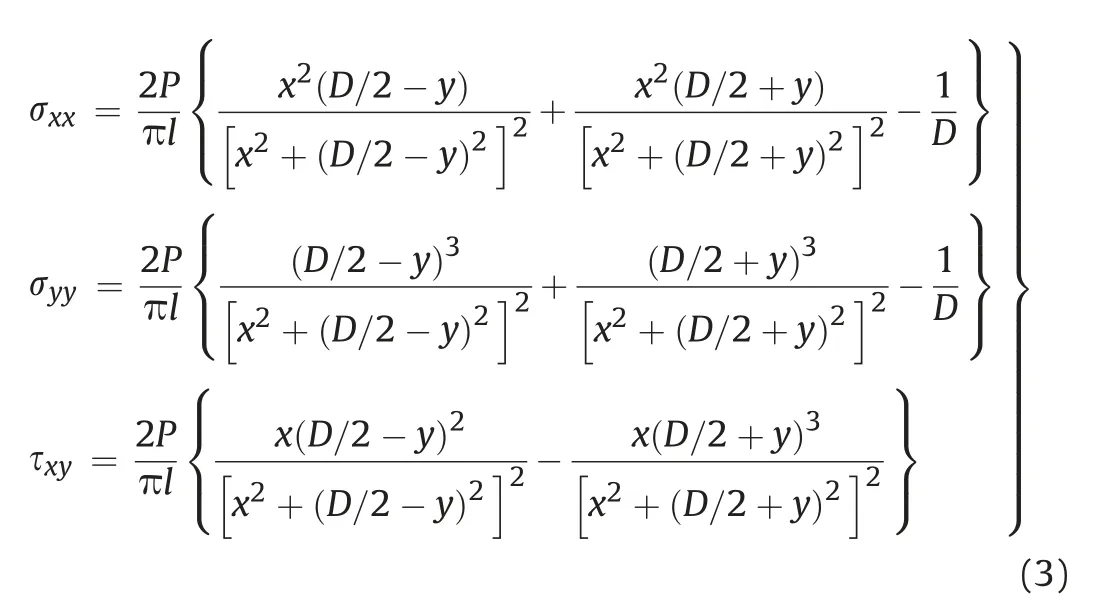
According to Eq.(3),stress components on the diameterAB(wherex=0) are

Stress components on the diameter perpendicular to the diameterAB(y=0) are
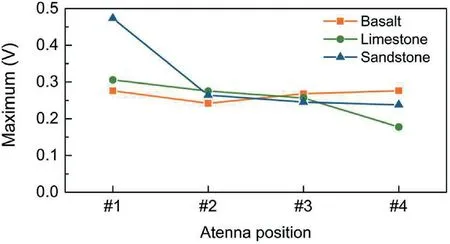
Fig.9.Maximum synthesized signal at each position.

Under three-dimensional loading conditions,the stress distribution in a standard disc is much more complex,and the origin of the crack depends on the strength criterion used.The Griffith criterion (Griffith,1921) is widely used in brittle or quasi-brittle materials,where crack initiation occurs at the point of maximum equivalent stress,expressed as

where σGis the Griffith equivalent stress;and σ1and σ3are the maximum and minimum principal stresses,respectively.
When the Griffith equivalent stress is greater than or equal to the uniaxial tensile strength,failure occurs.The greatest tensile stress is generated at the geometric center of the disc,where the principal stress has followed the relationship σ1+3σ3=0.The fracture conditions are first satisfied at the center of the disc,and the continuous expansion of central cracks eventually causes the entire specimen to split in half.
However,in actual specimens,random and non-randomly oriented microcracks are present (Cai,2013).In addition,the anisotropy of rock itself may make modifying the tensile strength results of Brazilian tests necessary.Previous experimental results(Aliabadian et al.,2019) show that varieties of anisotropy angles have no effect on the crack initiation location in the Brazilian tests.Cracks still initiate in the center of the specimen,and with the accumulation of tensile strain,the fracture process area continues to develop until the rock fractures.
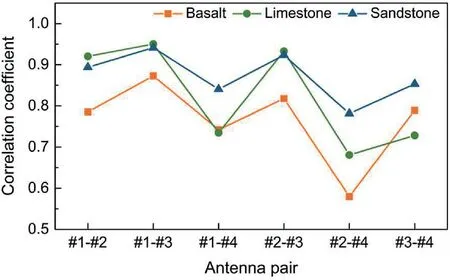
Fig.10.Correlation coefficients between synthesized signals for each antenna.
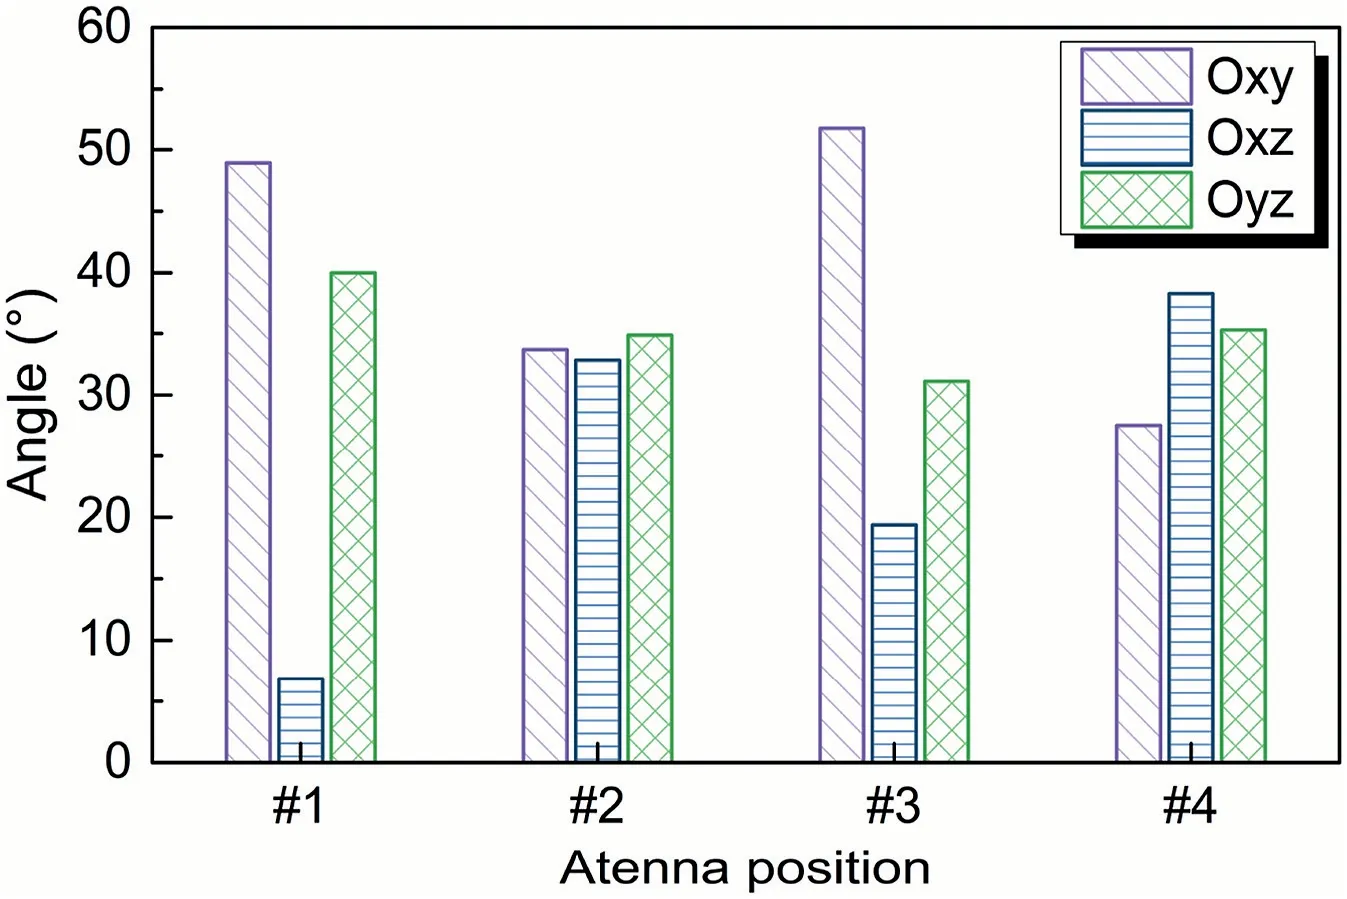
Fig.11.Angles between the vector and the plane of different coordinate axes at each antenna position.
4.2.Generation mechanism and directionality of electromagnetic vector field induced by rock fracturing
The generation process of electromagnetic radiation is the comprehensive result of multiple factors.Regardless of the fracture form,from an energy point of view,electromagnetic energy originates from the energy dissipation of the rock failure process.Some rocks contain special mineral compositions or structures,and mechanisms such as the piezoelectric effect may exist.Mechanical properties and cracking morphology may also have a great influence on the fracture-induced electromagnetic field(Lin et al.,2021).However,the fact that numerous micro-cracks form during rock fracturing as well as the corresponding charge separation and movement processes cannot be ignored(Wei et al.,2020).
Before final failure of the rock specimen,there are numerous microcracks in the rock mass (Fig.14a).The crack propagation process is nonlinear,and the crack vibration is not uniform.In this process,due to the rupture of the intermolecular bonds,a charge separation forms at the crack tip,and the bound charges on the crack surface are redistributed for nonlinear motion.The final measured electromagnetic field vector is caused by the combined effect of plenty of charge separation,vibration and movement.Therefore,the field source of the fracture-induced electromagnetic radiation is equivalent to a charge aggregate(Fig.14c).To describe the composite electromagnetic radiation generation process,the following situation is assumed: arbitrarily distributed charges are assumed to be primarily restricted to move within a finite volume near the origin.

Fig.12.Positional relationships between the crack surface and three-axis sensors:(a)y-axis perpendicular to the crack surface,(b)Oyz-plane perpendicular to the crack surface,and(c) Oxz-plane coincides with the crack surface.
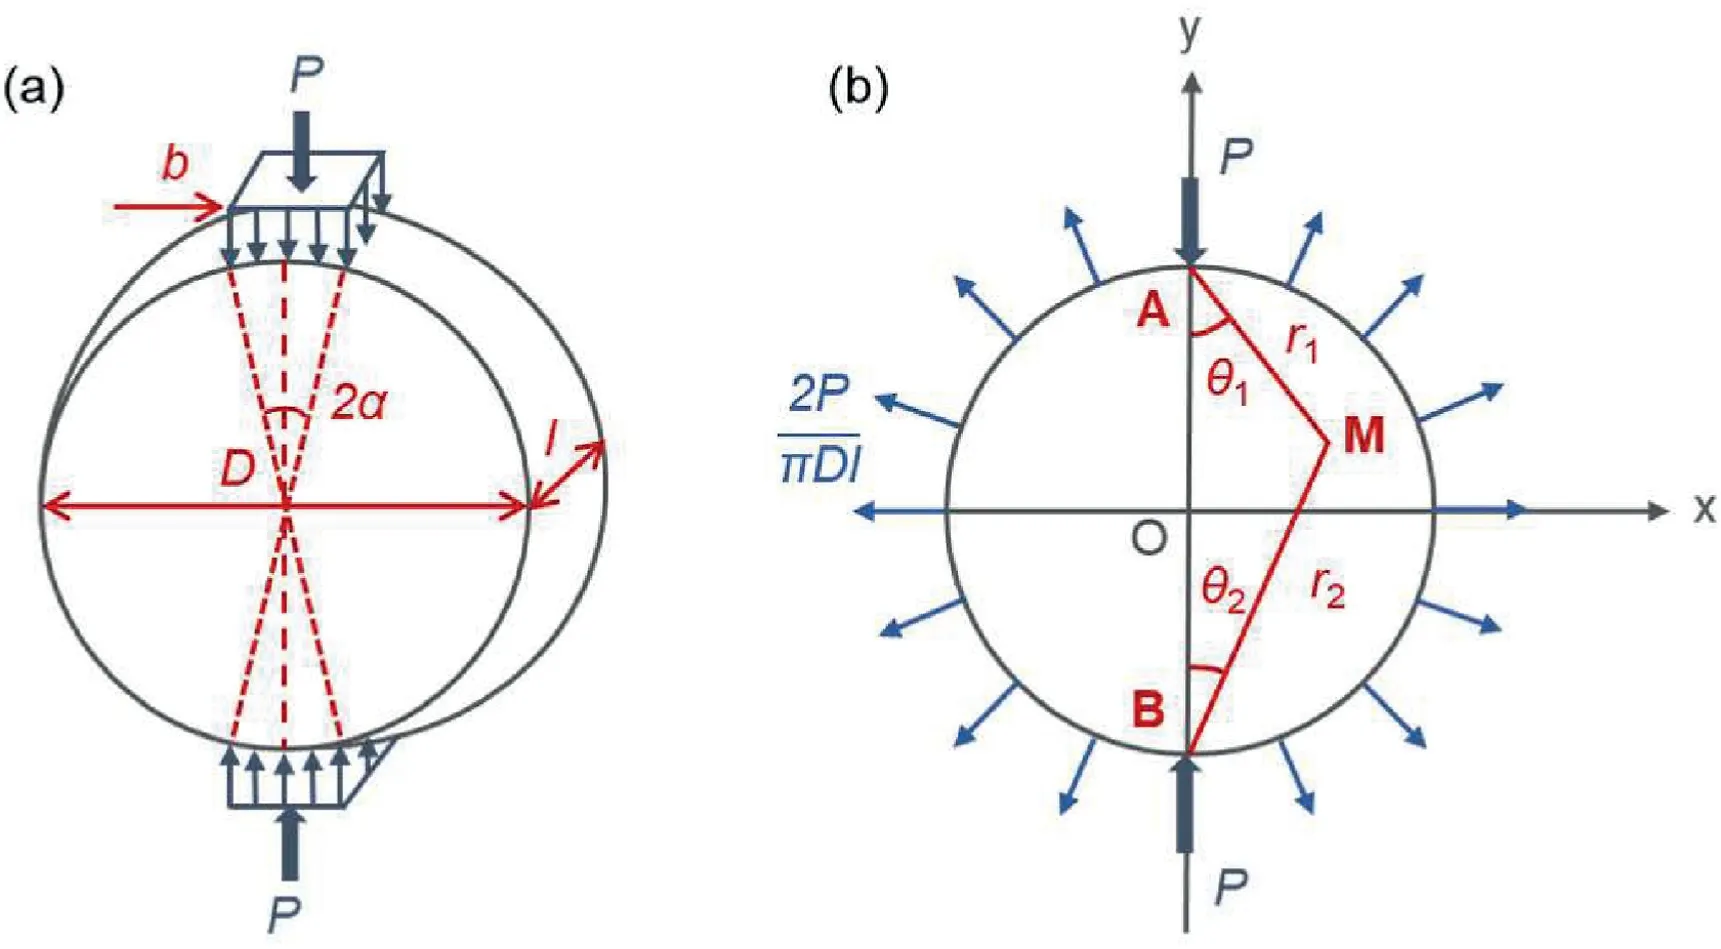
Fig.13.Brazilian test principle: (a) Experimental sketch,and (b) Force diagram.
It is also assumed that field point distance is much greater than the field source,i.e.

whereris the distance from origin to the field point,whiler′is the distance from origin to the center of the assumed charge aggregate.
The scalar form of the retarded potential is (Griffiths,1998):
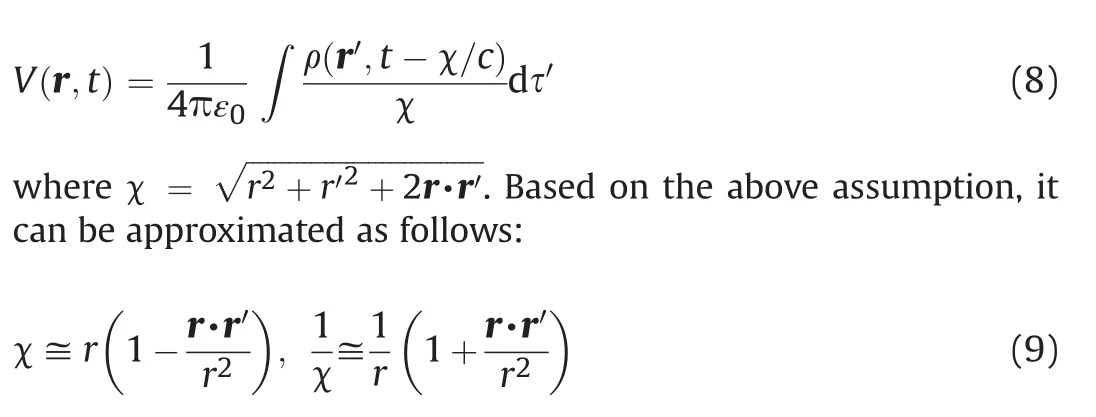

Fig.14.Mechanism of electromagnetic radiation generated by rock fracturing: (a) Microcracks contained in a rock mass with a certain volume,(b) Charge separation and redistribution near the crack tip,and (c) Arbitrarily distributed charges assumed to be restricted within a finite volume.
Let the retarded time be equal tot0,then according to Taylor series expansion,we have

Since higher-order terms can be ignored,Eq.(8) can be approximated as
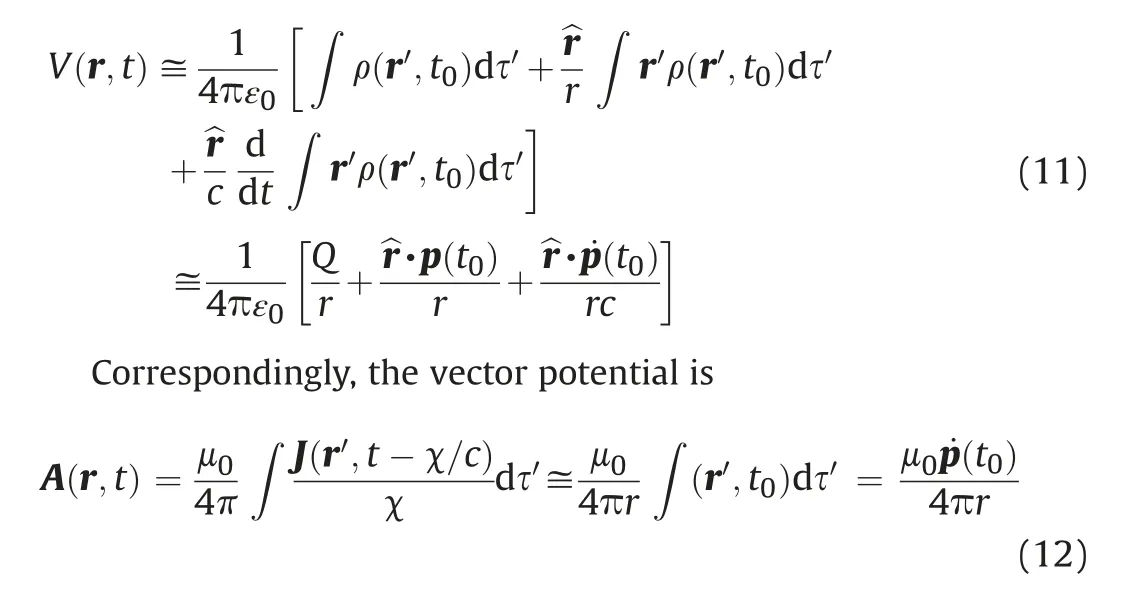
where ε0is the vacuum dielectric constant,μ0is the vacuum permeability,ρ is the charge density per unit volume,cis the speed of light,Qis the total accumulated charge,p is the electric dipole moment,J is the volume current density,and ˙p is the first derivative of the electric dipole moment.
The electric and magnetic fields,represented by E and B,respectively,in the radiation field range are as follows (Sharma et al.,2018):
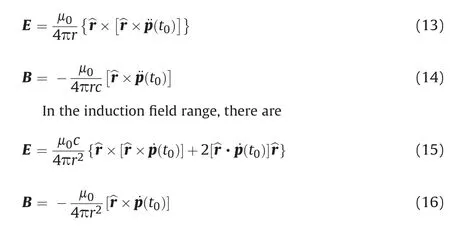
It can be concluded that the expressions of electric and magnetic fields are primarily related to the electric dipole moment and its derivatives,regardless of the range.
According to this expression,the direction of the magnetic induction flux density vector is perpendicular to the line between the field point and the equivalent charge source,instead of pointing to the field point from the field source,which is consistent with experimental results.This observation provides guidance for antenna arrangement in conventional experimental measurements,i.e.the antenna should be arranged parallel to the main crack surface in order to receive a stronger signal.
5.Conclusions
Brazilian tests are carried out on three rock types including basalt,limestone and sandstone.Four sets of three-axis electromagnetic antennas are used for simultaneous measurement in different directions.Differences in the three directions of electromagnetic radiation generated and measured at the same location are compared in terms of time and frequency.Furthermore,the intensity and directionality of electromagnetic vector field generated from rock fracturing are studied using vector synthesis.The main conclusions are drawn as follows:
(1) Electromagnetic radiation signals generated by the same fracture and received simultaneously by the antenna at the same position have clear directionality,and the responses in different directions significantly vary.The signal amplitude on each axis can represent the magnitude of the actual magnetic flux density on thex,yandzaxes.
(2) The total signal curves are similar at the four symmetrical positions;however,the intensity of the electromagnetic vectors generated from fracturing is not evenly distributed around the crack.Due to crack orientation,the response characteristics of the two pairs of symmetrical antennas on the plane where the crack surface is located and the plane perpendicular to the crack surface are different.
(3) The direction of the magnetic flux density of the electromagnetic field generated by Brazilian test tends to be parallel to the crack surface.The measured signal intensity is greater in a direction parallel or near parallel to the crack surface.
Declaration of competing interest
The authors declare that they have no known competing financial interests or personal relationships that could have appeared to influence the work reported in this paper.
Acknowledgments
This work was supported by the National Natural Science Foundation of China (Grant No.51904019),Key Scientific Research Projects Plan of Henan Higher Education Institution (Grant No.21A620001),and Fundamental Research Funds for the Central Universities (Grant No.FRF-IDRY-20-006).
 Journal of Rock Mechanics and Geotechnical Engineering2023年2期
- Journal of Rock Mechanics and Geotechnical Engineering的其它文章
- On the critical particle size of soil with clogging potential in shield tunneling
- Experimental investigations on effects of gas pressure on mechanical behaviors and failure characteristic of coals
- Strength and deformation characteristics of irregular columnar jointed rock mass: A combined experimental and theoretical study
- Spatial distribution and failure mechanism of water-induced landslides in the reservoir areas of Southwest China
- A multi-purpose prototype test system for mechanical behavior of tunnel supporting structure: Development and application
- Geotechnical investigation of low-plasticity organic soil treated with nano-calcium carbonate
