Strength and deformation characteristics of irregular columnar jointed rock mass: A combined experimental and theoretical study
Xiangcheng Que ,Zhende Zhu ,Yanxin He,* ,Zihao Niu ,Haonan Huang
a Key Laboratory of Ministry of Education of Geomechanics and Embankment Engineering,Hohai University,Nanjing,210098,China
b Jiangsu Research Center for Geotechnical Engineering,Hohai University,Nanjing,210098,China
Keywords:Irregular columnar jointed rock mass(ICJRM)Physical model test Anisotropic characteristic Empirical relations Dip angle Modified joint factor
ABSTRACT The irregularity of jointed network poses a challenge to the determination of field mechanical parameters of columnar jointed rock mass (CJRM),and a reasonable prediction of deformation and strength characteristics of CJRM is important for engineering construction.The Voronoi diagram and threedimensional printing technology were used to make an irregular columnar jointed mold,and the irregular CJRM (ICJRM) specimens with different dip directions and dip angles were prepared.Uniaxial compression tests were performed,and the anisotropic strength and deformation characteristics of ICJRM were described.The failure modes and mechanisms were revealed in accordance with the final appearances of the ICJRM specimens.Based on the model test results,the empirical correlations for determining the field deformation and strength parameters of CJRM were derived using the dip angle and modified joint factor.The proposed empirical equations were used in the Baihetan Project,and the calculated mechanical parameters were compared with the field test results and those obtained from the tunneling quality index method.Results showed that the deformation parameters determined by the two proposed methods are all consistent with the field test results,and these two methods can also estimate the strength parameters effectively.
1.Introduction
After long-term geological evolution and tectonic movement,structural surfaces with different scales have evolved into rock mass,changing the continuous,uniform and isotropic mechanical properties of intact rock(Fan et al.,2017;Zhou et al.,2018;Shaunik and Singh,2019).Joints are widely developed,which transform intact rocks into more complex jointed rock masses.The columnar jointed rock mass (CJRM) has a special jointed network,and its deformation and strength characteristics are difficult to understand(Jiang et al.,2019).In Southwest China,many hydropower projects are built on the CJRM,such as the Baihetan,Xiluodu,and Tongjiezi Hydropower Stations(Feng et al.,2019;Jiang et al.,2020).The CJRM exhibits significant anisotropic mechanical properties,which cause local stress relaxation (Hao et al.,2016) and collapse during construction (Jin et al.,2015).Therefore,reasonably determining the field deformation and strength characteristics of engineering CJRM is necessary.
Field tests in the early stage of projects are difficult and costly,and the required field mechanical parameters cannot be obtained in time.By comparison,conducting laboratory tests and establishing an empirical relationship between the laboratory test results and field mechanical behaviors is a more effective method(Ghazvinian and Hadei,2012;Bahrani and Kaiser,2020;Zhang et al.,2022).In recent years,this empirical method,based on physical model tests,has been widely used.Jaeger (1960) found that the shear strength of anisotropic rock mass is related to the joint orientation,and proposed an empirical expression to describe the change in rock mass strength with the orientation angle.Subsequently,Donath(1961) and Shi et al.(2016) successively revised Jaeger(1960)’s formula using numerous test results of jointed rock masses,thereby improving the prediction effect on the field mechanical parameters.Ramamurthy and Arora (1994) proposed a joint factor to reflect the weakening effect of joint orientation,frequency,and roughness on intact rock.Jade and Sitharam(2003)used various empirical relationships between strength parameters and joint factors to fit relevant test results and determined the optimal empirical expression for the joint factor method.
For the CJRM,previous physical model tests were mainly based on the regular CJRM model(Ji et al.,2017;Zhu et al.,2020;Lu et al.,2021).Jin et al.(2018) performed uniaxial compression tests on regular quadrangular prism CJRM (4P-CJRM) specimens,and described their anisotropic characteristics and failure modes.Xiao et al.(2015) analyzed the influence of the column axis orientation on the anisotropic mechanical properties of regular hexagonal prism CJRM(6P-CJRM).Que et al.(2021)simulated the 4P-,6P-,and pentagonal prism CJRM (5P-CJRM) and studied the effect of the cross-sectional shape on their mechanical behaviors.However,as shown in Fig.1,the columnar jointed network in the actual engineering environment is irregular(Jiang et al.,2014;Xia et al.,2020).Therefore,the use of regular CJRM models in experimental research has shown certain deviations.It is essential to establish an irregular CJRM (ICJRM) model and carry out related physical model tests.Meanwhile,current research mainly focused on the effect of dip angle (in the vertical plane) on the anisotropic properties of CJRM(Fig.1b),but ignored the effect of dip direction (in the horizontal plane,Fig.1a).To comprehensively study the deformation and strength characteristics of CJRM,both the dip direction and dip angle of the columnar joints should be considered simultaneously.
Numerical calculation using the Voronoi diagram is a common method for studying ICJRM,and its effectiveness has been proved(Di et al.,2011;Meng et al.,2019).Accordingly,Lin et al.(2017)tried to apply the Voronoi diagram and three-dimensional (3D) printing technology in the model test of ICJRM and selected the photosensitive resin with good strength and ductility as the joint filler.To ensure that the jointed network model was not skewed or collapsed during printing,the thickness of the columnar joints with a height of 100 mm was at least 1 mm.These features caused the resin material to limit the deformation and increase the strength of the specimens.The jointed network was not destroyed until the specimen failed,and the resin material recovered a large amount of deformation after unloading.Nevertheless,3D printing technology provides a new idea for preparing ICJRM specimens with complex jointed network.
In this study,the Voronoi diagram and 3D printing technology were used to create an irregular columnar jointed mold.Artificial ICJRM specimens with different dip directions and dip angles were prepared,and uniaxial compression tests were carried out.Thus,the deformation and strength behaviors of artificial specimens with different dip directions and dip angles were described,and the 3D anisotropic characteristics of the ICJRM were revealed.The final appearances of ICJRM specimens recorded by the camera were used to analyze the failure modes and mechanisms.Based on Jaeger(1960)’s criterion and traditional joint factor method(Ramamurthy and Arora,1994),empirical correlations for estimating the field mechanical parameters of the CJRM were derived using the dip angle and modified joint factor,respectively.The proposed equations were used to determine the field uniaxial compression strength(UCS)and elastic modulus of Baihetan CJRM,and the calculated values were compared with the field test results and those obtained from the tunneling quality index (Q) method.Results revealed that the proposed empirical methods have good application prospects in related projects.
2.Irregular columnar jointed network model
The columnar jointed network is a special structure formed by the cooling shrinkage of lava flows (Long and Wood,1986) Under the influence of various reasons,the contraction centers on the condensation surface are unevenly distributed,and the crosssections of the formed columns are irregular (Goehring and Morris,2008).The common shapes of CJRM in the natural environment mainly include irregular quadrangular,pentagonal,and hexagonal prism (Cui et al.,2018).The regular 6P-CJRM model is widely used in existing experimental studies,but it cannot reflect the natural structural characteristics of CJRM.
The Voronoi diagram is the basic data structure for dividing planes,and it is used in many fields such as geology,computing,molecular chemistry,and so on(Bae,2016).The irregular columnar jointed network can also be established using the Voronoi diagram.The typical Voronoi diagram shown in Fig.2a is quite similar to the sketch drawing of the cross-sections of the Baihetan CJRM(Fig.2b).Di et al.(2011) and Meng et al.(2019) verified the feasibility and superiority of the Voronoi diagram to simulate ICJRM based on 3DEC numerical software.
The common method used to generate the Voronoi diagram is the Delaunay triangulation algorithm (Ni,2012),and the specific steps are as follows:(1)randomly generate discrete data points;(2)generate Delaunay triangulation of data points;(3)find the center of the circumcircle of each triangle in the triangulation network;and (4) connect the centers of the circumcircles of adjacent triangles to form a polygonal network,that is,the Voronoi diagram.The above steps can be implemented by the Voronoi function of the MTP toolbox in MATLAB software,and the average maximum diagonal length of the column cross-sections was used as the control standard for the size.
3.Model tests of ICJRM
3.1.Model size and materials
Columnar joints can be found in the dam site of the Baihetan Hydropower Station.The angle between the column axis and the vertical plane is about 15º-25º,and the strike trending is N30º-50ºE (Jiang et al.,2014).The diameters of columns are mainly 13-25 cm (Jiang et al.,2014).To simulate the Baihetan CJRM,the physical model test follows the similarity principle,and the relations between the similarity constants are as follows (Sebastian and Sitharam,2014):
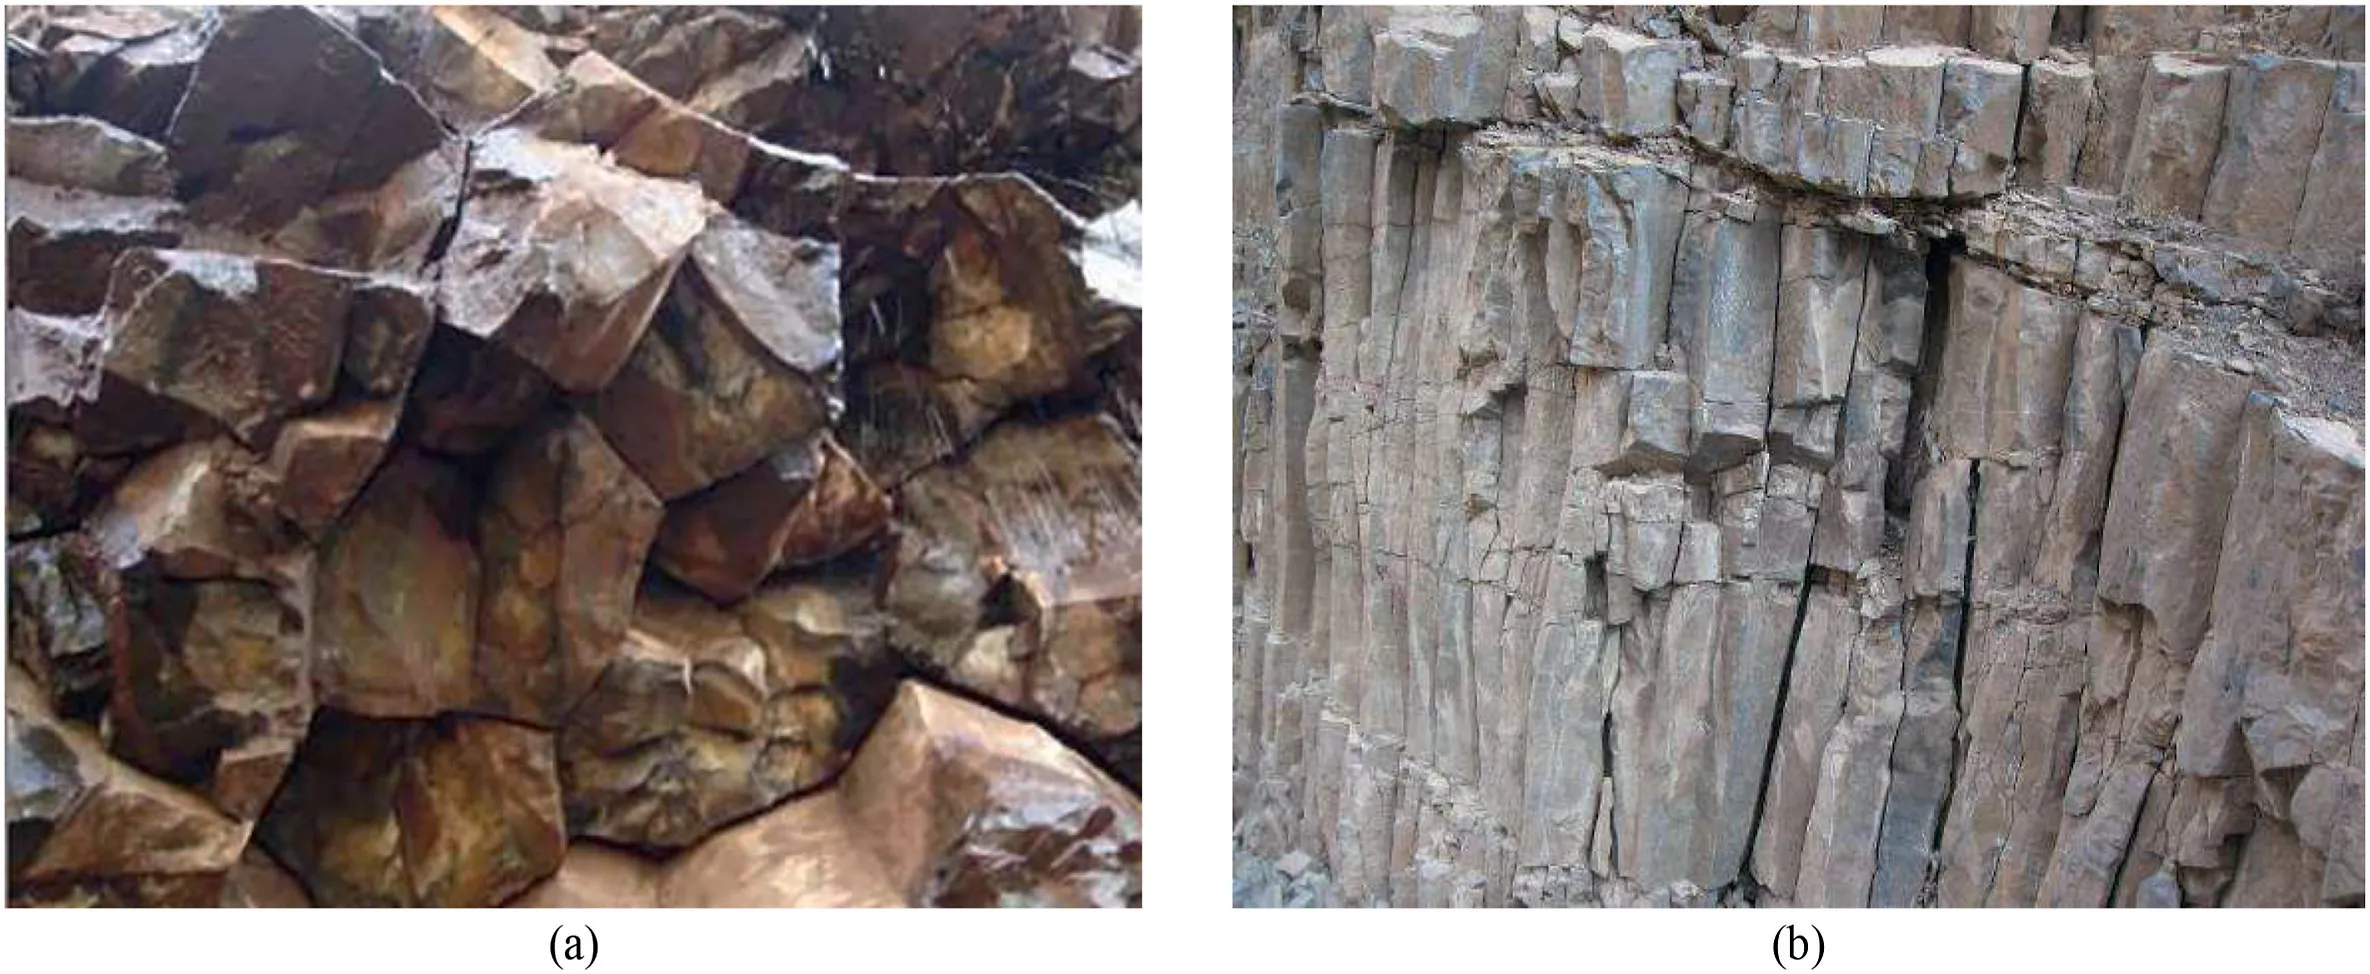
Fig.1.Baihetan CJRM in different planes: (a) Distribution in the horizontal plane;and (b) Distribution in the vertical plane.
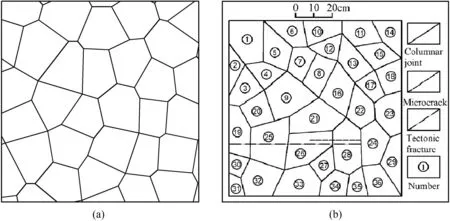
Fig.2.Irregular columnar jointed network: (a) Typical Voronoi diagram;and (b) Sketch drawing of the cross-section of Baihetan CJRM (Ni,2012).

whereCσ,CL,Cγ,Cε,Cf,Cφ,Cμ,CE,andCcare the similarity constants of stress,geometry,bulk density,strain,friction coefficient,internal friction angle,Poisson’s ratio,elstic modulus,and cohesion,respectively.Combined with the structural characteristics of the Baihetan CJRM,the similarity constants of geometry,bulk density,stress,elastic modulus,and dimensionless parameters were preliminarily determined as 6,2.5,15,15,and 1,respectively.Considering the size effect,the number of columns in a composite rock mass should be greater than 8 (Que et al.,2020;Lu et al.,2021).Therefore,the average maximum diagonal length of the column cross-sections was determined to be 3 cm,and the artificial ICJRM specimen was a standard cube with a side length of 10 cm.The joint distributions of ICJRM specimens with different dip directions and dip angles are shown in Fig.3.
A mixed material with a mass ratio of gypsum:fine sand:water of 3: 1: 2.4 was selected as the column material(Que et al.,2021).The gypsum is used for building,and the particle size of the fine sand is less than 0.5 mm.The basic parameters of the Baihetan basalt and column material are presented in Table 1.

Table 1 Physical and mechanical properties of Baihetant basalt(Jin et al.,2018)and column material.
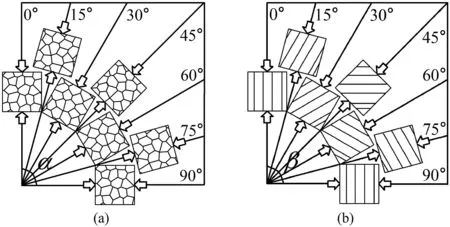
Fig.3.Joint distributions of ICJRM specimens: (a) ICJRM specimens with different dip directions α;and (b) ICJRM specimens with different dip angles β.
The joint filler materials in previous researches include white emulsion,photosensitive resin for 3D printing,and cement slurry(Xiao et al.,2015;Lin et al.,2017;Huang et al.,2020).After trying to use the white emulsion,it was found that the joint surfaces exhibit high bonding strength and toughness,which are unfavorable for the initiation and propagation of cracks on the joint surface.The photosensitive resin material used in 3D printing demonstrated high strength and ductility,thus the specimen did not exhibit brittleness during compression.By comparison,the cement slurry with a water-to-cement ratio of 0.4 was selected as the joint filler material(Zhu et al.,2020;Lu et al.,2021;Que et al.,2021).The UCS σj,cohesioncj,and friction angle φjof the cement slurry are 22.18 MPa,32º,and 1.23 MPa,respectively.
3.2.ICJRM specimen preparation
The Voronoi function in MATLAB was adopted to generate a two-dimensional (2D) Voronoi diagram,which was used to simulate an irregular columnar jointed network (Fig.4a).The average maximum diagonal length of the polygons was set to 3 cm.Subsequently,the planar graphic was imported into the AutoCAD software with the same scale and elongated in the vertical direction to obtain a 3D irregular columnar jointed model (Fig.4b).The thickness of the joints was set to 1 mm.A cube with a side length of 12 mm was used to cut the established 3D model,and the digital ICJRM molds with different dip directions α and dip angles β were obtained(Fig.4c).Before cutting,the cube was rotated at a certain angle on the horizontal or vertical plane.Because the size ratio was considered when drawing the digital model,the AutoCAD software could directly output the.STL file for subsequent 3D printing.The photosensitive resin called VeroWhite FullCure830 was chosen for 3D printing,which has a smooth surface and high strength.
The printed ICJRM mold is shown in Fig.4d,which needs to be used with an acrylic mold having an internal size of 12 cm ×12 cm×12 cm.The lubricating oil was applied on the inner surfaces of the printed ICJRM mold and acrylic plates,and then the mixed column material was poured into the holes.The rubber bands were wrapped around the acrylic mold,and the air bubbles were removed using a thin wire.After waiting 20 min,the columns were dropped from the holes one by one.The joint filler material was used to bond the columns together.During this process,the two columns were pressed and slid to make them closely contact,so as to obtain a thin and uniform joint surface.Then,the formed blocks were placed in a standard curing box for 21 d(Fig.4e).To obtain the cubic specimens required for the experiment(Fig.4f),the surfaces of the blocks were polished with a double-sided grinding machine.
3.3.Testing program
As shown in Fig.5,the prepared specimen was placed on the loading platform of the RMT-150B servo-controlled rock testing system,and the loading rate was controlled at 0.2 mm/min.Before testing,lubricant was applied evenly on the upper and lower sides of the ICJRM specimens to reduce the effects of end restraint.During the uniaxial compression process,the monitoring data were automatically sent to the connected computer.After the test,the final appearances of the ICJRM specimens were recorded by the Canon 700-D camera.
4.Results of physical model test
4.1.Deformation and strength behaviors
The collected data are summarized and the stress-strain curves of the ICJRM specimens are shown in Fig.6.The UCS σcjis the maximum axial stress in the curve.The elastic modulus can be calculated by the following equation (Xiao et al.,2015):
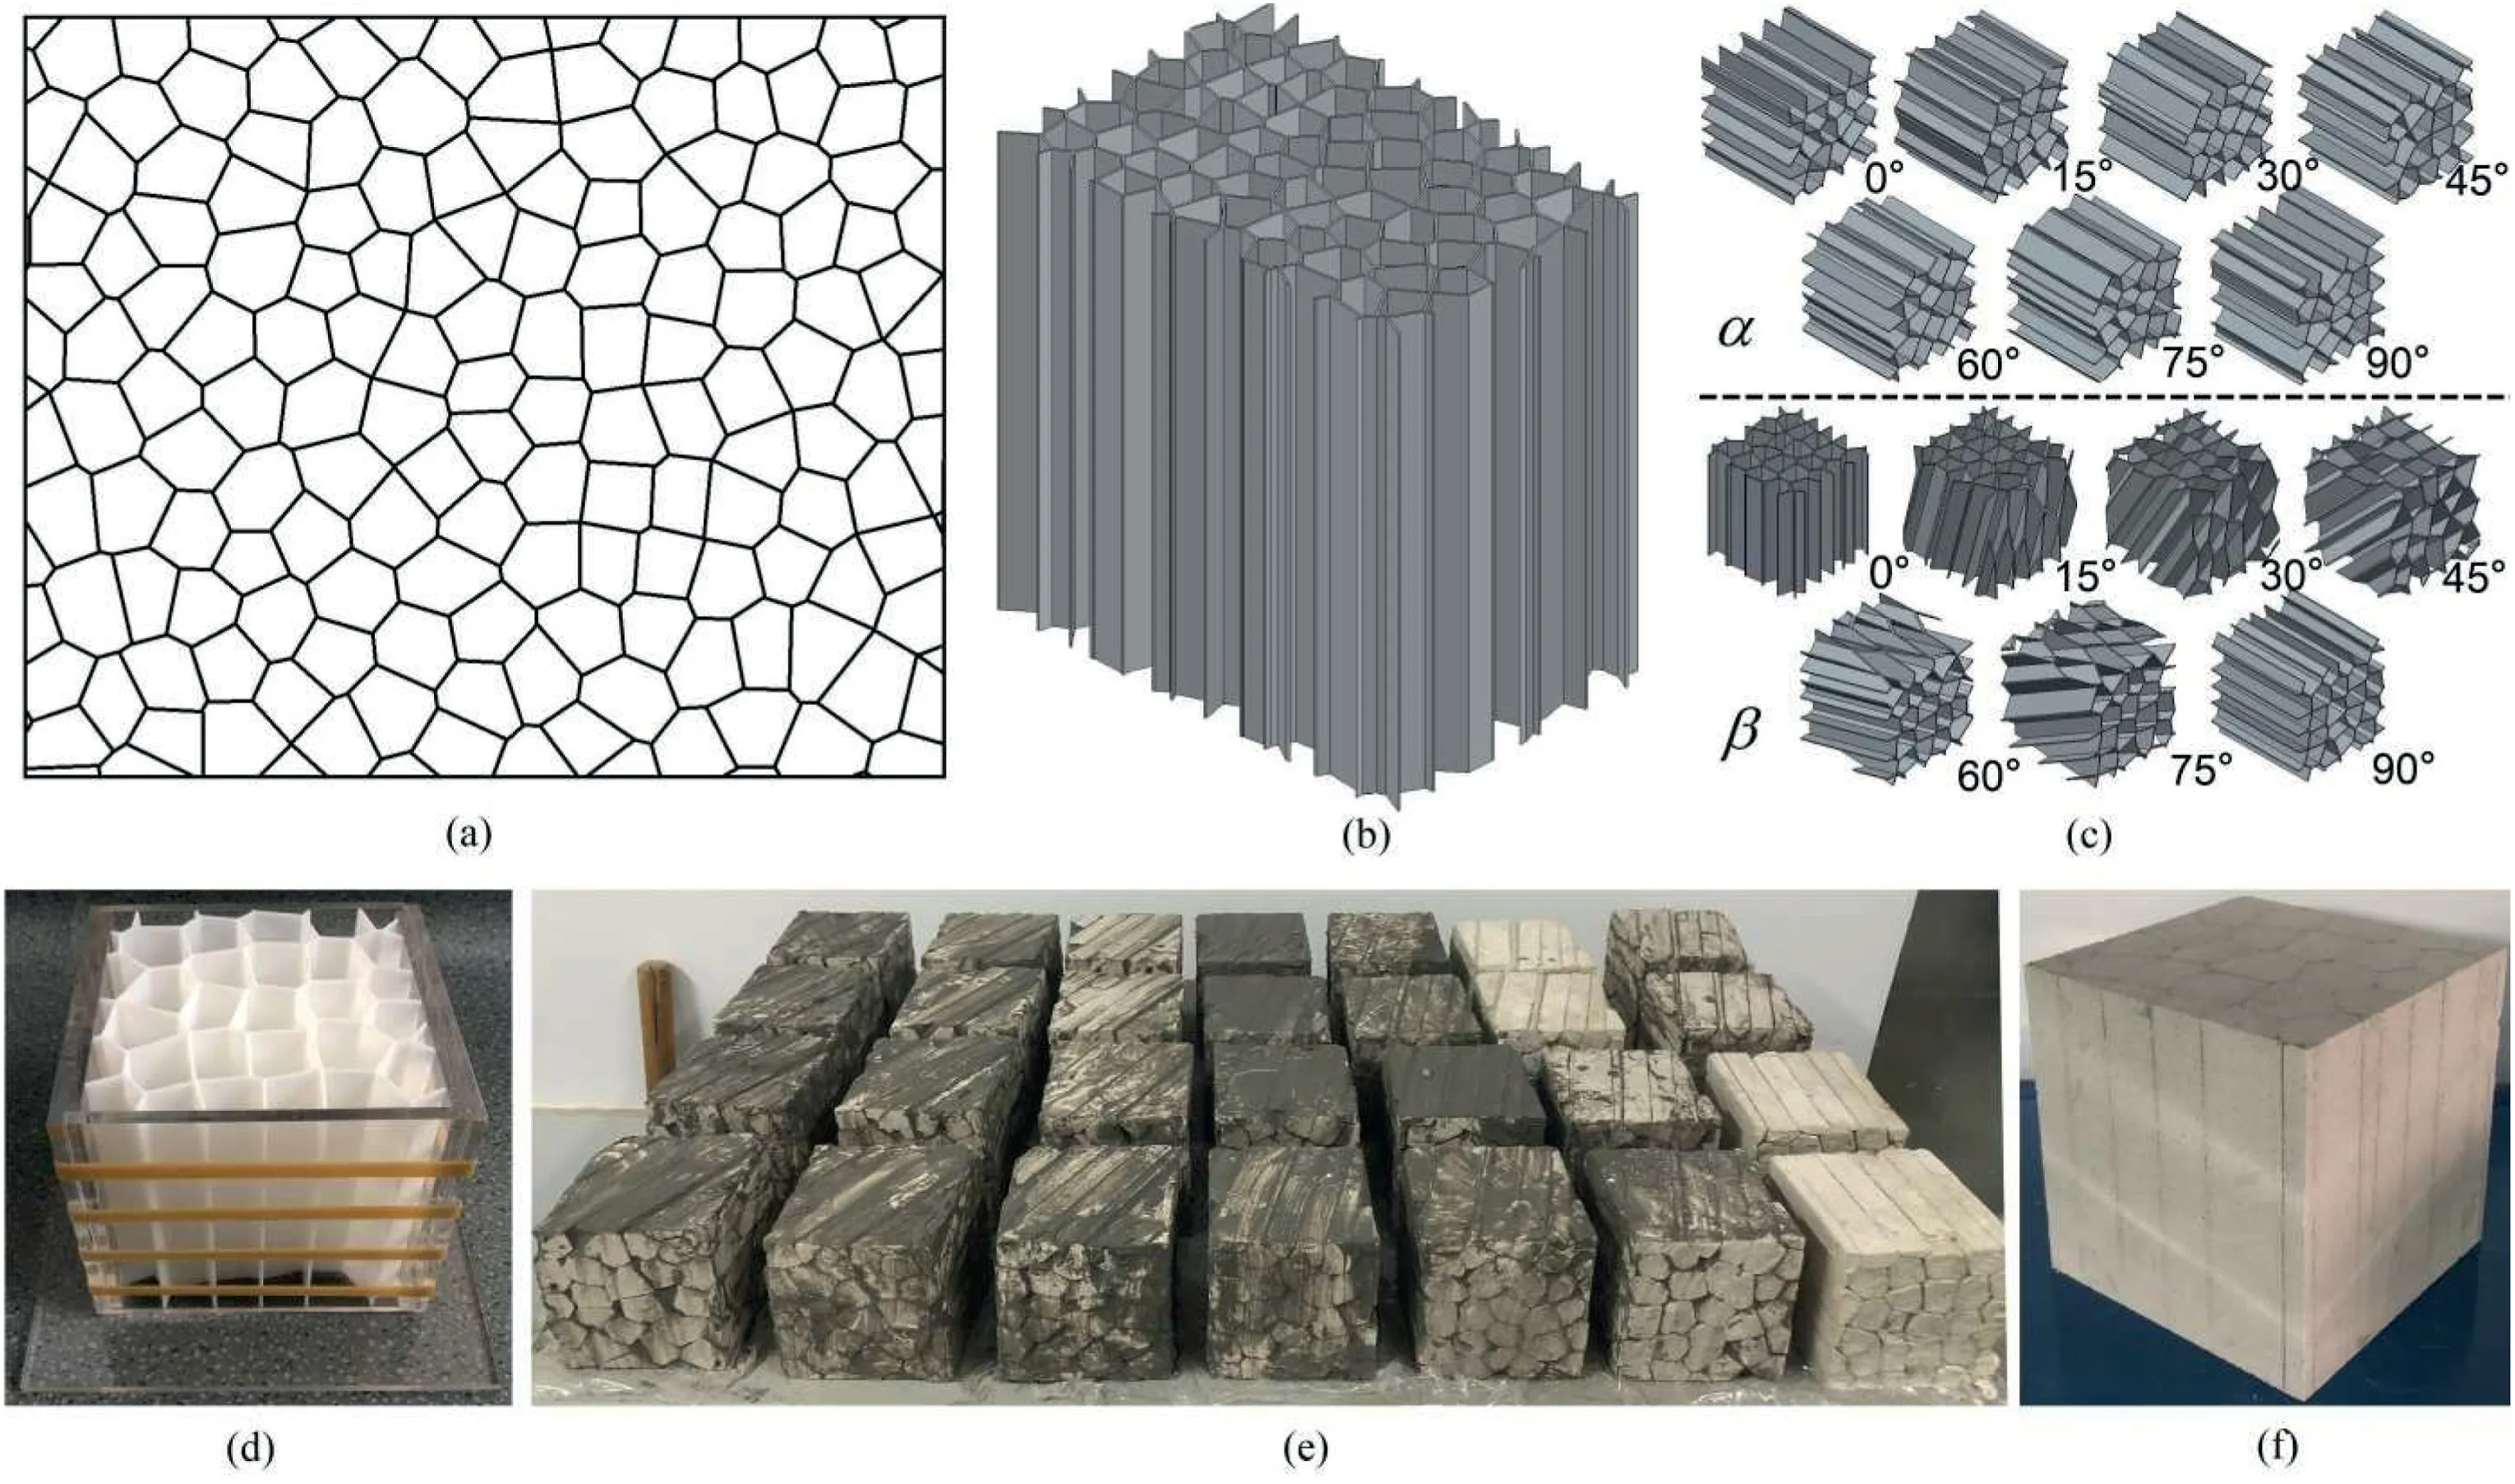
Fig.4.Preparation process of the artificial ICJRM specimens: (a) 2D irregular columnar jointed network;(b) 3D irregular columnar jointed model;(c) Digital ICJRM molds with different dip directions α and dip angles β;(d) Printed ICJRM mold and acrylic mold;(e) Blocks waiting to be ground;and (f) Artificial ICJRM specimen.
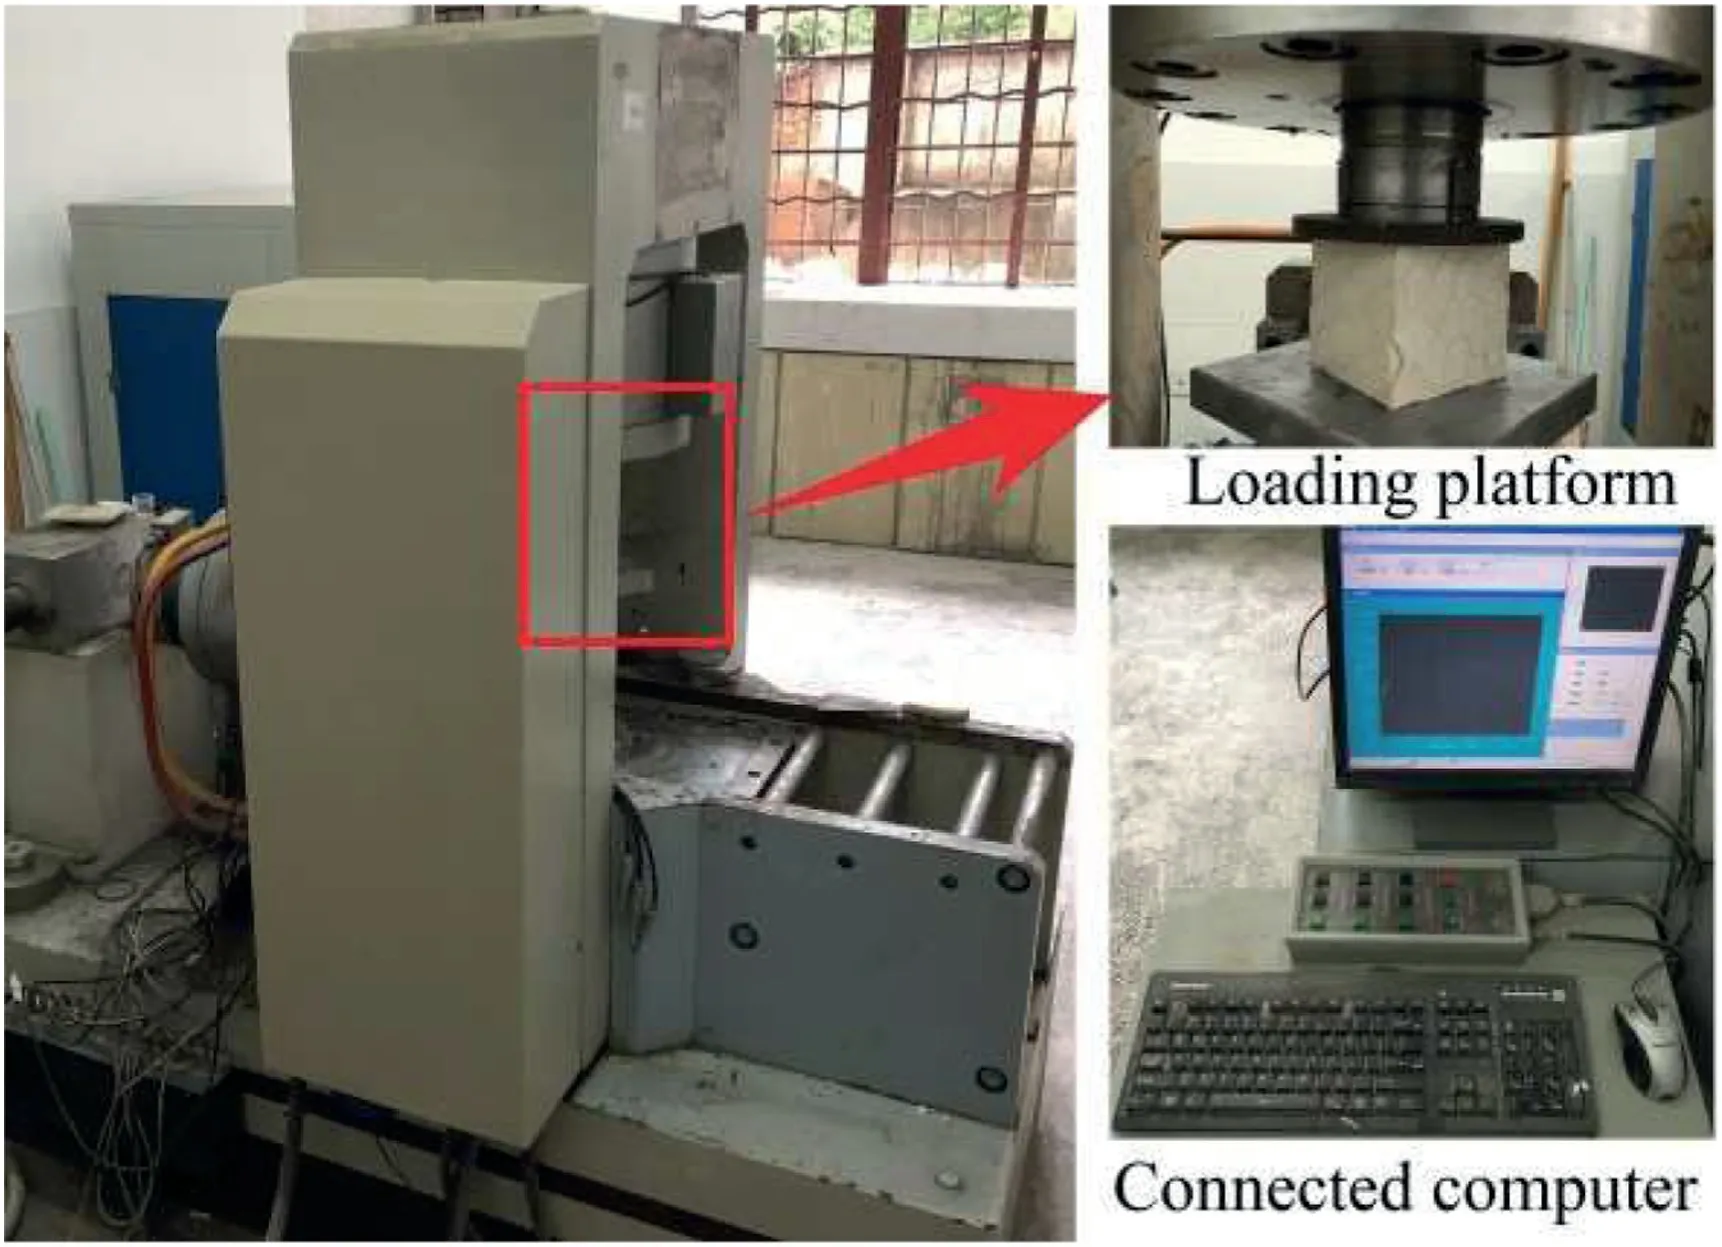
Fig.5.RMT-150B servo-controlled rock testing system.

where σcj(0.2)and σcj(0.8)are 0.2 and 0.8 times the UCS σcj,respectively;and εcj(0.2)and εcj(0.8)are the corresponding axial strains.The calculated elastic modulusEcjand UCS σcjof the artificial ICJRM specimens are listed in Table 2.
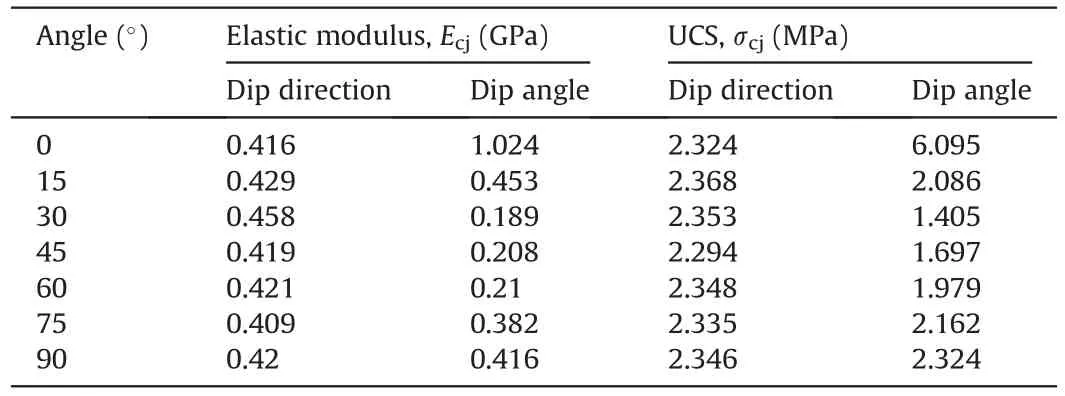
Table 2 Test results of artificial ICJRM.
In order to clearly reflect the deformation and strength characteristics of ICJRM,the variations in elastic modulus and UCS with dip direction and dip angle are plotted in Fig.7.
The two solid curves in Fig.7a show the deformation behaviors of the ICJRM specimens.The elastic modulus values of the ICJRM specimens corresponding to different dip directions are almost equal.The black curve is approximately a straight line,which is the same as the 6P-CJRM with different dip directions(Zhu et al.,2020).The average elastic modulus of the ICJRM specimens is 0.425 GPa,which is greater than the average value of 0.245 GPa for 6P-CJRM.The reason is that the irregular columnar jointed network is more complicated,whereas the combination of regular hexagonal joints is relatively simple.This result indicates that the irregularity of the jointed network enhances the deformation resistance of the specimen.The red curve shows a“U-shaped”trend.The elastic moduli of the ICJRM specimens obtain the maximum value at β=0º,because the column axis is in the vertical direction at this time.Unlike the regular 4P-,5P-,and 6P-CJRM,the elastic moduli of ICJRM reach the minimum value at β=30º,while the elastic moduli of the three regular CJRM get the minimum value at β=45º(Que et al.,2021).When β=90º,the elastic modulus of the ICJRM is 0.406 times the maximum value.This finding is mainly because the total deformation includes not only the uniaxial compression deformation of the column material but also a small part of shear deformation along the joint surface.
Fig.7b shows the strength behaviors of the ICJRM specimens.The almost horizontal straight black line represents the variations in the UCS with the dip direction α,and the average value is 2.338 MPa.The UCS of 6P-CJRM also changes slightly with the dip direction,and its average value is 1.968 MPa,which is lower than that of the ICJRM specimens (Zhu et al.,2020).These values demonstrate that the irregularity of the column cross-sections also improves the load resistance of the CJRM.The red curve shows that the UCS of the ICJRM first decreases and then increases with the dip angle.When β=0º,the UCS obtains the maximum value.When β=30º,the variation curve of ICJRM yields the minimum value,which is the same as that of regular 4P-,5P-,and 6P-CJRM (Que et al.,2021).Moreover,30ºis the most unfavorable dip angle of the ICJRM specimens under vertical load.The UCS of ICJRM at β=90ºis 0.381 times the maximum value.The reason is that the load is not perpendicular to all joint surfaces at this time,and a small part of the load causes a slight sliding along the joint surface between the columns.
The blue dotted lines in Fig.7a and b represent the elastic modulus and UCS of the intact column material,respectively.Although the strength of cement filler is higher than that of the column material,the elastic modulus and UCS of the ICJRM specimens with different dip directions and dip angles do not exceed the blue line.In particular,the test results of β=0ºcan better reflect the weakening effect of the joints on the intact column material.The cement filler mainly plays the role of bonding,and the influence of its high strength on the test results can be ignored.
4.2.Anisotropic characteristics and degrees
The test results in Fig.7 are converted from the Cartesian coordinate system to the 2D and 3D polar coordinate system to visually describe the anisotropic characteristics of the ICJRM(Fig.8).
As observed from Fig.8,the deformation and strength anisotropic characteristics of the ICJRM are significant.For the horizontal plane(variations with the dip direction α),the curves of the elastic modulus and UCS are all approximately circular,indicating almost no change in the values of the deformation and strength parameters.For the vertical plane (variations with the dip angle β),the curves are all axisymmetric,reflecting that the elastic modulus and UCS vary greatly with the dip angle.Thus,the deformation and strength characteristics of the ICJRM are isotropic in the horizontal plane and show significant anisotropy in the vertical plane.By combining the 3D graphs in Fig.8,the ICJRM exhibits quasitransverse isotropy,which is the same as the findings of field investigation(Feng et al.,2016).Zhu et al.(2020)proposed that the 4P-,5P-,and 6P-CJRM models are orthotropic,orthotropic,and quasi-transverse isotropic,respectively.It can be seen that the 3D anisotropic characteristic of the ICJRM is closer to that of the regular 6P-CJRM model.
To evaluate the anisotropic degrees of the ICJRM,the anisotropic ratioRcis used (Singh et al.,1989):

where σcjmaxand σcjminare the maximum and minimum UCS values in the curves of Fig.7b,respectively.The closer theRcvalue to 1,the lower the anisotropic degree of the CJRM.
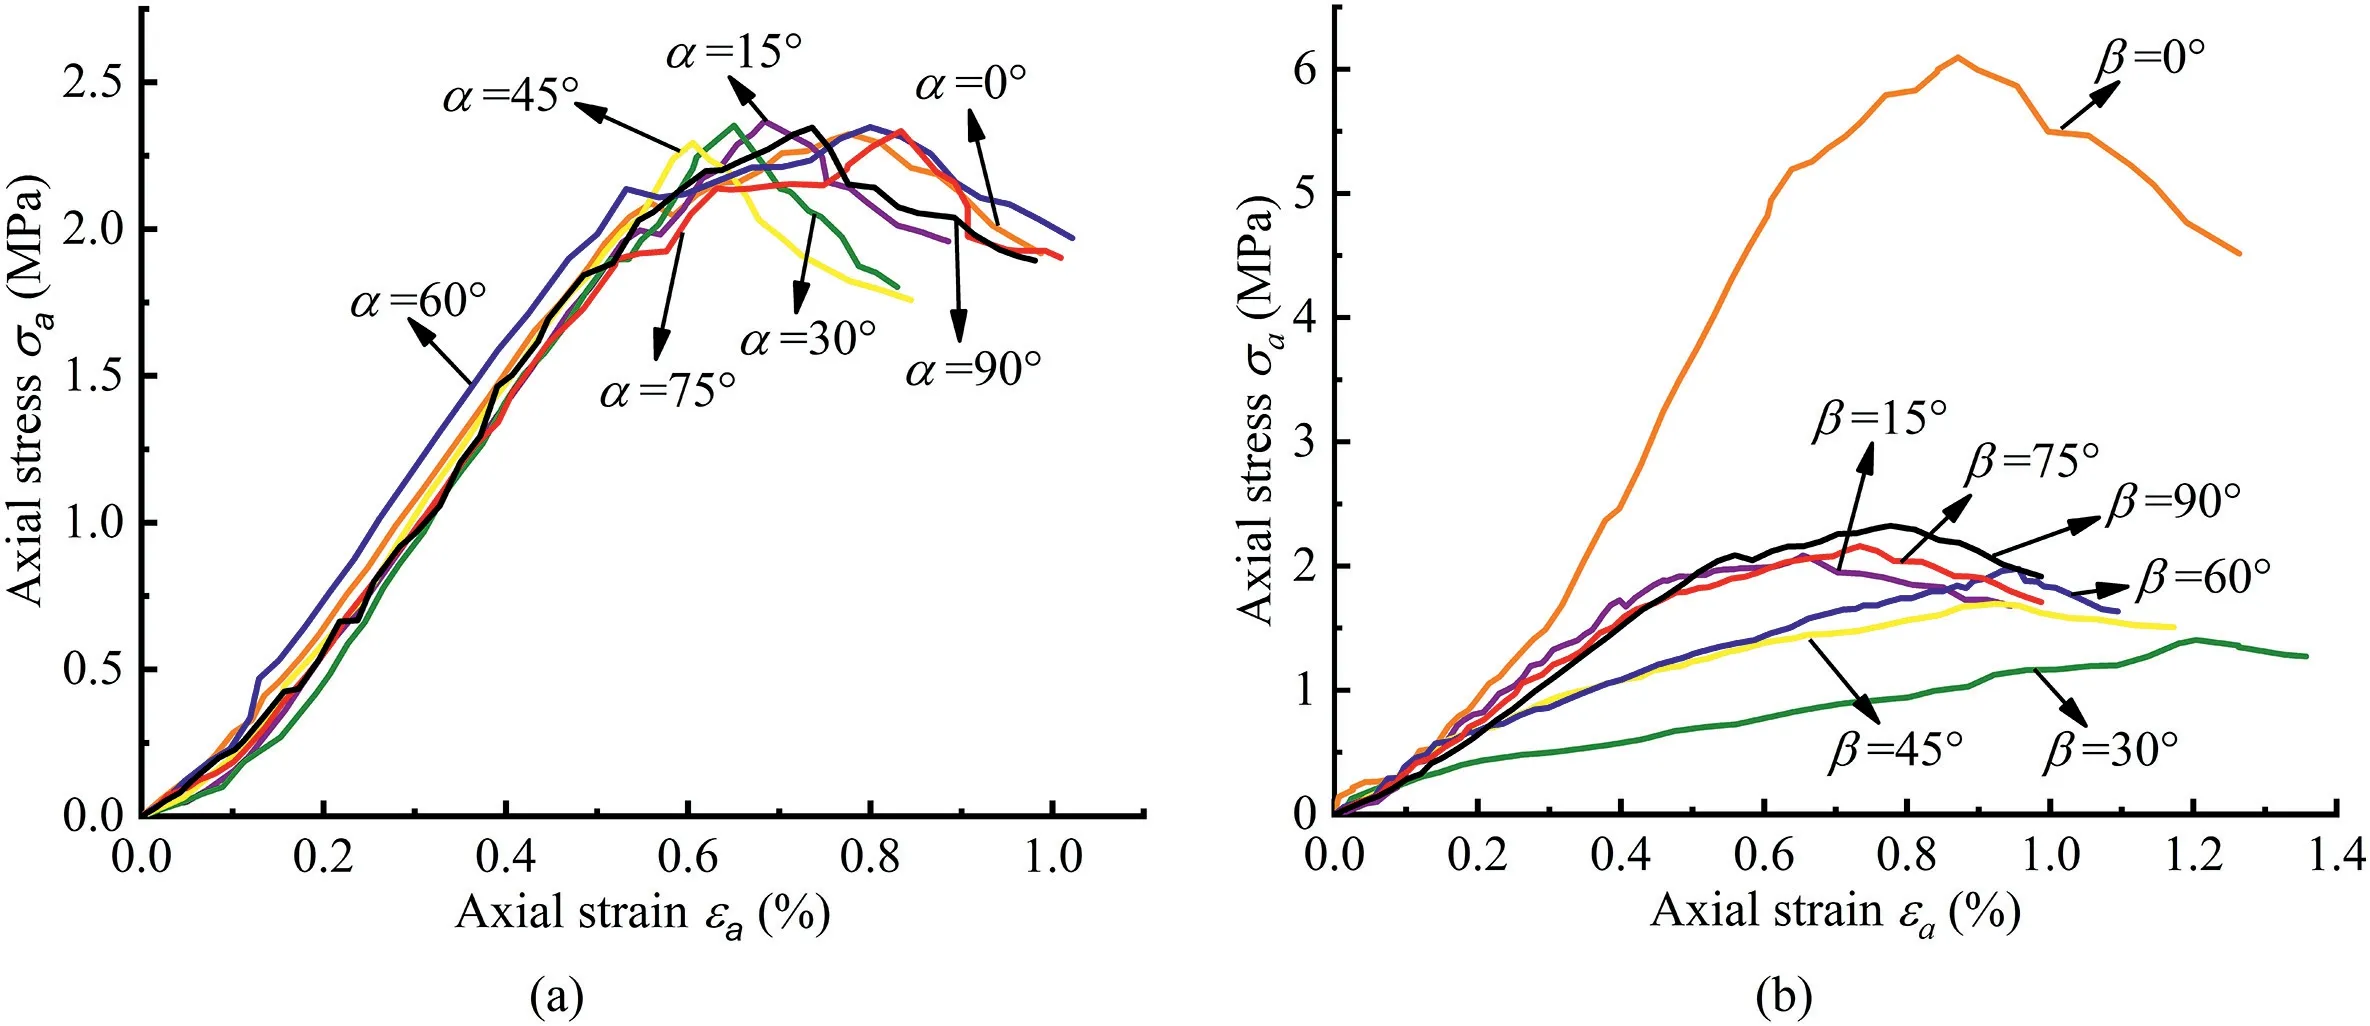
Fig.6.Stress-strain curves of artificial ICJRM: (a) ICJRM specimens with different dip directions;and (b) ICJRM specimens with different dip angles.
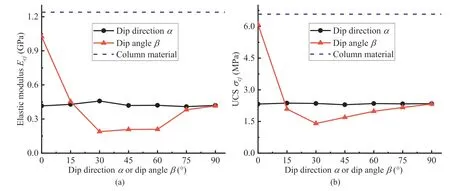
Fig.7.Variations in elastic modulus and UCS with dip direction α and dip angle β: (a) Elastic modulus anisotropy curves;and (b) UCS anisotropy curves.
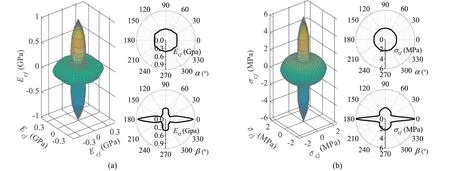
Fig.8.(a) Elastic modulus and (b) UCS of ICJRM specimens in the polar coordinate system.
The anisotropic ratiosRcof ICJRM can be calculated using the test results in Table 2,and the results are presented in Table 3.In addition,according to the test results provided by Zhu et al.(2020)and Que et al.(2021),the calculatedRcvalues of the three regular CJRM are also listed in the table.Based on the anisotropy classification method proposed by Ramamurthy (1993),the anisotropic degrees of the four CJRM are graded.

Table 3 Anisotropic ratios and degrees of the four CJRM models.
The anisotropic ratio of the ICJRM in the horizontal plane is 1.03,and the anisotropic degree is ranked into isotropy.This result reveals the same transverse isotropy as the engineering CJRM.The calculated anisotropic ratio of the 6P-CJRM in the horizontal plane is 1.11,and the anisotropy is at a low degree,which is the closest to the ICJRM.For the vertical plane,the anisotropic ratio of the ICJRM is 4.34,indicating high anisotropy.The three other regular CJRM models exhibit very high degree of anisotropy.Thus,the irregularity of the cross-sectional shape has a certain influence on the anisotropic degree of CJRM.
4.3.Failure modes and mechanisms
To study the failure mechanisms of ICJRM,the recorded failure appearances of specimens are presented in Fig.9,and three main failure modes are summarized.The diagrammatic sketches corresponding to different failure modes are presented in Fig.10 to analyze the failure mechanisms.As shown in Fig.10,Plane A is used to analyze the effect of dip angle on the ICJRM specimens,and Plane B is used to observe the failure of the irregular jointed network.According to Figs.9 and 10,the failure modes and mechanisms are described as follows:
(1) Mode I: Tensile failure through columns (Fig.10a).This failure mode occurs when α=0º-90ºor β=75ºand 90º.One or two vertical cracks through the columns are observed on Plane A,which initiate at the column material and propagate to the top and bottom ends in an almost vertical direction.On Plane B,several openings are observed between the columns,and some cracks appear on the column material.The failure surfaces on Planes A and B are mainly caused by the tensile stress.The dip angle β is always 90ºwhen considering the dip direction,therefore,the damages of the specimens with different dip directions are tensile failure.
(2) Mode II: Shear failure along joints (Fig.10b).This failure mode occurs when β=45ºand 60º.The failure surfaces on Plane A are along the joint direction,and the columns are relatively complete.On Plane B,the columns slide forward along the joints,and there are almost no cracks on the columns.The cracks on Planes A and B are all initiate at the joints and propagate along the joint plane.When the vertical load increases to a certain extent,the shear strength of the joints cannot resist the shear stress,resulting in the final failure of the specimens.The damages of the specimens are shear failure,and the strength of the specimen is controlled by the joint surface.
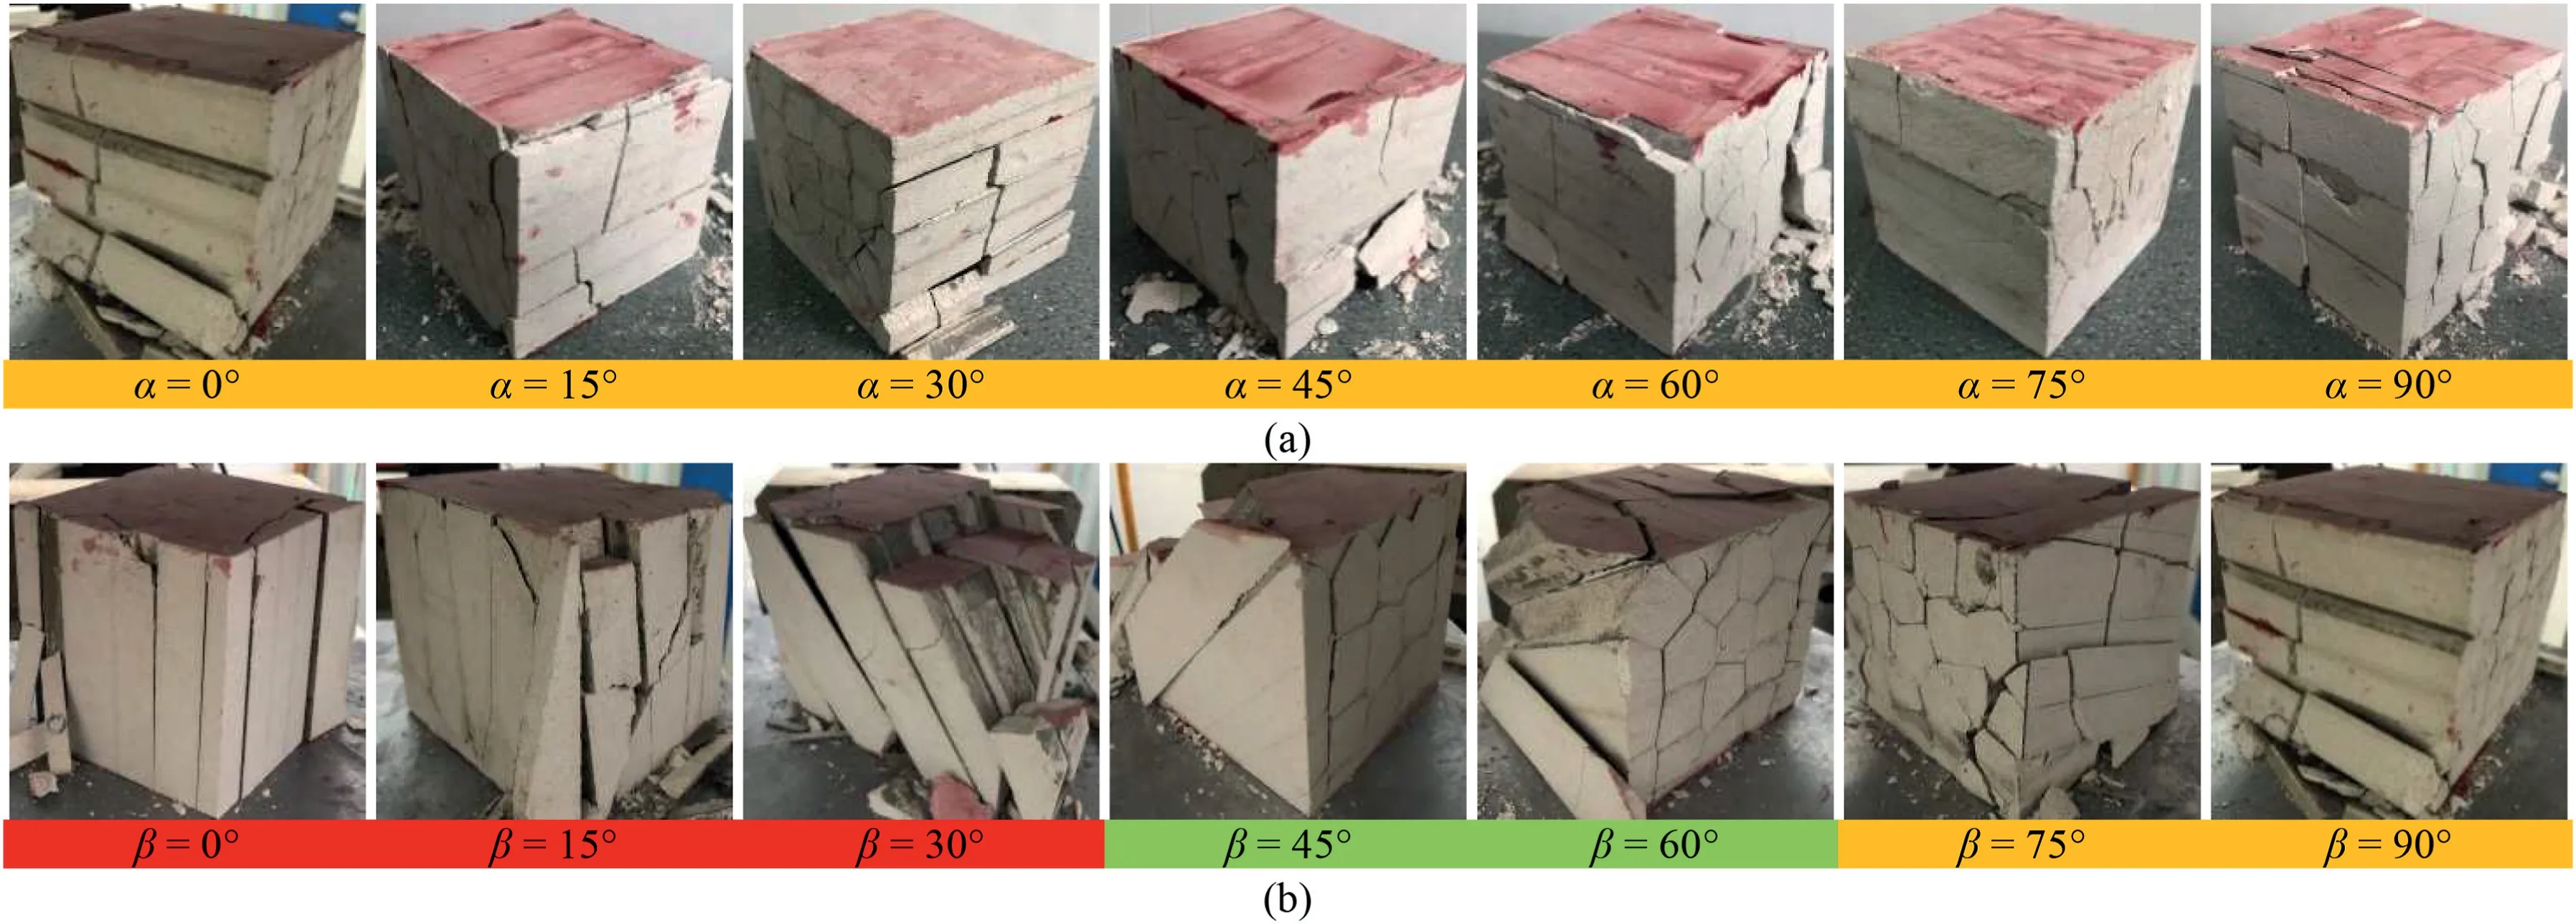
Fig.9.Final failure appearances of ICJRM specimens: (a) ICJRM specimens with different dip directions;and (b) ICJRM specimens with different dip angles.
(3) Mode III:Mixed failure along the column axis(Fig.10c).This failure mode occurs when β=0º,15º,and 30º.The failure appearances of Planes A and B are the same,and the columns are separated and fractured.The cracks initiate at the joints and propagate to the top and bottom ends,causing the columns to separate from each other.As the vertical load increases,approximately horizontal cracks are generated on the columns.This is because the column axis is almost along the load direction,and it is easy to split under no lateral confinement.The separated columns are subjected to the load independently,which eventually leads to the horizontal cracks on the column material.The final failure is caused by the tensile stress and bending moment.
As shown in Fig.9,the exposed joint surfaces are thin and uniform,thus the effect of the cement filler on the damage of the ICJRM specimens is negligible.In addition,it can be seen from the above analysis that the failure mode of ICJRM is mainly affected by the dip angle.When β=30º,the damage of ICJRM is mixed failure along the column axis,whereas the damages of the 4P-,5P-,and 6PCJRM all belong to shear failure along the joints (Que et al.,2021).These findings are reflected in the existence of several horizontal cracks on the ICJRM specimen,and the 4P-,5P-and 6P-CJRM specimens are relatively complete after failure.This difference is also reflected in the deformation and strength behaviors of the CJRM with different cross-sectional shapes.The most unfavorable dip angle of the ICJRM to resist deformation and load are all 30º,and the most unfavorable dip angle of the three regular CJRM to resist deformation and load are 45ºand 30º,respectively.Therefore,the focus should be on the engineering CJRM with a dip angle of 30º-45º.
5.Prediction of deformation and strength
The transverse isotropy of the ICJRM indicates that its deformation and strength characteristics are mainly affected by the dip angle,and the influence of the dip direction of the column axis is negligible.The prediction of the field mechanical parameters is only based on the test results of the artificial ICJRM with different dip angles.The dip angle and modified joint factor are used to predict the field mechanical parameters of the CJRM,and two empirical methods are proposed.
5.1.Prediction using dip angle β only
It is widely known that the mechanical behaviors of the anisotropic rock mass are closely related to the joint orientation(Mclamore and Gray,1967;Hong et al.,2017;Yuan et al.,2021).The reasonable empirical expressions between the joint orientation and the deformation and strength parameters are conducive to rapidly obtain the required information.The most widely used relation was proposed by Jaeger (1960) and revised by Donath (1961):

where σcjθis the UCS when the joint orientation is θ,AandBare the constant terms in the empirical equation,and θminis the joint angle corresponding to the minimum UCS.To facilitate engineering applications,the normalized elastic modulusEcrand UCS σcrare used to rewrite Eq.(4) as follows:

whereEcrθ and σcrθare the normalized elastic modulus and UCS,respectively,when the joint angle is θ;Ad1,Bd1,Ad2,andBd2are the constant terms in the deformation empirical equation;andAs1,Bs1,As2,andBs2are the constant terms in the strength empirical equation.The expressions of the normalized elastic modulusEcrand UCS σcrare

whereEciand σciare the elastic modulus and UCS of the intact column material,respectively.
Shi et al.(2016) proposed the following expressions to accurately describe the mechanical behaviors of jointed rock masses according to Eq.(4):
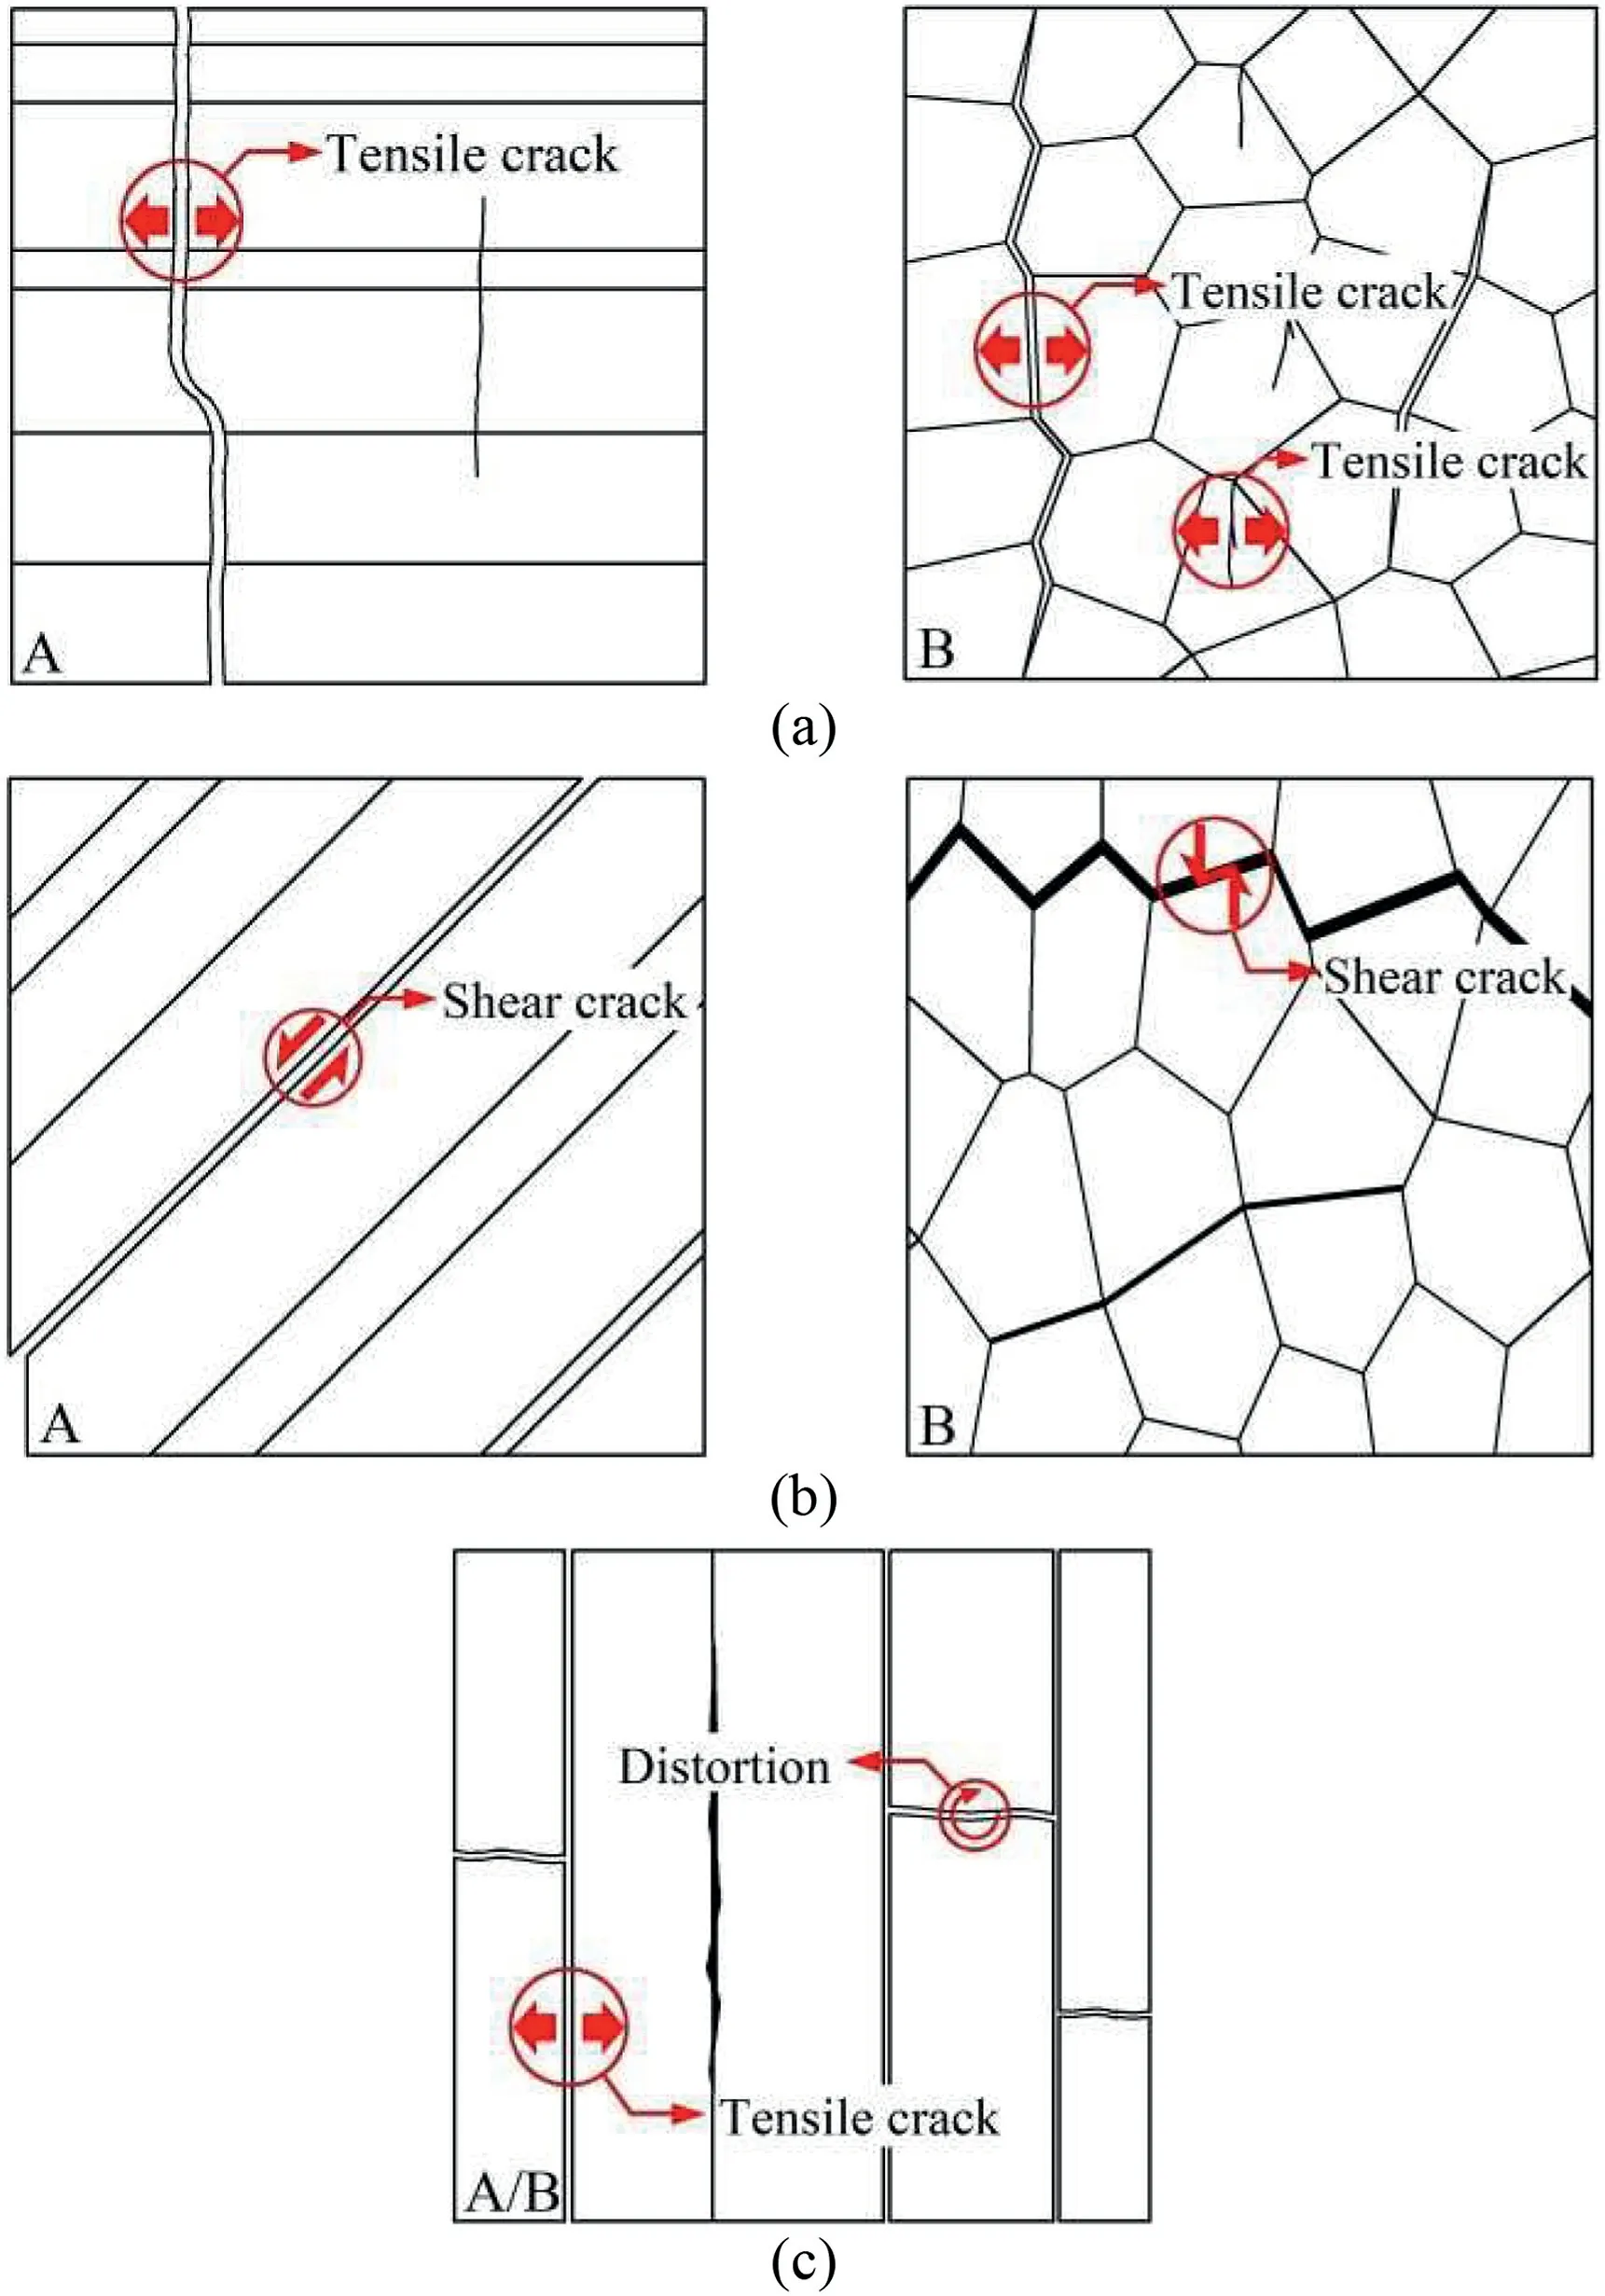
Fig.10.Failure mechanisms of ICJRM specimens corresponding to different failure modes: (a) Mode I;(b) Mode II;and (c) Mode III.
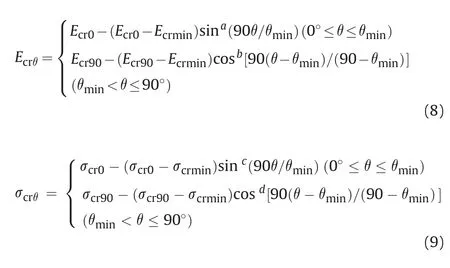
whereEcr0and σcr0are the normalized elastic modulus and UCS,respectively,when the joint angle is 0º;Ecr90and σcr90are the normalized elastic modulus and UCS,respectively,when the joint angle is 90º;Ecrminand σcrminare the minimum values of the normalized elastic modulus and UCS,respectively;anda,b,c,anddare the constants.
The two empirical methods are widely used in various types of jointed rock masses.However,previous studies have shown that the fitting accuracy of Eqs.(5) and (6) is relative low (Zhu et al.,2020).Considering that the expressions of trigonometric functions are inconsistent,the application and generalization of Eqs.(8)and(9)are difficult.Therefore,the following relations are proposed by combining the forms of the two empirical expressions above:
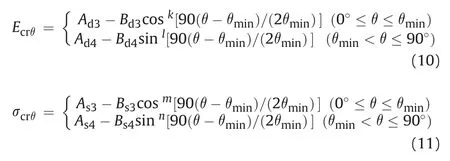
whereAd3,Bd3,Ad4,Bd4,k,andlare the constant terms in the deformation empirical equation;andAs3,Bs3,As4,Bs4,m,andnare the constant terms in the strength empirical equation.
The above three empirical methods are used to fit the results in Tables 1 and 2,and the specific equations and fitting curves are shown in Table 4 and Fig.11,respectively.In addition,two error measures are adopted to assess the validity of predictions.The first is the regressionR-square value (R2):

whereNis the number of test data,Ecr,testand σcr,testare the test results,Ecr,predand σcr,predare the predicted results,andEcr,avand σcr,avare the average values of the test results.
The second error measure is the average absolute relative error percentage (AAREP):

A largeR2value indicates a better quality of the prediction.A smaller AAREP value represents a reliable prediction.The calculated values ofR2and AAREP corresponding to each empirical equation are presented in Table 4.
It can be seen from Table 4 and Fig.11 that the proposed empirical relations are superior to the two other methods in predicting the deformation and strength parameters of the ICJRM.For the normalized elastic modulus,the prediction effects of Eqs.(5)and (8) are similar.TheR2value of the proposed empirical relationship(Eq.(10))is 0.996,and the AAPEP is 4.27%,showing better prediction quality than the other two equations.For the normalized UCS,the prediction validity of Eq.(6) is the worst,and the prediction effect of Eq.(11)is better than that of Eq.(9).In addition to the advantages in prediction effects,the expressions of trigonometric functions in the proposed relations are consistent,which is conducive to application and generalization in related projects.
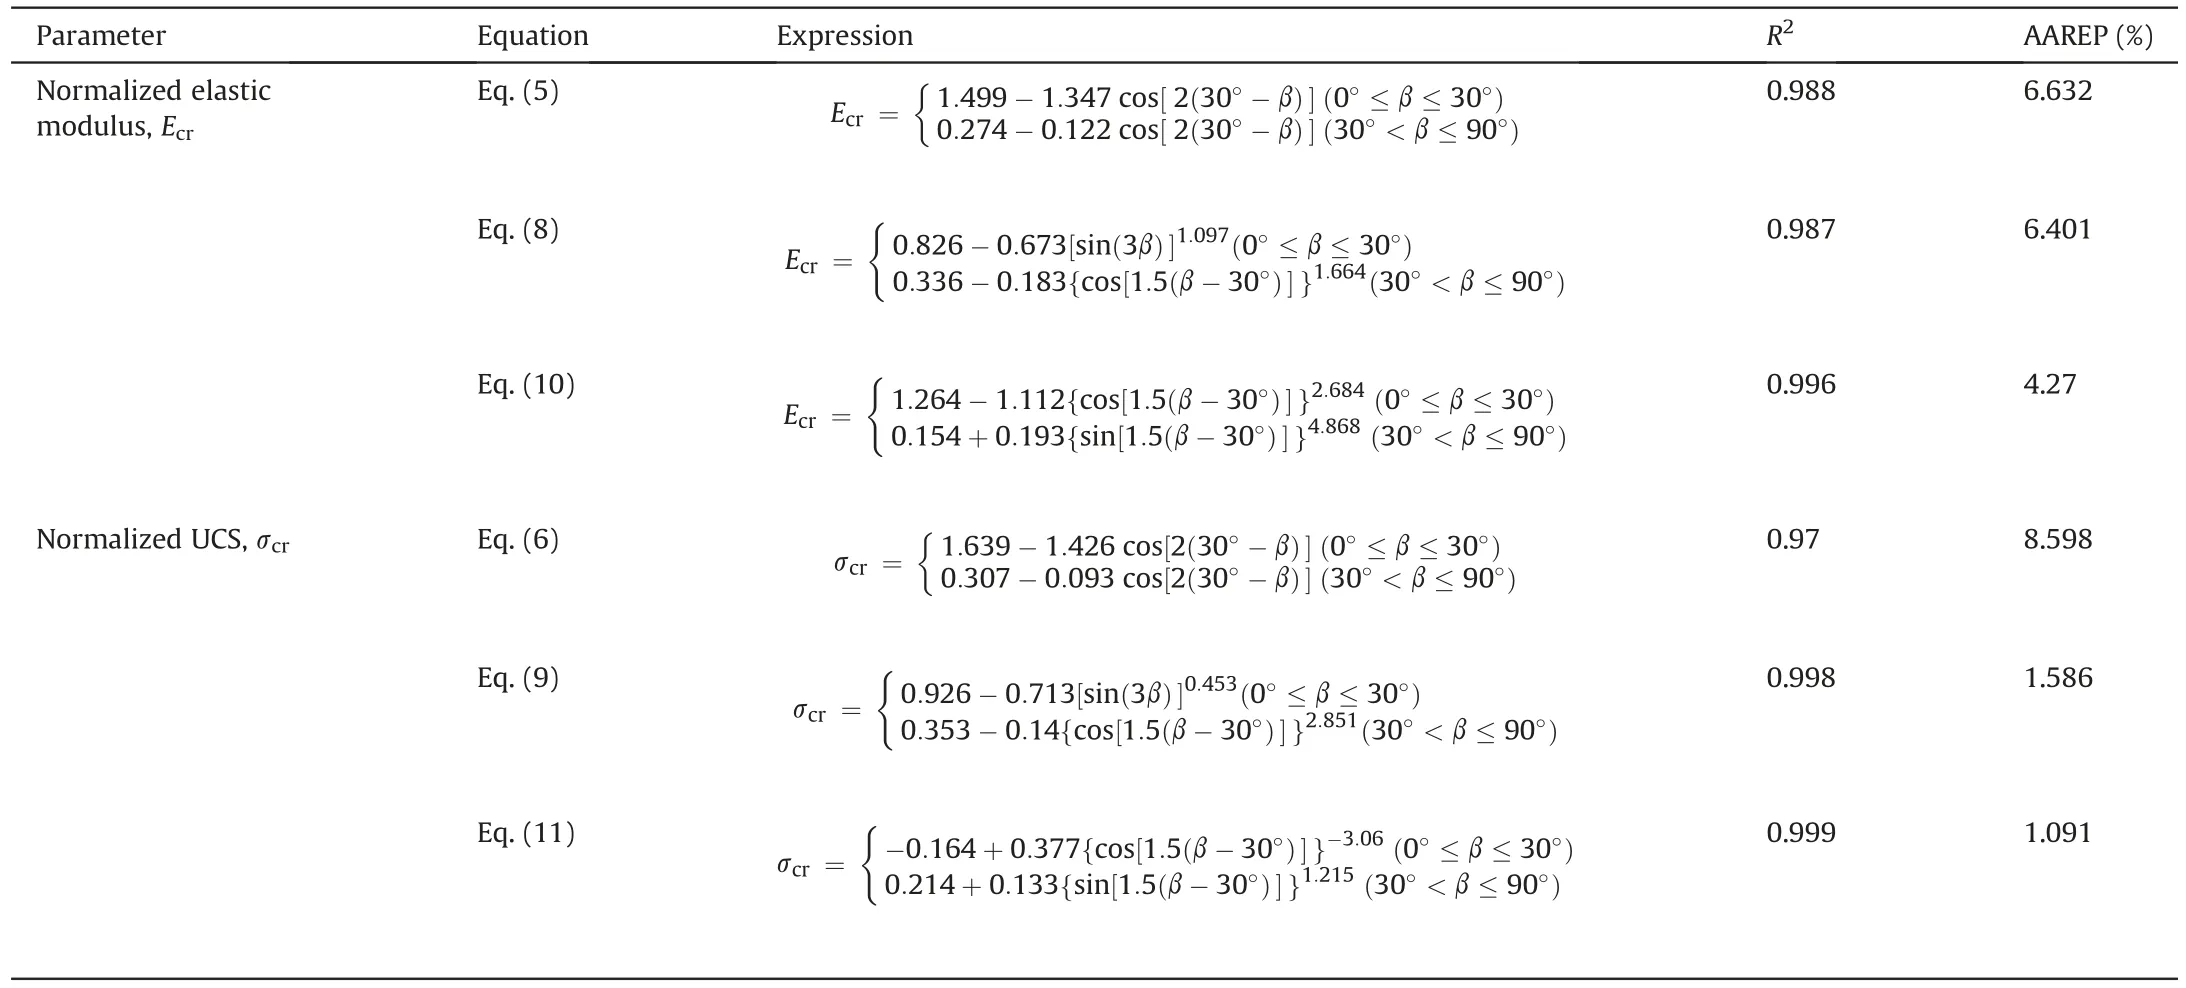
Table 4 Empirical relations for predicting normalized elastic modulus and UCS.
5.2.Prediction using modified joint factor Jmf
The weakening effect of joints on the mechanical behaviors of intact rock depends not only on the joint orientation,but also on the roughness and frequency of joints (Ramamurthy and Arora,1994).Thus,the joint factorJfwas proposed:

whereJnis the number of joints per meter in the load direction,reflecting the frequency of joints;nis the inclination parameter of joint;andris the roughness parameter of joint.
In contrast to the general jointed rock mass,CJRM has a special columnar structure.If the frequency of columnar joints is calculated according to the traditional frequency parameterJn,the structural characteristics of CJRM cannot be clearly reflected,and it will bring difficulty in the field investigation.Thus,we propose a modified frequency parameterJsnsuitable for the ICJRM,which is defined as the number of column cross-sections per square meter.Then,the expression of the modified joint factorJmfis defined as follows:

The number of irregular column cross-sections is difficult to count,and manual statistics are not convenient to use.Therefore,a specific equation for calculating the number of irregular column cross-sections per square meter must be established.Studies on the CJRM with different cross-sectional shapes revealed that the deformation and strength characteristics of 6P-CJRM are similar to those of ICJRM.Meanwhile,the calculation of the number of hexagonal column cross-sections is relatively simple.As shown in Fig.12,we attempt to establish the relationship between the number of irregular sections and the number of hexagonal sections of the CJRM with different dip angles.The statistical surface is along the load direction,and the included angle with the column axis is angle β.The cross-sections with a smaller area at the edge of the statistical surface are also counted.
The cross-sectional area of a single hexagonal prism with different dip anglesS6should be determined first to calculate the number of hexagonal cross-sections per square meter.The calculation model is shown in Fig.13,and the specific expression ofS6is

whereDrepresents the average maximum diagonal length of the polygonal sections,and is also the diameter of the circumscribed circle of the regular hexagon.The modified frequency parameterJsn6of the 6P-CJRM under different dip angles is

In order to reflect the relationship between the number of column cross-sections per square meter of ICJRM and 6P-CJRM with different dip angles,the irregularity coefficientInis proposed as follows:

As shown in Table 5,for the ICJRM and 6P-CJRM with dip angles of 5º-90º,the values ofJsn,Jsn6,andIncorresponding to different dip angles are obtained through manual statistics based on Eqs.(17)and (18).In the uniaxial compression test,the average maximum diagonal length of the irregular column cross-section is 3 cm.To facilitate the engineering application of the empirical relation,Din the calculation is 0.18 m based on the similarity constant of geometry.
Fig.14 shows that the irregularity coefficientIndecreases exponentially with the dip angle β,and the fitting relation is

By substituting Eqs.(17) and (19) into Eq.(18),the number of irregular column cross-sections per square meterJsncan be calculated.The inclination parameternin Eqs.(14) and (15) can be determined according to Ramamurthy and Arora (1994).The roughness parameterris equal to tanφj,where φjis the friction angle along the critical joint at sufficiently low normal stress.In this model test,the friction angle is 32º,then the roughness parameterr=0.625.In addition,the calculated modified frequency parameterJsn,traditional frequency parametersJn,inclination parametern,modified joint factorJmf,and traditional joint factorJfare listed in Table 6.When the dip angle β=0º,the number of the column cross-sections or joints is equal to 0 in the loading direction,and these values are not listed in Table 6.
Based on numerous test data,Jade and Sitharam (2003) proposed the optimum form of the empirical expressions as follows:

wheread,bd,andcdare the constant terms in the deformation empirical equation;andas,bs,andcsare the constant terms in the strength empirical equation.
As shown in Fig.15,the test results in Table 2 and the modified joint factorsJmfin Table 6 are fitted in the form of Eq.(20),and the following relations are obtained:

Meanwhile,as shown in Fig.16,the traditional joint factorsJfin Table 6 are used to fit the test results,and the specific empirical equations are as follows:
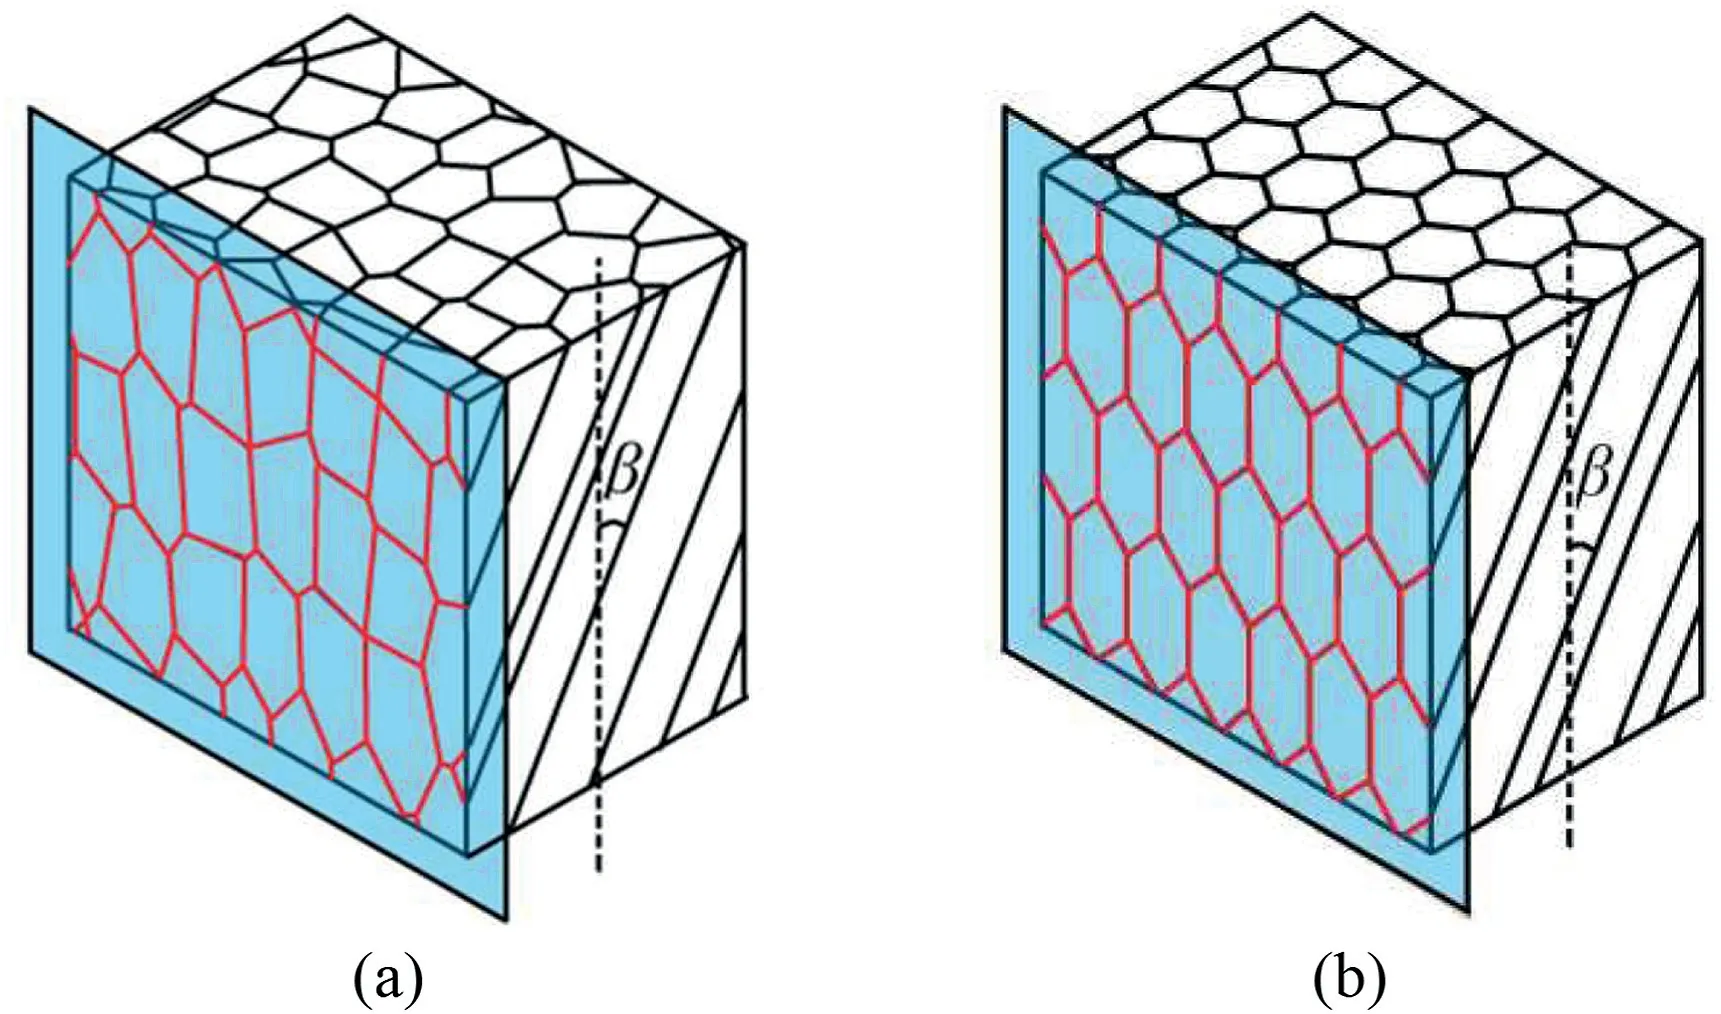
Fig.12.Statistics of the number of column cross-sections per square meter:(a)ICJRM;and (b) 6P-CJRM.

The error measuresR2and AAREP are adopted to assess the prediction accuracy of Eqs.(21)-(24).The results show that the modified joint factor method is superior to the traditional joint factor method in predicting the deformation and strength parameters of the ICJRM,because the modified joint factor can effectively reflect the structural characteristics of the CJRM.
5.3.Application of proposed empirical methods
The engineering region of the Baihetan Hydropower Station involves the Permian Emeishan Group (P2β) basalt.The columnar joints are widely developed in thelayers,and the average dip angle is 15º(Jiang et al.,2014).The CJRM at the dam foundation is inlaid block and is less affected by weathering and excavation unloading(Ji et al.,2017).No microcracks or transverse hidden joints are developed in the basalt,and the columnar joints are either closed or open (less than 0.5 mm).The physical and mechanical parameters of the intact basalt at the dam foundation are listed in Table 7,and the cohesion and friction angle of the joints are 0.25 MPa and 39.7º,respectively (Ji et al.,2017).
The elastic modulus of the CJRM at the dam foundation measured by the plate jacking tests is 11.9-26.2 GPa,as shown in Table 8 (Ji et al.,2017).When only the dip angle β is used for prediction,the deformation and strength parameters can be obtained by substituting β=15ºinto Eqs.(10) and (11),and the calculated results are presented in Table 8.The average diameter of the crosssections of Baihetan CJRM is 0.18 m,thus the modified frequency parameterJsnis determined to be 21.88 m-2using Eqs.(18) and(19).From the friction angle of the joints,ris determined to be 0.8.The inclination parameternis 0.4.Thus,the modified joint factorJmfis calculated to be 68.36 using Eq.(15).The field elastic modulus and UCS can be determined by substitutingJmfinto Eqs.(21) and (22),and the calculated values are given in Table 8.
TheQsystem is introduced to verify the proposed empirical relations.The six basicQparameters of Baihetan CJRM are presented in Table 9.In the table,QRQD,QJn,QJr,QJa,QJw,andQSRFare the RQD value,joint set number,joint roughness number,joint alteration number,water reduction factor,and stress reduction factor,respectively.
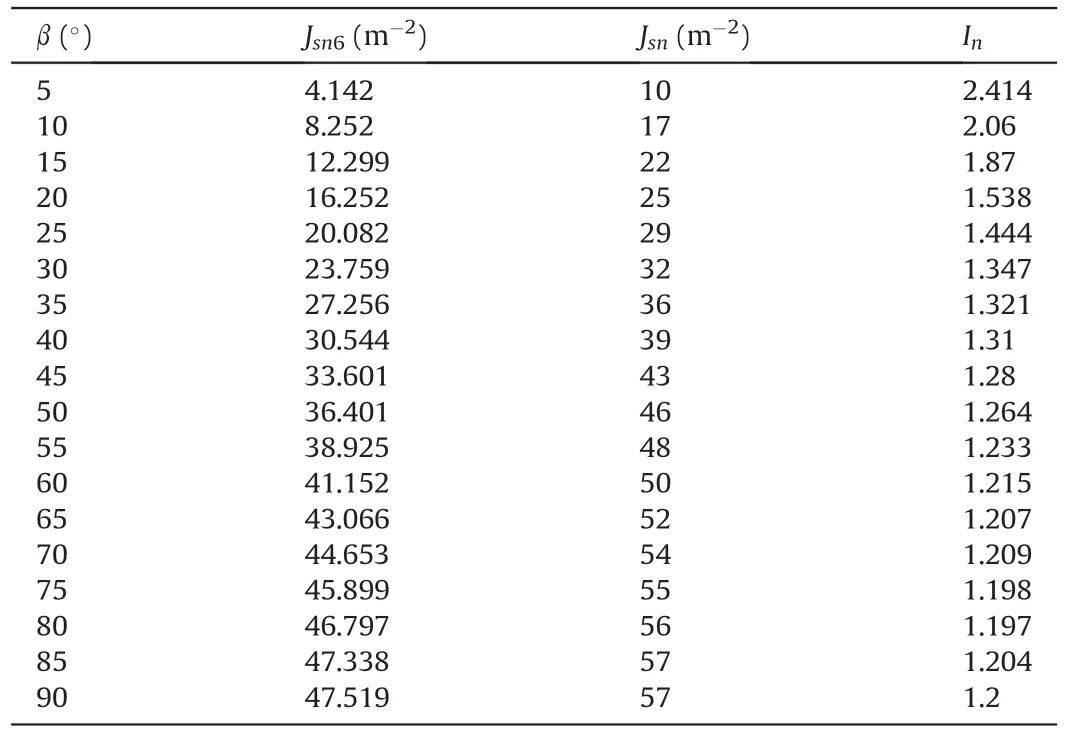
Table 5 Values of Jsn, Jsn6,and In corresponding to different dip angles.

Table 6 Modified and traditional joint factor values of ICJRM specimens.
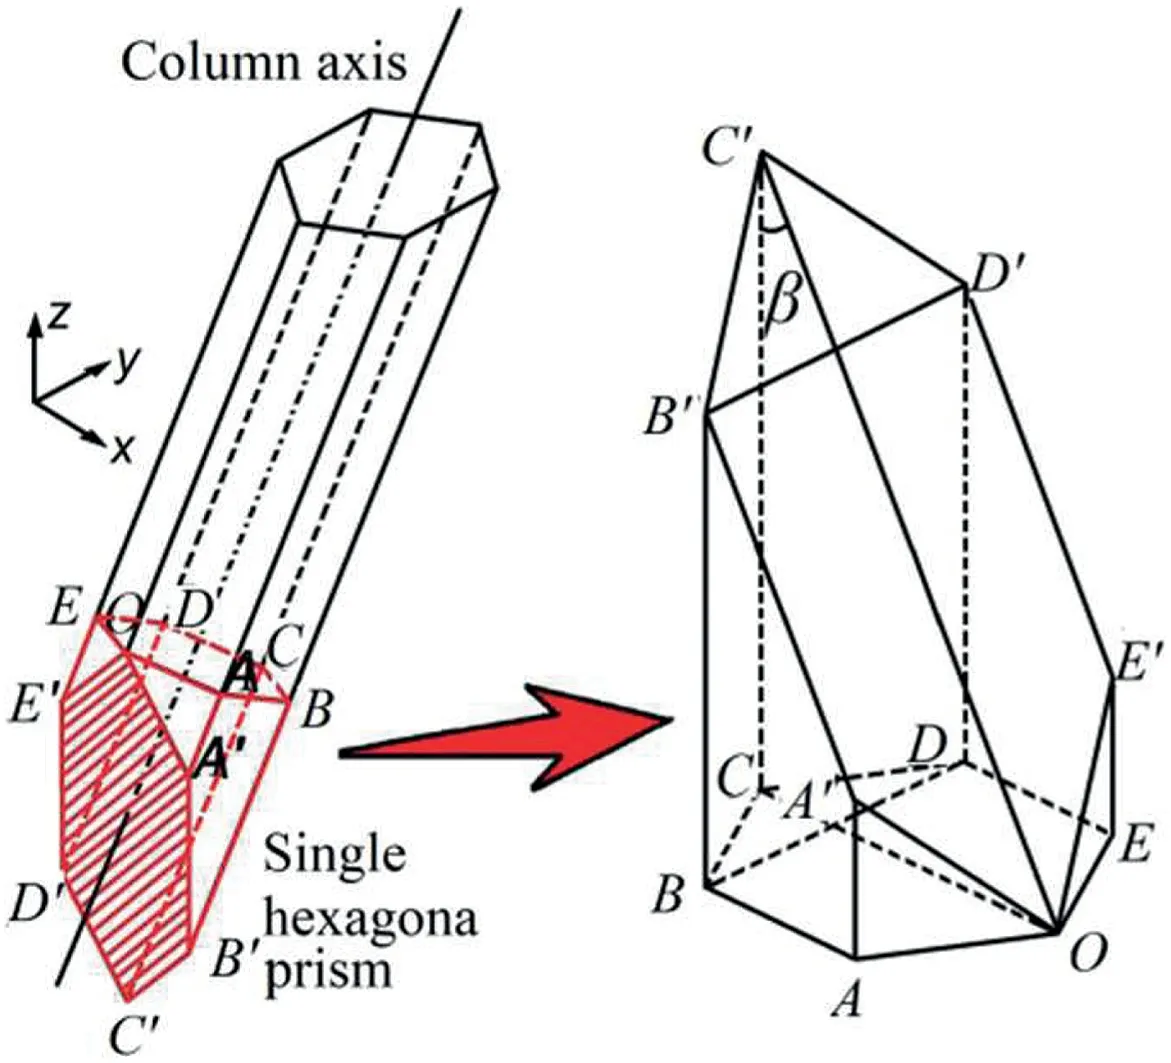
Fig.13.Calculation model for the cross-sectional area of a single hexagonal prism with different dip angles.
The empirical relations for predicting the deformation and strength parameters based on theQvalue are expressed as follows(Barton,2002):

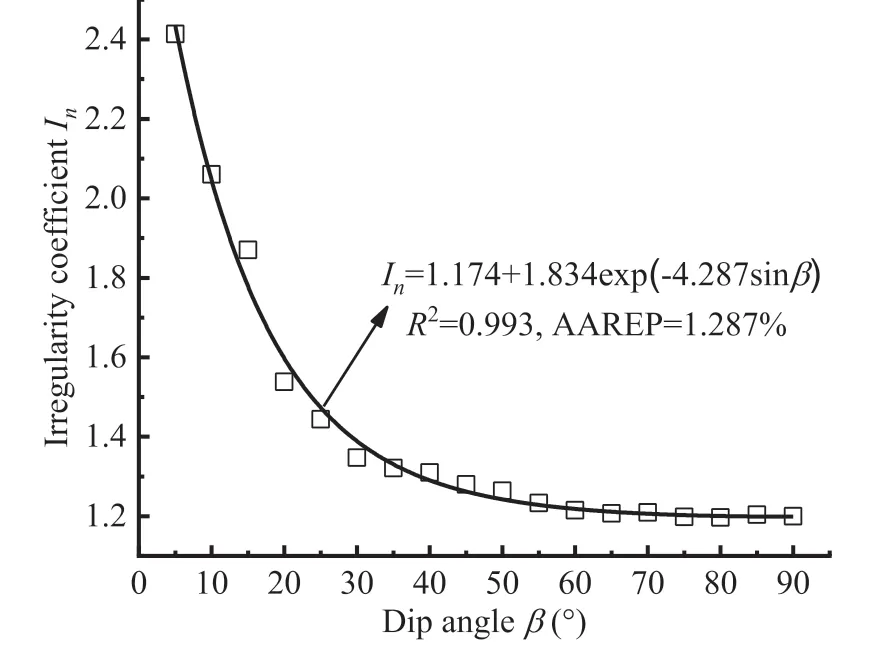
Fig.14.Fitting curve of the irregularity coefficient In.
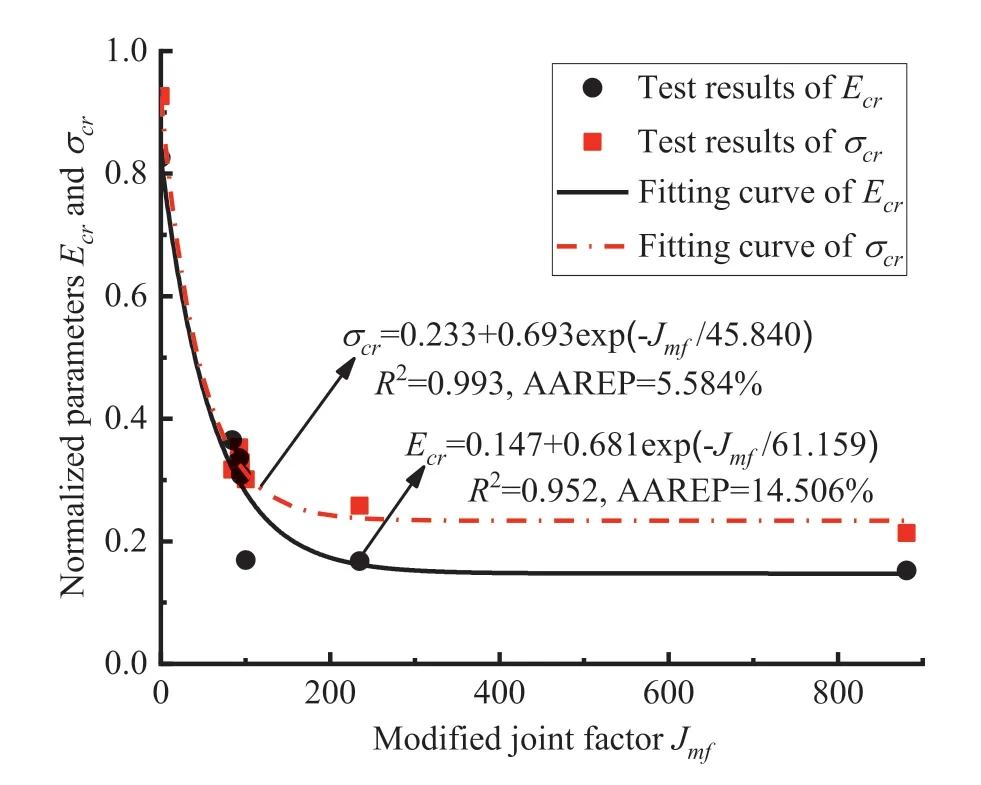
Fig.15.Relations between normalized mechanical parameters and modified joint factor.
TheQ-based deformation and strength parameters are determined using Eqs.(25) and (26) and listed in Table 8.
The field deformation and strength parameters in Table 8 are compared and analyzed.

Table 7 Physical and mechanical parameters of intact basalt at dam foundation (Ji et al.,2017).

Table 8 Calculated results of field deformation and strength parameters.

Table 9 Q value of CJRM at dam foundation.
The evaluation of the deformation prediction effect is based on the plate jacking test result.The results estimated using the proposed Eqs.(10)and(21)are all in the range of the plate jacking test result,and the two predicted values are very close.However,theQbased predicted value is larger than the field test result,showing a worse prediction effect than the proposed empirical relations.Therefore,these two deformation empirical relations established according to the model test results can effectively predict the field elastic modulus of Baihetan CJRM.
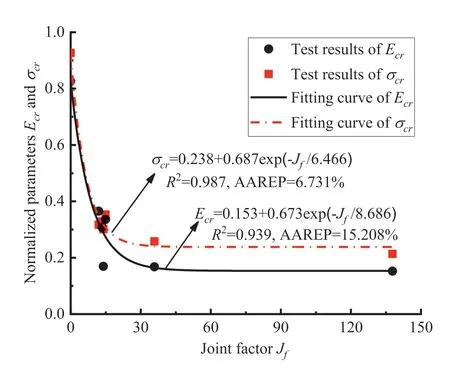
Fig.16.Relations between normalized mechanical parameters and traditional joint factor.
The evaluation of the strength prediction effect takes theQbased predicted value (Eq.(26))as a reference.The UCS estimated using the dip angle β (Eq.(11)) is smaller than theQ-based result,while the value estimated using the modified joint factor(Eq.(22))is larger than theQ-based value.The field UCS values predicted by the two proposed empirical relations are all relatively close to theQ-based predicted result,indicating that these two methods demonstrate good ability to predict the field strength parameter of the Baihetan CJRM.
6.Conclusions
The physical model tests are conducted on the ICJRM specimens with different dip directions and dip angles,and the empirical relationships for predicting the field deformation and strength parameters of the CJRM are established.The following conclusions can be drawn:
(1) The variation curves of elastic modulus and UCS with the dip direction are both approximately horizontal straight lines.The elastic modulus and UCS first decrease and then increase with the increase of dip angle,and the most unfavorable dip angles to resist the deformation failure and vertical load are all 30º.
(2) The deformation and strength characteristics of ICJRM show transverse isotropy,which is the same as the field investigation result.The anisotropic ratios of ICJRM in the horizontal and vertical planes are 1.03 and 4.34,respectively,and the corresponding anisotropic degrees are ranked into isotropy and high,respectively.
(3) Three main failure modes of ICJRM specimens with different dip directions and dip angles are summarized,including the tensile failure through columns (α=0º-90º,and β=75º-90º),shear failure along joints (β=45º-60º),and mixed failure along the column axis(β=0º-30º).The failure modes are mainly affected by the dip angle of the column axis.
(4) When only the dip angle is used for prediction,the proposed empirical relations are more consistent with the model test results than the equations proposed by Donath (1961) and Shi et al.(2016).In addition,the proposed modified joint factor method is better than the traditional joint factor method,and it is more suitable for the CJRM.
(5) The proposed empirical equations are used in the Baihetan CJRM,and the calculated results are compared with the field test results andQ-based values.The comparison shows that the two proposed empirical methods are effective in predicting the field deformation and strength parameters of the Baihetan CJRM.
Declaration of competing interest
The authors declare that they have no known competing financial interests or personal relationships that could have appeared to influence the work reported in this paper.
Acknowledgments
This work was supported by the Fundamental Research Funds for the Central Universities,the Postgraduate Research &Practice Innovation Program of Jiangsu Province(Grant No.KYCX21_0487),and the National Natural Science Foundation of China (Grant Nos.41831278,and 51579081).
 Journal of Rock Mechanics and Geotechnical Engineering2023年2期
- Journal of Rock Mechanics and Geotechnical Engineering的其它文章
- On the critical particle size of soil with clogging potential in shield tunneling
- Experimental investigations on effects of gas pressure on mechanical behaviors and failure characteristic of coals
- Spatial distribution and failure mechanism of water-induced landslides in the reservoir areas of Southwest China
- Characteristics of electromagnetic vector field generated from rock fracturing
- A multi-purpose prototype test system for mechanical behavior of tunnel supporting structure: Development and application
- Geotechnical investigation of low-plasticity organic soil treated with nano-calcium carbonate
