Effect of roughness on the shear behavior of rock joints subjected to impact loading
Feili Wng ,Shuhong Wng ,Wei Yo ,Xing Li ,Fnzheng Meng ,Kiwen Xi,*
a College of Science,Qingdao University of Technology,Qingdao,266033,China
b School of Resource and Civil Engineering,Northeastern University,Shenyang,110819,China
c State Key Laboratory of Hydraulic Engineering Simulation and Safety,School of Civil Engineering,Tianjin University,Tianjin,300072,China
d Department of Civil and Mineral Engineering,University of Toronto,Toronto,Ontario,M5S 1A4,Canada
Keywords:Rock joint Impact loading Joint roughness Shear strength Shear deformability
ABSTRACT The shear behavior is regarded as the dominant property of rock joints and is dramatically affected by the joint surface roughness.To date,the effect of surface roughness on the shear behavior of rock joints under static or cyclic loading conditions has been extensively studied,but such effect under impact loading conditions keeps unclear.To address this issue,a series of impact shear tests was performed using a novel-designed dynamic experimental system combined with the digital image correlation(DIC)technique.The dynamic shear strength,deformability and failure mode of the jointed specimens with various joint roughness coefficients (JRC) are comprehensively analyzed.Results show that the shear strength and shear displacement characteristics of the rock joint under the impact loading keep consistent with those under static loading conditions.However,the temporal variations of shear stress,slip displacement and normal displacement under the impact loading conditions show obviously different behaviors.An elastic rebound of the slip displacement occurs during the impact shearing and its value increases with increasing joint roughness.Two identifiable stages (i.e.compression and dilation)are observed in the normal displacement curves for the rougher rock joints,whereas the joints with small roughness only manifest normal compression displacement.Besides,as the roughness increases,the maximum compression tends to decrease,while the maximum dilation gradually increases.Moreover,the microstructural analysis based on scanning electron microscope (SEM) suggests that the roughness significantly affects the characteristics of the shear fractured zone enclosing the joint surface.
1.Introduction
Rock joints constitute the prevailing structural features of rock masses,and govern their physico-mechanical properties such as strength,deformation and permeability(Singh and Basu,2018).It is well known that rock joints at any scale will not be truly smooth in practical engineering applications.To quantify the roughness of rock joint,Barton and Choubey (1977) proposed ten standard profiles for estimating the joint roughness coefficient (JRC) value.Although other statistical indices (e.g.root mean square,Z2;structure function,SF;roughness coefficient,Rs;potential contact area,;joint contact state coefficient,JCC) have also been put forward in recent years to characterize the joint roughness(Grasselli et al.,2002;Tang and Wong,2016),the JRC is still the most commonly used one due to its simplicity and effectiveness.
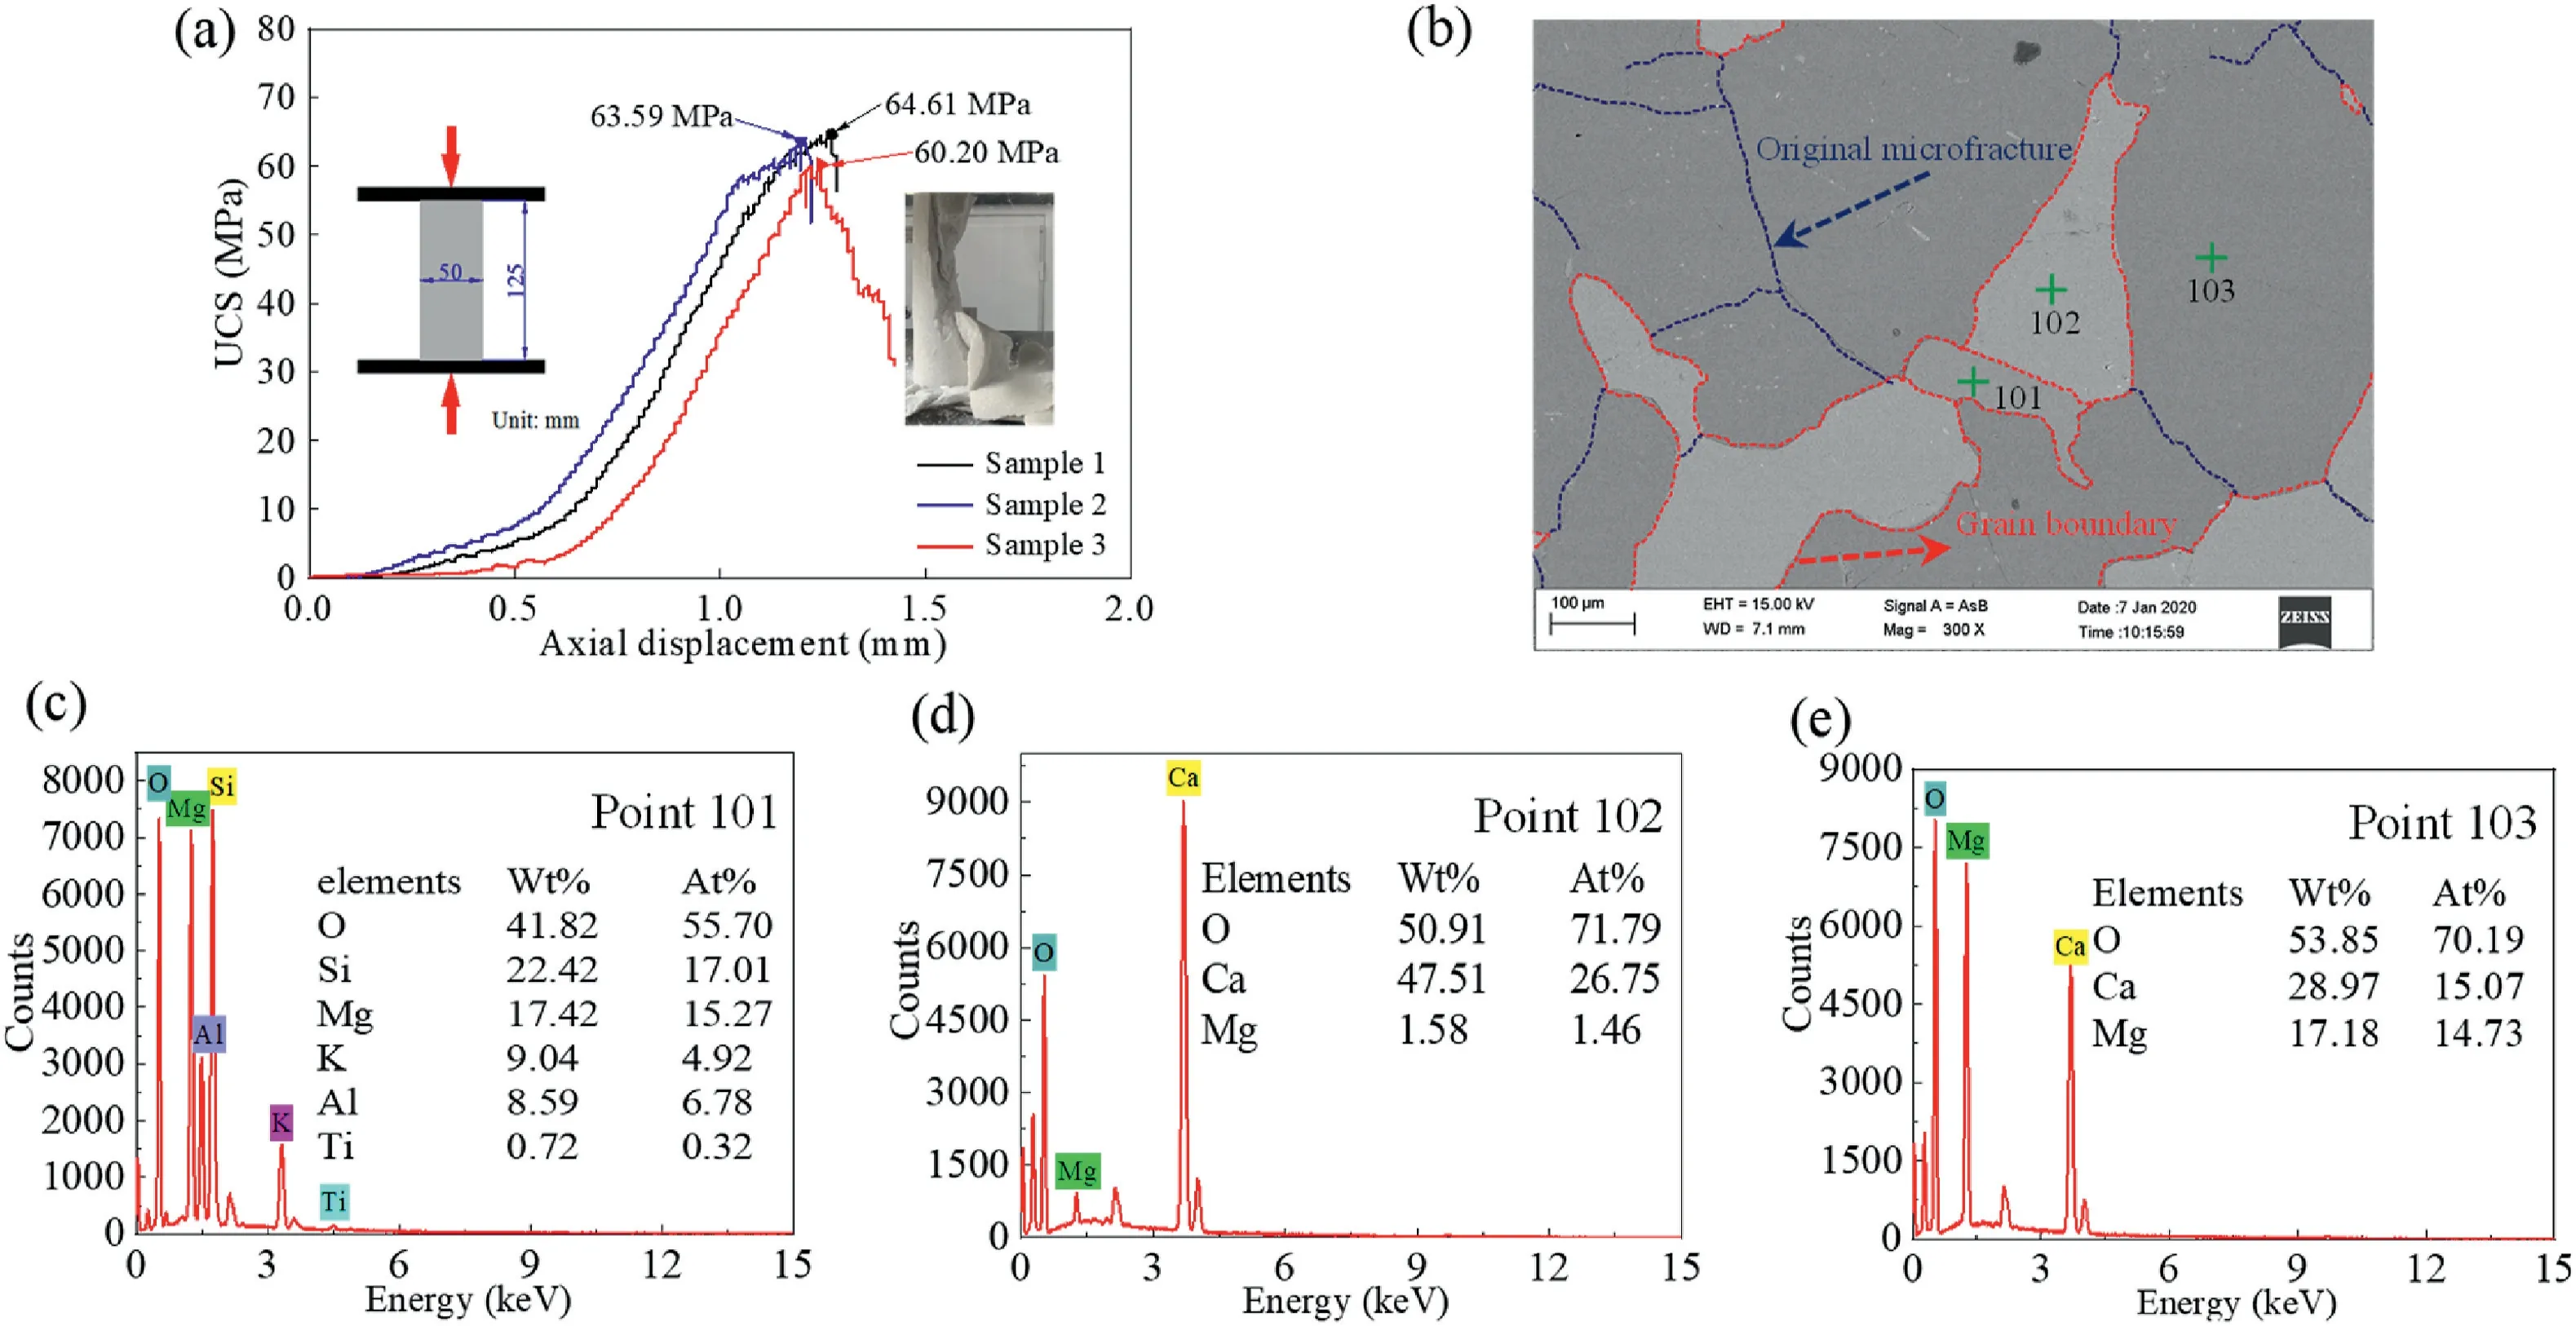
Fig.1.Testing rock used in this study:(a)USC of SM sample,(b)SEM image of SM sample(magnified by 300 times),and(c)-(e)The main element composition at points 101,102 and 103.
To experimentally study the influence of joint roughness on the shear behaviors of the rock joint,the direct shear tests under monotonic or cyclic loading conditions have been performed (Lee et al.,2014;Yang et al.,2016;Liu and Dai,2021;Meng et al.,2021).According to the current investigations,a consensus is that the shear behaviors of rock joint are dramatically influenced by the surface roughness.For example,the shear strength obviously increases with the JRC(Gentier et al.,2000;Grasselli et al.,2002;Tang and Wong,2016)and its anisotropy is dominated by the directiondependent property of roughness (Aydan et al.,1996;Kumar and Verma,2016).Apart from the shear strength,the non-uniform asperity of the joints plays a vital role in controlling the asperity deformation of the rock joint,which can be characterized through a direct method (Roko et al.,1997;Hossaini et al.,2014;Meng et al.,2018) or indirect method assessed by the joint dilation angle(Indraratna et al.,2014).Typically,the joints with higher roughness show more remarkable asperity deformation and a higher dilationincreasing rate.The cyclic shear test provides an efficient approach in studying the complex shear properties of rock joints (e.g.peak shear stress,residual shear stress and stress-displacement relationship)and evaluating the stability of geo-structures subjected to seismic loads (Lee et al.,2001;Atapour and Moosavi,2014;Mirzaghorbanali et al.,2014a,b;Ali et al.,2016;Niktabar et al.,2017).In each shear loading cycle,four stages (forward advance,forward return,backward advance,and backward return) can be identified,during which the wear and passivation on the joint surface are gradually introduced,thereby deteriorating the shearrelated mechanical parameters (Han et al.,2020).Similar to those under monotonic loading,the characteristics of shear stress and deformation under cyclic loading are also significantly affected by the joint asperity (Lee et al.,2001).
In addition to the static and cyclic loads,the impact load is another load pattern that is often encountered in engineering practice,such as operational blasting,rockburst,percussive drilling,and accidental violent collisions including asteroid impact or terrorist attack (Zhou et al.,2018;Meng et al.,2019).Under such stress circumstance,the dynamic mechanical response of the jointed rocks indicates significant difference from that under static and cyclic loads (Aziznejad et al.,2018).However,few existing research efforts have been focused on the effects of joint roughness on the shear properties under impact loading,and the lack of the relevant knowledge may restrain the accuracy of the various assessments on rock engineering and urban infrastructure safety.
The objective of this work is to reveal the influence of joint surface roughness on the mechanical responses (including the dynamic shear strength,shear displacement,normal displacement,and failure mode) of the jointed specimens under constant impact shear velocity and constant normal stress.A modified split Hopkinson pressure bar(SHPB)combined with a specially designed biaxial loading frame was adopted to conduct the impact shear tests(Wang et al.,2021).Prior to the dynamic test,the joint surface was processed into various roughnesses quantified by JRC value.The digital image correlation (DIC) technique was used to measure the full-field displacement variation enclosing the joint,based on which the shear deformation characteristics were subsequently obtained.The failure modes of the tested specimens were identified using the scanning electron microscope (SEM),and the relationship between the shear fractured zone and JRC value was then carefully discussed.
2.Experimental setup
2.1.Specimen preparation
Shandong marble (SM) with an average uniaxial compressive strength (UCS,σc) of 62.8 MPa was selected as the testing rock,as shown in Fig.1a.The SEM image of a typical SM specimen is displayed in Fig.1b.It can be observed that moderately developed microcracks exist within the mineral grains and constitute the main defects in SM specimen.The dominant elements in SM are O(48.86%),Ca (25.50%),Mg (12.06%) and Si (7.47%) (Fig.1c-e).
The SM plates with the dimensions of 230 mm(length)×65 mm(width)×10 mm(thickness)were first cut from the same rock block and then carefully ground,after which the joints with uneven surface and desired roughness were introduced using a programmed high-pressure water jet cutter.More details on the sample preparation can be found in our earlier work(Wang et al.,2021).The JRC proposed by Barton and Choubey (1977) was utilized to quantify the roughness of rock joint specimen,and the JRC values selected in this study were 0.4,2.8,5.8,6.7 and 9.5,respectively.The configurations and corresponding images of specimens are shown in Fig.2.
2.2.Experimental method and data processing
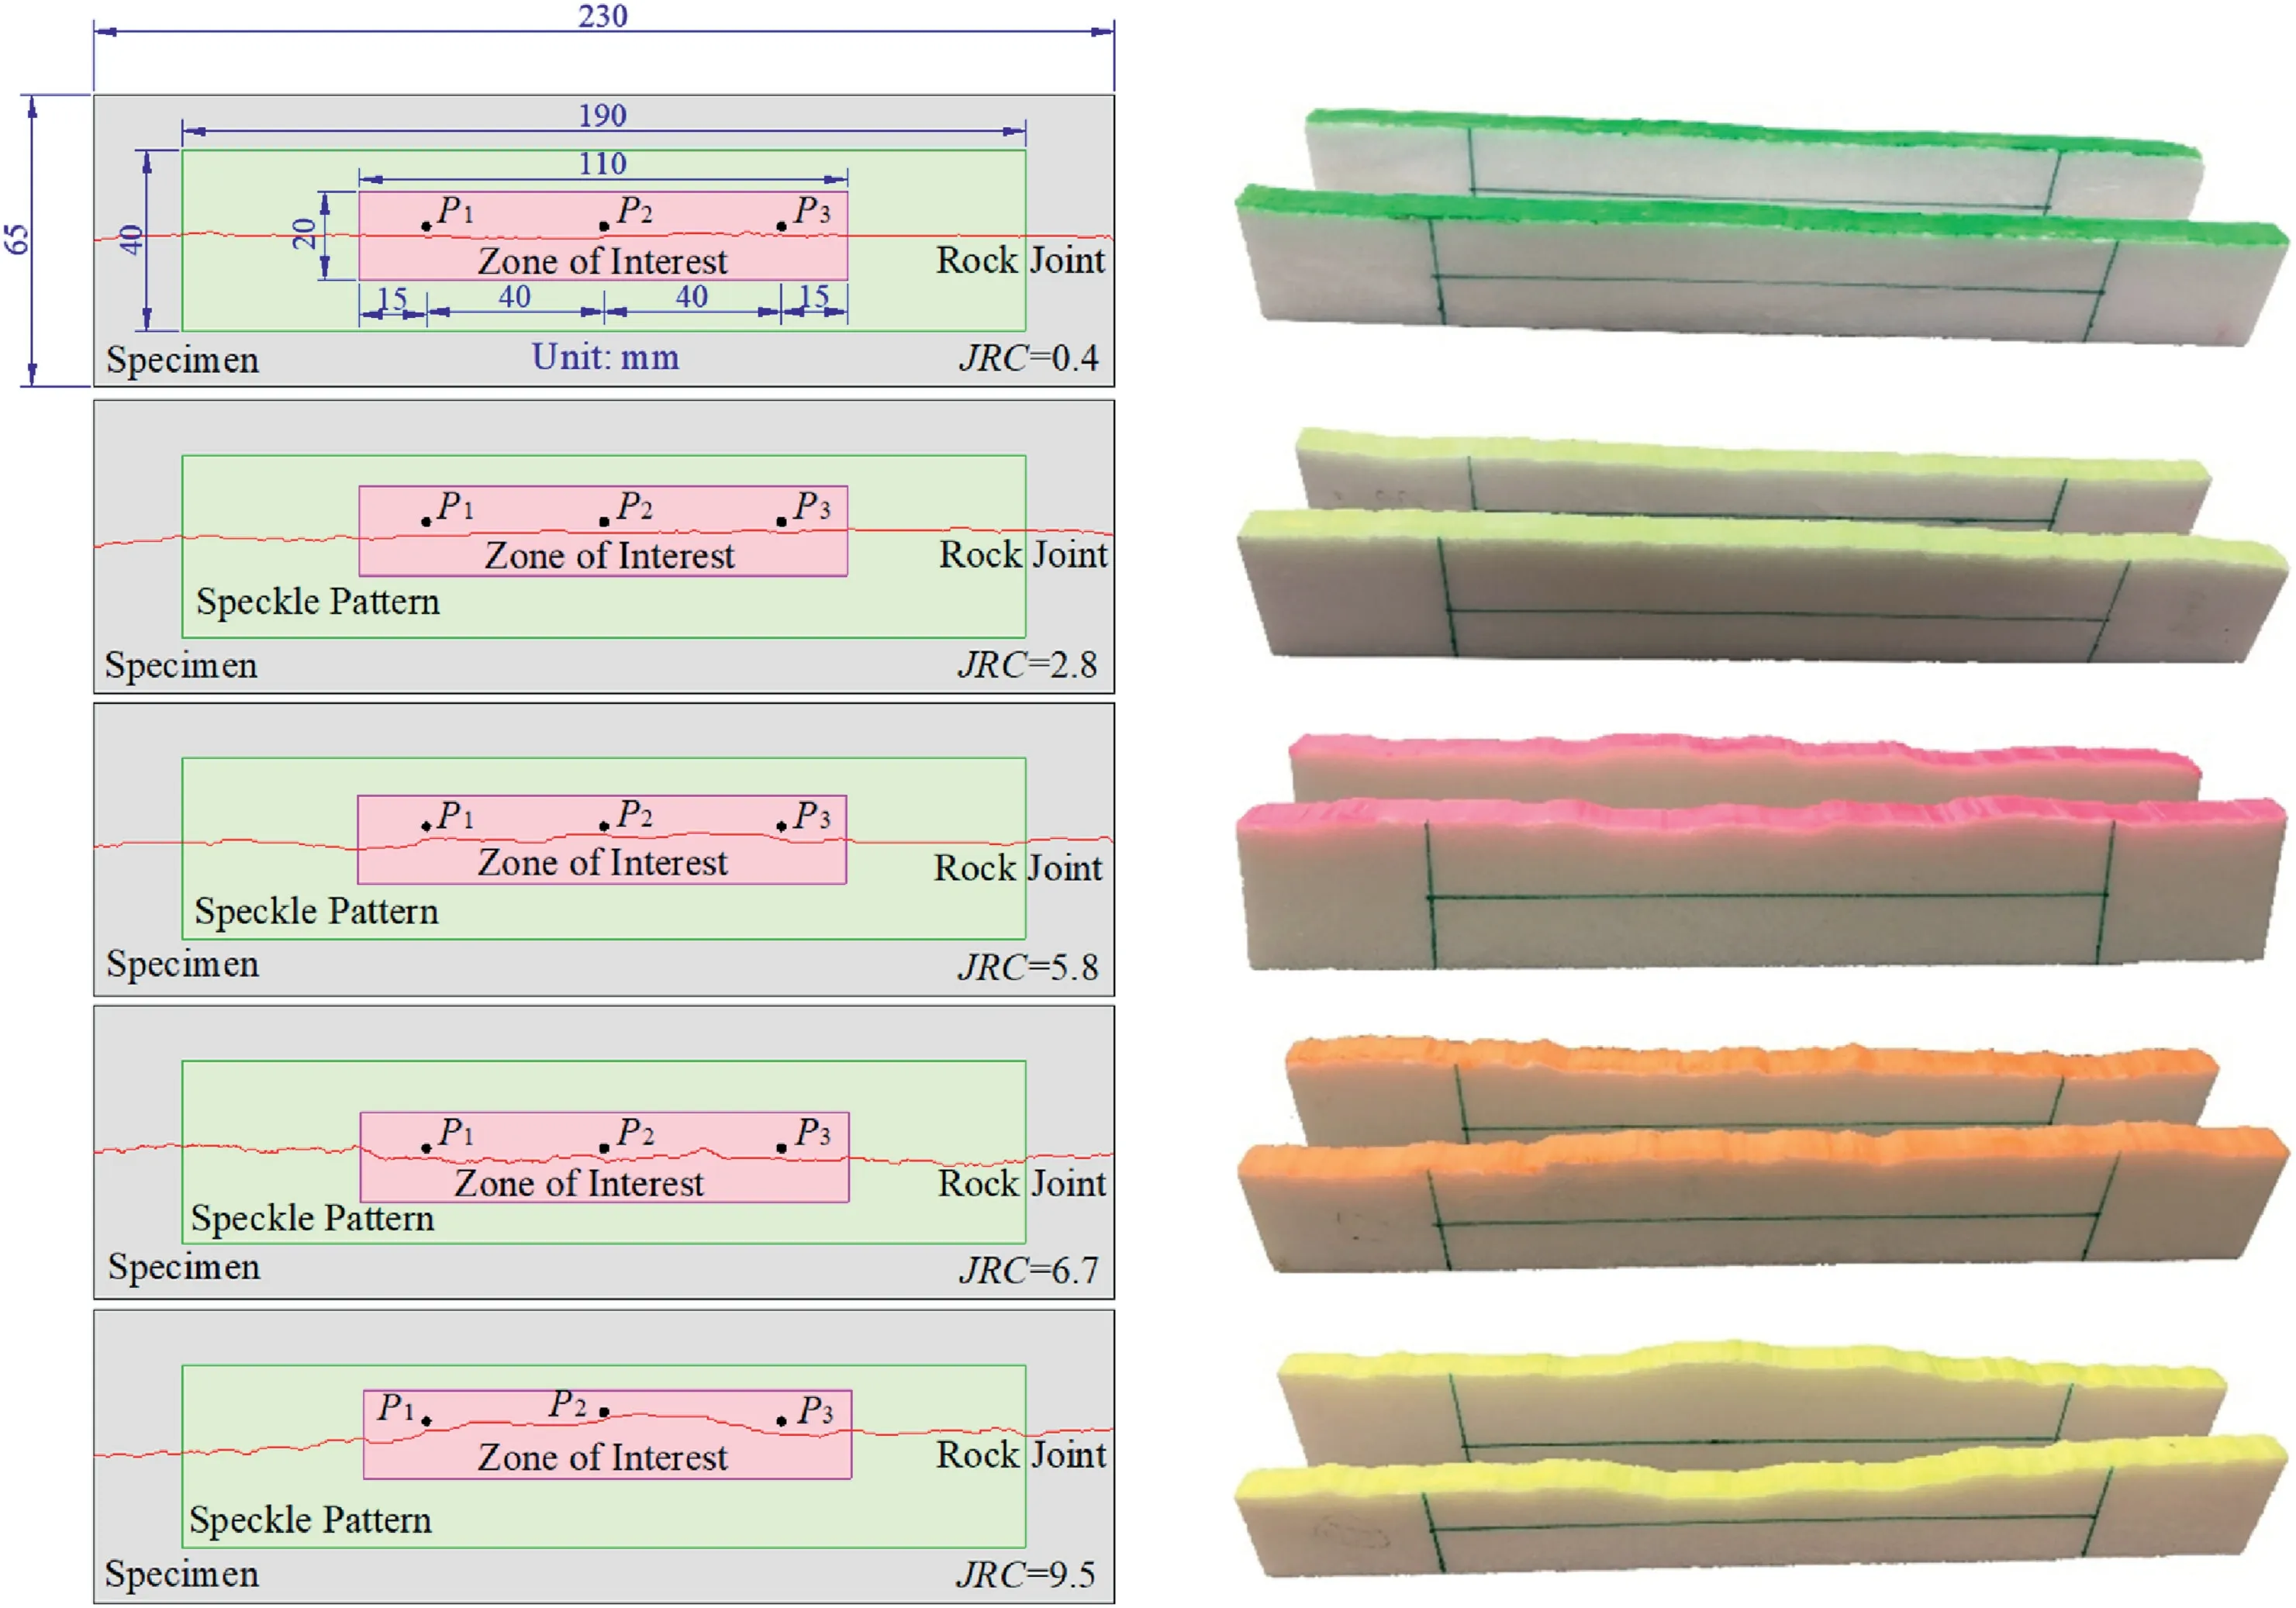
Fig.2.Rock joint specimens used in the tests.
The self-developed impact shear testing system (Yao et al.,2021),mainly composed of a modified SHPB system,a biaxial loading frame,and data acquisition system,was adopted to study the influence of roughness on the shear response of rock joints subjected to impact loading.The configuration of this system is schematically shown in Fig.3 and the detailed parameters are listed in Table 1.In a typical dynamic shear test,a pair of rock joint specimens was assembled into the loading adaptors.The lower loading adaptor was first placed on the supporting platform of the piston,allowing the specimen to be steadily mounted on.The desired normal stress was then applied to the rock discontinuity using the upper vertical platen.With the predetermined static normal stress applied,a dynamic load generated by the dynamic loading system was exerted on one side of the upper plate of the rock sample along the horizontal direction.Notably,a flat steel plate was inserted between the incident bar and the specimen for uniformly transmitting the dynamic loading to the specimen.
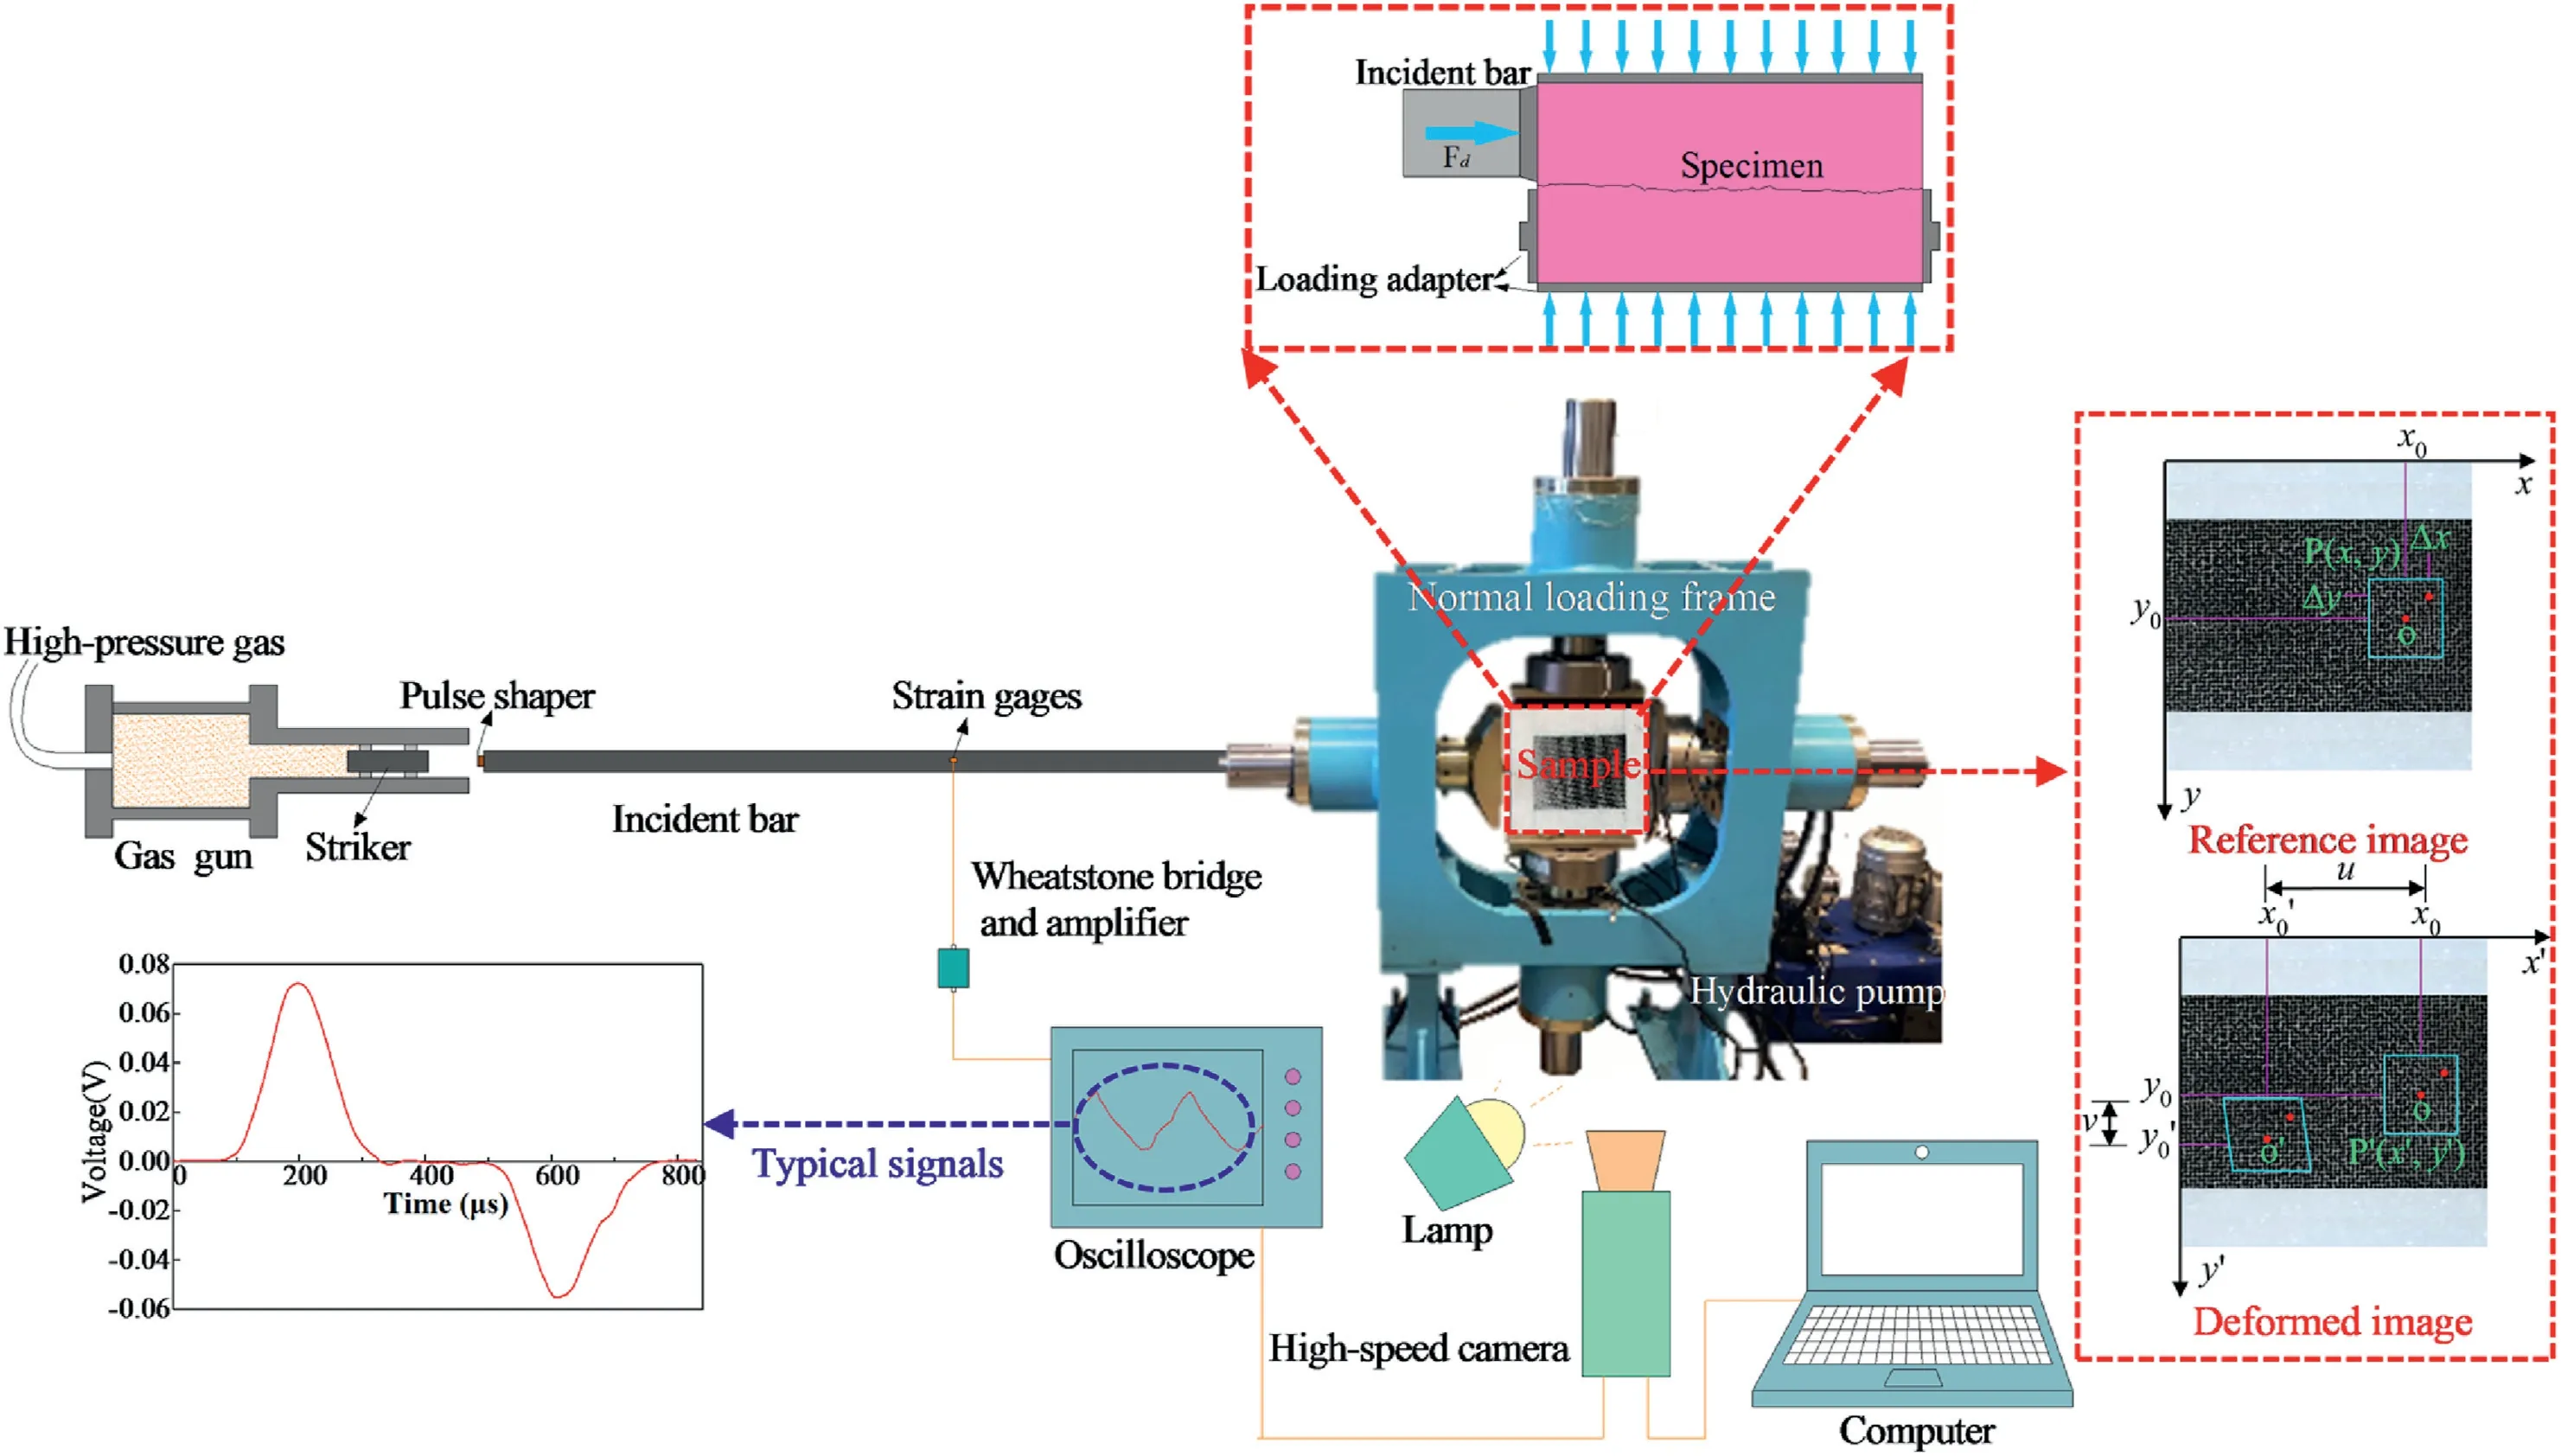
Fig.3.Experimental setup for dynamic shear test of rock joints (Wang et al.,2021).
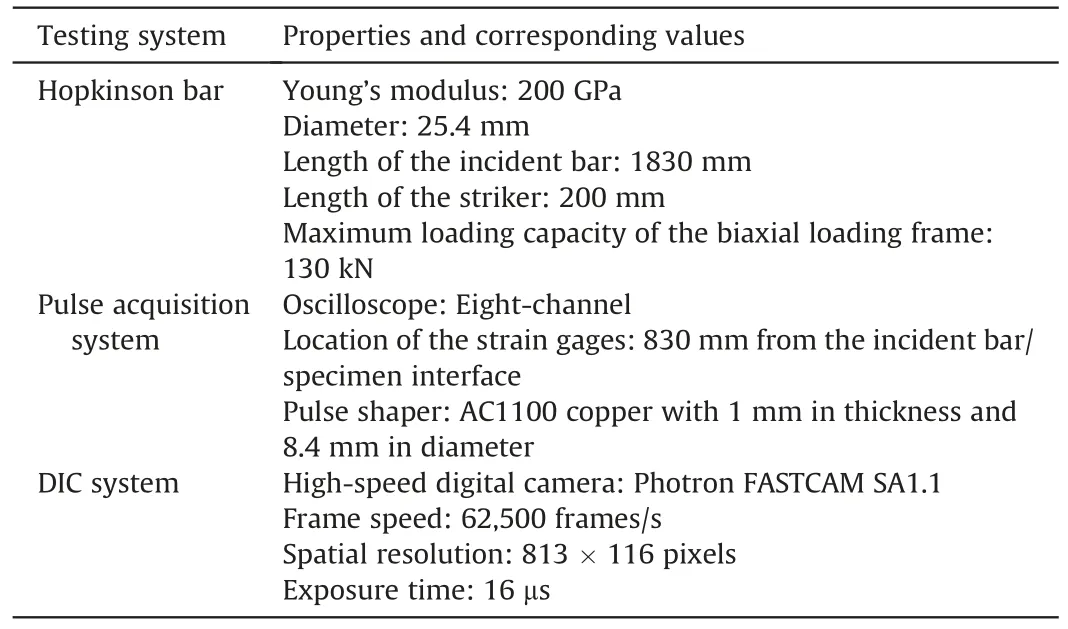
Table 1 Physico-mechanical properties of the testing system.
In the current impact shear tests,interest is focused on the impact shear strength and shear deformation characteristics.Impact shear stress can be determined based on the onedimensional (1D) stress wave theory (Xu et al.,2019).Specifically,during the impact shear tests,the striker impacts the incident bar and generates the stress wave (i.e.the incident wave,εi),with the propagation of the stress wave,part of the stress wave is reflected at the rock-steel interface(i.e.the reflected wave,εr)while the rest of the stress wave is transmitted into the rock joint.A typical signal of the impact shear test on the rock joint is shown in Fig.3.It is noteworthy that the shear stress should be understood as the nominal shear stress applied to the rock joint,which is governed by

whereFdis the impact force,Ais the sectional area of the bar,Asis the total shear area,andEis Young’s modulus of the bar material.
The joint deformability was analyzed by the DIC method,and the parameters of the DIC system used in this study are listed in Table 1.By comparing the image of specimen recorded before and after deformation,the displacement can be quantified by tracking the same pixel points located in various deformed images.Specifically,the deformation of the interest point can be calculated by Eqs.(2a) and (2b) (Gao et al.,2015;Rubino et al.,2019).Then the same procedure was repeated on the other interest points until the whole zone of interest (ZOI) is traversed and its full-filled displacements are obtained,as shown in Fig.3.

where Δxand Δyare the distances from pointPto pointO;uandvare the displacement components of the subset center pointO(x0,y0)inx-andy-directions,respectively;are the gradients of displacement components for the subset.
To investigate the effects of roughness on the dynamic shear properties of rock joints,the specimens with quantified roughness(JRC=0.4,2.8,5.8,6.7 and 9.5) were statically preloaded to a constant normal stress.As suggested by Barton and Choubey(1977),the normal stress was preferred to be set below 0.3σcin the direct shear test of the rock joint.Thus,the normal stress that equals 0.05σc(3.14 MPa)was selected in this study.To simulate the shear behavior of rock joints existing in high loading rate conditions,a constant shear velocity of 5.27 m/s was finally selected.Notably,the shear velocity (vs) can be determined (Xia and Yao,2015) by

wherecdenotes the 1D longitudinal stress wave velocity of the bar.
3.Experimental results
3.1.Correlation between JRC and nominal dynamic shear strength
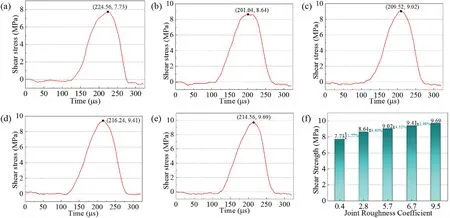
Fig.4.Effects of the JRC on the nominal shear strength: (a)-(e) Nominal shear stress-time curves of rock joints with JRC values of 0.4,2.8,5.8,6.7 and 9.5,respectively;and (f)Relationship between the JRC and nominal shear strength.
Generally,the nominal shear stress-time curve of the rock joint subjected to static loading can be categorized into three stages: a slow growth stage,a rapid growth stage,and a nearly stable stage with a constant shear stress (Meng et al.,2018).The temporal variations of calculated shear stress are demonstrated in Fig.4a-e.It can be seen that the nominal shear stress is small when the stress wave initially arrived at the jointed specimen end.Then,the shear stress begins to increase sharply before achieving the peak value,after which a sharp decrease appears and eventually falls to zero.The time-varying shear stress under the impact loading suggests an evidently different trend from that under the static loading.
Moreover,as shown in Fig.4,the peak point in the shear stresstime curve,which is defined as the nominal dynamic shear strength,varies with the joint surface roughness.The dynamic shear strengths are 7.73 MPa,8.64 MPa,9.02 MPa,9.41 MPa and 9.69 MPa corresponding to the JRC values of 0.4,2.8,5.8,6.7 and 9.5,respectively.Fig.4f shows the relation between the nominal shear strength and JRC value under the given impact loading condition.Interestingly,the nominal shear strength of the joint also shows a linear positive correlation with the JRC value(y=0.2108x+7.8399,R2=0.94),which is consistent with that of the rock joint under the static loading conditions.
3.2.Effect of surface roughness on the joint deformability
3.2.1.Slip displacement of rock joints with different roughnesses
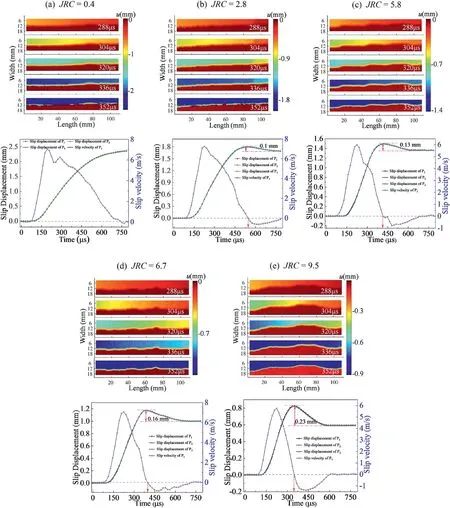
Fig.5.Slip characteristics of rock joints with different roughnesses:Upper part of(a)-(e)shows the slip displacement maps obtained by DIC,and lower part of(a)-(e)shows the temporal variations of the slip velocity and displacement after time-shifting.
The slip displacements of the specimen with different roughnesses(i.e.JRC=0.4,2.8,5.8,6.7 and 9.5)are calculated by the DIC method and its spatial distributions are displayed in Fig.5.The slip displacement maps shown in the upper part of Fig.5a-e are respectively captured at 288 μs,304 μs,320 μs,336 μs and 352 μs under the impact velocity of 5.27 m/s and the normal stress of 3.14 MPa.It can be seen that the shear displacement field along the rock joint changes with the propagation of stress wave and is influenced by the surface roughness.When the stress pulse reaches the DIC speckle region,the slip displacement near the point of the incident bar end first begins to increase (the incident wave propagates from the left side to the right side in Fig.5).As time increases,the shear deformation zone gradually moves forward.The slip displacement is finally induced along the whole joint and keeps stable at a constant value,which varies between the specimens due to the difference in surface roughness.To better illustrate the slip displacement characteristics,the temporal variations of the slip displacement and velocity are illustrated in the lower part of Fig.5a-e.The slip velocity is the time derivatives of the slip displacement.It is demonstrated that the maximum value of slip displacement decreases with the increase in roughness.Moreover,the maximum values of slip velocity decreases from 7.04 m/s to 5.74 m/s with the JRC increased from 0.4 to 9.5.Therefore,the roughness has a considerable impact on the slip behavior of rock joint under impact loads.
Along the rock joint,three separate points,marked byP1,P2,P3in Fig.2,were selected to quantitively analyze the temporal variation of the slip displacement.Specifically,P1andP3were located 15 mm away from the left and right sides of ZOI,andP2was located at the geometric center.It is observed that the slip displacement variations at the marked points present a similar trend,and the shear displacements of three points after time-shifting are almost identical,demonstrating that the choice of the point locations has little effect on the subsequent displacement analysis.For the same snapshot,the maximum value of slip displacement of each point decreases with increasing surface roughness.Besides,a small decrease in the slip displacement was found after achieving its maximum value,and the maximum value and its occurring time slightly vary between the specimens.According to Yao et al.(2021),the slip displacement of a smooth saw-cut interface subjected to impact loading suggested a monotonically increasing trend without the decreasing regime.The rock joint with a roughness ofJRC=0.4 in our work shows no obvious decrease after peak,which is consistent with Yao et al.(2021)’s results,but significant drops of 0.1 mm,0.13 mm,0.16 mm and 0.23 mm in the displacement-time curves were observed when the JRC values are 2.8,5.8,6.7 and 9.5,respectively,implying that greater surface roughness is more likely to contribute an elastic rebound of the slip displacement under impact loading,and the elastic rebound value increases with increasing surface roughness.One explanation for this phenomenon is that the rock joint with small roughness (i.e.JRC=0.4) holds limited shear resistance,the asperities might be directly cut off when the contact surface begins to slide,thus the rebound value of slip displacement is not obvious.Whereas with increasing surface roughness,the sizes of the asperities are large enough that can hardly be sheared off during the shear process.Consequently,an elastic rebound was occurred due to the resistance of the large asperity,and the larger size of the asperity tends to contribute greater resistance.Additionally,the residual slip displacement decreases with increasing joint surface roughness,indicating that the rock joint with a rougher surface can contribute a larger deformation resistance to the impact loading.
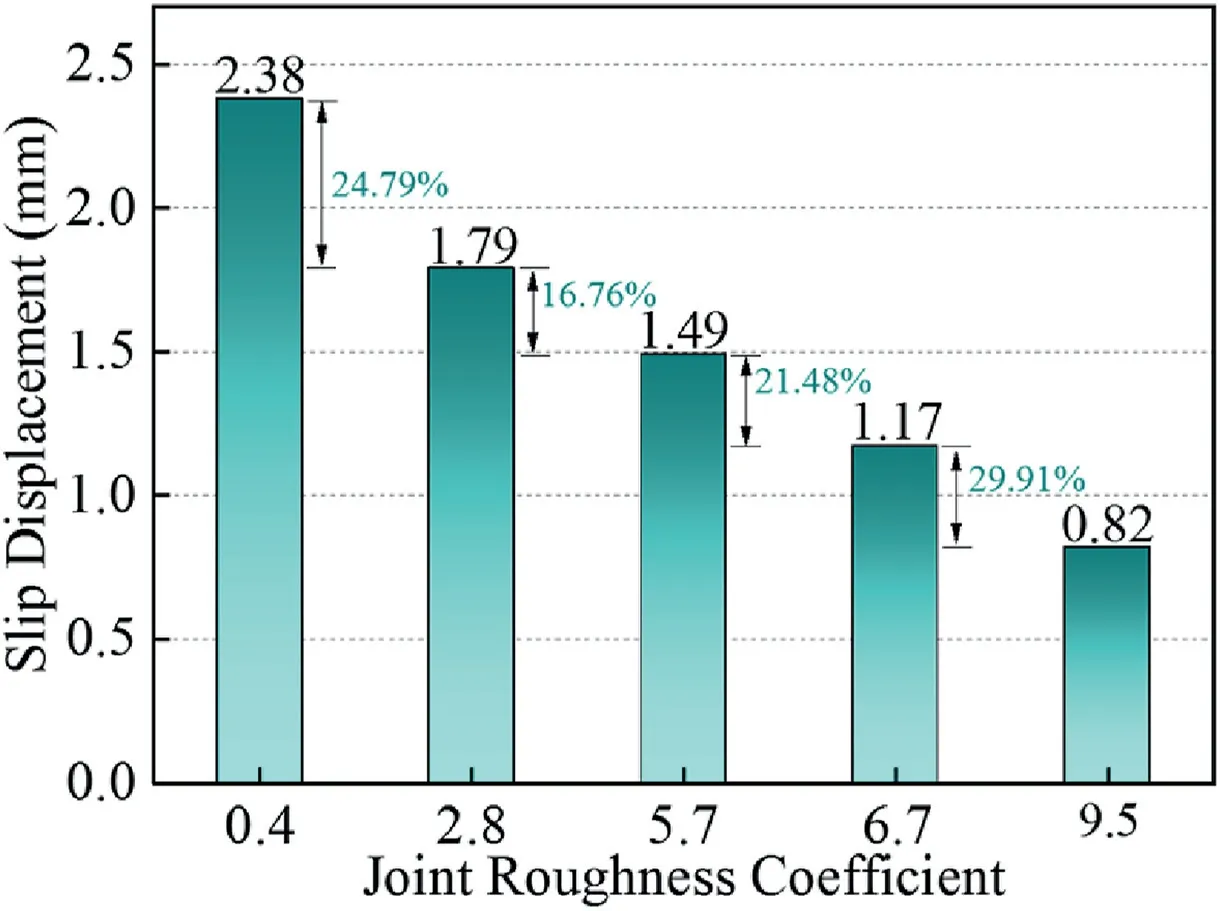
Fig.6.Effects of JRC on the slip displacement.
Collectively,as shown in Fig.6,the maximum displacement of rock joints with the JRC from 0.4 to 9.5 is reduced by approximately 65.55%.The slip displacement decreases almost linearly with the increasing JRC,which can be perfectly fitted by a monotonically decreasing straight line (y=-0.167x+2.3737,R2=0.98).Moreover,the temporal variations of shear displacement and velocity can be divided into four stages,as shown in Fig.7.At stage I (du/dt≈0),the displacement is small,and the slip velocity is about zero.At stage II (du/dt>0),the displacement increases sharply until reaching its maximum value,while the slip velocity increases first and then decreases with a nearly half-sine shape.At stage III(du/dt<0),the slip displacement decreases and the slip velocity keeps negative,meaning that the upper rock plate is continuously moving back towards the incident end.At stage IV(du/dt=0),both the slip displacement and velocity tend to be stable at a constant value.
3.2.2.Normal displacement characteristics of rock joints with different roughnesses
The normal displacement variations of three selected pointsP1,P2,P3are shown in Fig.8.It is observed that when the roughness is small (e.g.JRC=0.4,Fig.8a),the normal displacement remains positive,and the joint is compressed without dilation during the whole impact shear process.With the increase of the roughness,the normal displacement curves can be roughly divided into the compression and dilation stages.Specifically,at the initial stage of impact shear loading,the rock joint is compressed and the normal displacement is dominantly compressive.As the shear continues,the compressive displacement gradually increases and then decreases to zero,after which the normal deformation is transformed to dilation.The maximum value of compression also decreases with the surface roughness.Notably,further comparison between the temporal variations of the normal displacement and the shear stress indicates that the compression-to-dilation transition point progressively shifts to early time,i.e.occurring at 310 μs for rock joint with JRC of 2.8,whereas for the rougher joints,the transition point occurs at the moment around 200 μs.Besides,the variation behavior of the normal displacements at the post-peak stage varies for rock joints with different surface roughnesses.For example,whenJRC=0.4,the normal deformation is still compressive and the vertical displacement significantly increases at the post-peak stage.Nevertheless,with the increase of the roughness(i.e.JRC=5.8,6.7 and 9.5 in this study),the rock joints begin to distinctly dilate at the post-peak stage.It is noteworthy that the dilation increases instantaneously at the onset of the elastic rebound of the slip displacement (i.e.the moment that the slip displacements tend to decrease,as the dash line with triangle arrow shown in Fig.5).
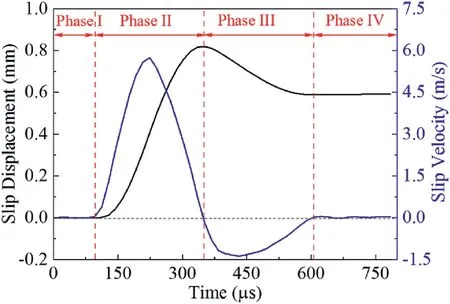
Fig.7.Slip process of rock joint under impact shear loading.
In addition,the experimental results also reveal that although the normal displacement values of different points were observed to have certain deviations and fluctuations,the normal displacements of the three points follow a similar trend.The normal displacement of one point adjacent to the rock joint can therefore roughly represent the normal displacement along the whole joint.The temporal variation of the normal displacement atP1was analyzed to further investigate the effect of the surface roughness on the normal displacement.As the surface roughness increases,the maximum value of compression tends to decrease while the maximum dilation increases.This is because the rock joint with small roughness holds limited shear resistance,the asperities can be cut off directly when the contact surface begins to slide,thus the normal displacements exhibit pure compression and the dilation is virtually absent.With increasing roughness,the sizes of the asperities are large enough that can hardly be sheared off during the shear process.Consequently,the aperture between the opposed sloping faces of the major asperities becomes wider and the dilation is prominent while the compression is limited.
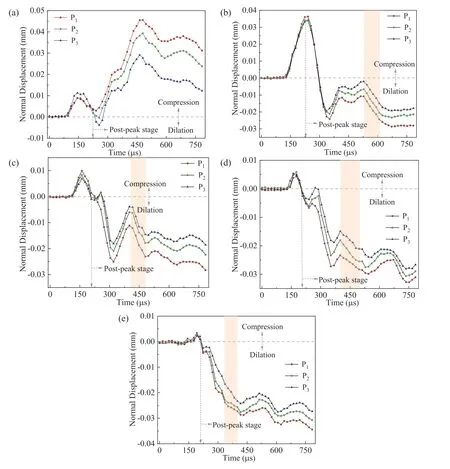
Fig.8.Temporal variations of the normal displacement of the rock joints with different values of JRC: (a)-(e) with JRC=0.4,2.8,5.8,6.7 and 9.5,respectively.
4.Microfracture characteristics of the rock joint under impact shear loading
Microstructural study on tested specimens was undertaken using SEM to investigate the shear failure mode (Fig.9).After the impact tests,the rock joint and surrounding damage zone were carefully stabilized with the heat curing epoxy (Petropoxy),and then the surface of the target zone was polished and coated with a thin layer of aurum.The sheared specimens were examined using the high-resolution Zeiss UltraPlus field emission SEM under the working condition of 15 kV accelerating voltage,200 times of magnification,and 21 mm working distance.
The characteristics of the shear fractured zones are shown in the left panel of Fig.9a-e.A main shear fracture that is approximately parallel to the shear direction,together with numerous shear-induced microcracks,can be observed in the fractured zone.To quantitatively describe the fracture characteristics within the shear fractured zone,the SEM images were further binarized as illustrated in the middle panel of Fig.9a-e and analyzed by fractal theory(Zhou and Xie,2008).In this study,the fractal dimension was determined by the box-counting method(Ai et al.,2014).The relationship between the measurement scale δ and the total number of boxesN(δ) was used to determine the fractal dimension.By changing the scale δ,different values ofN(δ)can be obtained.Giving the log-log plot of δ andN(δ),it can be observed that the data points fall into a straight-line segment.The fractal dimension can thus be determined by the slopes of the fitted lines,as shown in the right panel of Fig.9a-e.The log10δlog10Nrelation for each shear fractured zone shows an evident linear decreasing trend,demonstrating the microcrack distribution enclosing the joint has the statistically self-similar fractal property.Besides,the fractal dimensionD,which is defined as the slope of the fitting line,slightly decreases with the increase of the JRC value,suggesting that the joint with lower roughness has the potential to create more complicated microcrack networks in the shear fractured zones.
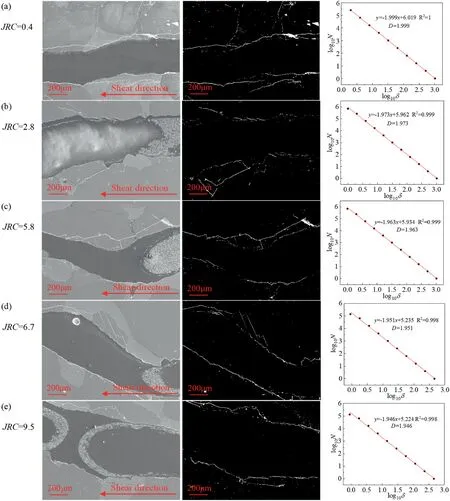
Fig.9.Characteristics of shear fractured zone with different values of JRC:Left panel of(a)-(e)shows the SEM images,middle panel shows the binarized SEM images,and the right panel shows the fractal dimensions.
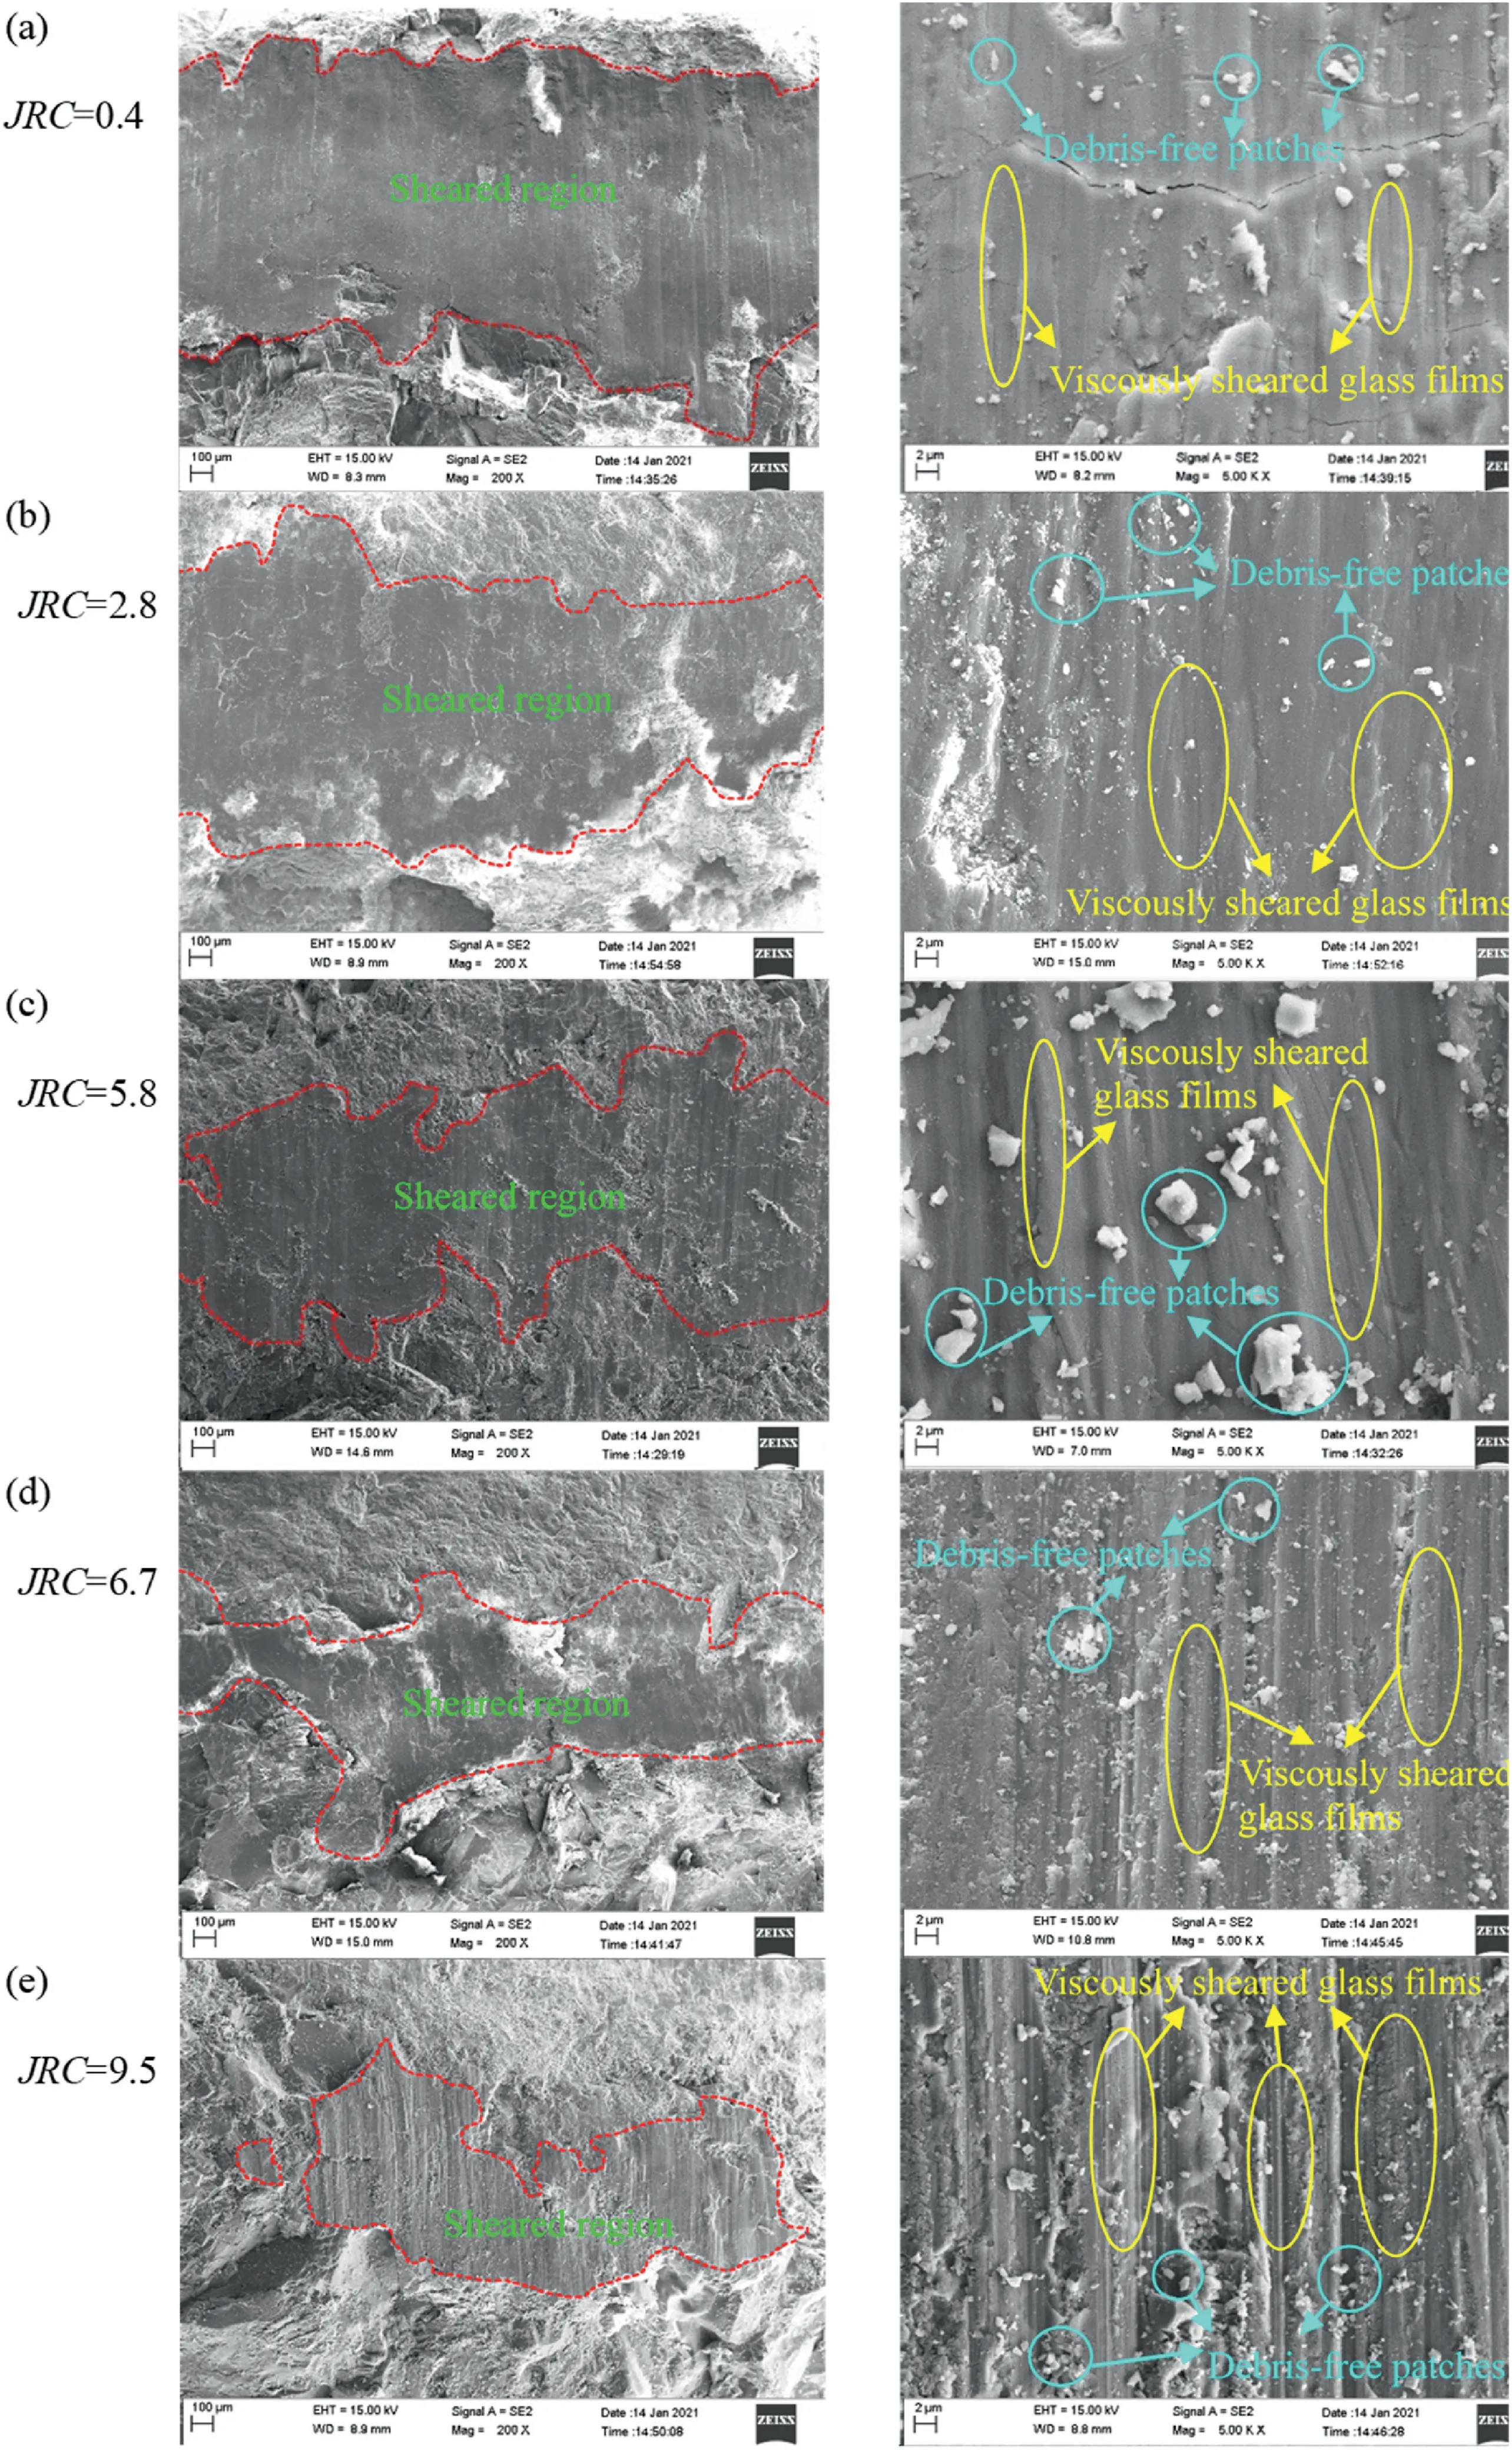
Fig.10.SEM images of microstructures on the joint surfaces after impact shearing:Magnification of 200 times in the left panel,and magnification of 5000 times in the right panel.
The detailed SEM images on fractured surfaces are shown in Fig.10.The sheared surfaces exhibit features such as textures and striations that are oriented approximately parallel to the shear direction,which is consistent with Hayward’s findings under static shear load(Hayward et al.,2019).Three typical microstructures can be identified: sheared region,viscously sheared glass films,and debris-free patches.These microstructures display different characteristics with the variation of JRC.Specifically,the area of sheared regions continuously reduces with the increase of JRC as shown in the left panel of Fig.10a-e,and the textures of viscously sheared glass films tend to be rougher and more conspicuous with increasing JRC.Moreover,the density of debris-free patches obviously increases with JRC as shown in the right panel of Fig.10a-e.
5.Conclusions
In this work,a novel-designed impact shear testing system composed of a modified SHPB and a biaxial loading frame was utilized to study the influences of joint roughness on the shear behaviors of rock joints subjected to impact loading.The shear strength was calculated based on the propagation of stress wave,and the deformation characteristics were analyzed by the DIC technique.
The shear strength increases almost linearly with increasing values of JRC,which is consistent with the shear response of rock joint under static loading conditions.However,the temporal variations of shear stress,slip displacement and normal displacement under the impact loading conditions show obviously different behaviors,for example,the elastic rebound of slip displacement and the dilation in the vertical direction.The maximum and residual slip displacements decrease with increasing joint roughness,whereas the rebound amplitude increases.When the roughness is small (e.g.JRC=0.4),the joints were continuously compressed in the vertical direction (normal deformation) during the whole impact shear process.With the increase of the roughness (i.e.JRC=2.8,5.8,6.7 and 9.5 in this study),rock joints begin to distinctly dilate at the post-peak stage while the normal displacement is the compression before the peak shear stress.The maximum compression decreases while the maximum dilation increases with increasing roughness.Notably,the dilation significantly increases at the onset of the elastic rebound of the slip displacement.Experimental results indicate that the rock joint with a rougher surface can contribute a larger deformation resistance to the impact loading.
Microstructural analysis on the impact shear specimens using the SEM technique indicates that the shear fractured zones are approximately parallel to the shear direction.The fractal dimension variations of microcrack distribution enclosing the joint suggest that the joint with lower roughness has the potential to create more complicated microcrack networks within the shear fractured zones.Moreover,the area of sheared regions gradually reduces with the increasing values of JRC.Meanwhile,the textures tend to be more conspicuous,and the density of debris-free patches increases.
Declaration of competing interest
The authors declare that they have no known competing financial interests or personal relationships that could have appeared to influence the work reported in this paper.
Acknowledgments
We acknowledge the funding support from the National Natural Science Foundation of China (Grant Nos.51879135 and 51879184),and the Natural Sciences and Engineering Research Council of Canada (NSERC) through the Discovery Grant No.72031326.
 Journal of Rock Mechanics and Geotechnical Engineering2023年2期
- Journal of Rock Mechanics and Geotechnical Engineering的其它文章
- On the critical particle size of soil with clogging potential in shield tunneling
- Strength and deformation characteristics of irregular columnar jointed rock mass: A combined experimental and theoretical study
- Spatial distribution and failure mechanism of water-induced landslides in the reservoir areas of Southwest China
- Characteristics of electromagnetic vector field generated from rock fracturing
- A multi-purpose prototype test system for mechanical behavior of tunnel supporting structure: Development and application
- Geotechnical investigation of low-plasticity organic soil treated with nano-calcium carbonate
