Effect of shear-induced contact area and aperture variations on nonlinear flow behaviors in fractal rock fractures
Chngsheng Wng,Riheng Liu,Yujing Jing,Gng Wng,Hengjie Lun
a Shandong Key Laboratory of Civil Engineering Disaster Prevention and Mitigation,Shandong University of Science and Technology,Qingdao,266590,China
b State Key Laboratory of Mining Disaster Prevention and Control Co-founded By Shandong Province and the Ministry of Science and Technology,Shandong University of Science and Technology,Qingdao,266590,China
c State Key Laboratory for Geomechanics and Deep Underground Engineering,China University of Mining and Technology,Xuzhou,221116,China
d School of Engineering,Nagasaki University,Nagasaki,852-8521,Japan
Keywords:Fracture Shear displacement Fractal dimension Nonlinear flow Contact area Flow visualization
ABSTRACT This study experimentally analyzes the nonlinear flow characteristics and channelization of fluid through rough-walled fractures during the shear process using a shear-flow-visualization apparatus.A series of fluid flow and visualization tests is performed on four transparent fracture specimens with various shear displacements of 1 mm,3 mm,5 mm,7 mm and 10 mm under a normal stress of 0.5 MPa.Four granite fractures with different roughnesses are selected and quantified using variogram fractal dimensions.The obtained results show that the critical Reynolds number tends to increase with increasing shear displacement but decrease with increasing roughness of fracture surface.The flow paths are more tortuous at the beginning of shear because of the wide distribution of small contact spots.As the shear displacement continues to increase,preferential flow paths are more distinctly observed due to the decrease in the number of contact spots caused by shear dilation;yet the area of single contacts increases.Based on the experimental results,an empirical mathematical equation is proposed to quantify the critical Reynolds number using the contact area ratio and fractal dimension.
1.Introduction
As a weak plane in rock masses,rock fractures play a vital role in determining the overall hydraulic properties of rock masses.Therefore,substantial efforts have been made to investigate the fluid flow behavior of rock fractures,since a better understanding will definitely assist in the design of many transport engineering activities,such as oil or gas production,thermal energy extraction,and CO2sequestration (Mazumder et al.,2006;Schmittbuhl et al.,2008;Neuville et al.,2010;Leung and Zimmerman,2012;Ju et al.,2013;Feng et al.,2022).
Generally,the fracture model is assumed to be a smooth parallel-plate model,and the fluid flow rate has a linear relationship with the pressure drop,which is called the cubic law(Brown,1987;Olsson and Barton,2001;Brush and Thomson,2003).However,the cubic law is not always accurate in describing the flow characteristics in natural fractures due to the lack of consideration of surface roughness and contact conditions (Zhou et al.,2015;Rong et al.,2016).According to Zimmerman and Bodvarsson(1996),roughness and contact area induce inhomogeneous distribution of fracture aperture,which can cause flow path tortuosity,resulting in occurrence of nonlinear flow even when the value of Reynolds number(Re)is small.Hence,the validity of the cubic law has been challenged,and many scholars have studied nonlinear laminar flow behaviors in fractures(Javadi et al.,2010;Zhang and Nemcik,2013;Chen et al.,2015;Zou et al.,2015).The critical Reynolds number(Rec) is commonly defined to quantify the flow transition from linear to nonlinear.A wide range ofRec(0.001-2300) has been suggested for fluid flow in fractures (Wittke,1990;Zimmerman et al.,2004;Ranjith and Darlington,2007;Javadi et al.,2010;Chen et al.,2015;Rong et al.,2017).
Nonlinear flow is affected by many factors,such as normal stress (Zhang and Nemcik,2013;Xiong et al.,2018),roughness of fracture surface (Javadi et al.,2010;Wang et al.,2016),shear displacement (Javadi et al.,2014;Rong et al.,2016;Yin et al.,2017;Wang et al.,2020a),and fracture intersection (Kosakowski and Berkowitz,1999;Liu et al.,2016).Shear displacement is considered to be the most important factor because it can significantly alter the fracture’s contact condition,void space geometry,and thereby aperture distribution.Therefore,many efforts have recently been devoted to investigating the influence of shearing on the nonlinear flow behaviors of fractures,including experimental studies and numerical investigations.Javadi et al.(2014) conducted shear-flow tests to study the impact of shearing on nonlinear flow behavior of granite fractures.They found thatRecshowed a trend of increasing with shear displacement.Similar tendency were also observed by Rong et al.(2016) and Wang et al.(2020b).However,opposite results were obtained in the numerical tests.Zhou et al.(2018) established a series of two-dimensional (2D) sheared fracture models by solving the Navier-Stokes (NS) equations,and found that the shear process can enhance the flow nonlinearity.Due to the difficulty of 2D models in exploring the evolution of contact spots during shearing,the impact of shear on nonlinear flow in threedimensional (3D) fractures has been studied by Zou et al.(2017).It was found that shear-induced aperture and contact spot variations caused complicated channeling and eddy flow,resulting in a significant enhancement of nonlinearity.We speculated that the simulation results deviate from the experimental observations are primarily because the numerical models concerning the shearinduced evolutions of contact area and channelization characteristics lack support from experimental observations.
To better understand the fluid flow through fractures,visualization techniques have been employed in laboratory (Auradou,2009;Babadagli et al.,2015;Raimbay et al.,2017;Kim et al.,2018).Numerous researches focused on the influence of normal load on the path distribution of inhomogeneous flow and contact condition;however,the effects of shear stress and shear displacement received little attention.Recently,Li et al.(2019) proposed a visualization method to observe the evolution of the channelization of dyed water through rock fractures during shearing using a shear-flow-visualization apparatus.However,the impact of the fracture roughness on fluid flow behavior was not clearly presented.Furthermore,the shear-induced evolutions of the contact area and aperture field affecting the nonlinear flow have not been elucidated.Therefore,visualization techniques are especially needed to clarify whether the shear process affects the flow nonlinearity in fractures.
This paper aims to investigate the impacts of contact area,aperture induced by shear,and roughness of fracture surface,on the flow nonlinearity in fractal fractures.A series of shear-flowvisualization tests was performed on four granite fractures with an extensive range of joint roughness coefficient (JRC).The evolution of aperture,and contact areas of fracture during the shear process and its influences on nonlinear flow behaviors were discussed.
2.Specimen preparation and fracture surface characterization
2.1.Specimen preparation
Granite fractures were used to prepare transparent replicas.Four intact granite blocks (length × width × height=200 mm× 200 mm × 100 mm) were used to create artificial tensile fractures,and scanned by a 3D laser scanner(Fig.1).To direct observe the fluid flow behavior,acrylic material was used as the upper part of the specimen,and the plaster material was selected as the lower part.The process of the test sample preparation is shown in Fig.2.The lower part of the specimen was formed by mixing the plaster,water,and retardant at a mass ratio of 1:0.2:0.005.Then,a plaster replica was taken as the module to manufacture the transparent part.Referring to Li et al.(2019),the transparent specimen was manufactured by a mixture of the main acrylic and hardening agents at a mass ratio of 10:1,which has a fairly close value of unconfined compressive strength to that of the plaster specimen(38.5 MPa).
2.2.Fracture surface measurement
The surfaces were scanned by a 3D laser scanner and their topographical data were obtained(Li et al.,2008).In this study,the scanning interval in both thex-andy-axis was 0.5 mm.For each fracture surface,a scanning dataset consisting of 200 × 400 data points was obtained.The collected topographical data were stored and converted to point clouds,which were used to reconstruct digital rough fracture surfaces (Fig.1).
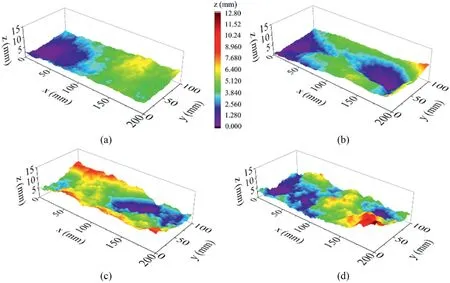
Fig.1.Digital fracture surfaces with different roughnesses: (a) Fracture G1,(b) Fracture G2,(c) Fracture G3,and (d) Fracture G4.
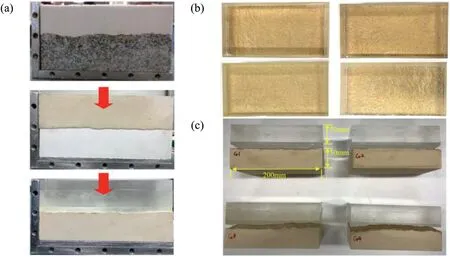
Fig.2.Fracture specimen preparation: (a) The manufacturing process of transparent specimen,and (b) Top and (c) Side views of the fracture specimens.
The roughness of fracture surface is considered as an essential parameter in qualifying the fluid flow through the fractures,especially when the nonlinear flow occurs due to the local changes in geometries along the flow channels that can induce nonnegligible inertial losses.According to the point clouds of rough joint surfaces,the roughness of the surfaces is described by the JRC proposed by Tse and Cruden (1979) as

whereZ2is the root mean square slope of the profiles,nis the number of data points along the length,ziis the asperity elevation at pointi,and Δxis the interval of the scanning point.Table 1 shows the calculated JRC of the four fracture surfaces,which are labeled G1,G2,G3 and G4.In addition,2D statistical parameters were introduced to determine the roughness of fracture surface,including the peak asperity heightRp,root mean square of roughnessRrmsand average roughnessRa.The calculation formulae(Chen et al.,2015;Zhou et al.,2015) can be written as
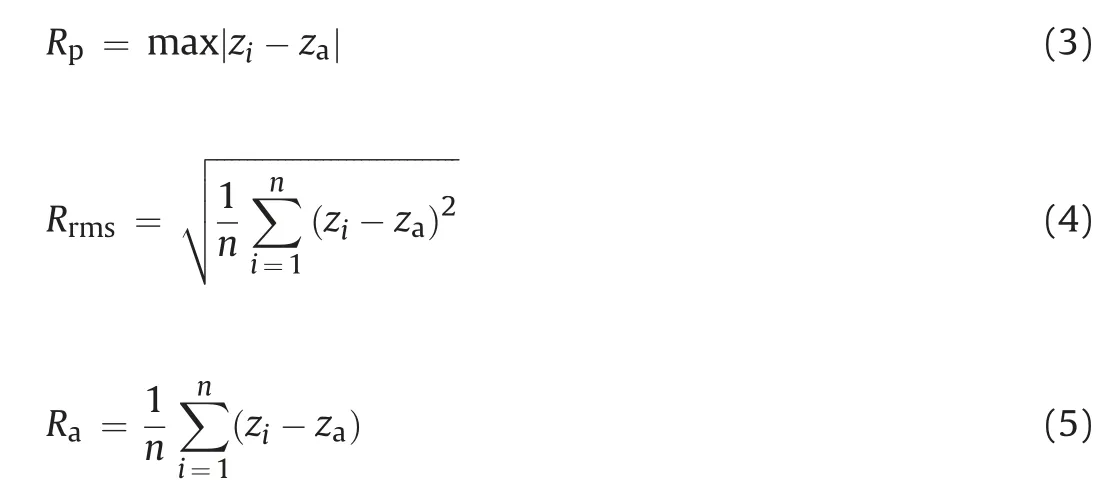
wherezais the height of the mean elevation plane.Table 1 shows the calculated statistical parameters.The obtained results show thatRpranges from 3.379 mm to 8.711 mm for all fracture surfaces,andRrmsandRaincrease with increasing JRC.
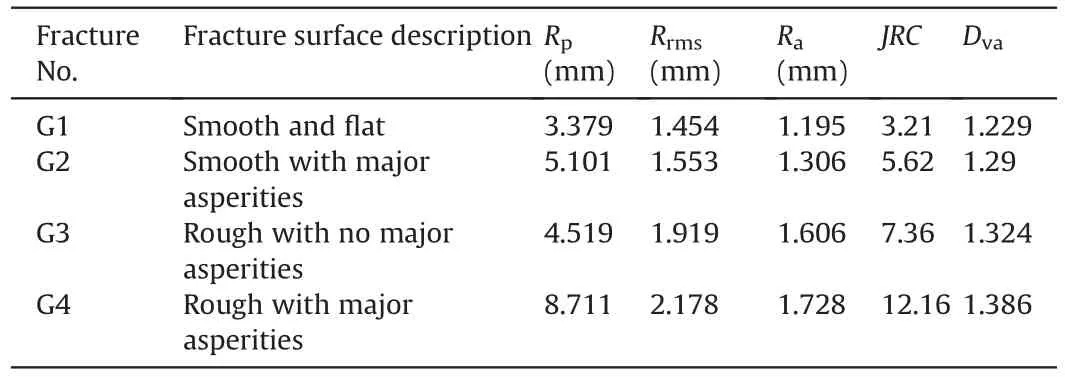
Table 1 Topographical parameters of rock fractures.
2.3.Determination of fractal dimension
Previous studies have shown that the fractal dimension is a suitable parameter for quantifying the roughness of rock surfaces(Mandelbrot and Wheeler,1983;Huang et al.,1992;Kulatilake et al.,2006;Babadagli et al.,2015;Li and Huang,2015).Mark and Aronson (1984) pointed out that the morphology of the fracture surface was self-affine,and the fractal dimension can be evaluated by the variogram analysis(VA).Many researchers have adopted the VA method to analyze the relationship between flow behavior and roughness of fracture surface.Raimbay et al.(2017) conducted visualization and hydraulic tests to evaluate the relation between the roughness and permeability.The results showed that the permeability was decreased with increasing variogram fractal dimension.Wang et al.(2016) and Xiong et al.(2018) used the variogram fractal dimension to quantify the roughness of fracture surface and found that a rougher fracture surface could significantly enhance complicated flow regimes,such as eddies and/or backflow.Therefore,in this study,we employed the VA method to investigate the fractal characteristics of rough fracture surfaces.
The variogram function (Mark and Aronson,1984;Develi and Babadagli,1998,2015) can be written as

where γ(h) is the variogram at lag distanceh,nis the number of pairs at a lag distance,andV(xi) is the sample value at locationxi.The fractal dimension is expressed from the slope of a log-log plot γ(h) andh,written as

where γ0is a proportionality constant,andHis defined as the Hurst exponent.The range ofHis 0-1.The fractal dimension of the fracture surface can be calculated byDva=2 -H.
We applied the VA method to calculating theHvalue of each profile (cutting line) in the shear direction (y-direction).A total of 200 profiles in they-direction extracted from each fracture surface were calculated,as shown in Fig.3.The range ofHvalue varies from 0.425 to 0.848,which is similar to that obtained by Boffa et al.(1998) and Develi and Babadagli (1998).The measuredDvaof G1,G2,G3 and G4 were 1.229,1.290,1.324 and 1.386,respectively(Table 1).A larger value ofDvameans a rougher surface of a fracture.

Table 2 Calculated results of a and b for different fractures during shear process.
3.Experimental methods
3.1.Experimental apparatus
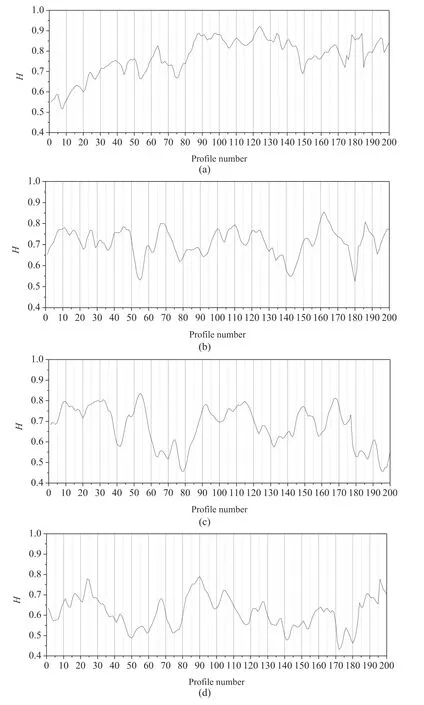
Fig.3.Hurst exponent (H) of the profiles in the four fractures: (a) Fracture G1,(b) Fracture G2,(c) Fracture G3,and (d) Fracture G4.
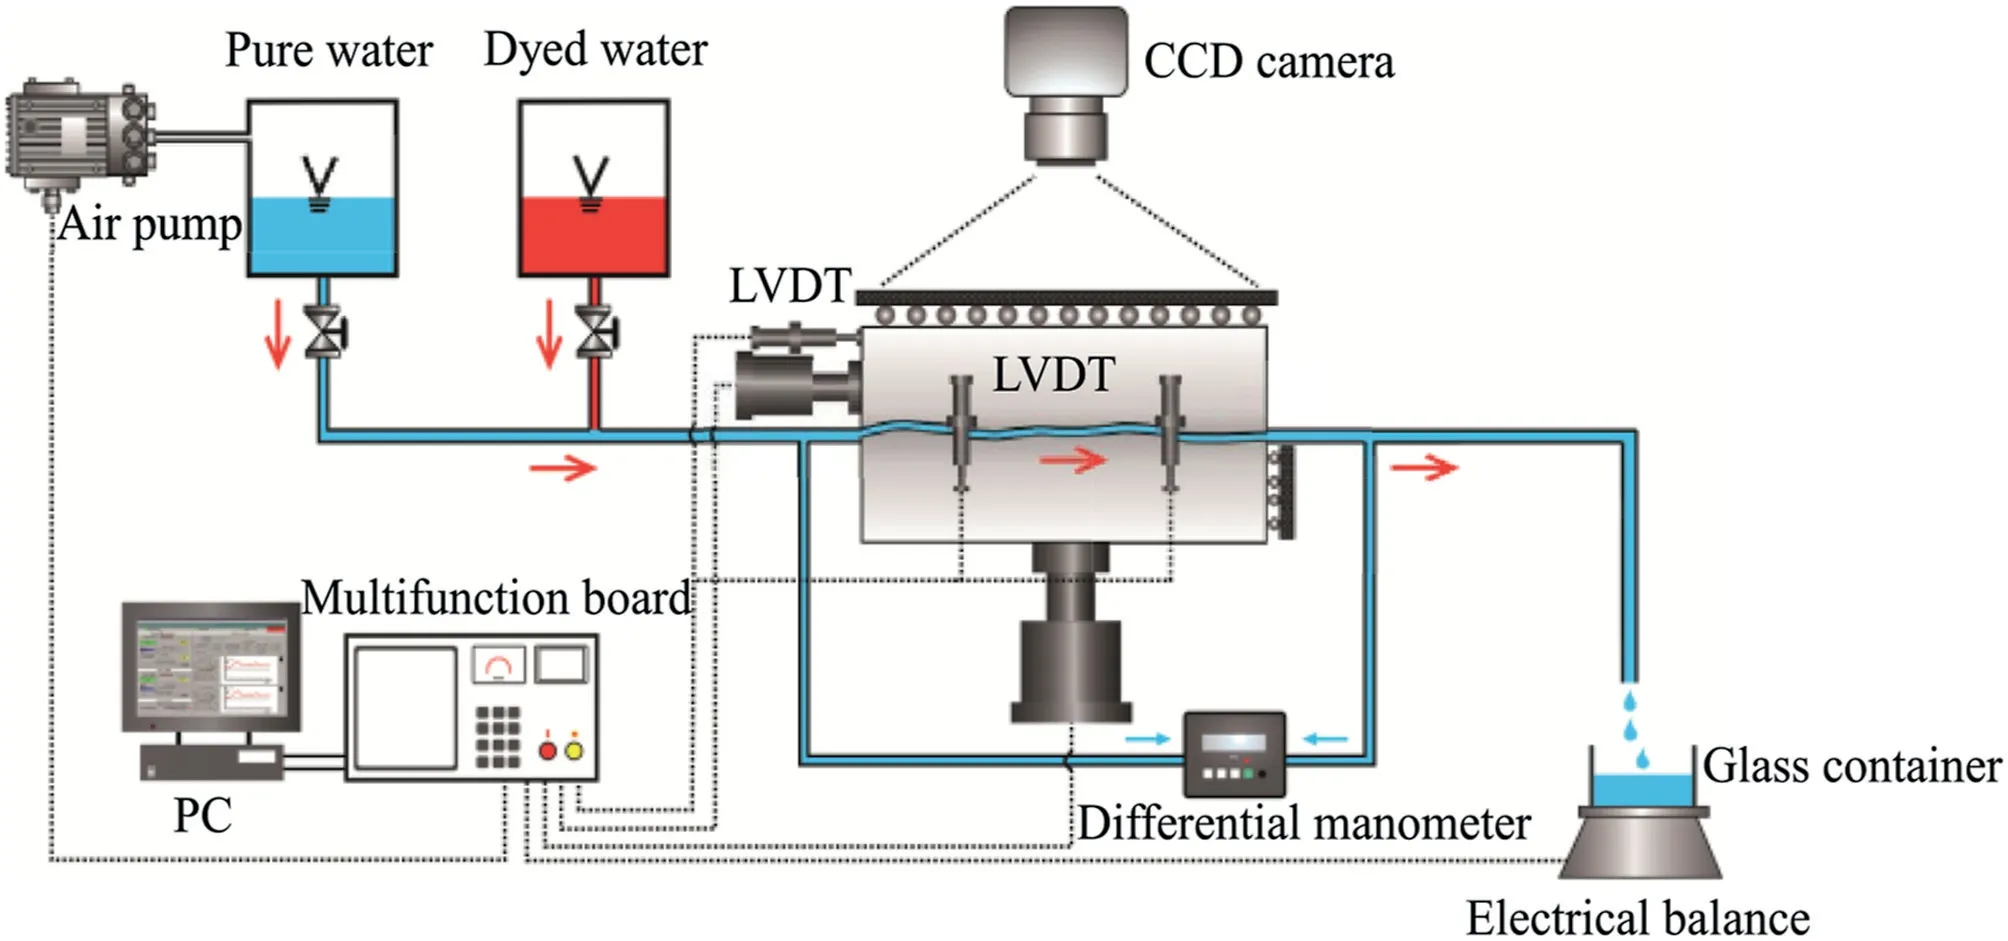
Fig.4.Schematic diagram of the experimental apparatus.CCD is short for the charge-coupled device.LVDT is short for the linear variable differential transformer.PC means the personal computer.
To perform the visualized shear-flow test,a laboratory shearflow-visualization apparatus at Nagasaki University was adopted(Fig.4).The apparatus consists of a shear-flow box,control and data acquisition system,and vertical and horizontal actuators,which are servo-controlled to apply normal and shear forces with a capacity of 200 kN.The constant inlet water pressure through the rock fracture was supplied by an air pump.The pressure drop was monitored using a differential pressure transducer (model PD-100GA) at a precision of 0.01 kPa.Two sides of boundaries were sealed using pressured soft and elastic gel sheets.For visualization purpose,a window was slotted at the top of the specimen,and a camera was set above to observe the details of fluid flow.
3.2.Experimental procedure
The transparent specimen was placed in the shear-flow-box prior to the tests,and then a constant normal stress of 0.5 MPa was applied to the box through a vertical actuator.The lower box was kept stationary during shearing,while the upper box was sheared up to 10 mm at a rate of 0.5 mm/min.The fluid flow and visualization tests were performed at various shear displacements(d) of 1 mm,3 mm,5 mm,7 mm and 10 mm.Before shearing,a given water pressure was first applied to the inlet of the specimen,and the pressure was maintained for 600 s to ensure that the plaster was absorbed and saturated by water.At eachd,7-10 flow tests with constant water pressures were carried out.The water flowing from the outlet was collected through glassware,and the variation in weight was recorded by an electrical balance with an accuracy of 0.01 g.During each flow test,the constant water pressure was maintained for 200 s to ensure a constant flow rate.After hydraulic tests,visualization tests were conducted at eachdunder a constant water head (10 cm).To facilitate visualization,we used dyed water to enhance the visibility of the flow paths.The dyed water can be discharged from the fracture by pure water.A high-resolution CCD camera was employed to record the fluid flow images in real time at a rate of one image per second,and recording continued until the pressure drop reached a stable value.This means that the fracture was fully filled with red-dyed water.
4.Results and discussion
4.1.Shear behaviors
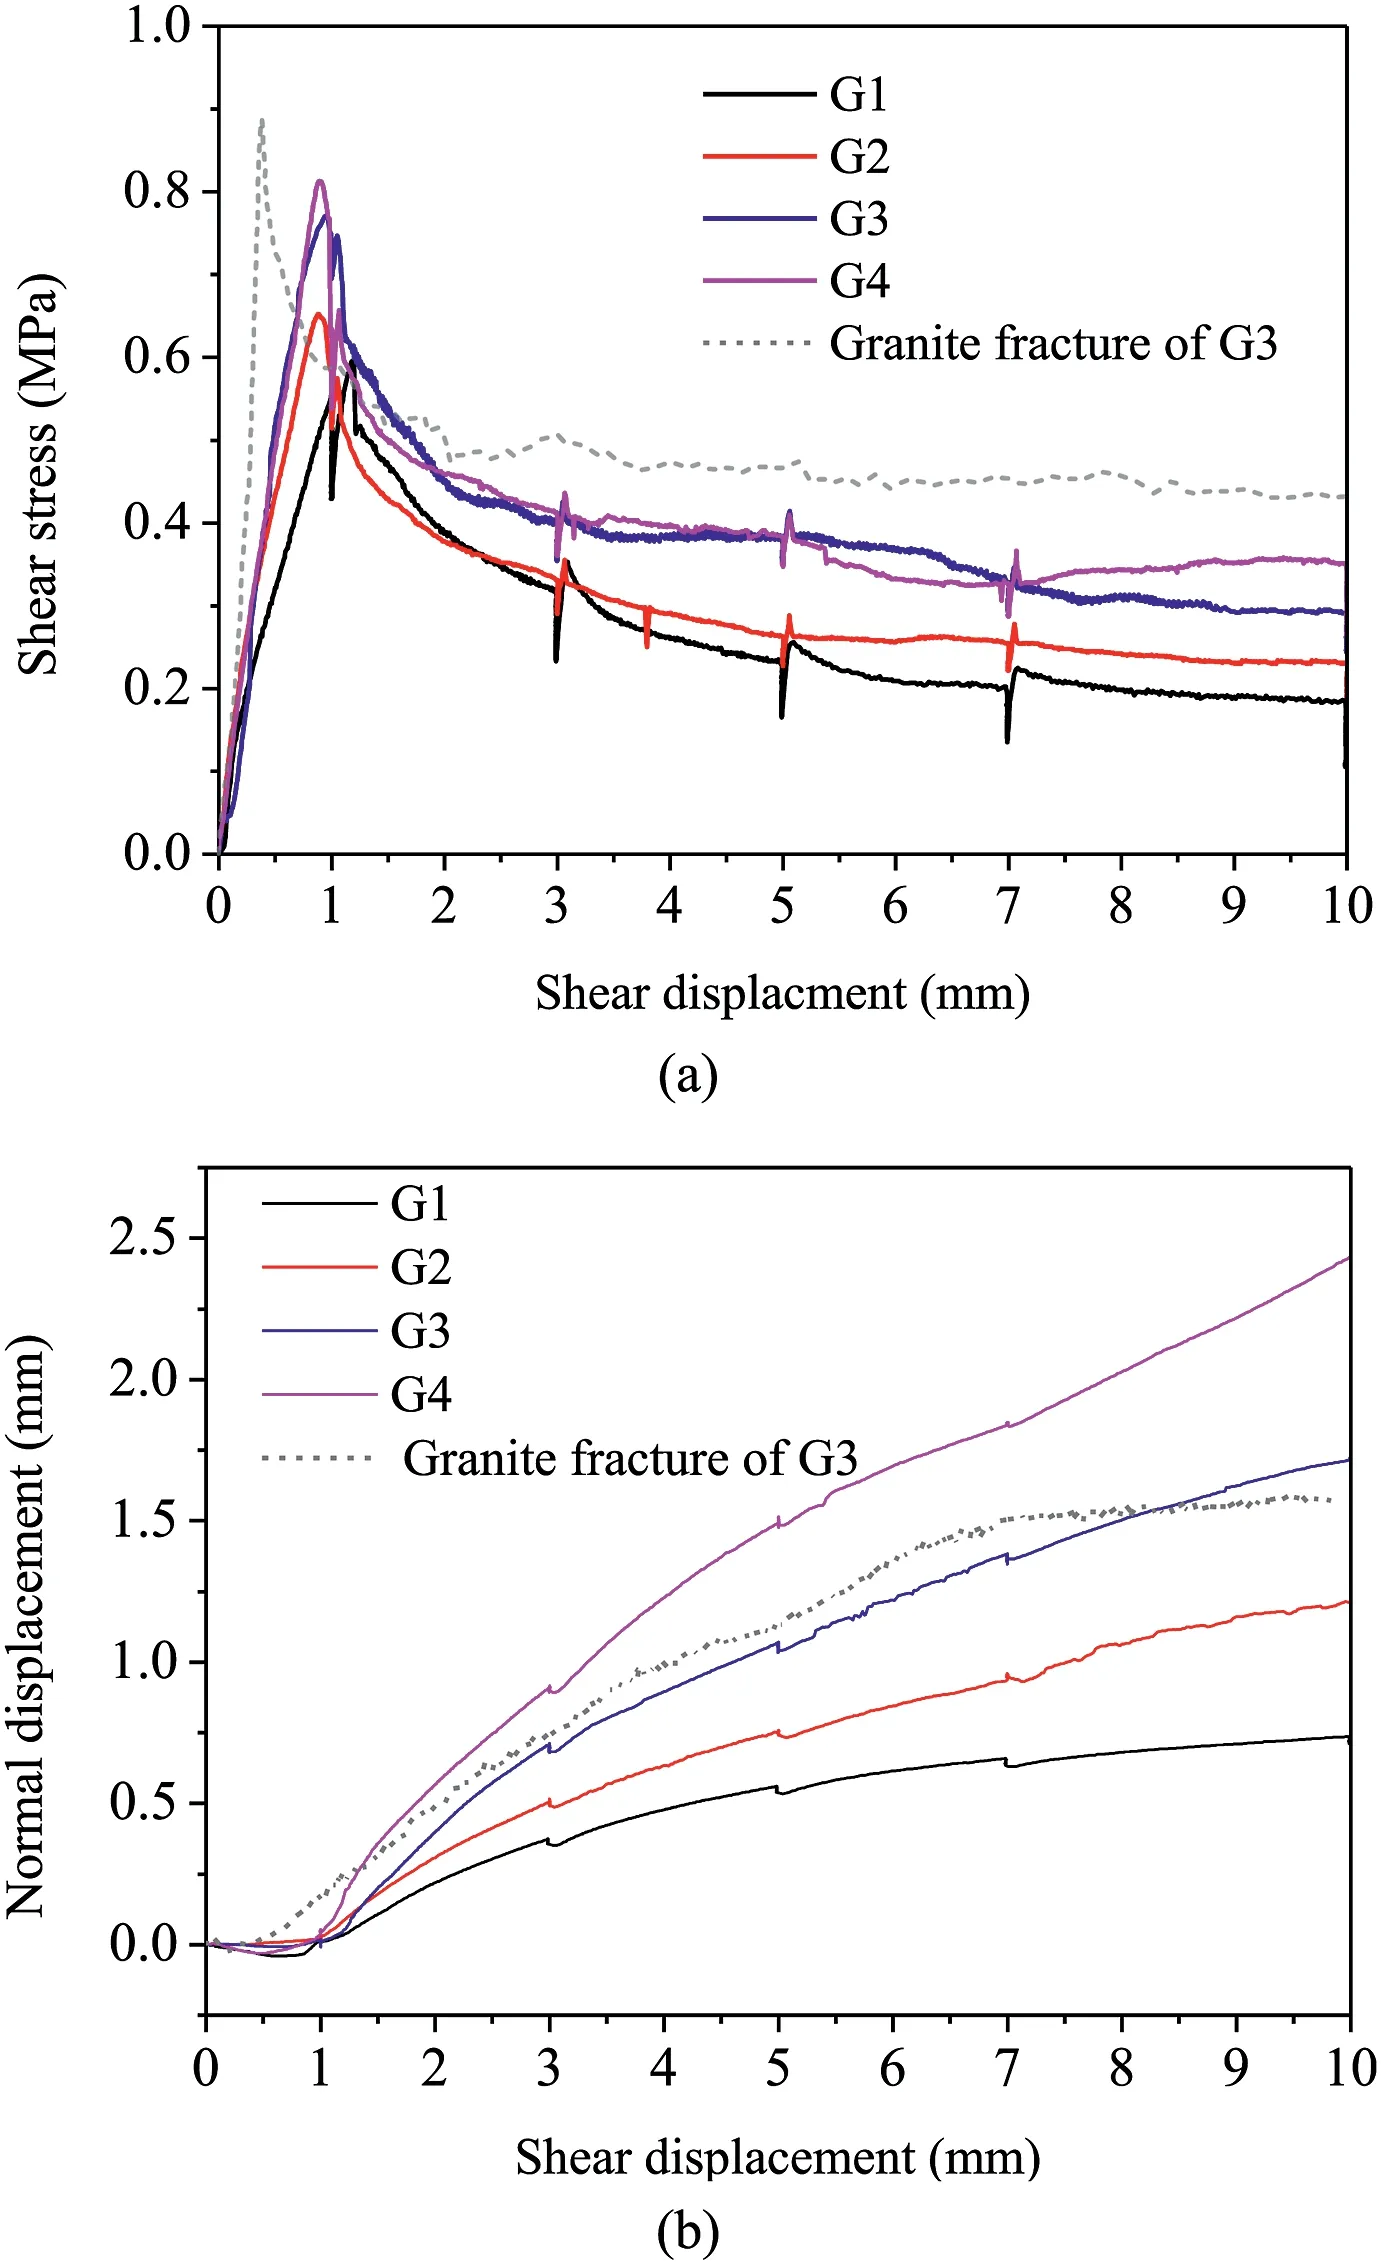
Fig.5.Mechanical behaviors of fractures in shear-flow tests: (a) Evolution of shear stress with the shear displacement,and(b)Evolution of normal displacement with the shear displacement.
The comparison tests of shear behaviors between the transparent specimen and granite specimen of Fracture G3 were conducted under a normal stress of 0.5 MPa,as shown in Fig.5.Both cases of shear stress experience a quick rise until the peak,after which stress softening occurs and the stress gradually decreases to an asymptotic value.Compared with the full-granite fracture,the peak shear stress of the transparent fracture is lower,but the peak shear displacement is greater.This difference occurs because the granite is a brittle material,and the strength of granite is larger than that of acrylic and plaster.Despite these differences,the dilation of the transparent specimen was observed to be fairly close to that of the granite fracture because no distinct gouge materials are generated during shearing under lower normal stress conditions.Because the visualization test mainly focuses on the observation of the channelization characteristics of fractures during shearing,which are mainly controlled by the shear dilation-induced aperture variation,the transparent specimen is considered an acceptable specimen for investigating the fluid flow behaviors of fractures.
The variations in shear stress during shear tests for the four fracture specimens G1,G2,G3 and G4 are shown in Fig.5a.For all cases,the shear strength abruptly increases to the peak at the initial shear stage.The peak shear stresses for G1,G2,G3 and G4 are 0.554 MPa,0.652 MPa,0.771 MPa and 0.813 MPa,respectively,and the corresponding peak shear displacementdpranges from 0.813 mm to 1.003 mm.Then,the shear strength reduction occurs,and the stress gradually decreases to an asymptotic value,which represents residual shear strength at the steady shearing stage.The residual shear stresses are 0.184 MPa,0.244 MPa,0.292 MPa and 0.351 MPa,respectively.Moreover,there is an obvious influence of roughness on the shear behaviors,where rougher fractures exhibit higher values of peak and residual shear stresses.This is because the rougher fractures exhibit largerhigh-orderasperities,and alarger shear stressis neededto shear the specimen,resulting in larger peak and residual shear stresses.
The variations in the normal displacement with different fractures are plotted in Fig.5b.The normal displacement during shearing exhibits nonlinear descending-ascending behavior.The normal displacement slightly decreases at first due to the asperity and surface interlocking,after which dilation occurs and the deformation gradually increases.The ultimate normal displacement(corresponding todof 10 mm),du,ranges from 0.735 mm to 2.426 mm,and the rougher fractures display a larger value ofdu.
4.2.Nonlinear flow behavior

For viscous flow,the cubic law is applicable to describing the laminar flow in fractures(Konzuk and Kueper,2004;Tzelepis et al.,2015),written as whereQis the flow rate,which is obtained by calculating the weight of water per unit time;wis the fracture width;ehis the hydraulic aperture;ΔPis the pressure drop in the flow direction;μ is the viscosity of the fluid;andLis the fracture length.Note the pressure gradient (∇P) is defined as ∇P=ΔP/L.
By increasingQ,the flow behavior deviating from the linear flow regime can be observed.Forchheimer’s law is commonly employed to describe nonlinear flow behavior in rock fractures(Zimmerman et al.,2004;Zhang and Nemcik,2013),which can be written as

whereaandbare the linear and nonlinear coefficients,respectively;and α represents the non-Darcy coefficient.
Zeng and Grigg (2006) introduced the coefficientEto describe the flow regime transition,written as

Zeng and Grigg (2006) suggested that the onset of nonlinear flow behavior occurs whenE=0.1.The corresponding Reynolds number (Re) is the critical Reynolds number (Rec),written as

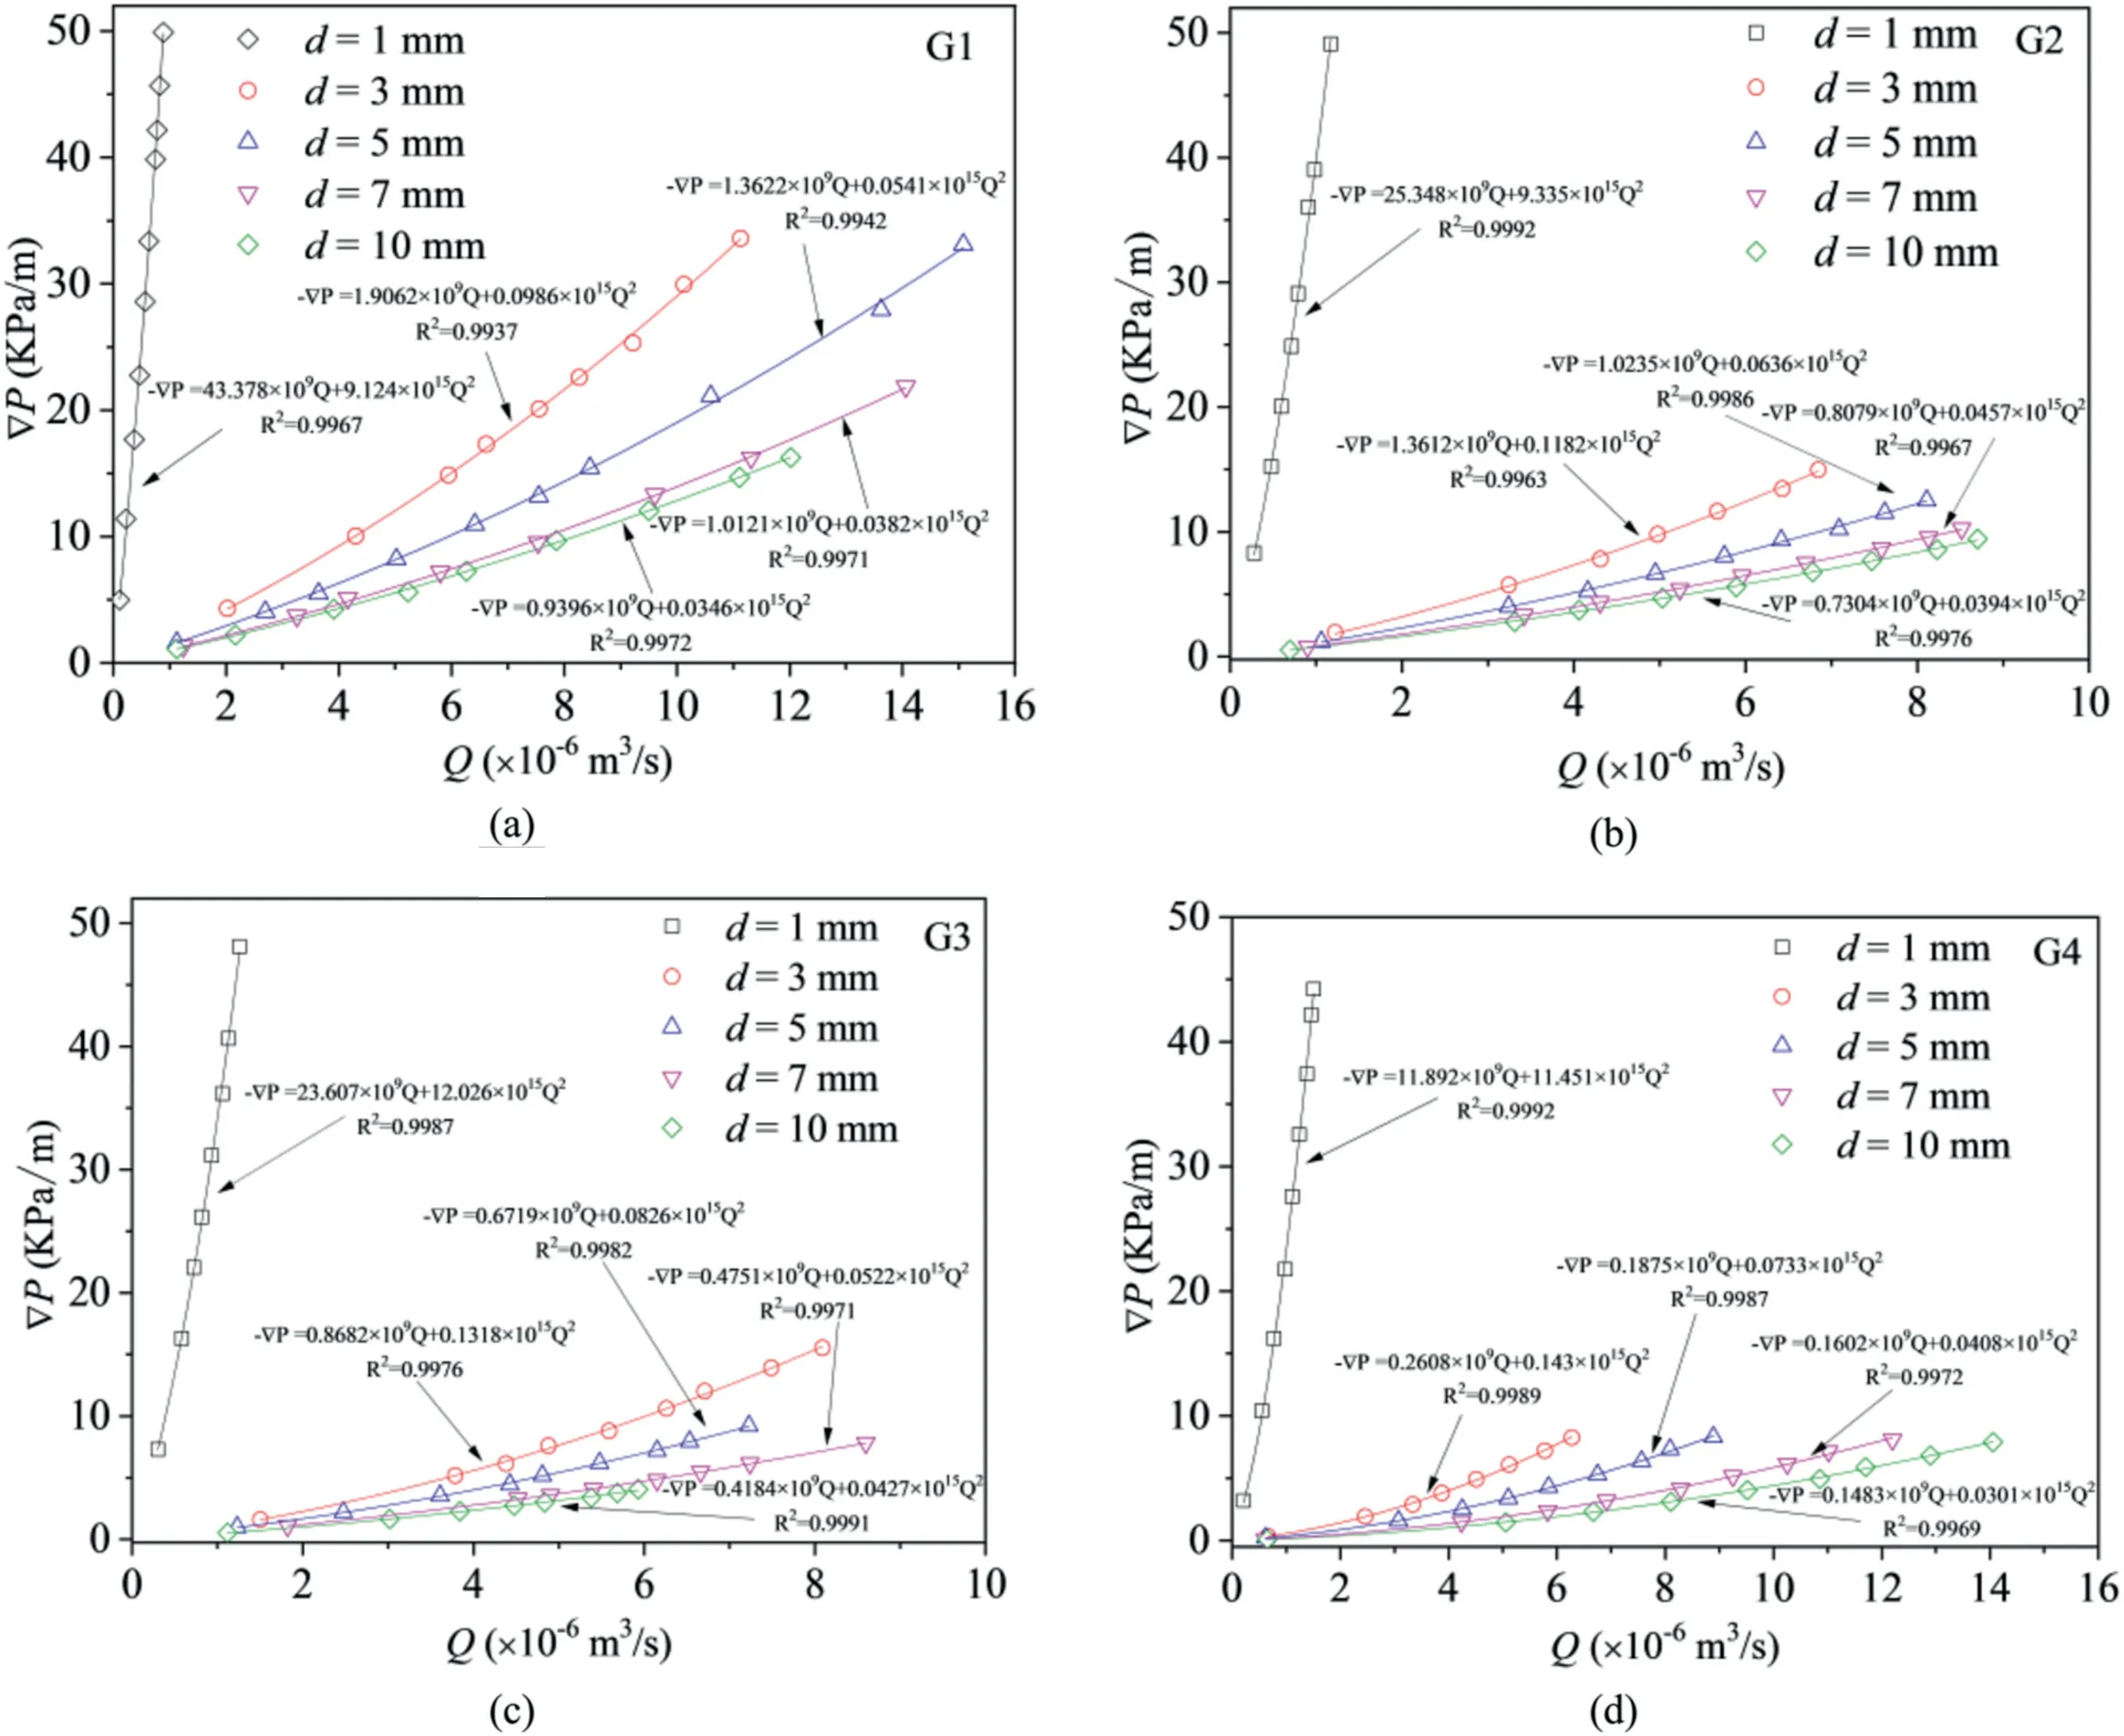
Fig.6.Regression analysis of pressure drop as a function of measured flow rate using Forchheimer’s law for different fractures:(a)Fracture G1,(b)Fracture G2,(c)Fracture G3,and(d) Fracture G4.
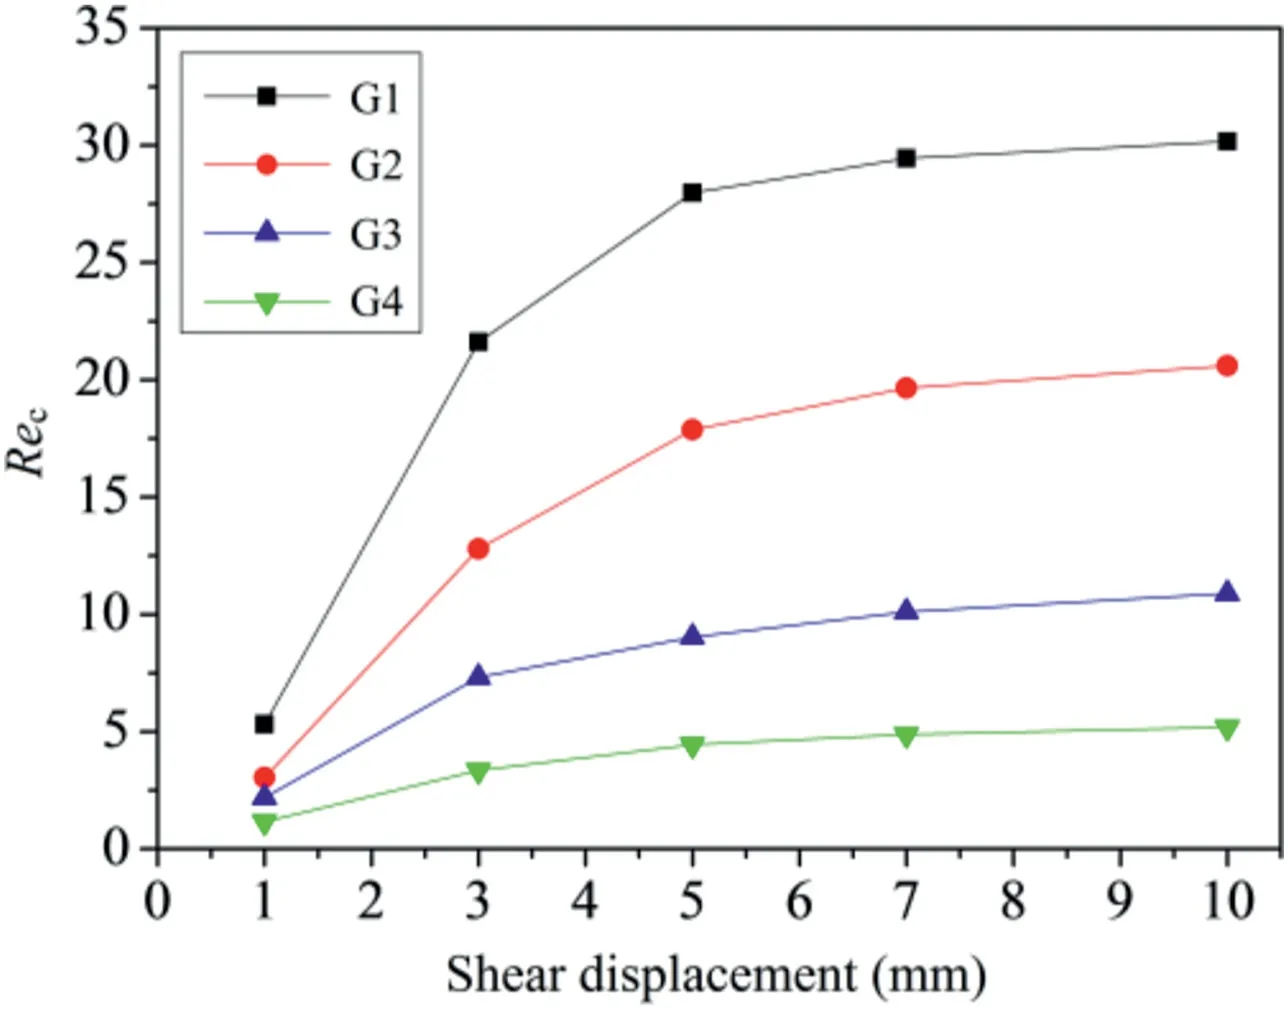
Fig.7.Evolutions in critical Reynolds number versus shear displacement.

Because the fracture was well-matched at the initial shear,the applied water pressure was so small that no water was measured at the shear contraction stage.Therefore,the flow tests were conducted at a shear displacement of 1 mm,where shear dilation occurs.Fig.6 shows the relationships between ∇PandQfor various fractures under different values ofd.The ∇P-Qcurves show clear nonlinear characteristics.It is clear that the experimental data can be well fitted by the quadratic polynomial regression of the Forchheimer’s law.The shear displacement markedly alters the slope of the curves of the four fractures.When the shear advances,the∇P-Qcurve’s slope becomes flatter due to shear dilation.Based on Eq.(9),bothaandbfor all cases were calculated,as summarized in Table 2.Bothaandbdecrease with increasing shear displacement.
Based on Eq.(13),Recwas calculated.The variations inRecduring shear processes for the four fractures are shown in Fig.7.The results show that asdincreases,Recincreases and exhibits two different stages for all test cases.Recsignificantly increases asdincreases to 3 mm and then gradually increases until reaching a constant value asdexceeds 5 mm.It was also found that the ranges ofRecare different for the four fractures.The range ofRecis 3.35-30.17 for Fracture G1,1.95-20.6 for Fracture G2,1.57-10.89 for Fracture G3,and 1.15-5.19 for Fracture G4.The rougher fracture surface exhibits a lower value ofRec.The results of theRec-dcurves are similar to the findings of Javadi et al.(2014).
4.3.Visualization
Figs.8-11 display the images of fluid flow evolution in fractures under various shear displacements.It was observed that there is a larger number of connected flow paths at the initial shearing (i.e.d=1 mm).The velocity of dyed water flow over the whole fracture was low,requiring 115 s to fill the void space.The flow resistance is larger at the initial shearing because the two fracture surfaces were slightly mismatched,forming a closed fracture aperture with more contact spots.Asdadvances,channeling was more distinctly observed.The numbers of flow paths and contact spots decrease due to the shear dilation,and the contact is focused at much fewer locations of larger areas.The velocity of dyed water that fills the aperture is high for a larger value ofddue to the reduction of flow resistance caused by shear dilation.Under the same shear displacement,the number of preferential flow paths was larger for a fracture with a smaller value of JRC.This phenomenon is attributed to the contacts mainly focusing on major asperities for rougher fractures.In addition,the effects of the morphological behaviors of fractures on the flow patterns are shown in Figs.8-11.Because the surface of Fracture G1 is smooth and flat,the number of contact spots is relatively large,and the contact areas are in the form of“islet”(Fig.8).Similar patterns were also observed for Fracture G3.This occurred because Fracture G3 is rough with no major asperities but has many similar asperities.For Fractures G2 and G4,the existence of major asperities tends to climb each other during shear process.This significantly decreases the contact area,and the contact areas are focused at fewer locations of main height asperities.
4.4.Evolution of the aperture and contact ratio
Based on the fracture surface scanning data,the mechanical aperture of fracture,em,can be obtained from(Li et al.,2008):

wheree0represents the initial mechanical aperture,Δbnis the change in aperture induced by normal loading and Δdis the change in aperture due to shearing.Δbnis equal to zero under constant normal load conditions.Δdis the variation in the normal displacement.
Based on Eqs.(8) and (14),ehandemat different shear displacements were calculated.Note that the fractures were perfectly mated,forming a tightly closed fracture,and no water was detected for all fractures before shearing.Therefore,e0was assumed to equal zero,and the contact area ratio was assumed to approach 1(Li et al.,2008).Because the tested specimens have fracture surfaces with different roughnesses,variation in the frequency of the mechanical aperture distributions under different values ofdcan be obtained,as shown in Fig.12.According to Huang et al.(2017),negative values of aperture indicate shear-induced contacts.Theemdistributions of the four fractures at different values ofdfollow Gauss distributions.As the value ofdincreases,the maximum frequency ofemdecreases,while the mean aperture tends to increase.This occurs because shear dilation causes variations in the fracture geometry and an increase in the fracture distribution.A wider range of the aperture distribution was observed for the relatively rough fracture,indicating that shear-induced fracture aperture distributions become more anisotropic and heterogeneous for rougher fractures.For example,for Fracture G2,which has the roughest surface,the aperture distribution is in the range of 0-5.95 mm atd=10 mm,while for Fracture G1,which has the smoothest surface,the aperture distribution is in the range of 0-2.55 mm atd=10 mm.Fig.13 shows the variations inem,ehandCof Fractures G1-G4 under different values ofd.The contact area ratio (C) was measured by the image binary method (Develi and Babadagli,2015),which is defined by calculating the ratio of contact area to the total area.For all tests,bothehandemsignificantly increase whendincreases from 1 mm to 3 mm due to the rapid growth of shear dilation at this stage.Then,various apertures become steadier for a larger shear displacement due to the gradual reduction of shear dilation.However,the various trends ofCare inverse to the change in aperture.The shear dilation-inducedCrapidly decreases in the shear displacement range of 1-3 mm and remains at a constant value.It was also observed that the value ofemis larger than that ofeh,and the difference betweenemandehbecomes larger with increasing shear displacement.Additionally,a larger deviation betweenemandehwas observed for rougher fractures due to the stronger nonlinear flow for rougher fractures.
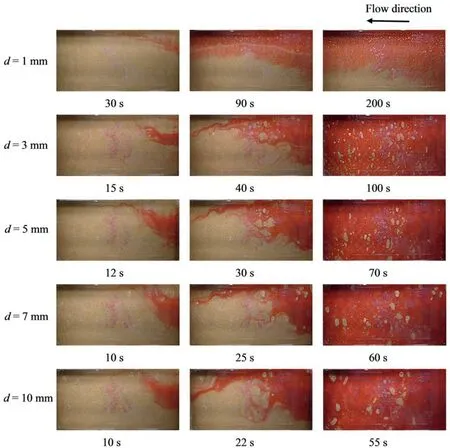
Fig.8.Evolution of the dyed water flow in Fracture G1 at various shear displacements.
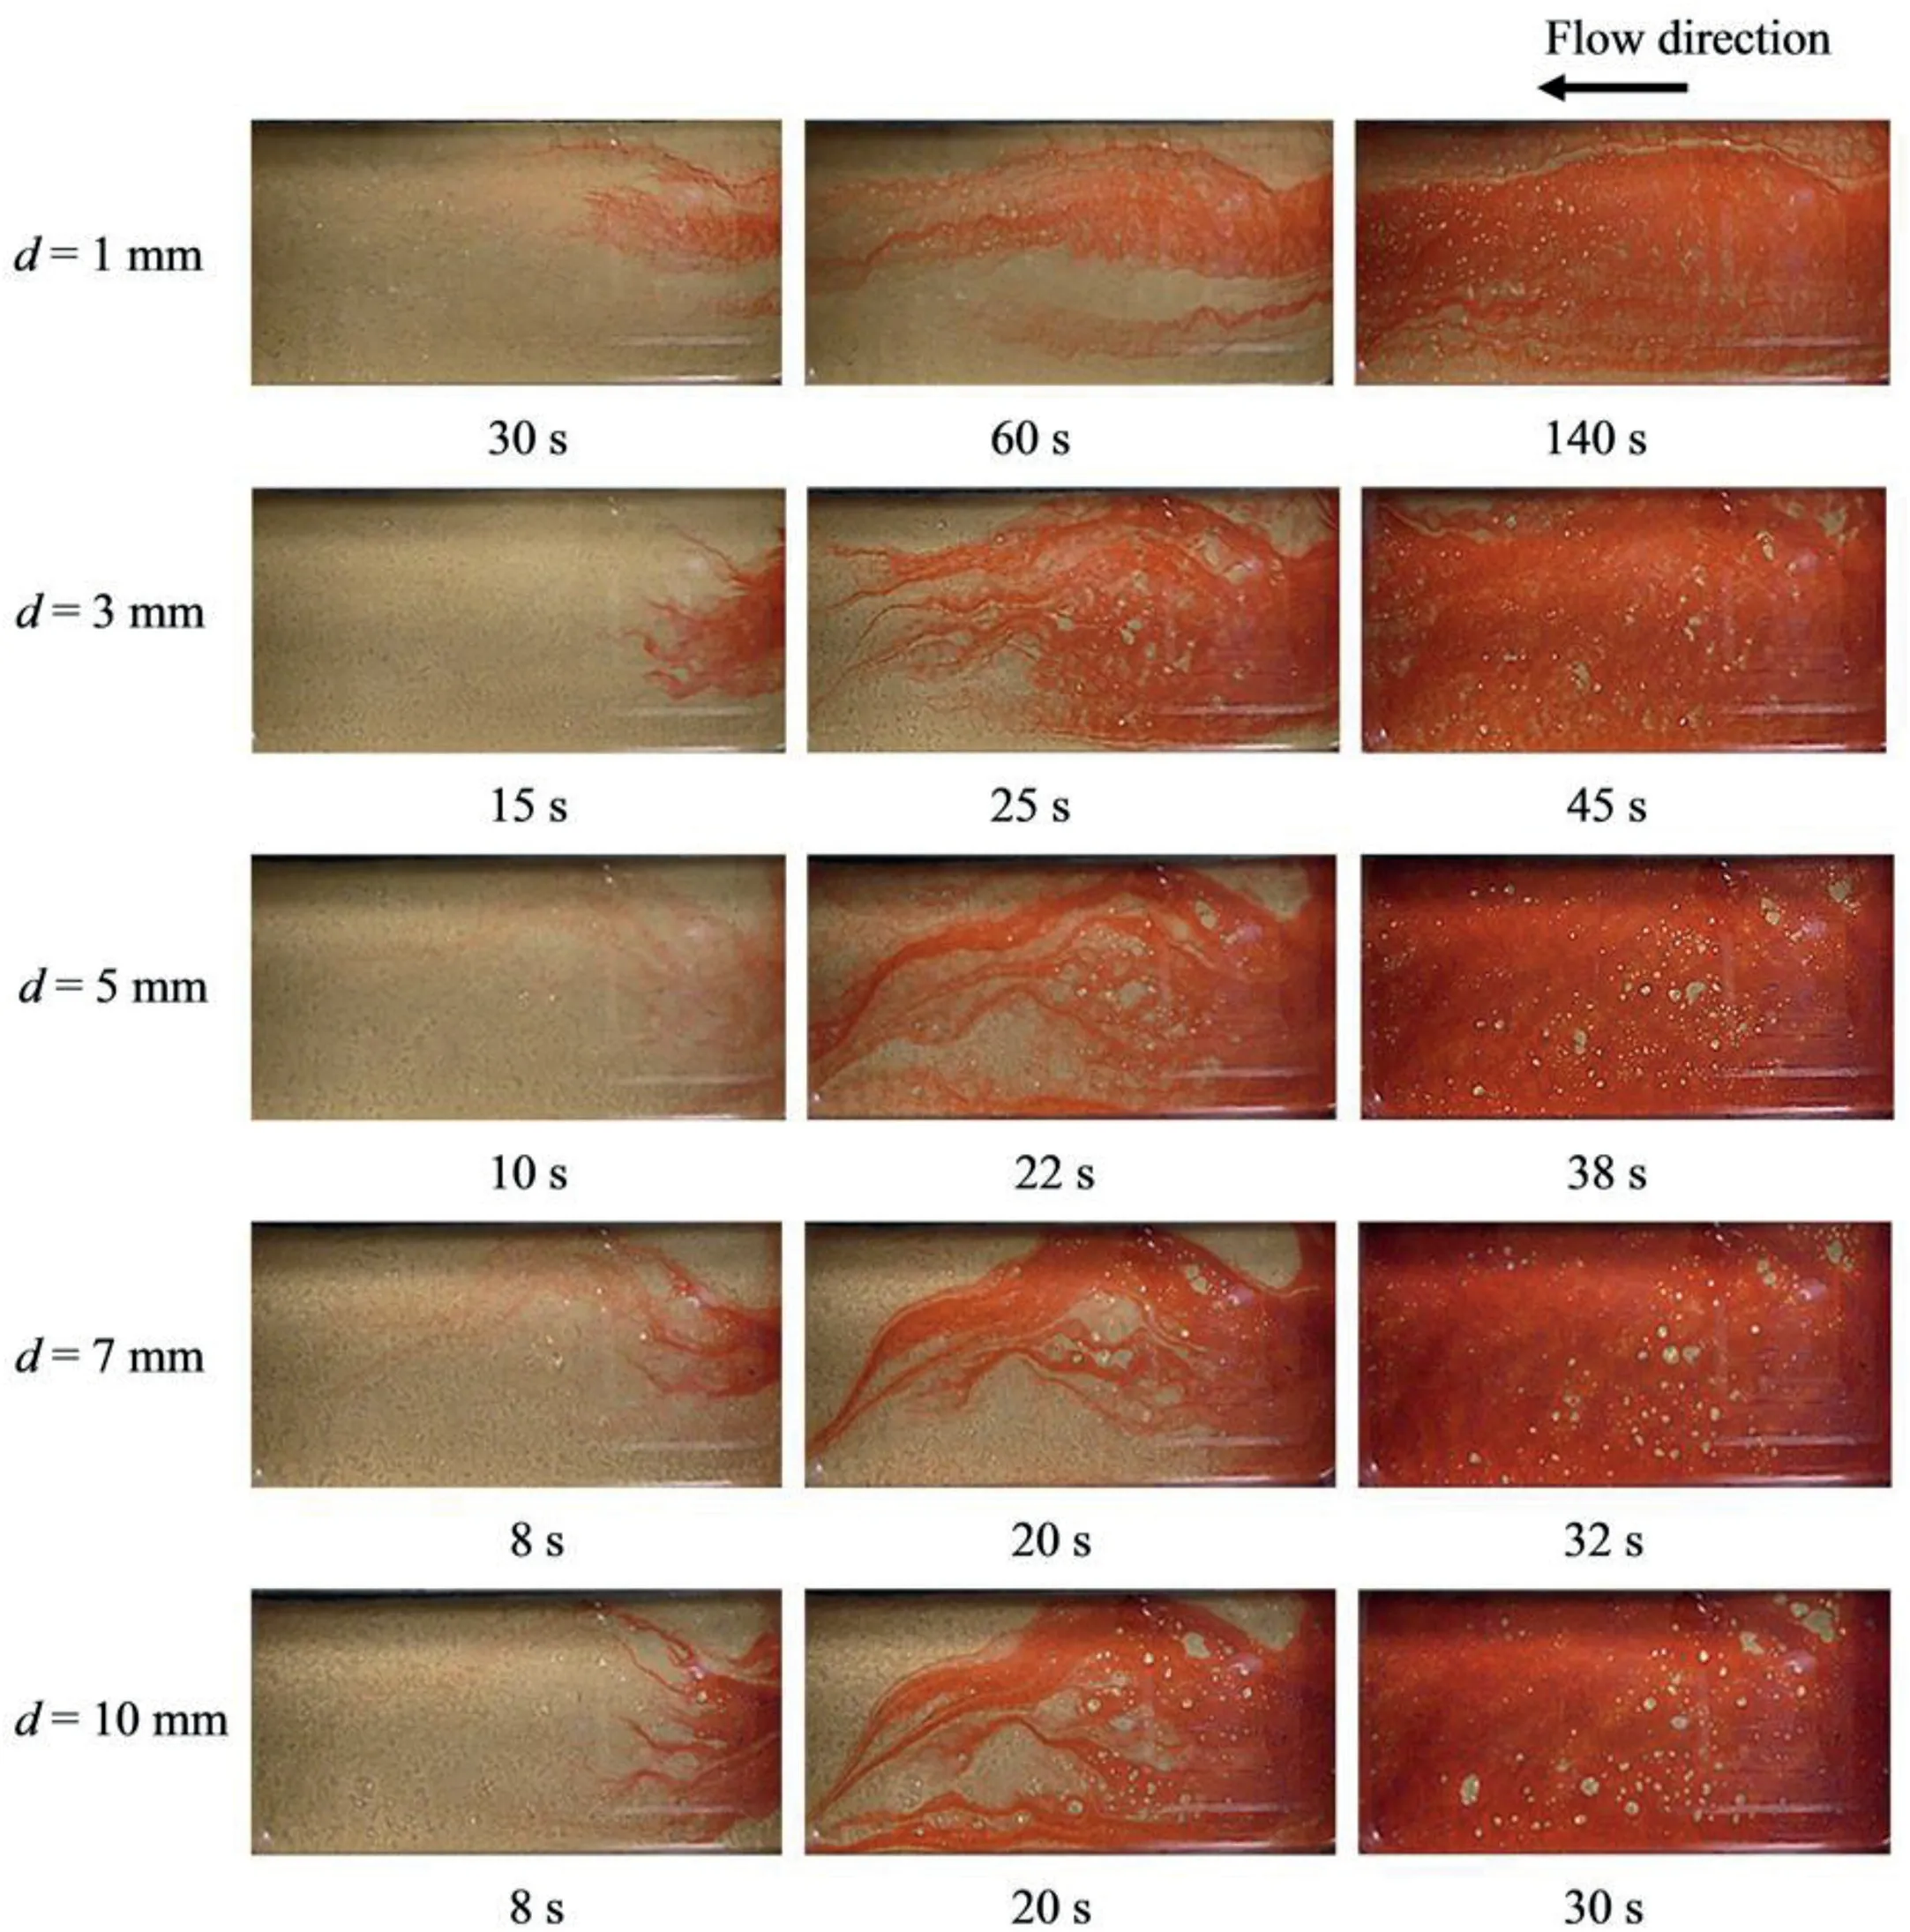
Fig.9.Evolution of the dyed water flow in Fracture G2 at various shear displacements.
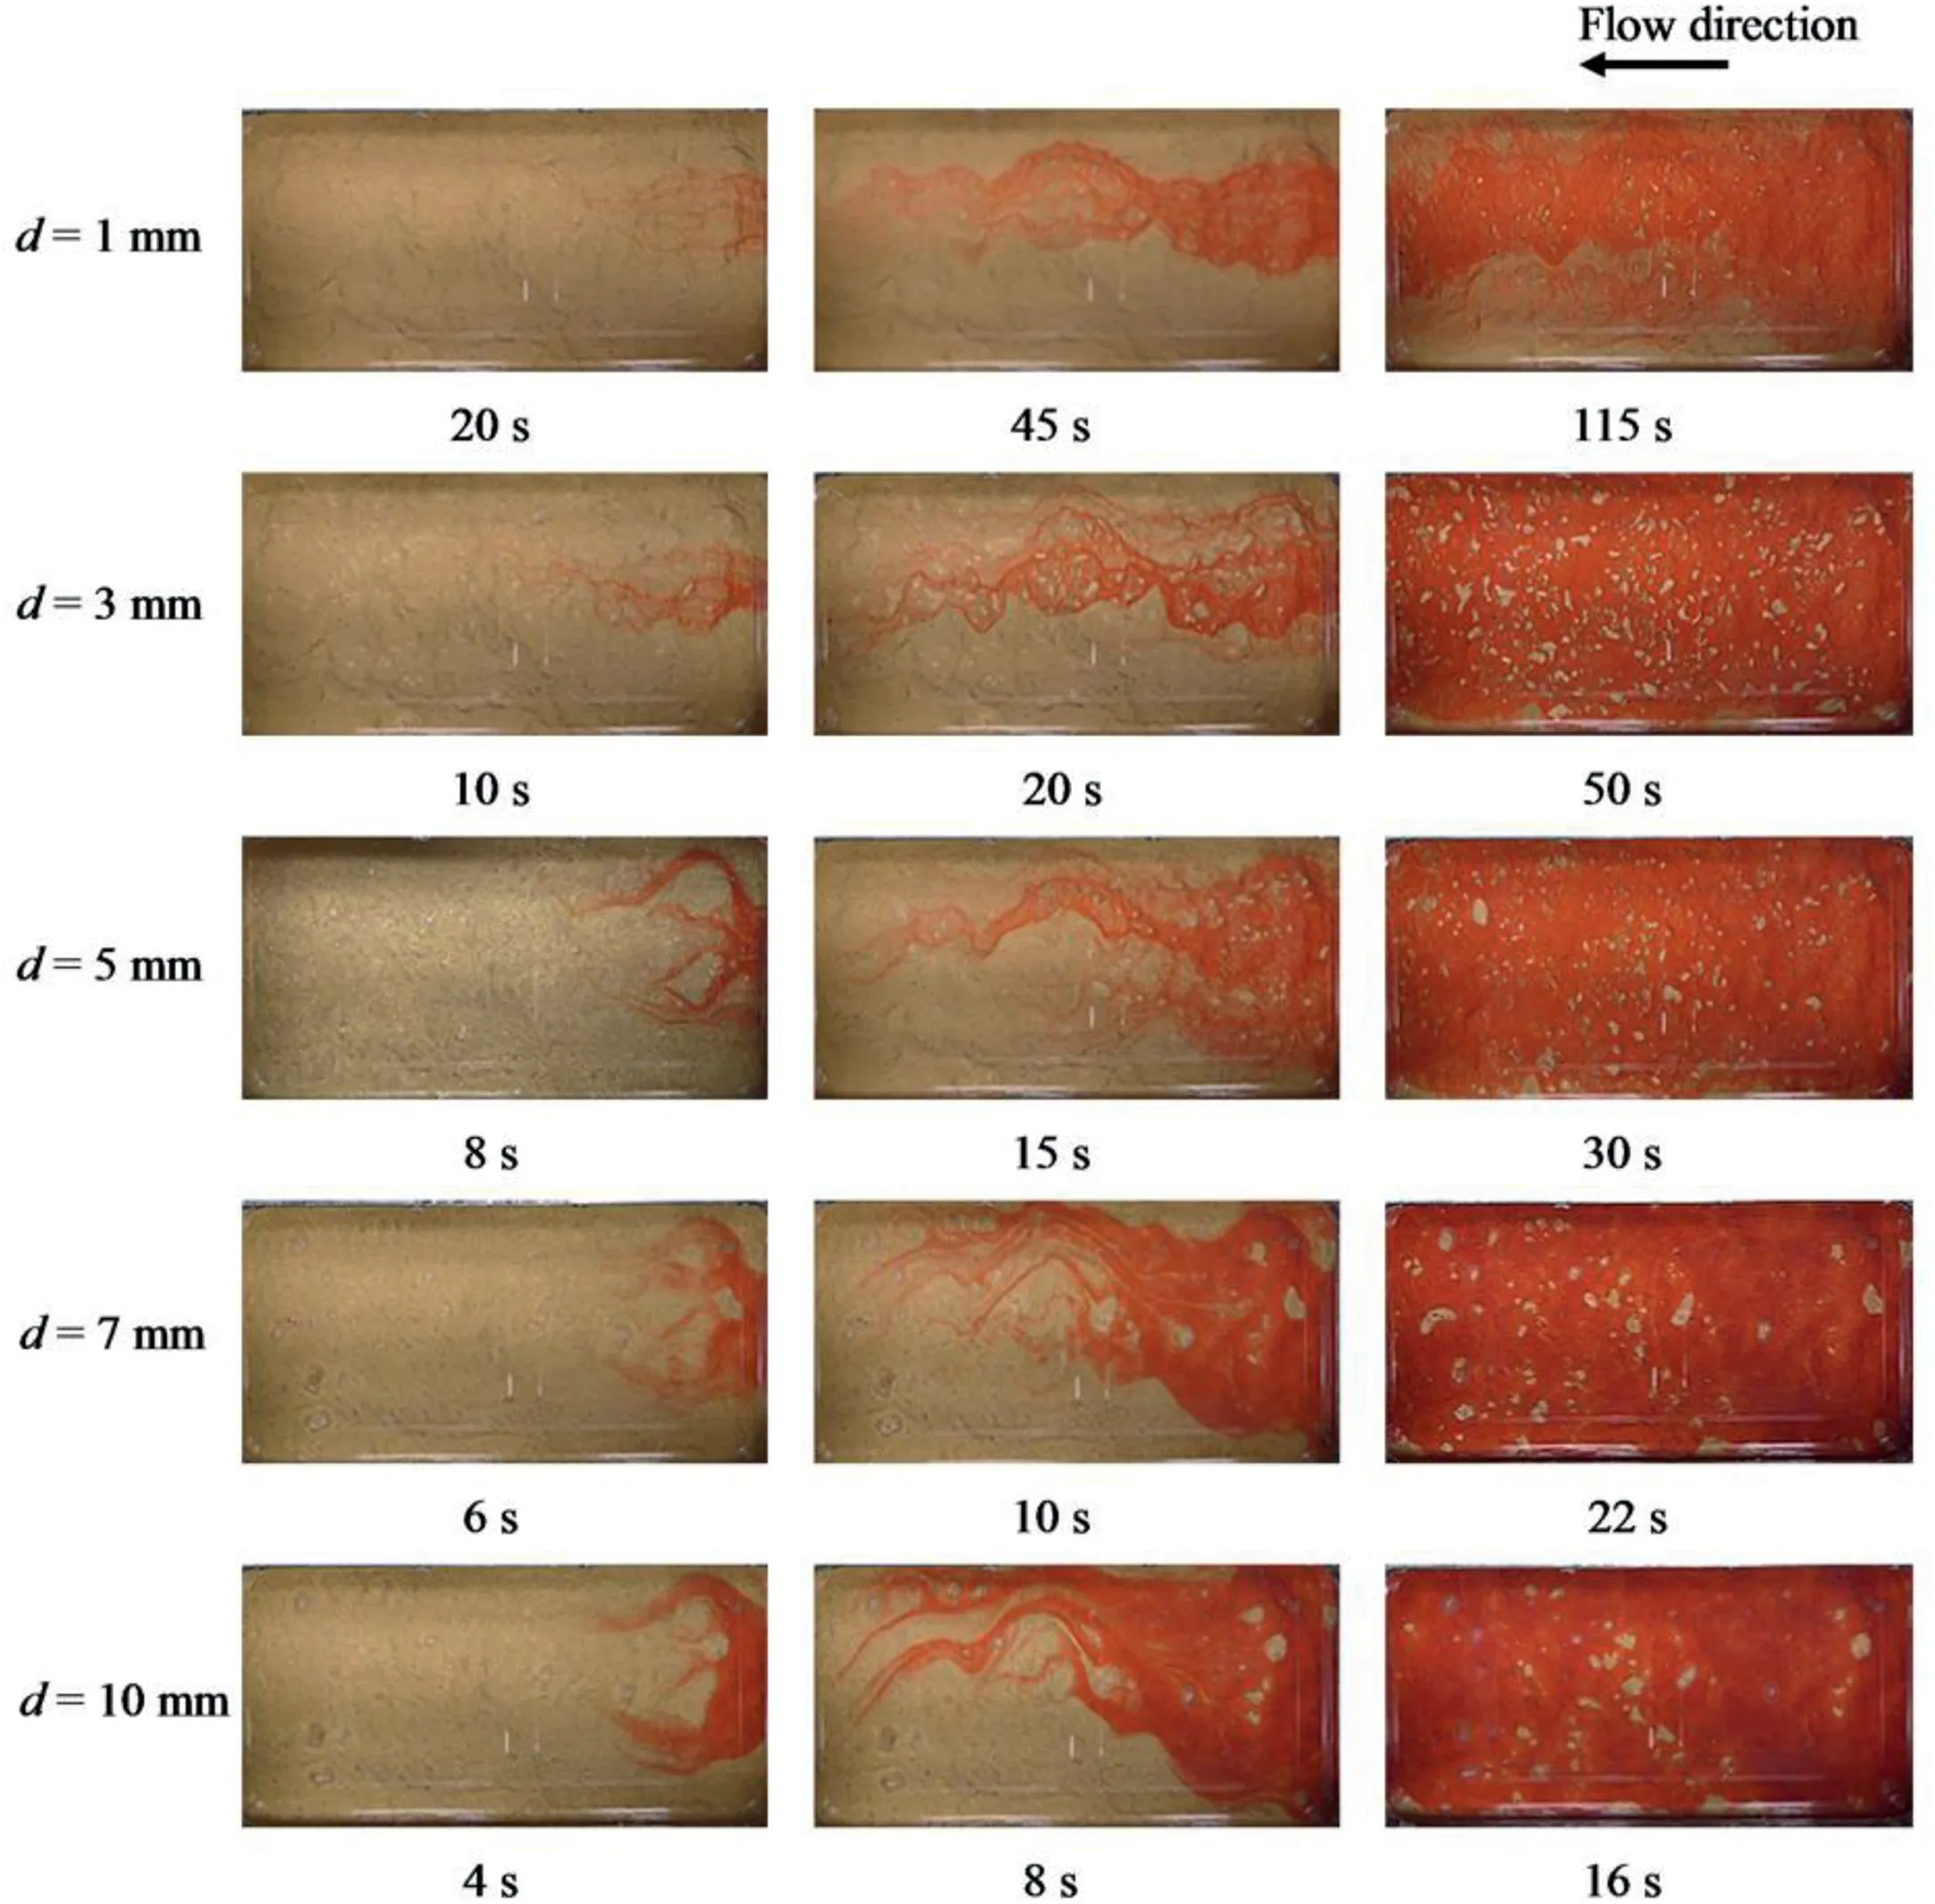
Fig.10.Evolution of the dyed water flow in Fracture G3 at various shear displacements.
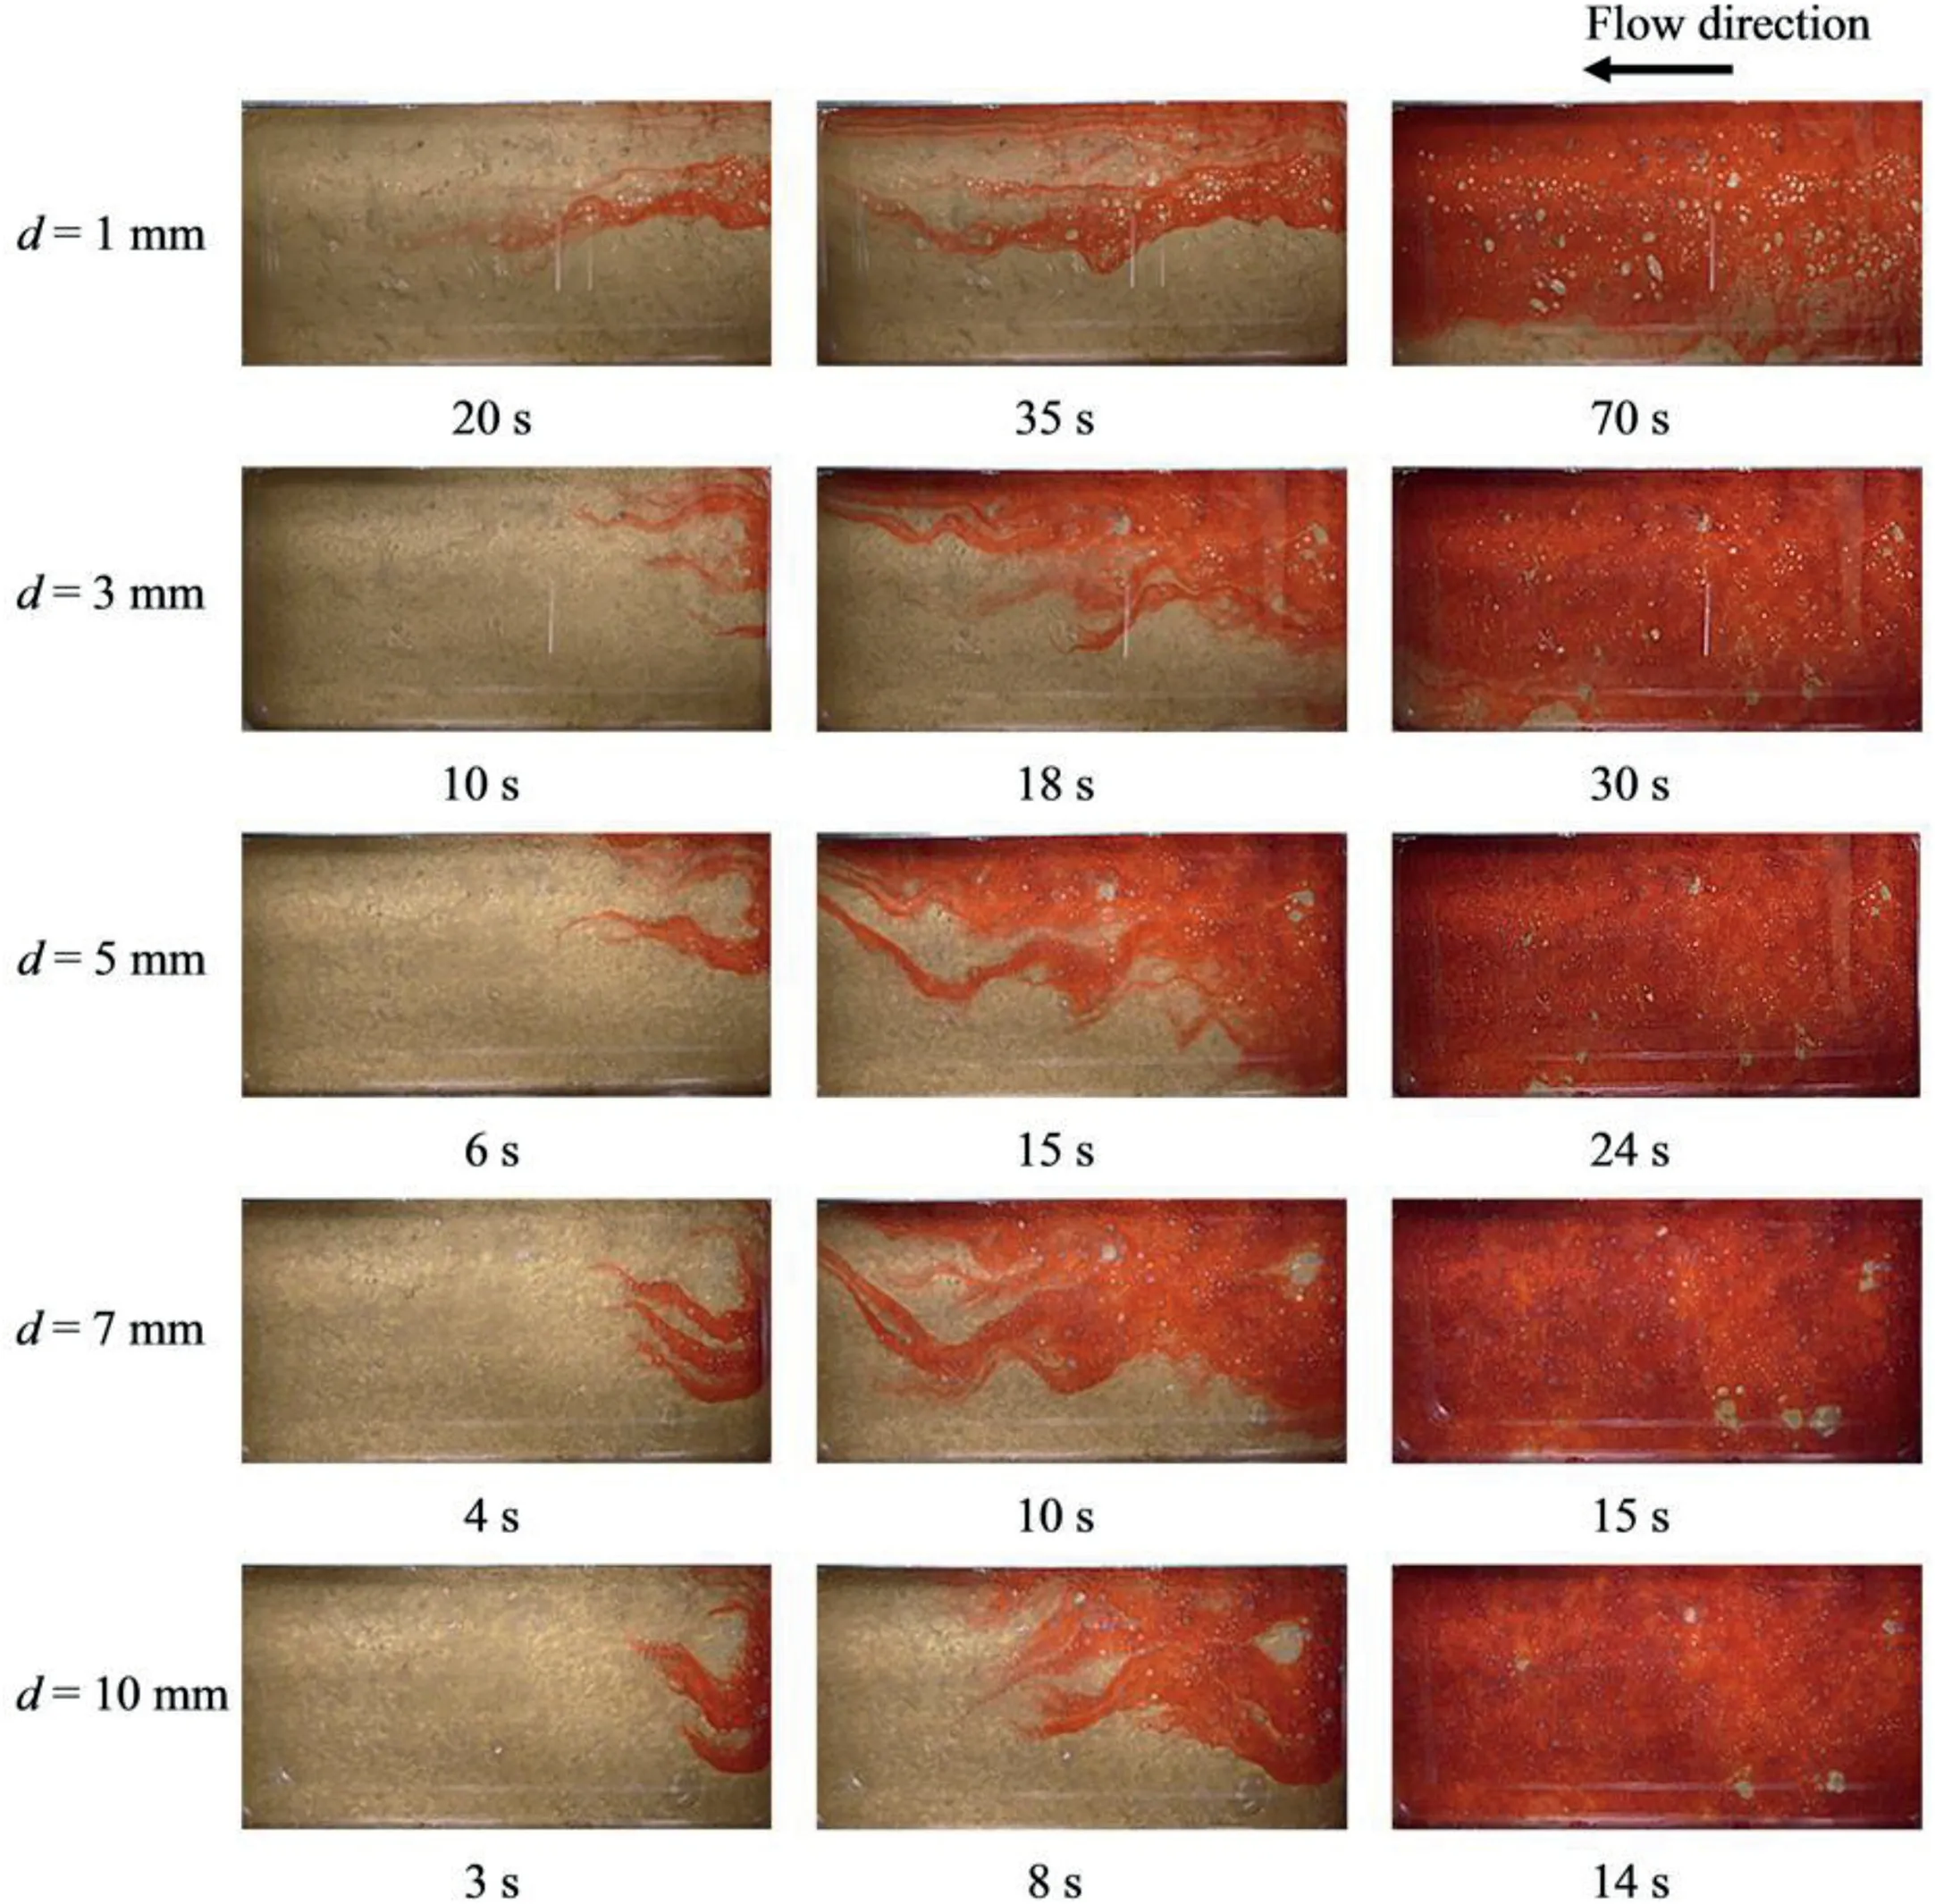
Fig.11.Evolution of the dyed water flow in Fracture G4 at various shear displacements.
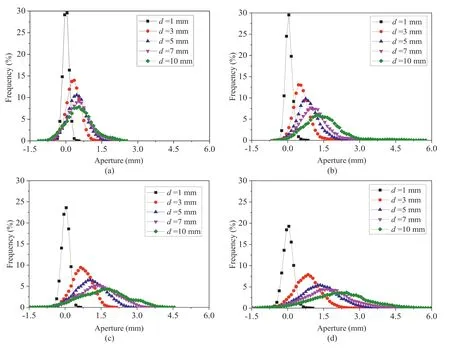
Fig.12.The aperture-frequency curves during shearing for different fracture surfaces: (a) Fracture G1,(b) Fracture G2,(c) Fracture G3,and (d) Fracture G4.The negative values represent the shear-induced contact areas.
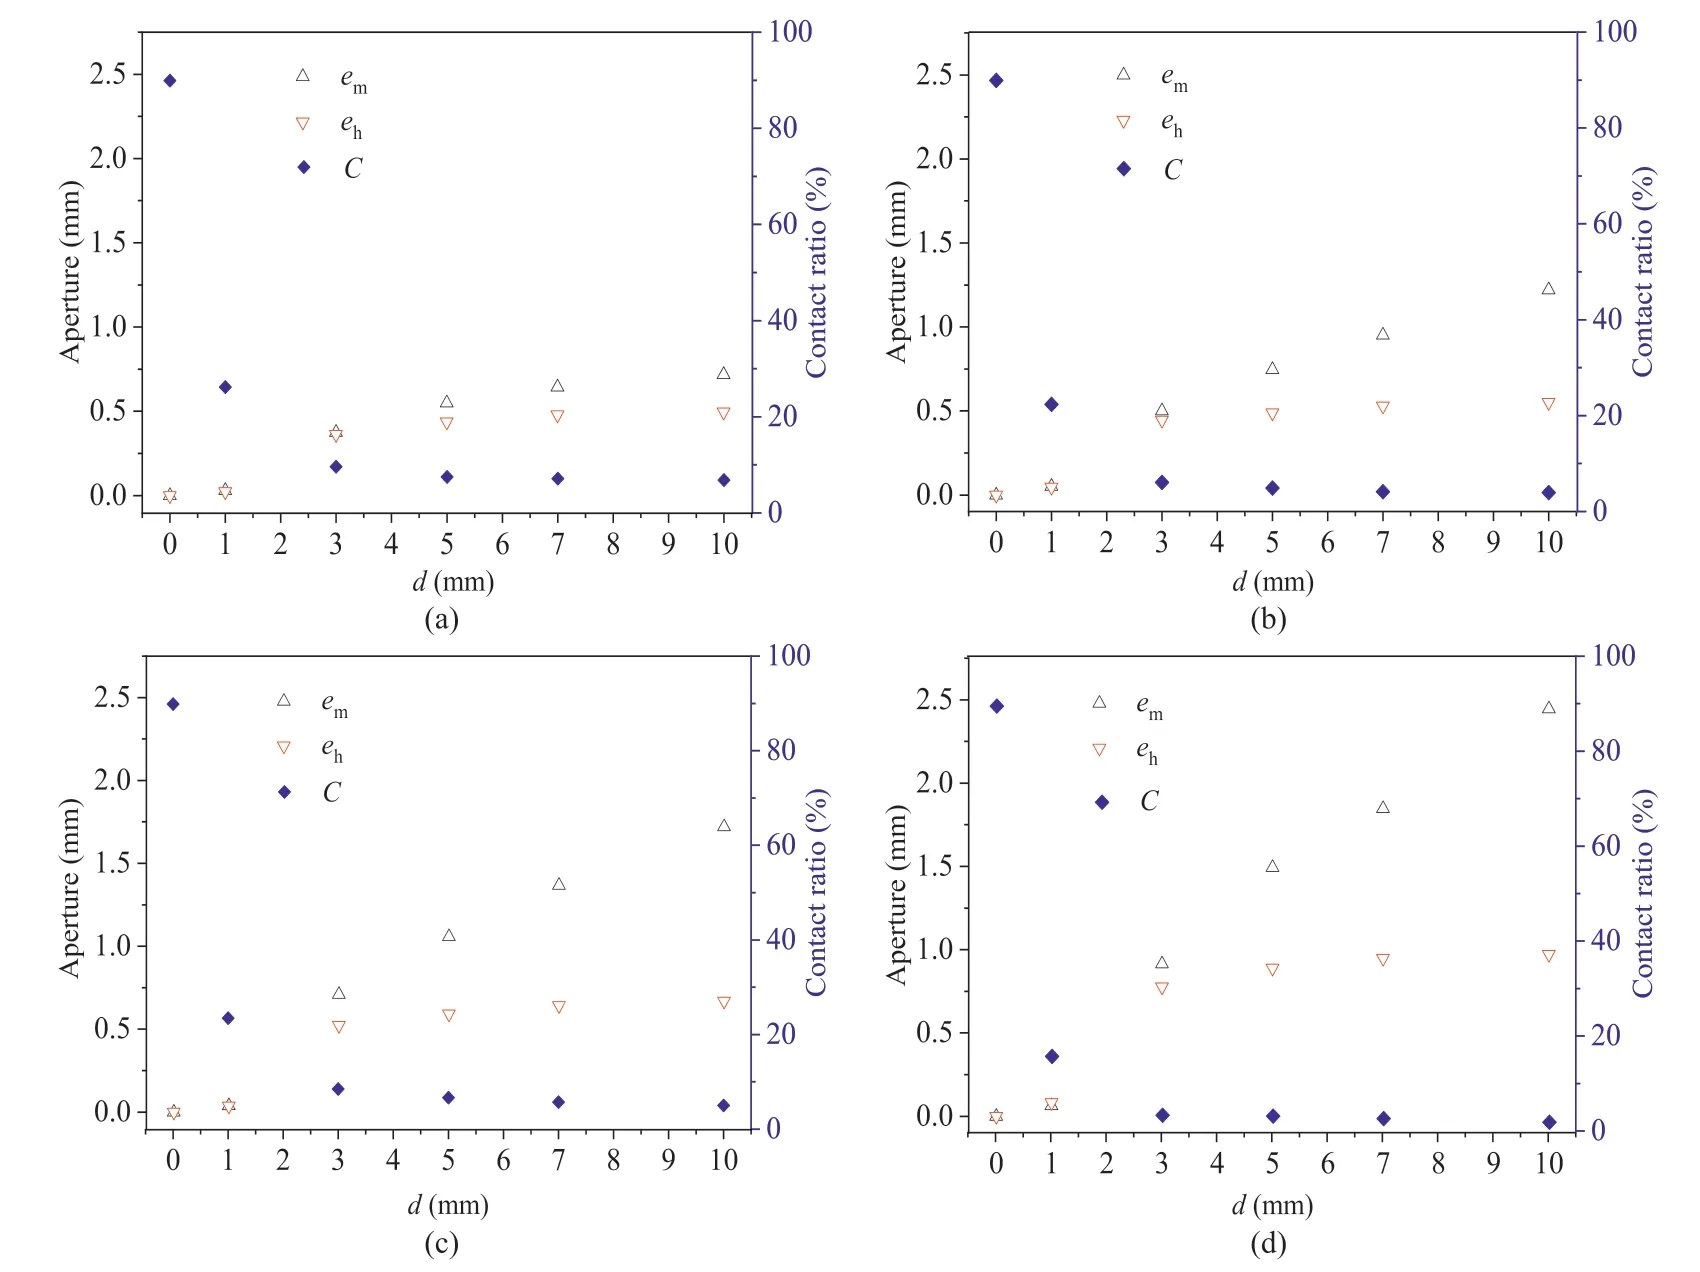
Fig.13.The evolutions of hydraulic aperture eh,mechanical aperture em and contact ratio C during shearing: (a) Fracture G1,(b) Fracture G2,(c) Fracture G3,and (d) Fracture G4.
4.5.Discussion
Nonlinear flow behavior is distinctly determined by the inertial effect,which is affected by the roughness,contact conditions,and aperture distribution of fractures.During shearing,the aperture and contact areas vary significantly due to shear dilation,which affects the hydraulic properties of fractures.Based on the visualization results,the two fracture surfaces were slightly mismatched at the initial shear stage,forming a closed aperture with a larger number of contact spots.Under this condition,the flow behavior is easily influenced by the roughness of fractures,and the existing contacts make the flow paths more tortuous;thus,the nonlinearity of fluid flow is strong with a small value ofRec.With an increase ind,the shear dilation causes the apparent variation in the fracture geometry,and this change will decrease the relative roughness,contact conditions and flow tortuosity,leading to remarkable decreases in bothaandb.Meanwhile,the roughness of the fracture surface has a limited impact on the nonlinear flow.Based on Eq.(10),the variation in the value ofais dependent on the aperture,and shear dilation can cause a decrease in the value ofa.Similarly,bis related to the aperture and non-Darcy coefficient α.An increase in aperture and/or decrease in flow tortuosity leads to a decrease in the value ofb.According to Eq.(13),Recis related to the ratio ofatob.The reduction degree ofais smaller than that ofbduring the shear process,which leads to an increase inRec.In addition,as shown in Fig.7,the rougher fracture can significantly increase the flow nonlinearity with a lower value ofRec.For rough-walled fractures,the complex morphology of the surface,contacts or sharp changes in fracture wavelength is the reason for inertial losses that cause the flow regimes to deviate from linearity.Additionally,during shearing,shear-induced fracture aperture distributions become more anisotropic and heterogeneous with increased roughness of fracture surface (Fig.12).These features tend to increase inertial losses and result in a lower value ofRec.
4.6.Critical conditions for nonlinear flow
The normalized transmissivity (T/T0),which is the ratio of the apparent transmissivity (T) at a certain flow rate to the transmissivity(T0)at a significantly small flow rate,has been commonly used to describe the nonlinear flow behavior in fractures(Zimmerman et al.,2004).
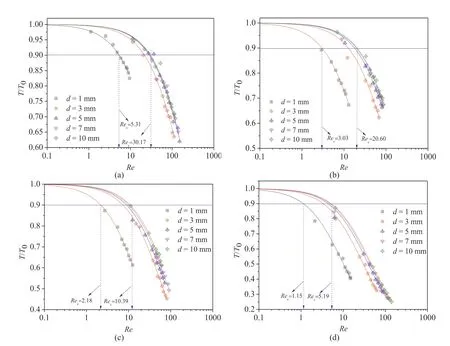
Fig.14.Relationships between normalized transmissivity (T/T0) and Reynolds number (Re) for (a) Fracture G1,(b) Fracture G2,(c) Fracture G3,and (d) Fracture G4.

whereT0=μ/aand β is the Forchheimer coefficient.
According to Yu et al.(2017),T/T0=0.9 means that 10% of the total pressure was induced by nonlinearity,which equalsE=0.1.Therefore,Eq.(15) can be expressed as

Hence,the expression ofReccan also be written as

Fig.14 plots theT/T0-Recurves of four rough fractures.The experimental data fit well with the prediction by Eq.(17).For all cases,T/T0decreases with increasing value ofRe.At small value ofRe,T/T0is approximately equal to 1.AsRereaches a critical value,T/T0sharply decreases because of the inertia effect.Additionally,theT/T0-Recurves gradually shift upward with increasingd.TheT/T0-Recurve shifts more significantly in thedrange of 1-3 mm than in the range of 3-10 mm,indicating that the nonlinearity of fluid flow is stronger at low values ofd.
Previous studies have reported that β can be influenced by special circumstances (Wang et al.,2016,2020b;Yin et al.,2017).Wang et al.(2016) found that the value of β is increased by approximately one order of magnitude as the fractal dimension increases from 2.2 to 2.5.Yin et al.(2017)observed that the decline in the value of β decreases with increasing value ofd,but increases with the applied normal load.To further analyze the impact of contacts and roughness on the value of β,the variations in β under different values ofdwere calculated by Eq.(15).Fig.15 shows the relationship between β andC.The plots suggest that a power function can well describe the relationship for each fracture.The larger value ofDvahas a steeper slope,indicating that the value of β is significantly affected by the contact area ratio for a rougher fracture.Fig.16 shows the β-Dvacurves of fractures under different shear displacements,showing that log10β has a strong linear relation betweenDvawith a similar slope.Motivated by the evolution characteristics of the curves shown in Figs.15 and 16,an enhanced power-law is presented as

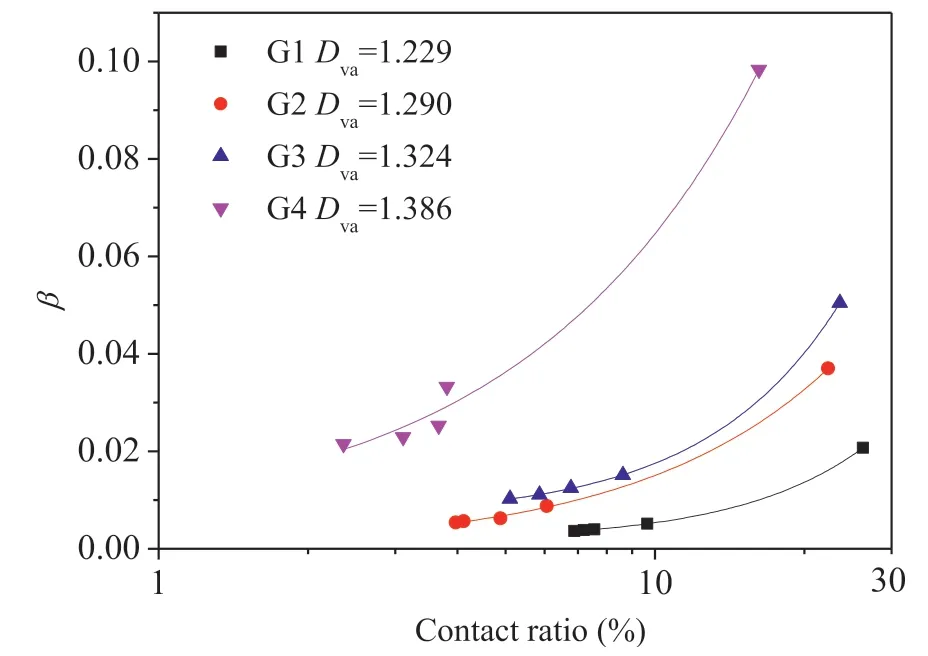
Fig.15.Relationship between the Forchheimer coefficient β with the contact ratio C.
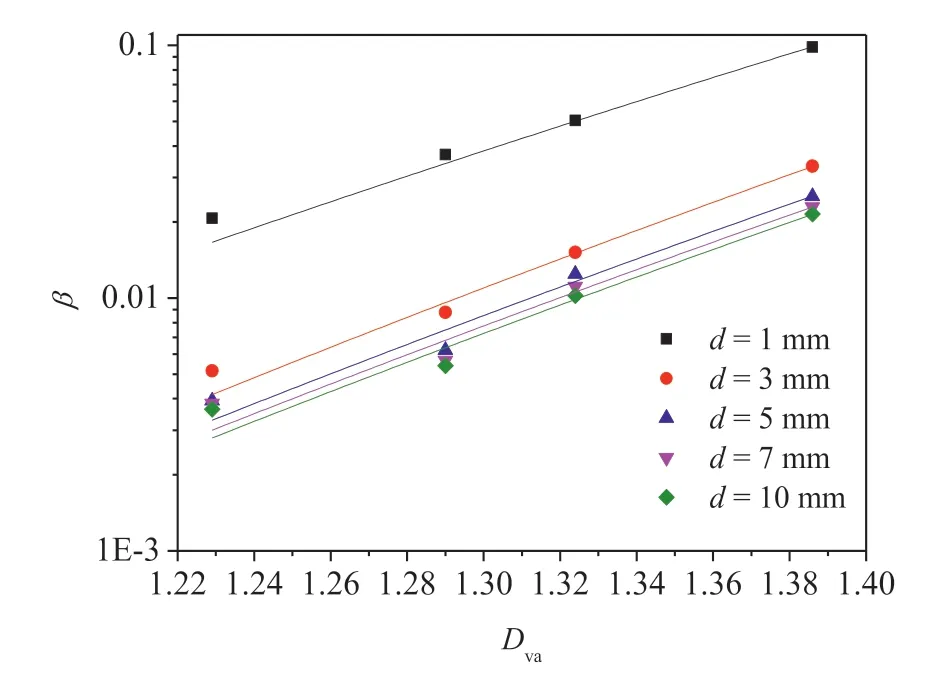
Fig.16.Relationship between Forchheimer coefficient β and the fractal dimension Dva under different shear displacements.
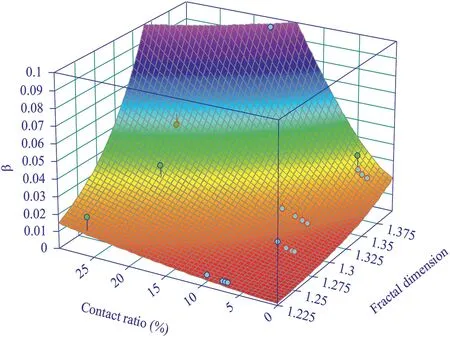
Fig.17.Regression analysis of Forchheimer coefficient β as a function of the fractal dimension Dva and contact ratio C.
wheren,kanddrepresent the regression coefficients.The best fits of β with the variablesCandDvaare plotted in Fig.17,which shows a strong relationship.The regression values in Eq.(18)aren=0.897,k=15.29 andd=-26.01 withR2=0.973.Substituting Eq.(18)into Eq.(17) yields theRecas

Eq.(19)supplies a simple mathematical prediction through the contact area ratio and fractal dimension to quantifyRecfor fluid flow in rough fractures.Fig.18 shows the relationship betweenRecandC.The variation inRecwas calculated usingE=0.1.The predicted values ofRec()are consistent with the experimental data().Recshows a decreasing trend with increasing values ofCandDva.The average estimation errors of Eq.(19) (Eave) can be obtained by

whereMis the number of conducted tests.The average estimation error calculated by Eq.(20) is 5.71%,which further validate the mathematical prediction model.
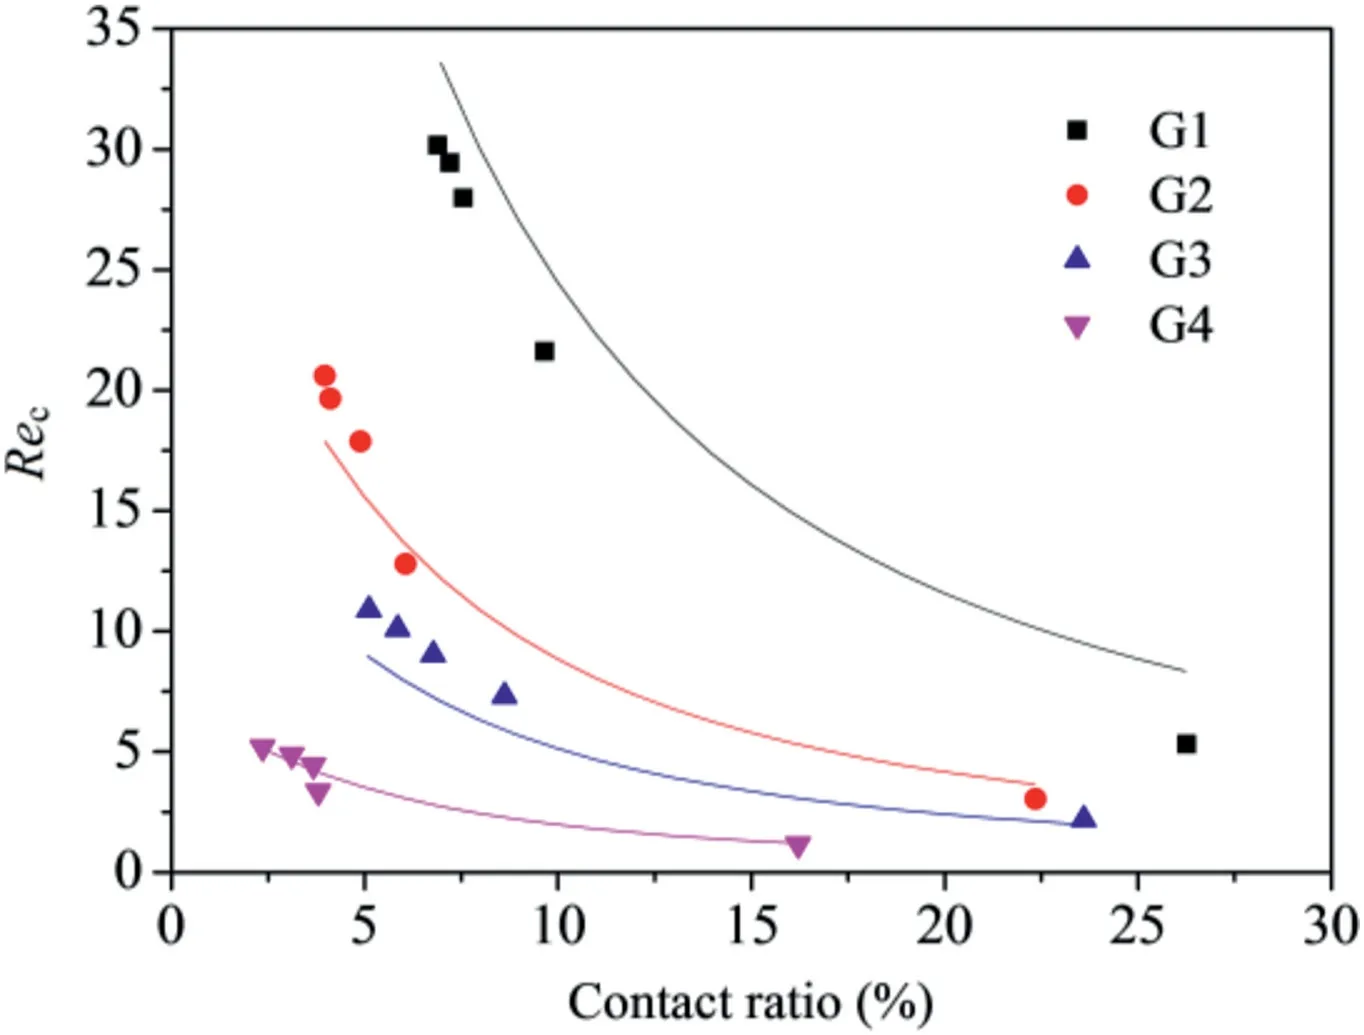
Fig.18.Predications of critical Reynolds number Rec as a function of contact ratio C and comparisons with the experimental results.
5.Conclusions
In this work,we conducted shear-flow tests on four transparent replicas of different rough granite fractures using a visualization system of the shear-flow apparatus.Based on this apparatus,a visualization method was developed to determine the channelization behavior of fractures with varying displacements of shear(d=1 mm,3 mm,5 mm,7 mm and 10 mm).The evolution of flow paths,contact conditions and aperture distributions were analyzed to determine how the shear displacement affects the nonlinear flow behavior of fractures with different roughness.
The obtained results show that the relationship between the pressure drop and flow rate is distinctly nonlinear,and can be fitted well by Forchheimer’s law.The critical Reynolds number (Rec) exhibits an ascending trend with increasing shear displacement.The evolution ofReccan be explained by the results of visualized shearflow test.Whendis small,the tight aperture with many small contact spots causes the flow path to be more tortuous,resulting in a strong nonlinearity of fluid flow.Asdcontinuously advances,the dilation significantly decreases the contact ratio (C),and preferential channels were more characteristically observed,leading to increases inRec.A mathematical expression ofRecbased onCand fractal dimension(Dva)was proposed,and the experimental results confirm the validity of the mathematical prediction model.TheRecshows a descending trend with increasingC.
In the present study,we conducted shear-flow tests on roughwalled fractures with a small stress of 0.5 MPa to guarantee that the fracture surface is negligibly damaged and thus,the influence of the production of gouge material on flow characteristics can be ignored.However,the fracture may be subject to various stress levels and boundary conditions,which directly influence the contact condition and fracture aperture field,as well as the fluid flow behavior in fractures.In future work,we will focus on the influence of normal stress and boundary conditions on the fluid flow nonlinearity in fractures during shearing and facilitate predictive models of the nonlinear flow regime by considering the impact of boundary stress.Besides,limited by the test equipment,the CCD camera cannot capture nonlinear flow behaviors,e.g.eddies and backflow.In future studies,new visualization techniques,such as particle image velocimetry,will be adopted to obtain more details on flow,including the distributions of velocity and streamlines,for fractures undergoing different shear displacements.
Declaration of competing interest
The authors declare that they have no known competing financial interests or personal relationships that could have appeared to influence the work reported in this paper.
Acknowledgments
This study has been partially funded by National Key Research and Development Program of China (Grant No.2020YFA0711800),the National Natural Science Foundation of China (Grant No.51979272),and the Natural Science Foundation of Shandong Province,China (Grant No.ZR2021QE069).These supports are gratefully acknowledged.
 Journal of Rock Mechanics and Geotechnical Engineering2023年2期
- Journal of Rock Mechanics and Geotechnical Engineering的其它文章
- On the critical particle size of soil with clogging potential in shield tunneling
- Strength and deformation characteristics of irregular columnar jointed rock mass: A combined experimental and theoretical study
- Spatial distribution and failure mechanism of water-induced landslides in the reservoir areas of Southwest China
- Characteristics of electromagnetic vector field generated from rock fracturing
- A multi-purpose prototype test system for mechanical behavior of tunnel supporting structure: Development and application
- Geotechnical investigation of low-plasticity organic soil treated with nano-calcium carbonate
