New approaches to quantify progressive damage and associated dynamic rock mass blockiness
Ldn Krimi Shrif ,Dvide Elmo ,Doug Sted
a NBK Institute of Mining Engineering,The University of British Columbia,Vancouver,Canada
b Department of Earth Science,Simon Fraser University,Burnaby,Canada
Keywords:Numerical modelling Spatial analysis Temporal analysis Discrete fracture network (DFN)Finite-discrete element method (FDEM)modelling Block calculations Graph structure
ABSTRACT In the past decade,numerical modelling has been increasingly used for simulating the mechanical behaviour of naturally fractured rock masses.In this paper,we introduce new algorithms for spatial and temporal analyses of newly generated fractures and blocks using an integrated discrete fracture network(DFN)-finite-discrete element method (FDEM) (DFN-FDEM) modelling approach.A fracture line calculator and analysis technique(i.e.discrete element method(DEM)fracture analysis,DEMFA)calculates the geometrical aspects of induced fractures using a dilation criterion.The resultant two-dimensional (2D)blocks are then identified and characterised using a graph structure.Block tracking trees allow track of newly generated blocks across timesteps and to analyse progressive breakage of these blocks into smaller blocks.Fracture statistics (number and total length of initial and induced fractures) are then related to the block forming processes to investigate damage evolution.The combination of various proposed methodologies together across various stages of modelling processes provides new insights to investigate the dependency of structure’s resistance on the initial fracture configuration.
1.Introduction
The finite-discrete element method (FDEM) has proven itself invaluable for simulating the initiation and propagation of brittle fractures in both surface and underground applications (Elmo and Stead,2010;Lisjak and Grasselli,2010;and Rougier et al.,2011;Tatone,2014).However,there still exists the need to develop suitable techniques to better characterise fracturing processes,including the formation of fully formed blocks.This paper describes how the results of FDEM models can be used in a detailed analysis of intact rock damage and associated block formation using several newly developed approaches incorporating: (i) block damage;(ii)block size;(iii) stress and displacement maps;(iv) block tracking trees;and (v) block fragmentation.The proposed techniques are data-driven,and rely solely on raw simulation data,thus eliminating the inherent inaccuracy and limited scalability of earlier methods based on image processing.
Discrete fracture network (DFN) models are an integral part of the proposed approach.Elmo et al.(2014) reviewed the fundamentals of DFN modelling applied to rock engineering problems.Realistic DFN models can be generated using information about:(1)fracture intensity(e.g.number of fractures per metre);(2)fracture orientation;and (3) fracture length.In addition,one has defined that the spatial model governs the way that fractures are generated within the three-dimensional (3D) volume.The most common spatial model used in rock engineering applications is the enhanced Baecher model,in which fracture centres are randomly located in space using a Poisson process.As a result,design applications based on the use of DFN models should consider the stochastic nature of the embedded fracture network,whether the analysis is performed in two-dimensional (2D) or 3D.The stochastic nature of natural fracture network is a manifestation of the inherent variability of rock masses.This raises important questions with respect to the limits of continuum-based conceptualisations of fractured rock masses,since it has been demonstrated that rock masses with equivalent classification ratings could actually yield significantly different strength values (Elmo and Stead,2010).
Karimi Sharif et al.(2019) introduced new methods to analyse DFN models.However,these techniques are valid for “static” DFN models.When DFN traces are embedded into 2D FDEM models,the imposed loading conditions contribute to the extension of the preexisting fractures and the formation of new cracks.In other words,a new DFN configuration is progressively generated as the loading conditions change in the FDEM model.The objective of this paper is to analyse evolving or what we term new DFN traces generated during FDEM simulations.A fracture calculator is developed that uses mesh data and timesteps of the FDEM numerical simulation.This new technique is independent of the simulation software and could also be applied to discrete element method (DEM).An extension of the DFNAnalyzer technique(Karimi Sharif et al.,2018)is then proposed that allows to quantitatively analyse fractures,both spatially (within a timestep) and temporally (for varying timesteps).This new technique has the potential to offer significantly improved capabilities for the analysis of intact rock bridge failure(e.g.Elmo et al.,2018).The analysis is extended to include a new block calculator and block analyser that calculate the number of fully formed blocks and analyse their characteristics based on geometrical methods and graph analysis (Hopcroft and Tarjan,1973;Lewis and Papadimitriou,1982;Gross and Yellen,2005;Diestel,2017).
Pillar models developed based on the data collected by Elmo(2006) have been used to test the proposed analytical methods.The results show that the proposed techniques can provide a detailed portfolio of quantitative information and illustrations that can help in understanding brittle failure processes and highlight the relative control of pre-existing fractures and intact rock bridges during the failure process.
2.Rock mass blockiness as a key to understanding brittle failure
Rock mass blockiness is an important characterisation parameter in rock engineering design,and it forms the basis of one of the most commonly used rock mass classification system,i.e.the geological strength index (GSI) (Hoek et al.,1995;Marinos et al.,2007;Hoek and Brown,2019).In the original GSI table,blockiness is treated in a qualitative manner,and relates to the observed field conditions.The GSI chart was quantified by Hoek et al.(2013)by introducing relationship between joint condition and rock quality designation (RQD),however,it did not include a quantification of rock mass blockiness.Methods to quantify rock mass blockiness based on the GSI approach have been proposed by Cai et al.(2004) and more recently by Schlotfeldt and Carter (2018).Bertuzzi (2019) found a high correlation between GSI estimated using the initial chart proposed by Hoek et al.(1995) and the approach proposed by Cai et al.(2004) for major rock types in Sydney (Australia).Even though blockiness is an important parameter which controls rock mass behaviour,and current methods consider only the initial blockiness (qualitatively or quantitatively),none of these approaches consider the evolution and changes in damage processes that can lead to the progressive breakage of the initial blocks.Based on GSI system terminologies,an initially blocky rock mass will not necessarily become very blocky when subjected to loading.
To study the transition of a rock mass from massive to blocky and very blocky,it is necessary to analyse and quantify failure mechanisms,including failure of intact rock bridges.However,it is not just a matter of simply measuring block volumes(or area in 2D simulations).There is the need to track where blocks are initially nucleated,and how those blocks may further fragment into smaller blocks.In other words,the effective characterisation of brittle damage requires more than simple measurement of damage areal intensityD21(Gao and Stead,2013) and crack orientation.
Static analysis of initial rock mass blocky systems has been conducted by many researchers in the past 50 years.The concept of block theory has been developed using graph theory,set theory and vector analysis for analysing rock mass stability.For example,Warburton(1981)assessed block stability by using vector analysis and calculating block volume,block mass and factors of safety with respect to a frictional failure criterion.Lin and Fairhurst (1988)performed static analysis of large-scale block systems using directed graph theory (ordered pair of nodes) in which the blocks are nodes and two nodes are jointed by an arc whenever the corresponding blocks are adjacent.The derived paths in the graph resembled the free face of the excavation.An example of such graphs by Lin and Fairhurst (1988) is shown Fig.1.
Various studies have been dedicated to the analysis of fracture configurations and potential block formation for static problems.GeneralBlock was written in Visual C++6.0 by Xia et al.(2015)using the OpenGL library.In this code,the modelling domain can be a complex shape,and the rock and fractures can be imported as heterogeneous materials.This programme identifies all blocks formed by the excavations and the fractures,and can show 3D graphics for each block.However,their methodology was limited to rock blocks formed by complex excavations and finite-sized fractures,therefore requiring filtering of non-persistent fractures as a primary step prior to use of the code.Cundall (1988) proposed methods for detecting the contacts between blocks of various shapes(i.e.convex and concave)and characterising the geometrical and physical properties defined by the contact between objects.This method utilised linked list data structure attached to a global pointer as an optimised search for rapid scanning through all contacts as the forces are updated in calculation cycles.For dynamic problems,Lu (2002) implemented a dynamic linked list to store topological information of a directed polyhedron,and this method can be used for detecting 3D blocks formed by natural fractures,including cracks,joints,and faults.A computer language BGL(block generation language)has been developed by Heliot(1988)to build the 3D block structure around excavations in rock.BGL has been developed using Lex and Yacc UNIX tools and considers both the geometrical description of the jointed rock mass and the available geological history process.More recently,Vazaios(2018)identified critical blocks using image processing algorithms applied to the output simulation results of the FDEM code Irazu (Geomechanica Inc.,2017).
The previous examples show how numerical analysis of discrete(blocks)problems has gradually been advanced by adopting various data structures such as arrays,linked lists and chained trees.Developing methods to continuously search for contacts between blocks requires an appropriate implementation of data structures to identify rock blocks.Block calculations and analysis are predominantly static and independent of the progressive intact rock damage associated with brittle fracturing.Some numerical codes are based on a discretisation of the modelling domain to blocks,and subsequent calculation of the contact forces between these blocks,as in DEM models (Cundall and Strack,2008).
The methodologies introduced in this paper use a similar datadriven approach integrated with FDEM models by using raw simulation output.One major difference between the method proposed in this paper and previously developed methods for DEM modelling relates to the relationship between the blocks across timesteps.While DEM is based on calculating the blocks for one given step,the proposed method in this paper can track finite element information across timesteps and build relationships between blocks using tree data structure.Graph theory (Gibbons,1985) is becoming a rapidly developing concept in the mainstream of mathematics mainly due to its potential applications in diverse fields such as electrical engineering (coding theory),computer science (algorithms and computations),biochemistry (genomics),and operation research(scheduling)and social networks.The same theory has been applied in this paper to solve problems such as block calculation within FDEM models by creating a tree of mesh elements and their connections.Solving the problem at a more abstract level using a hierarchical structure(across timesteps)is a fundamental step to allow tracking of elements and building of connected components(blocks).
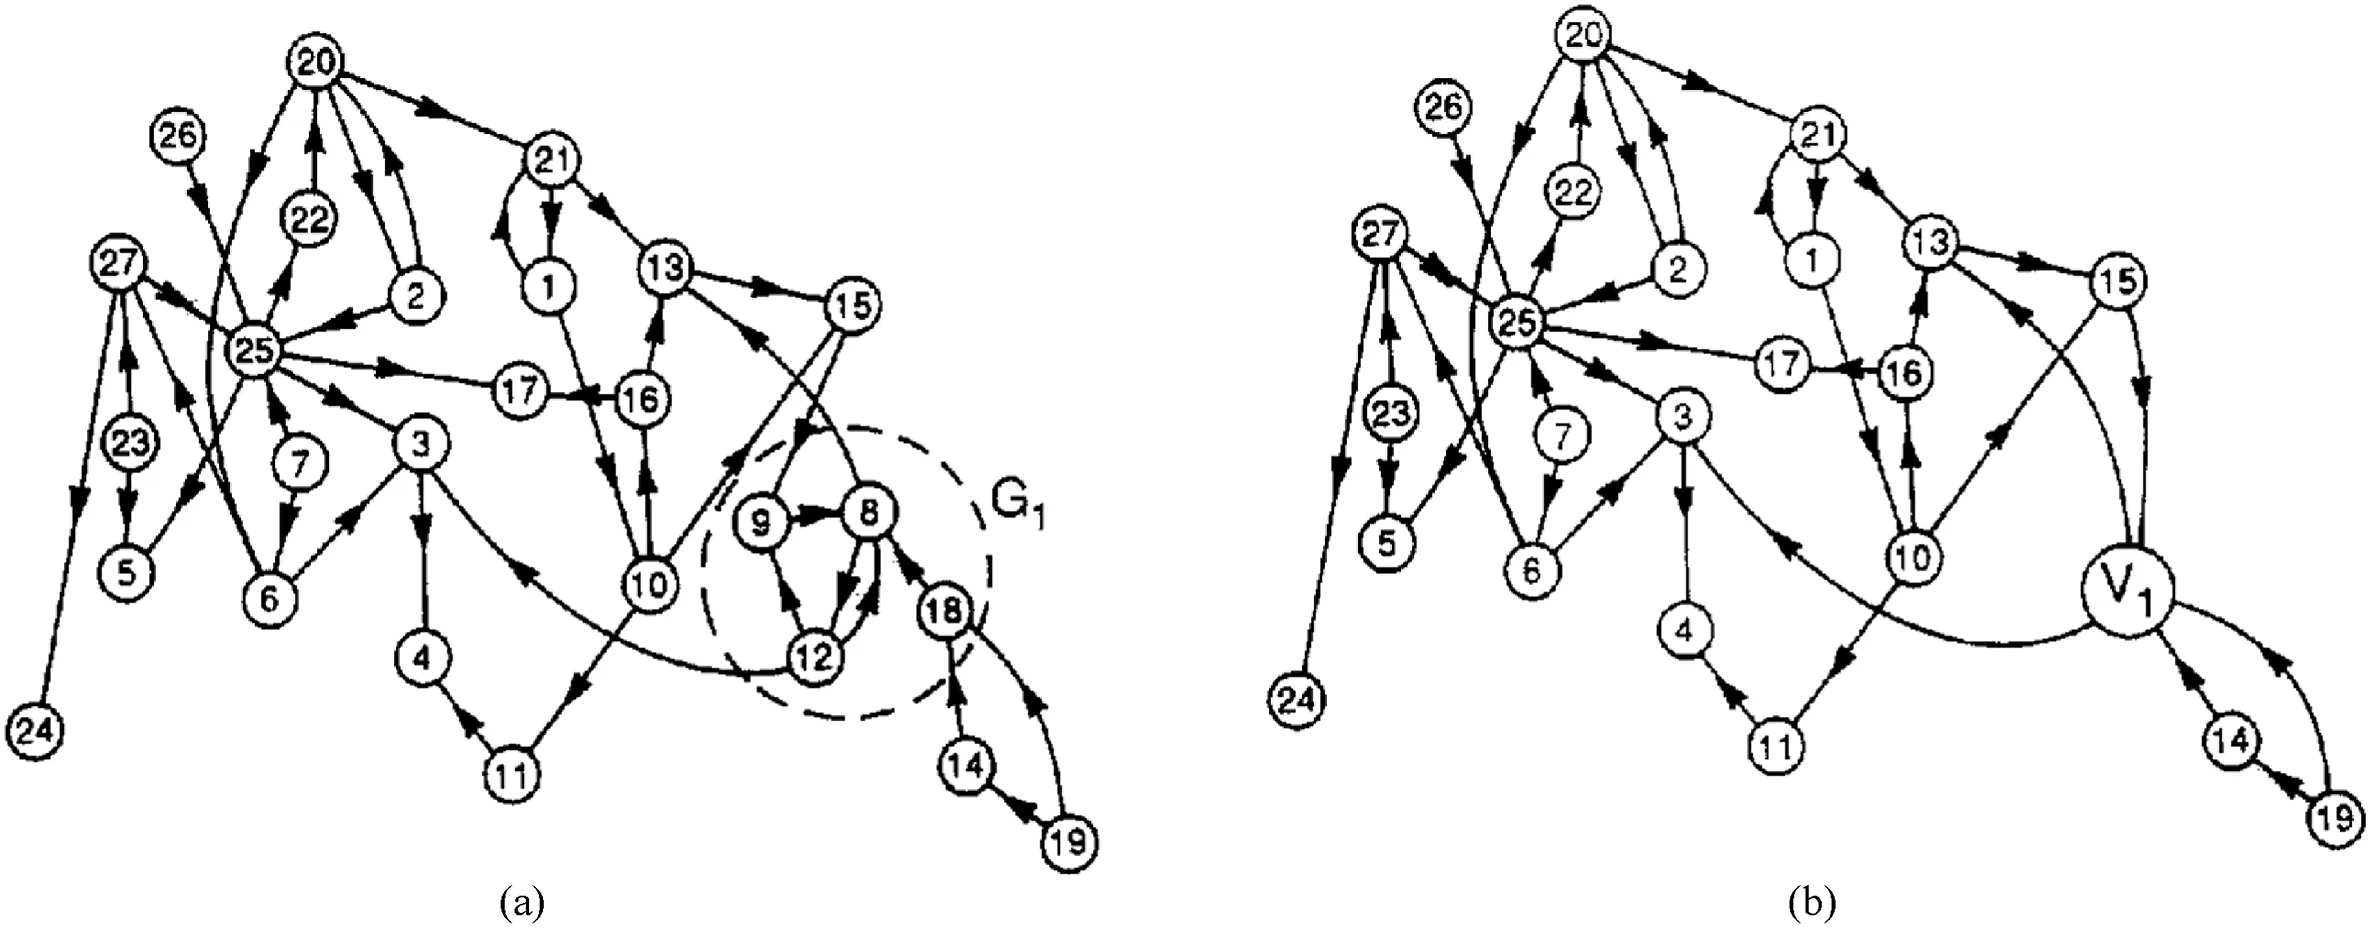
Fig.1.(a) Directed and (b) reduced graphs (after Lin and Fairhurst,1988).The collection of G1 nodes on the left are reduced to one single node V1 on the right.
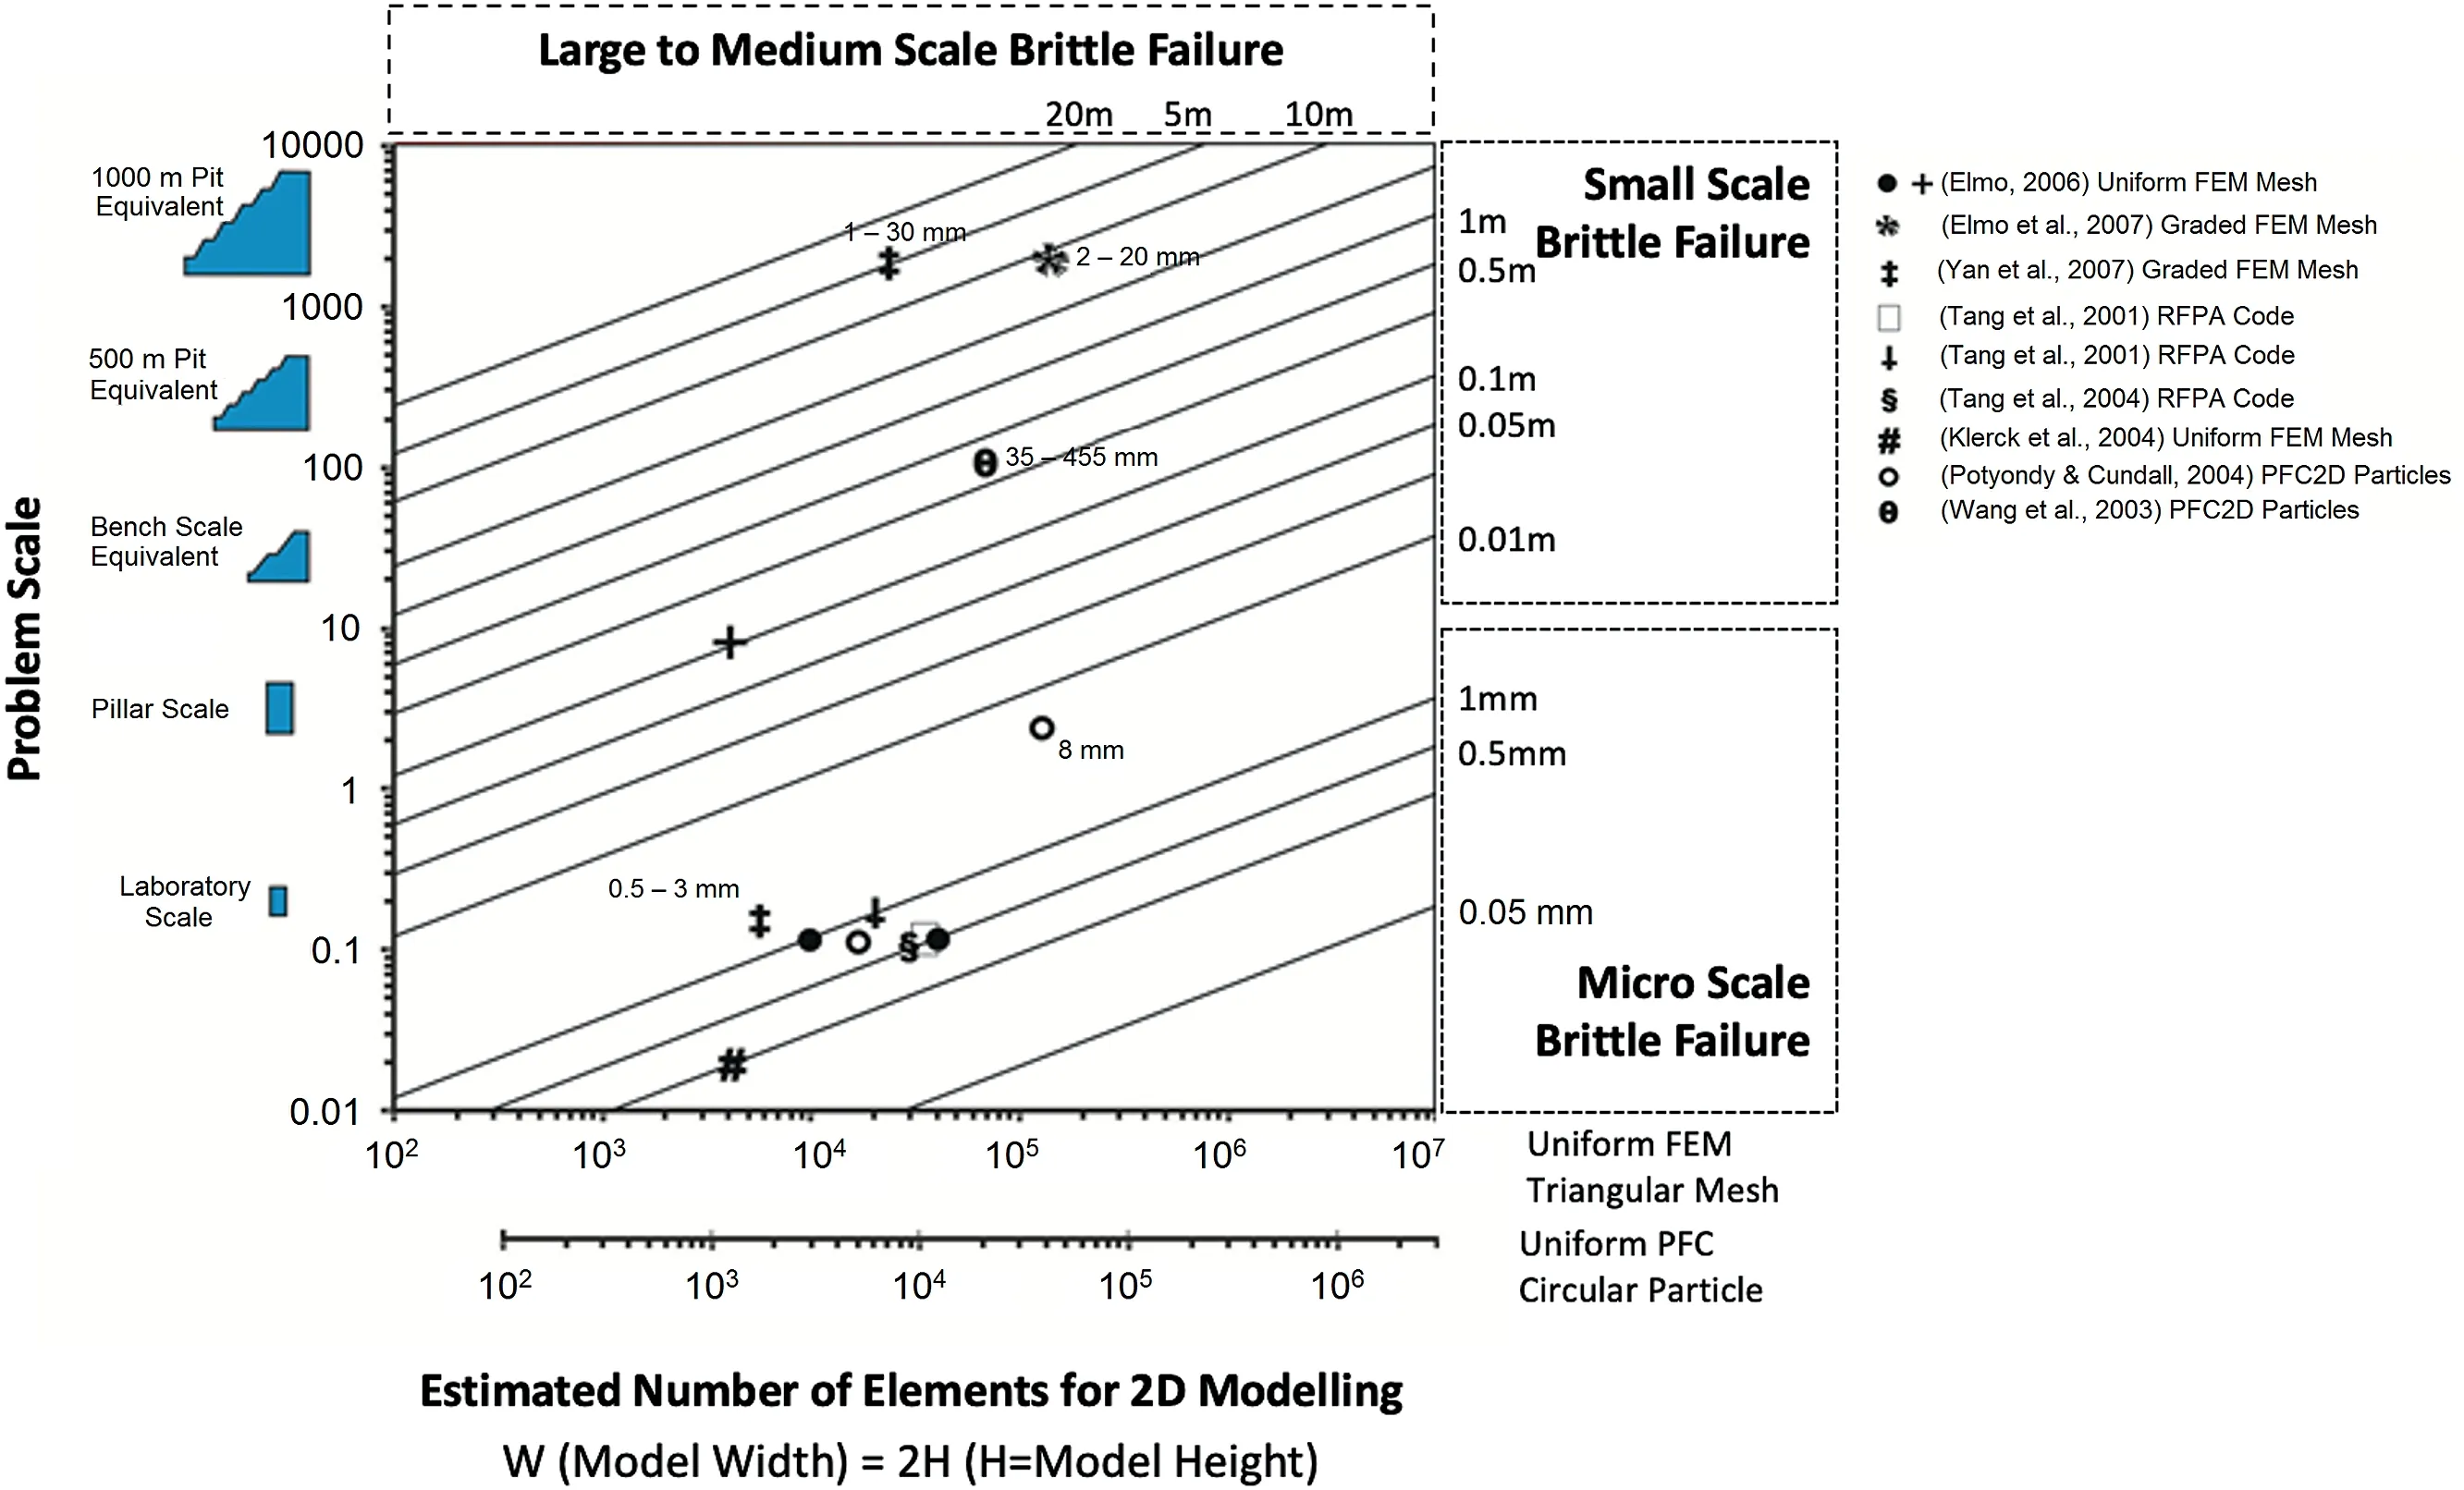
Fig.2.Relationship between model scale,mesh size and number of elements for 2D analysis of brittle failure processes(after Elmo et al.,2015;Elmo et al.,2007,Klerck et al.,2004,Potyondy and Cundall,2004,Tang et al.,2001,Tang et al.,2004,Wang et al.,2003,Yan et al.,2007).
3.Analysis of fracture traces in finite-discrete element models
The mechanical properties of a rock mass are directly related to its blocky (or massive) character.The geometry of the blocks is determined by the geometry of the fractures;therefore,fracture geometry needs to be carefully analysed and studied.Karimi Sharif et al.(2018) introduced a method (DFNAnalyzer) which allows deriving important statistics for a 2D fracture network(e.g.fracture length,orientation,and intersections).However,the method is limited to the initial geometrical characteristics of fractures and cannot provide important information on the evolution of newly generated fractures in FDEM models.FDEM techniques may use different approaches to simulate the generation and opening of new fractures.This section describes how it is possible to compute fracture data using information contained in the raw FDEM simulation output,with specific reference to the output of the FDEM code ELFEN (Rockfield Software Ltd,2014).The same principles could easily be extended to other FDEM and DEM software.
The initial stage in constructing a FDEM model in ELFEN is the discretisation of the domain into mesh elements of a given size.The size of the mesh element is an important parameter as it determines the direction along which the fractures initiate and propagate.In principle,ELFEN includes a remeshing option that would render the fracturing process independent of the mesh size,but this option is seldom used in the analysis of rock engineering problems due to the large computational time required.While using small meshed elements would provide a more detailed description of the fracturing process,the choice of the minimum element size is a trade-off between accuracy of the modelled fracture path and the computational time required to complete the analysis.Accordingly,the number of elements in the FDEM model differs according to the size of the problem under consideration and the assigned mesh size,as shown in Fig.2 (after Elmo et al.,2015).
The proposed methodology takes geometrical (mesh topology)information from simulation results,and computes new fracture information.The process is independent of the mesh size used to discretise the rock mass problem.
As the simulation progresses,the mesh topology is updated,and additional nodes and lines are added that represent the newly generated fractures.At every timestep,it is possible to track the location of every node in the mesh and use this information to develop a“dilation”criterion to define whether a new fracture has been introduced in the model.The process follows two steps (see Fig.3):
(1) Two nodes are still sharing one common edge(line),in which case no new open fracture is detected;
(2) Two nodes are no longer sharing one common edge(line),in which case a new open fracture is detected(dilation process).
Once dilation has been detected,the algorithm (herein called DEM fracture analysis,DEMFA)keeps track of the newly generated nodes and lines to detect whether a newly generated fracture is extending and/or branching out into new separate fractures.The process is shown in Fig.4,and is recursively accomplished for all the meshed elements (nodes and lines) and for all timesteps.
Once all new fracture lines have been computed using the technique introduced in this section,the DFNAnalyzer approach(Karimi Sharif et al.,2018) can now be used to provide properties for the evolving or dynamic DFNs,i.e.changes occur to the underlying fracture pattern as the simulation progresses (increasing timestep).The results can then be compared to the initial (static)DFN at timestep 0.Dynamic DFNs would represent the onset and propagation of damage,while static DFNs represent the initial modelling conditions and initial rock mass blockiness.
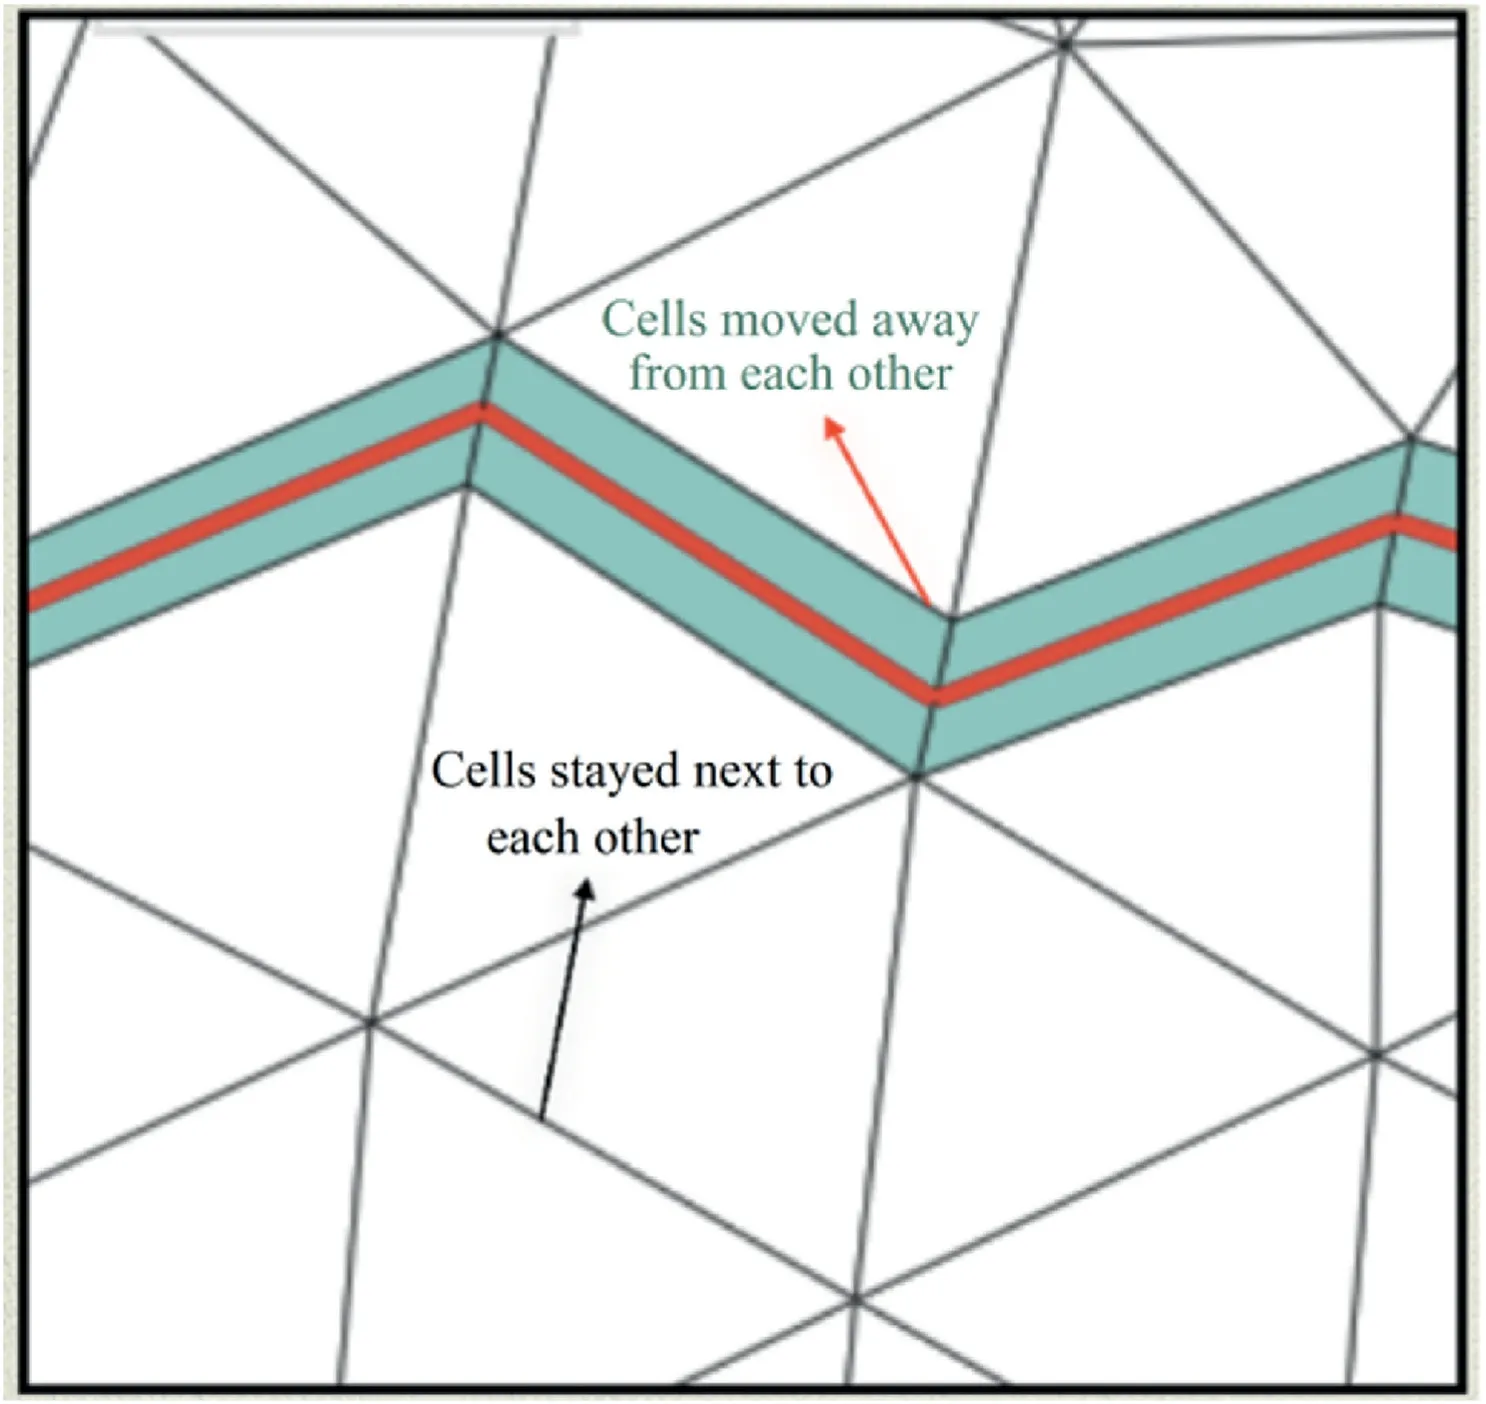
Fig.3.Mesh visualisation.The black arrow indicates a case in which cells remain in the initial location.The red arrow indicates a case in which the cell lines have moved away from each other.
Whereas calculating damage density(D20)is straightforward in static DFN models,for dynamic DFNs,one must consider how new fractures are defined in the first place.In the current approach,fractures are defined based on a dilation criterion;however,the algorithm would count continuous fractures as two or more separate fractures if the fractures are not aligned perfectly in a straight line.To overcome this issue,it is proposed to useD21as the key damage indicator for dynamic DFNs.D21is the ratio of total length of new cracks to problem area.The concept ofD21is not entirely new,for example,Gao and Stead (2013) employedD21to characterise brittle fracture above coal mine roadways.What is being introduced here is the use ofD21as a component part of a suite of damage indicators.The results in Figs.5 and 6 refer to a sample pillar model with pre-defined fracture lines.The properties and loading conditions of the FDEM model are similar to those used in Karimi Sharif et al.(2019)to test and validate the application of the developed analysis approaches.Comparing the stress-strain plot(Fig.5)and the resulting fracture network properties(Fig.6)clearly shows how pillar damage (represented by the number of newly generated fracturesD20,and the ratio of the total sum of their lengths to pillar areaD21) increases rapidly in the early stages of modelling and continues in the post-peak stage until 0.56% strain.
4.A new algorithm to define block formation in FDEM models
This section introduces a series of algorithms to compute static and dynamic block formations.The process is illustrated in Fig.7.Static blocks can be computed by calculating closed polygons,using fracture line(DFN)as input.This is the same approach as that used in DFNQuality introduced by Karimi Sharif et al.(2019).In Section 3,the calculation of the fracture lines is obtained separately for each timestep and the data can be used as inputs to the polygon calculator to compute blocks.However,the method does not store information on how a single block is broken into sub-blocks as the loading is increased in the models.Mesh data contain the necessary information to track block generation across timesteps;accordingly,a new method of computing blocks has been developed that utilises mesh data to overcome this limitation.This algorithm calculates the block formation per timestep by analysing mesh data and the connections between elements,thereby identifying which group of elements forms distinct blocks.
The block calculator algorithm considers the data for every timestep separately and is capable of storing information concerning one given block at timesteptibeing broken into sub-blocks as the simulation progresses(timestepti+1).To do so,the algorithm analyses mesh data and connections between elements,identifying which group of elements forms distinct blocks.A graph data structure is generated based on elements and connections for every timestep,whereby nodes represent mesh elements,and edges(lines) represent connections between elements.Two mesh elements are considered to be connected if they are sharing element edges.When two elements are connected,a graph edge is added to link their nodes.Each group of connected components represents a distinct graph (see example in Fig.8).
Computing connected components is a well-known technique in the field of graph theory(Hopcroft and Tarjan,1973;Shiloach and Even,1981;Lewis and Papadimitriou,1982;Reingold,2008).A random node is initially selected,and then neighbouring nodes are progressively connected until there are no more neighbouring nodes to reach.The traversed components are called connected components.The process is then repeated by choosing a random node that has not been explored yet and repeating the traversal process.The result is a set of connected components,each one representing a distinct block.Fig.8a and b are simple examples(sparse graph)for illustration purposes;however,the graph is a lot denser for a real model.
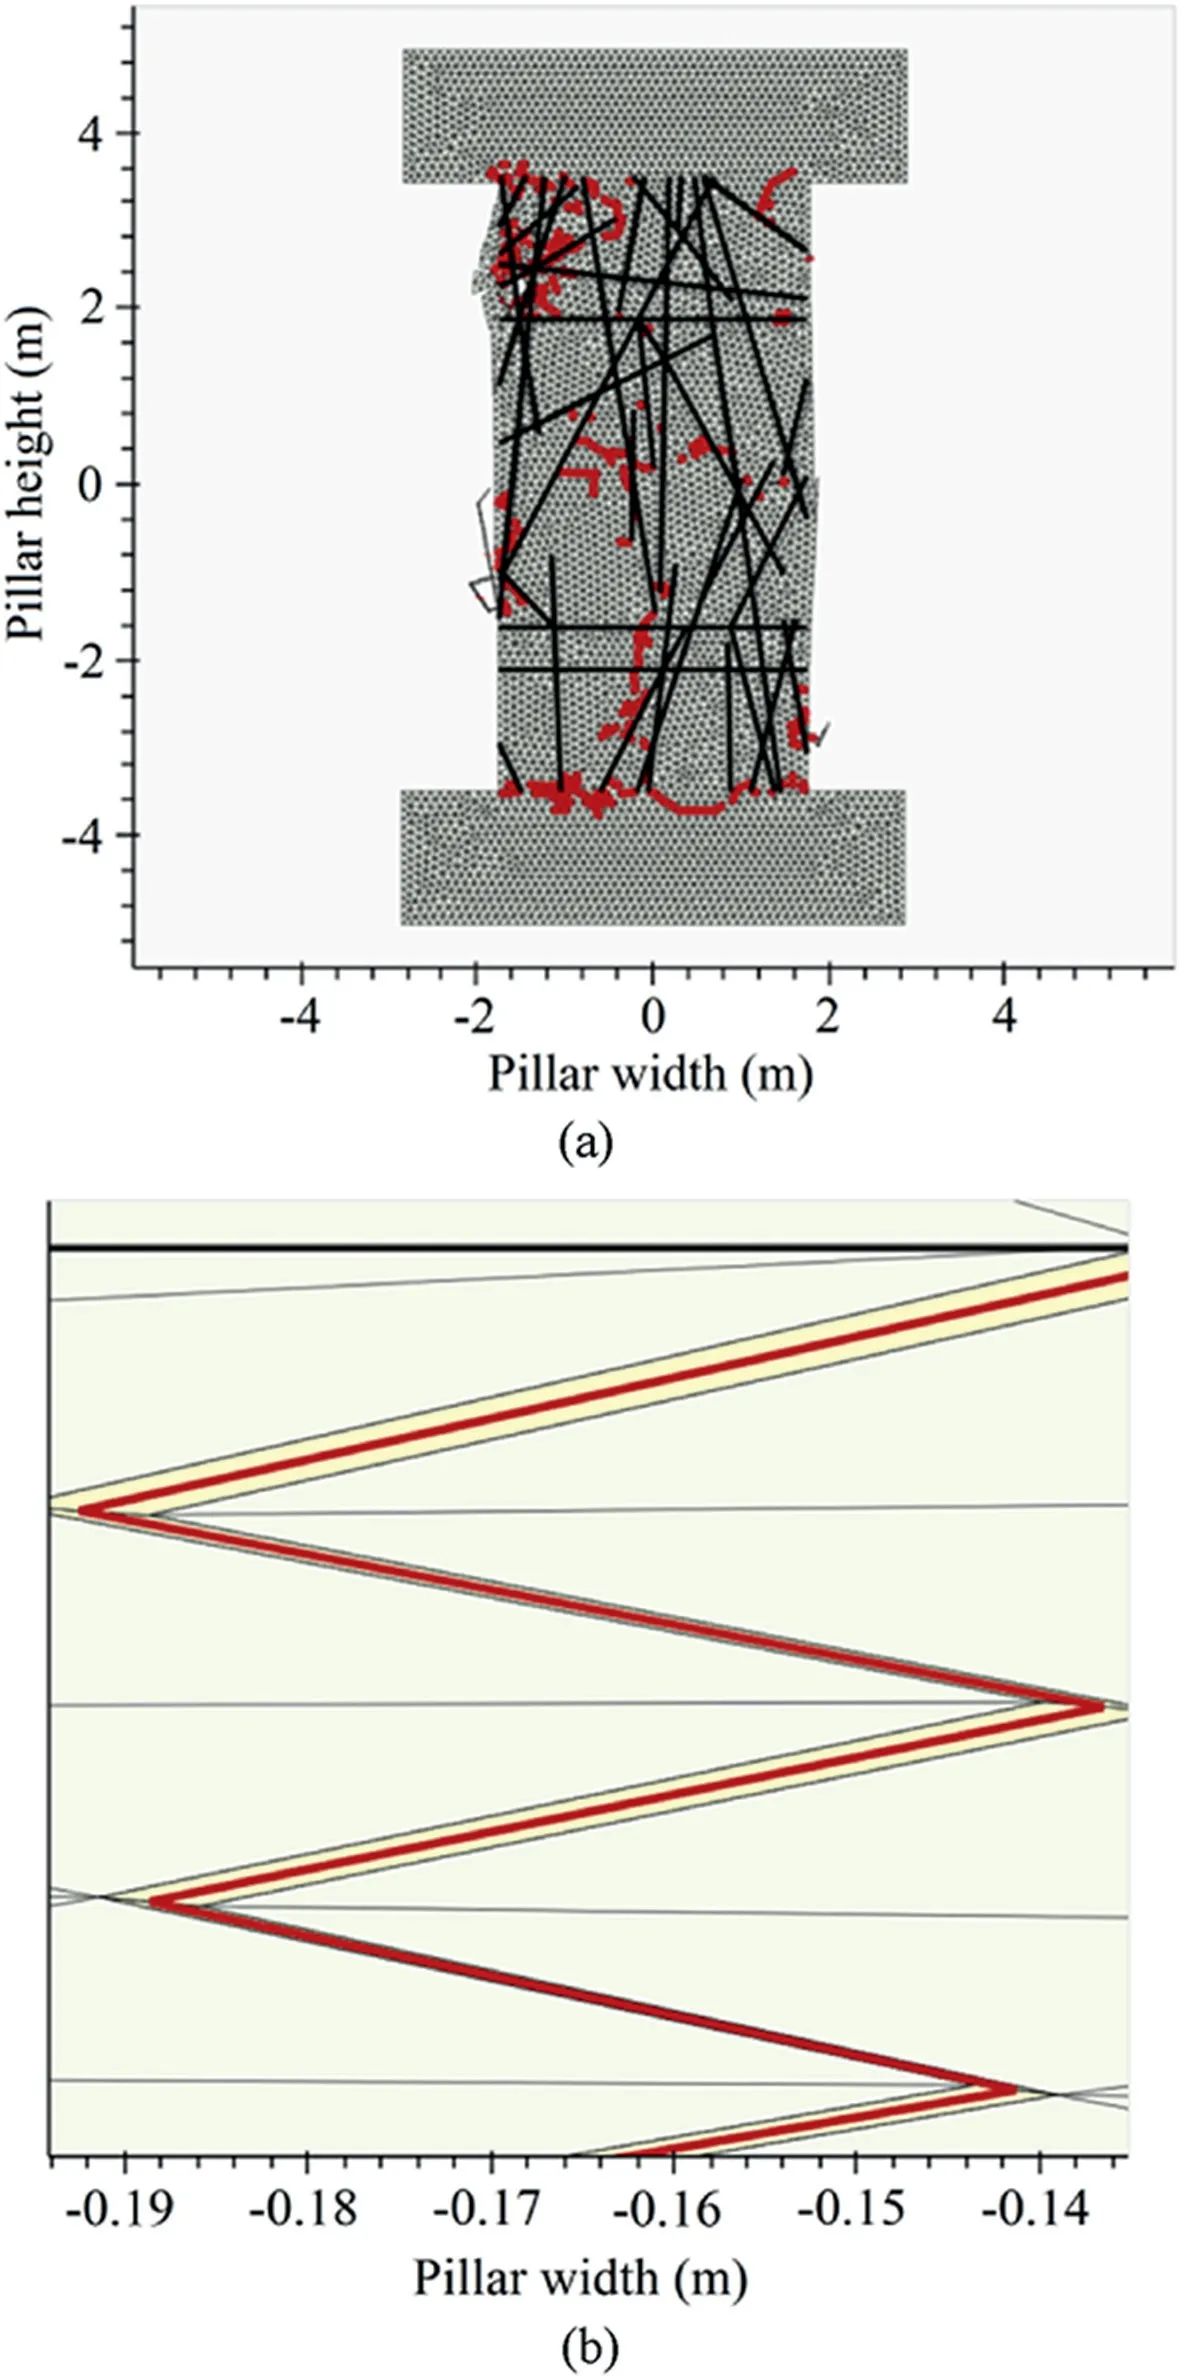
Fig.4.(a) Pre-existing fracture lines in pillar model shown in black and newly generated fractures shown in red;and (b) Focused fracture line location indicates the yellow area as the opening of mesh cells and red line constructed using the mid-point of connected mesh elements.
This approach is then used to characterise blockiness evolution for a simulated pillar model (Fig.9),starting from an initial configuration of multiple blocks.The model includes 12,000 meshed elements.Fig.10a shows the graph structure at the peak stress timestep(where nodes represent mesh elements,and edges represent connections between those elements),while Fig.10b shows the same graph structure after applying the connected component algorithm.The colours are used to differentiate the different components,each component representing the elements of a fully formed block.The graph information is then converted into geometrical blocks by combining the mesh coordinate information with the knowledge of block that each element belongs to(Fig.10c and d).
4.1.Block analysis
Once the blocks are identified,the objective is to group them into three categories,based on their kinematic character during and at the end of the simulation.Note that,in principle,the analysis could be applied to any (2D) DFN model and is not restricted to FDEM software.The three block categories are:
(1) Blocks that remain stable(same volume or area)throughout the simulation;
(2) Blocks that are removable,i.e.they detach from the rock mass due to external loading;and
(3) Brittle blocks that exist at the beginning of the simulation and are fragmented to form a series of smaller blocks by the end of the simulation.
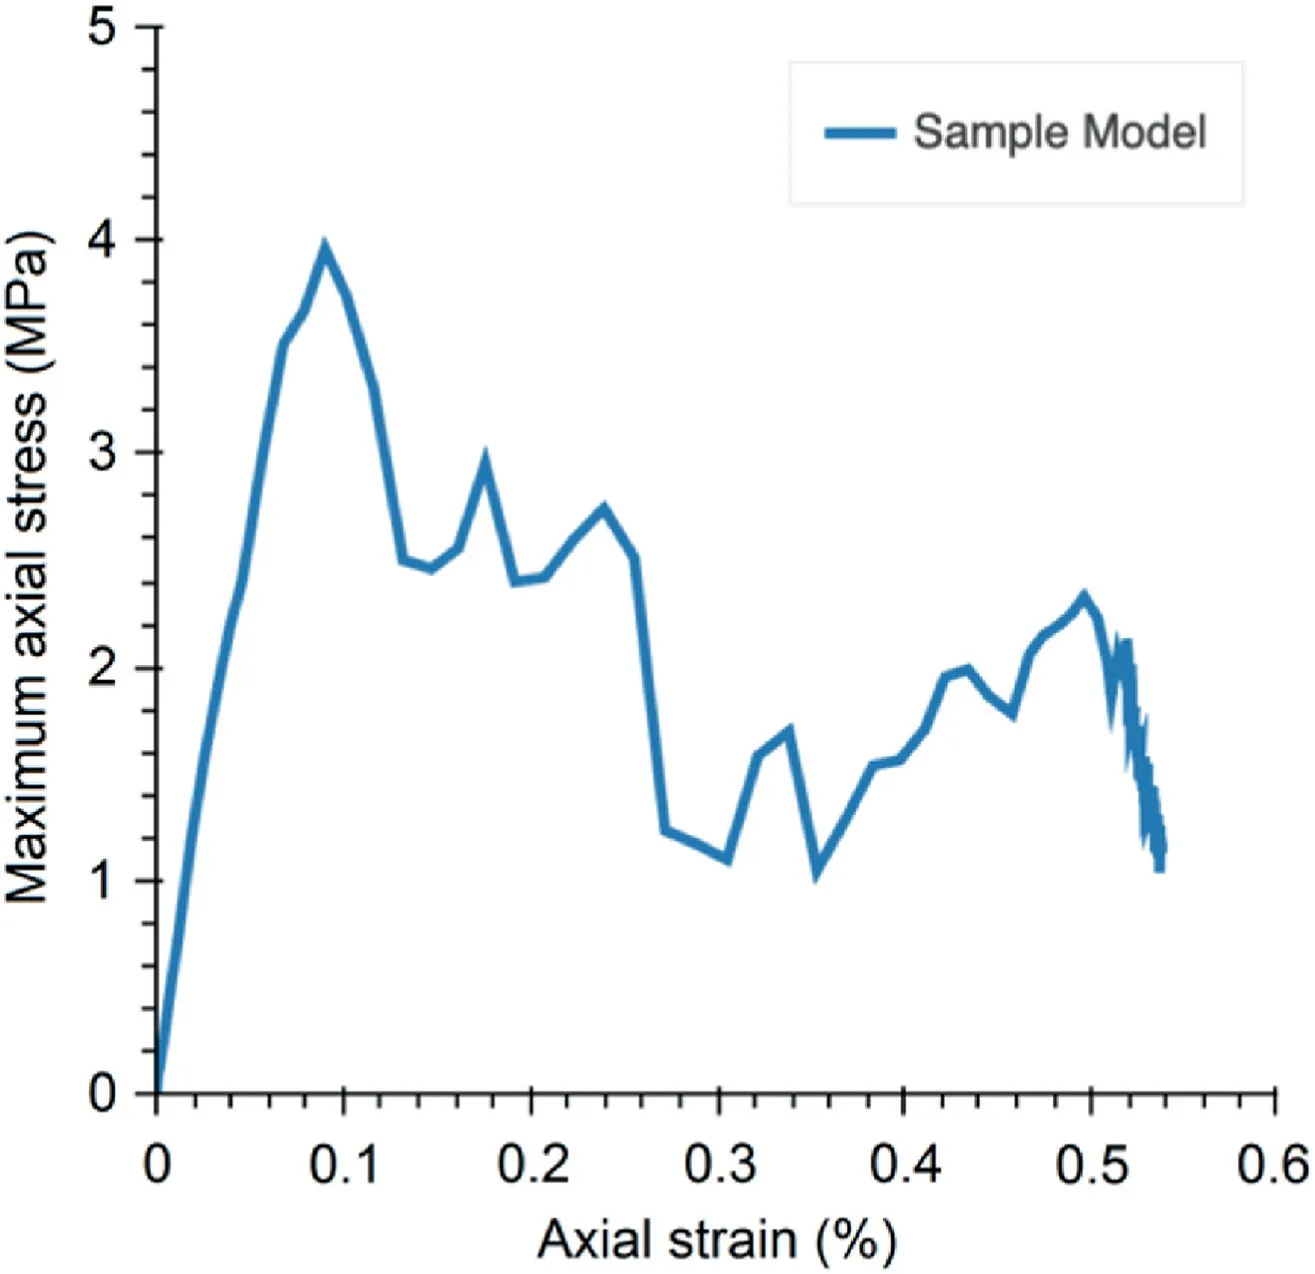
Fig.5.Axial stress vs.axial strain for the sample model.
These categories provide additional quantification of rock mass damage and its relation toD21.Under loading,a massive rock mass would likely yield a relatively largeD21,which may result in spalling blocks or failure of intact rock bridges separating existing blocks.Conversely,a blocky to very blocky rock mass would likely yield a relatively lowD21,as either existing blocks become kinematically unstable upon failure of critical rock bridges,or damage is consumed to break existing tapered blocks into removable blocks.
Dedicated analysis techniques have been introduced to test and validate this new approach to rock mass damage quantification,including:
(1) Combined block damage analysis;
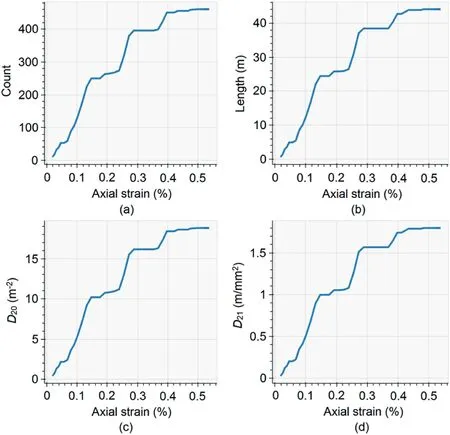
Fig.6.Results of the DEM fracture analyser: (a) Number of fractures;(a) Length of fractures;(c) Number of fractures per unit area, D20;and (d) Total length of fractures per unit area, D21.
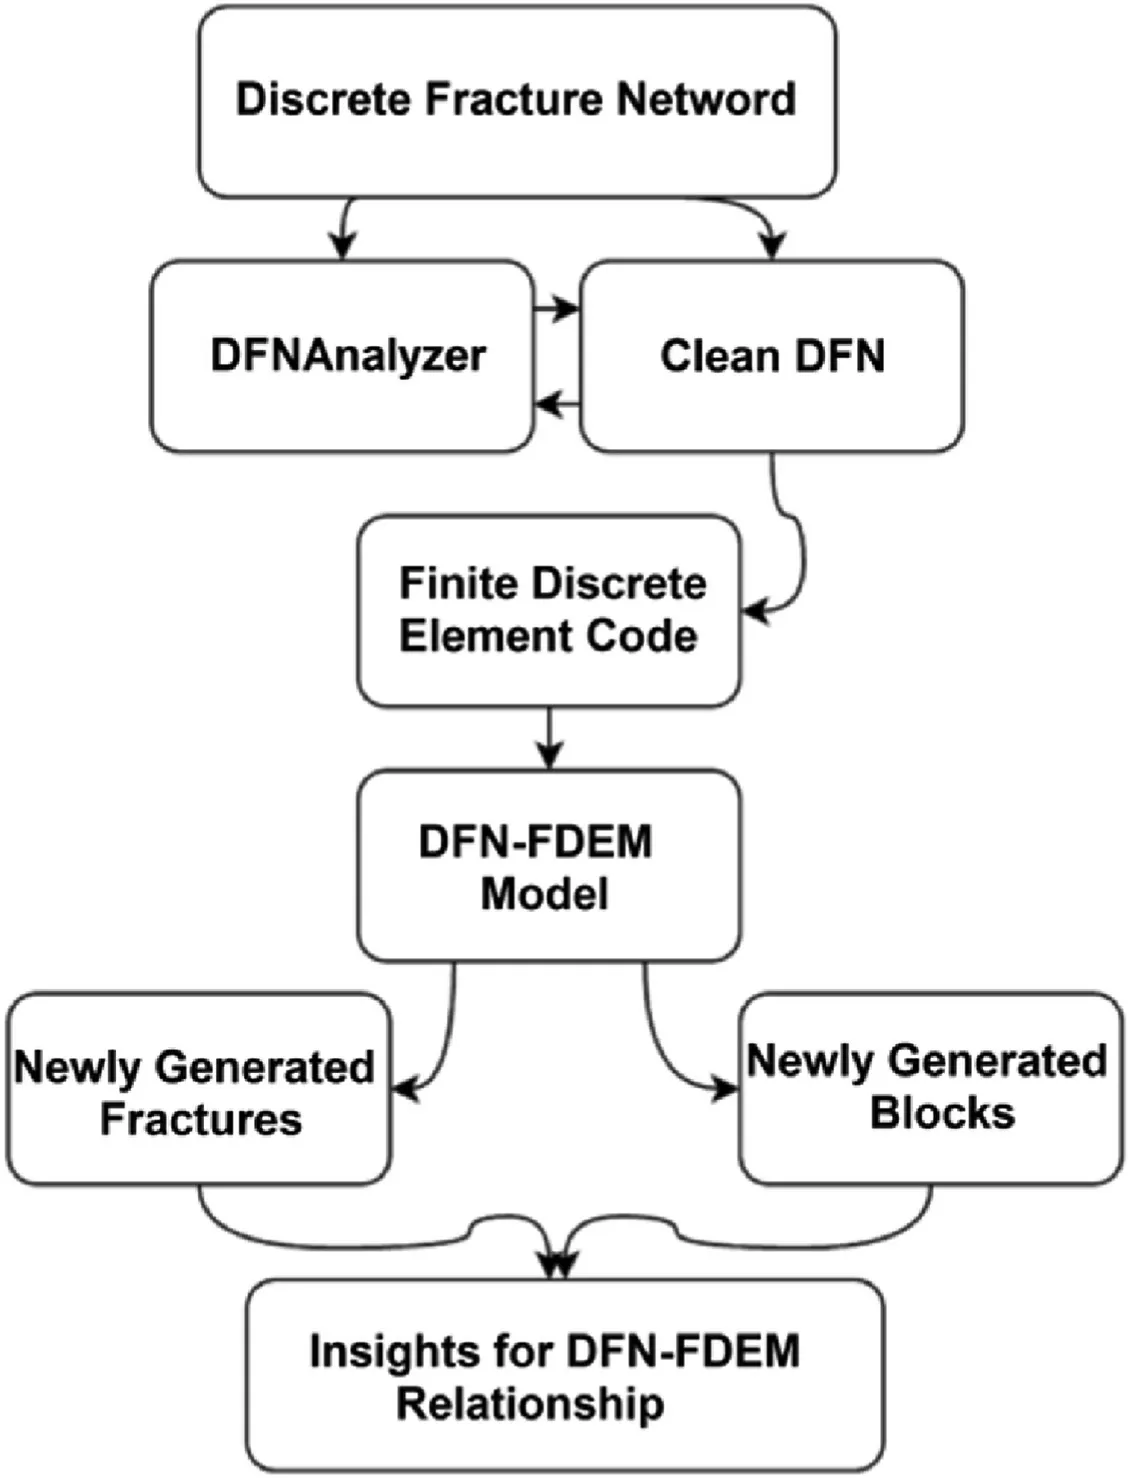
Fig.7.Flowchart showing the different steps used in the current analysis and described in the text below.
(2) Block size distribution(BSD)and passing size parametersB10,B25,andB50(%);
(3) Block size and associated aggregations (Max,Min,average,median and quartiles);
(4) Block size density maps;
(5) Block tracking trees;
(6) Block fragmentation (single block being fragmented in subblocks);and
(7) Block displacement.
These are later described in detail with reference to the FDEM model shown earlier in Fig.5.The number of blocks that are generated during a given simulation time can be plotted in relation to timestep,damage and/or strain.An example is given in Fig.11,which includes the number of blocks per timestep,the number of blocks as a function of the damage parameterD21and,finally,the number of blocks as a function of axial strain.Despite being useful,this type of information alone does not provide direct insight as to how damage would eventually control the mechanical behaviour of the rock mass.The true value of this information will become apparent when combined with data such as block density maps,block tracking trees and block fragmentation.
One obvious approach to block size analysis is the generation of cumulative size distribution plots,as shown in Fig.12.Quantiles could then be used to study how specific block sizes change as the simulation progresses.We suggest that coarser sizes would be more likely to remain constant or show only a marginal decrease with increasing timestep if rock mass failure was predominately structurally controlled.Likewise,spalling failure would be more likely to be indicated by a rapid increase in the number of small size blocks.For better visualisation of block size distribution,block size maps can be generated to show block formation for selected timesteps.An example is provided in Fig.13 with reference to the data included in Fig.12.
Additionally,a novel block tracking tree approach is introduced here as a method that could have important applications in for example rockburst and rock fall investigations.The approach has,at its core,a process that studies the relationship between blocks formed at different timesteps,and a parent-child relationship is defined when an existing block(parent)at timesteptiis broken into several smaller blocks (children) at timestepti+n.At timestepti,block properties(sizes and coordinates)are initially computed.The process is repeated at timestepti+n,with the recording of an additional property that refers to the hierarchy between blocks.In Fig.14a,this process is shown in the form of a graph,in which the nodes represent distinct blocks (at a given timestep),and edges point to those blocks that have fragmented into new sub-blocks in subsequent timesteps.Clearly,this type of dense graph visualisation is not very effective for simulations that involve a large number of timesteps.As an alternative,we have developed a circular tree layout shown in Fig.14b,in which each ring represents the blocks at one particular timestep.This conversion can be completed by organising all nodes that belong to each timestep and positioning them in a circle.The centre of this circle is an arbitrary node as a starting point and the timestep increases outwards.
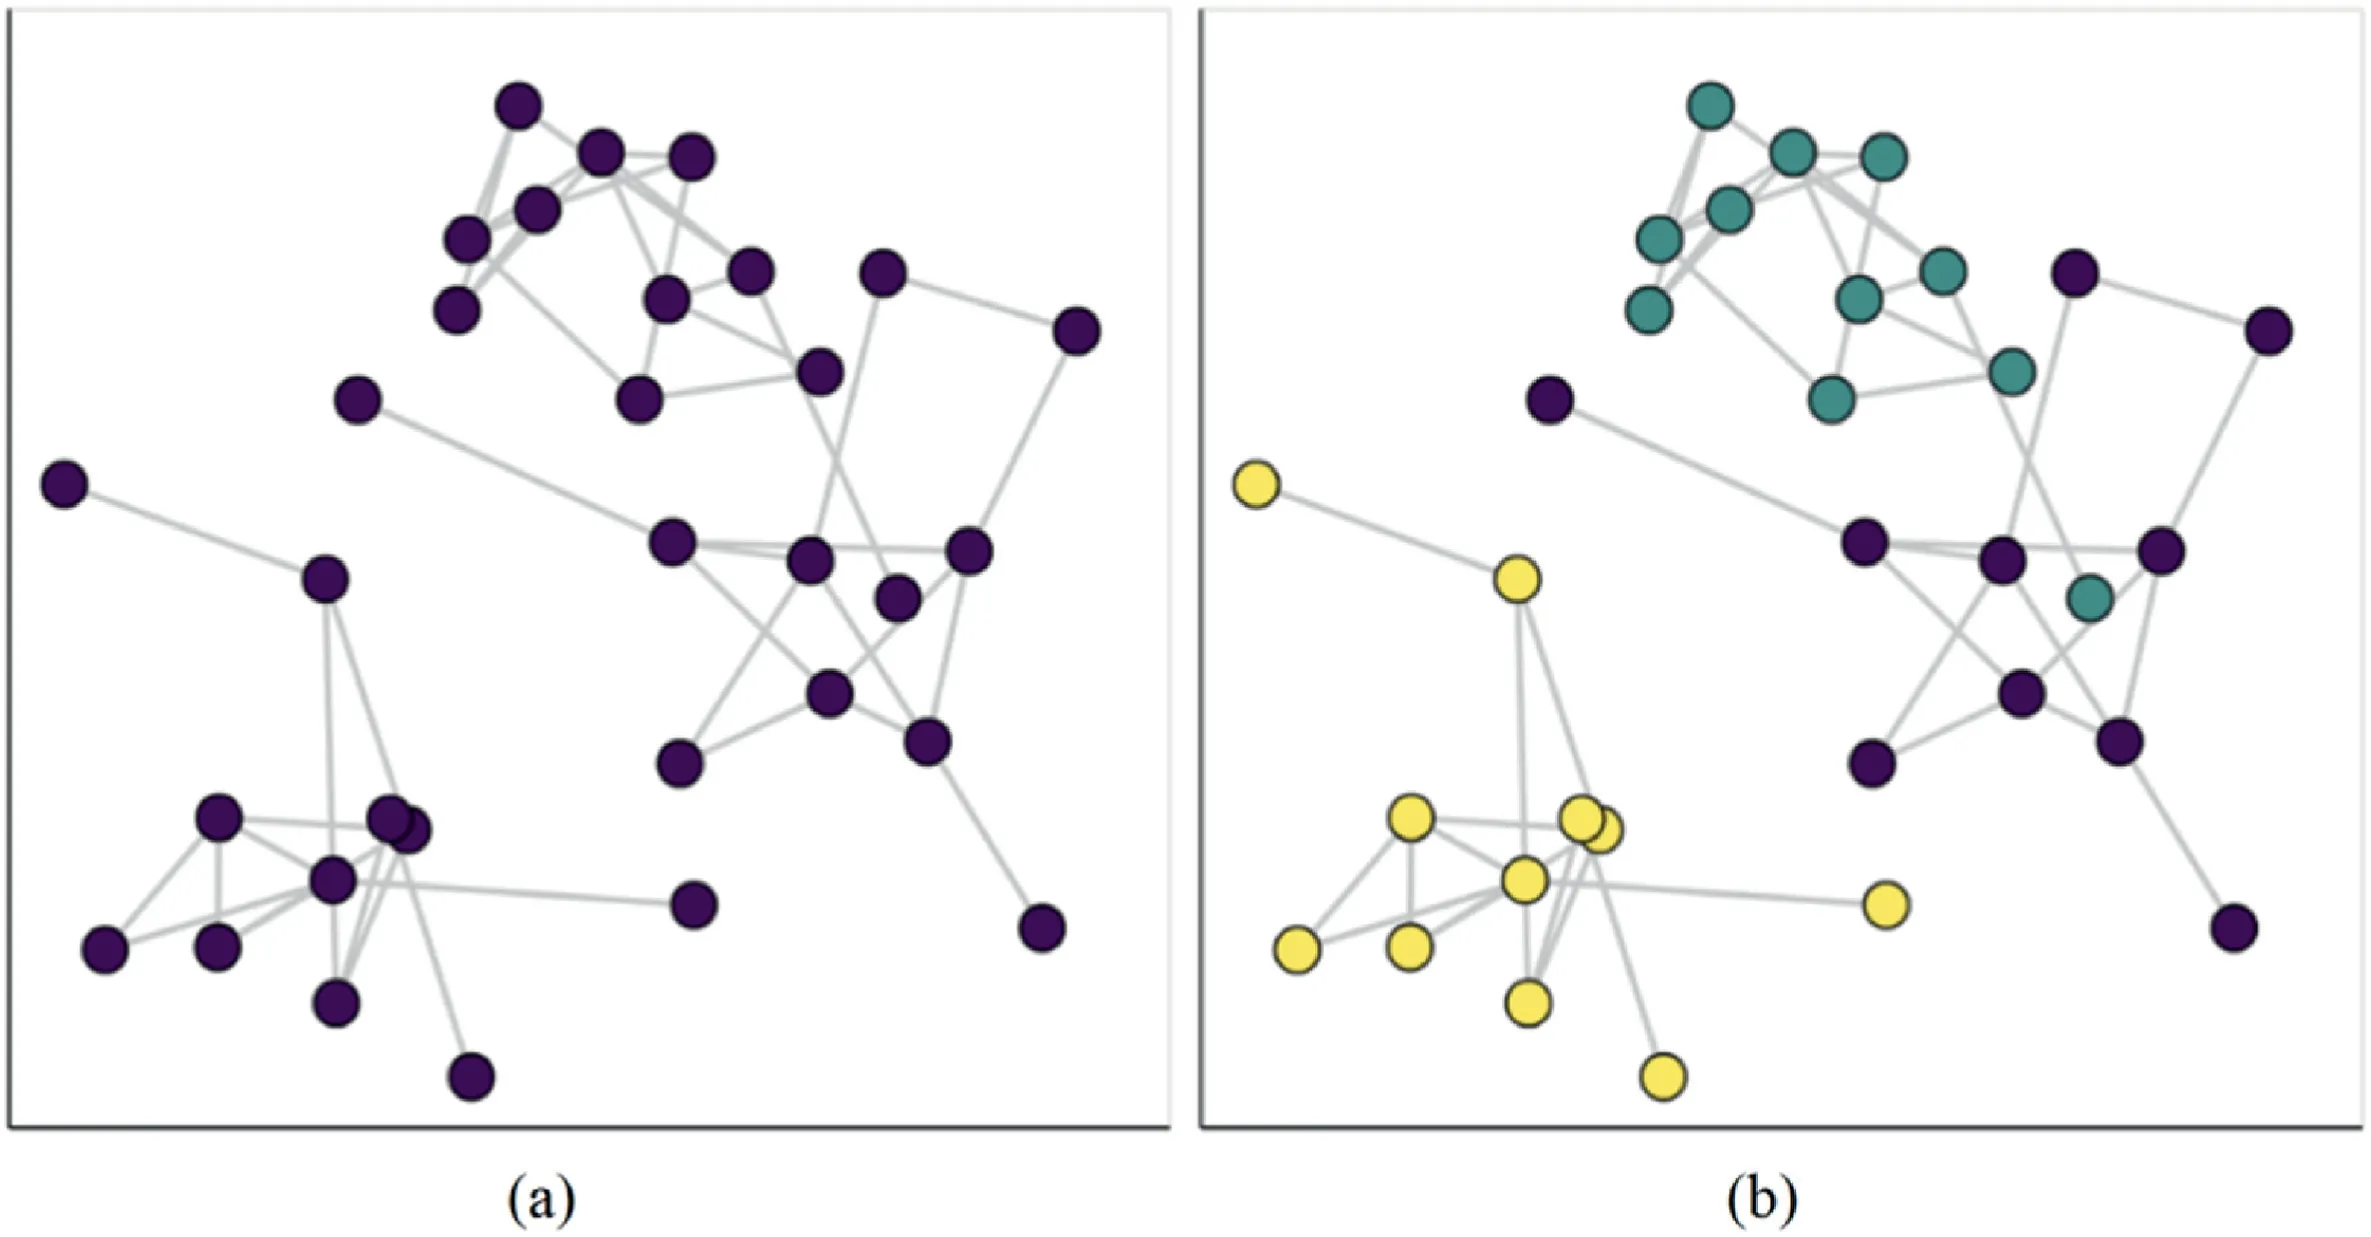
Fig.8.Graph visualisation of block calculator: (a) Element representation;and (b) Three clusters of connected components.
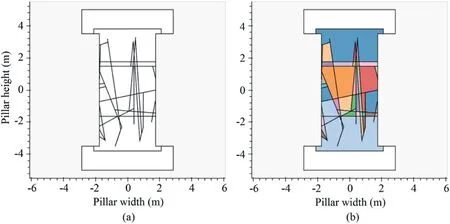
Fig.9.FDEM model of a fractured pillar.Static DFN traces and blocks at timestep 0.(a)Blocks without highlighting connected components;and(b)Blocks highlighting connected components.
Due to the tracking tree layout,it would not be possible to explicitly illustrate the block size and damage by varying the size of the markers.Hence,we need to further refine the visualisation technique to better illustrate the size and damage data along with block properties,in a quantitative manner.This is demonstrated in Fig.15,in which the block tracking tree is updated to include a measurement of the “children” blocks generated from any given“parent” block.Areas within the pillar that does not undergo any significant fragmentation are shown in white.The warm colours refer to areas where a higher degree of damage(i.e.fragmentation)has been simulated.Damage in the simulated pillar appears higher closer to the roof,floor and core,while the sidewalls appear to fragment less,since failure is mostly structurally controlled.Additionally,it is possible to plot (Figs.16 and 17) the number of fragmented blocks (children) generated at every timestep,and colour-code blocks in terms of the simulated displacement and stress.Note that using the FDEM simulation data,the displacement and stress contour maps have been generated.However,a major limitation was noted during this process.The FDEM simulation data can be exported for specific locations termed history points.These history points are often defined along the model boundary.However,as the fractures initiate and propagate,some of the blocks detach from the model.Hence,using this method,the user is unable to keep track of the displacement,stress,velocity and other characteristics of the separated blocks.
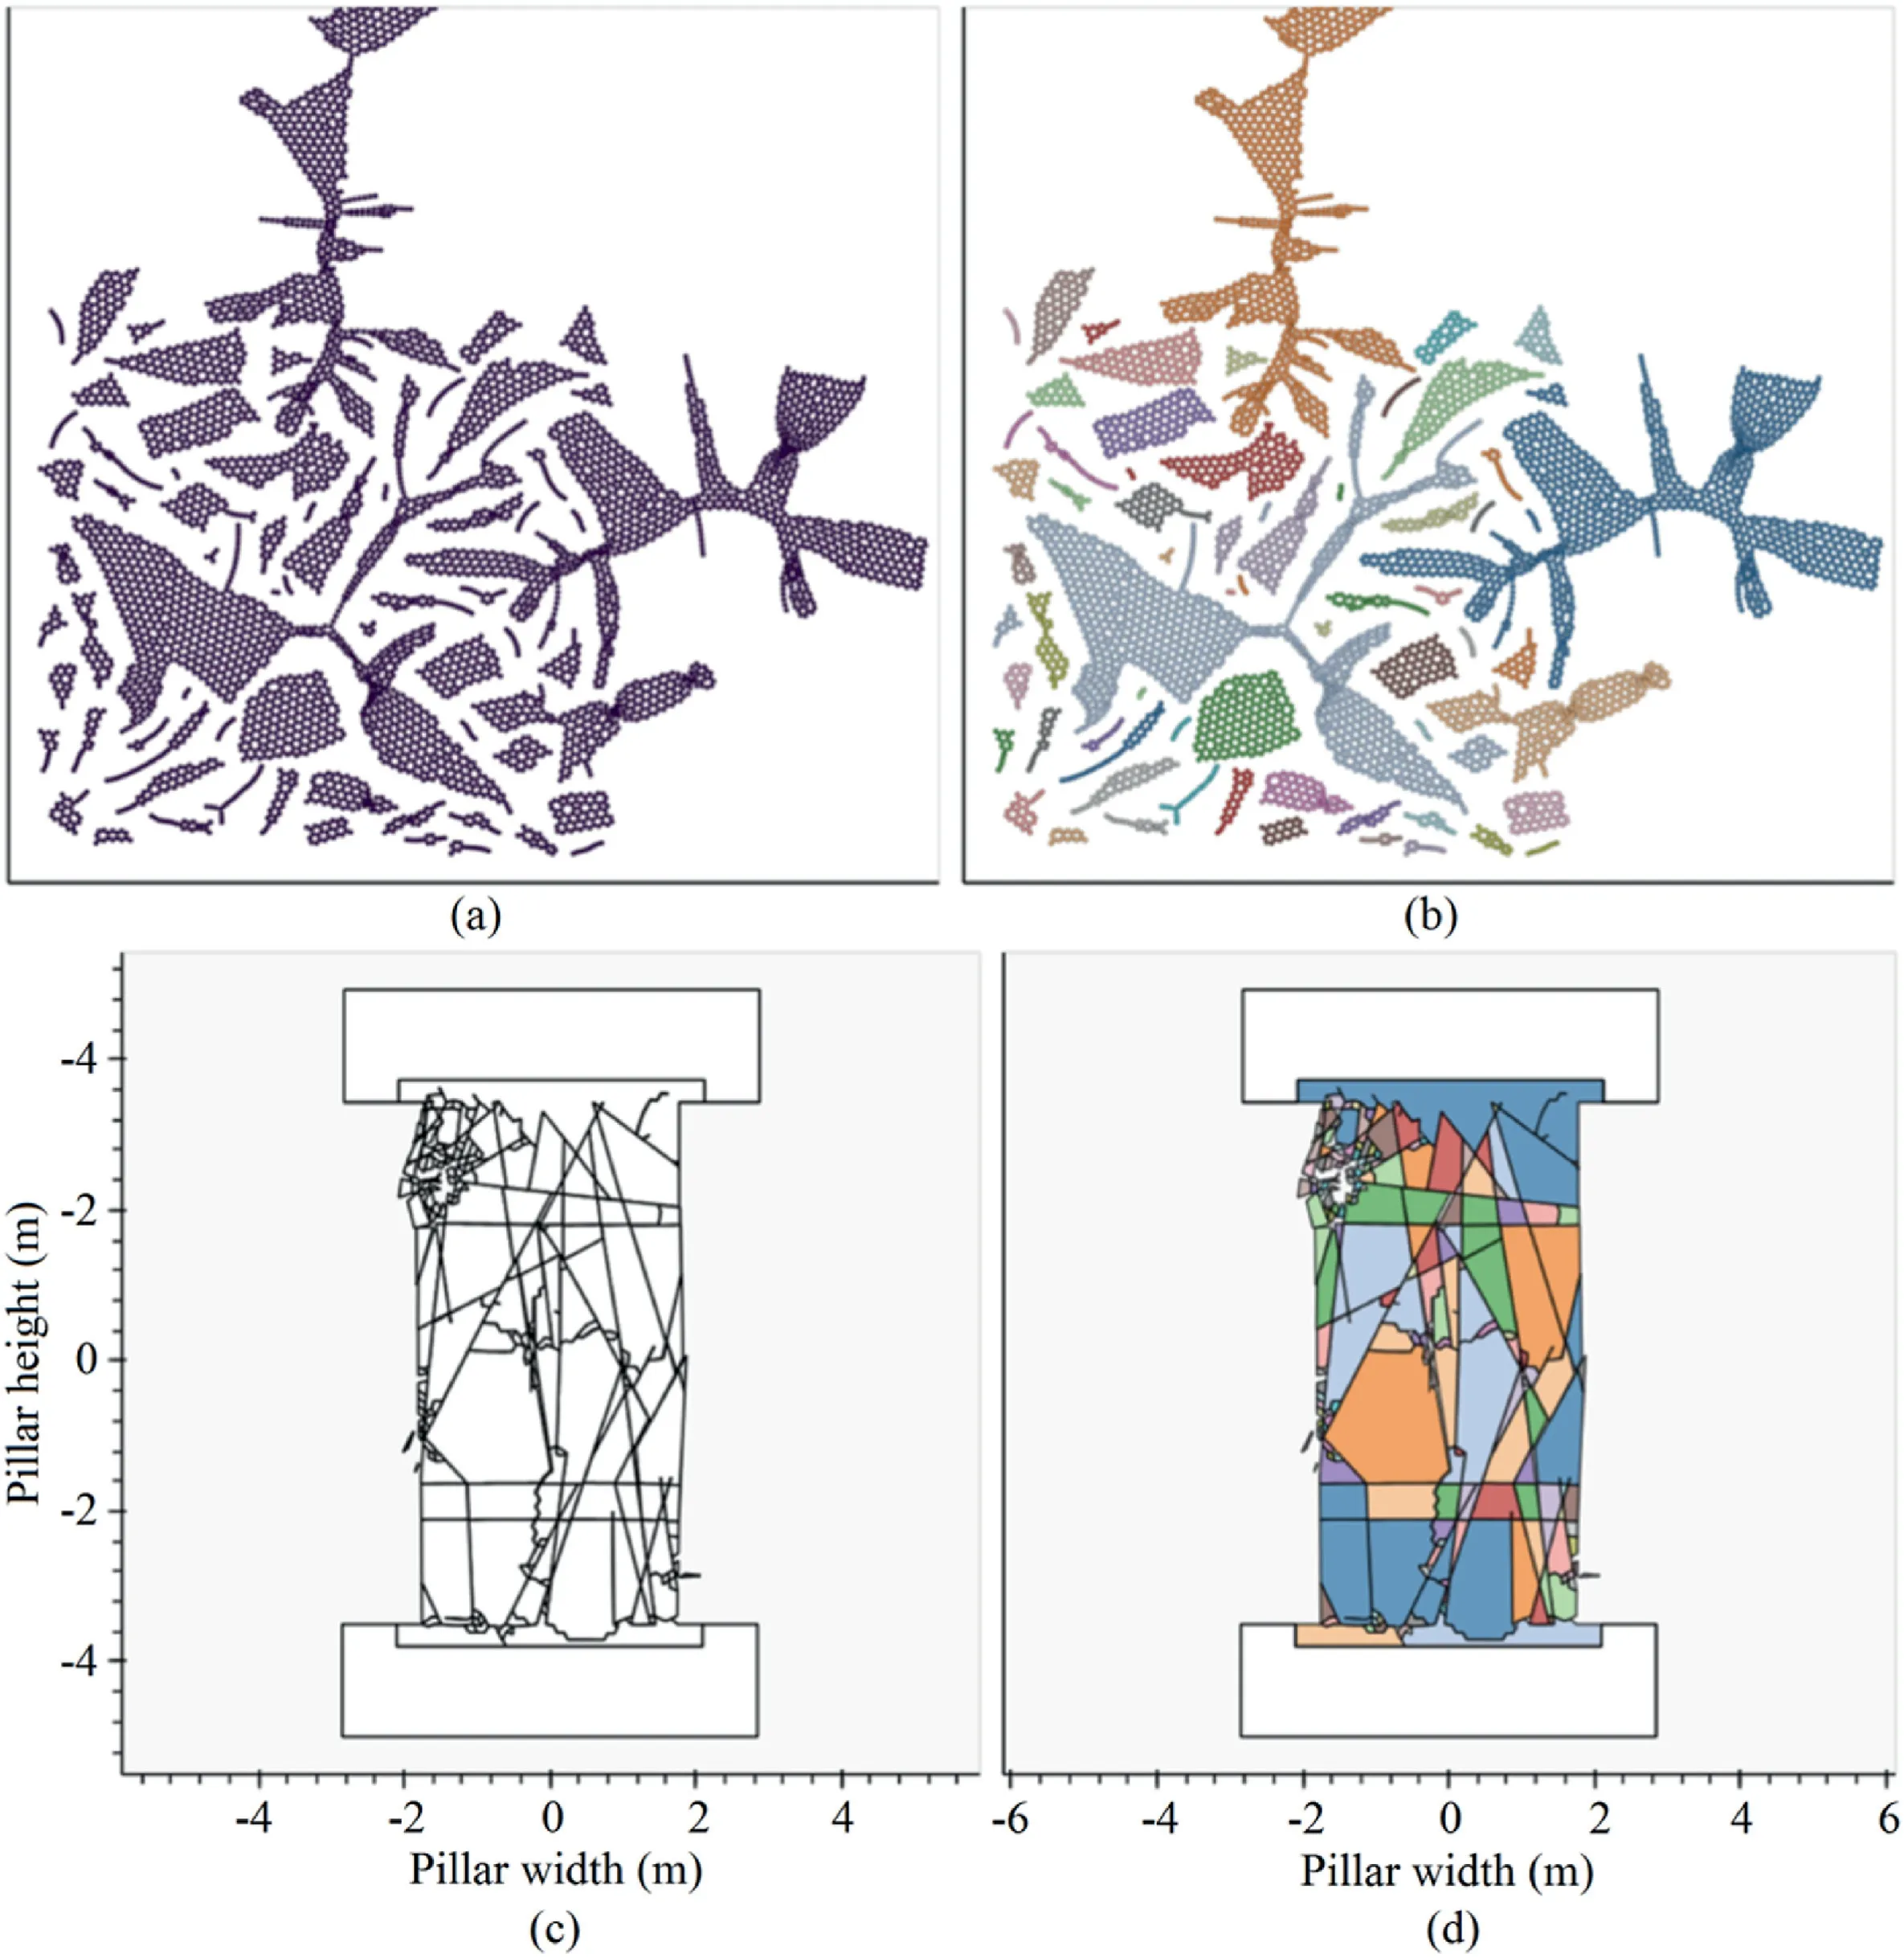
Fig.10.(a) Element representation;(b) Coloured map of connected components;(c) FDEM model of the corresponding fractured pillar showing degree of rock mass damage at t=50;and (d) Associated blockiness map at t=50.

Fig.11.(a) Block count vs.timestep;(b) Block count vs.damage;and (c) Block count vs.axial strain.
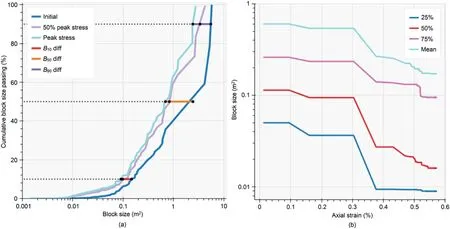
Fig.12.Block size vs.timestep.Mean block size is shown in light blue,median in red,and 25% and 75% of blocks sizes in dark blue and purple,respectively.
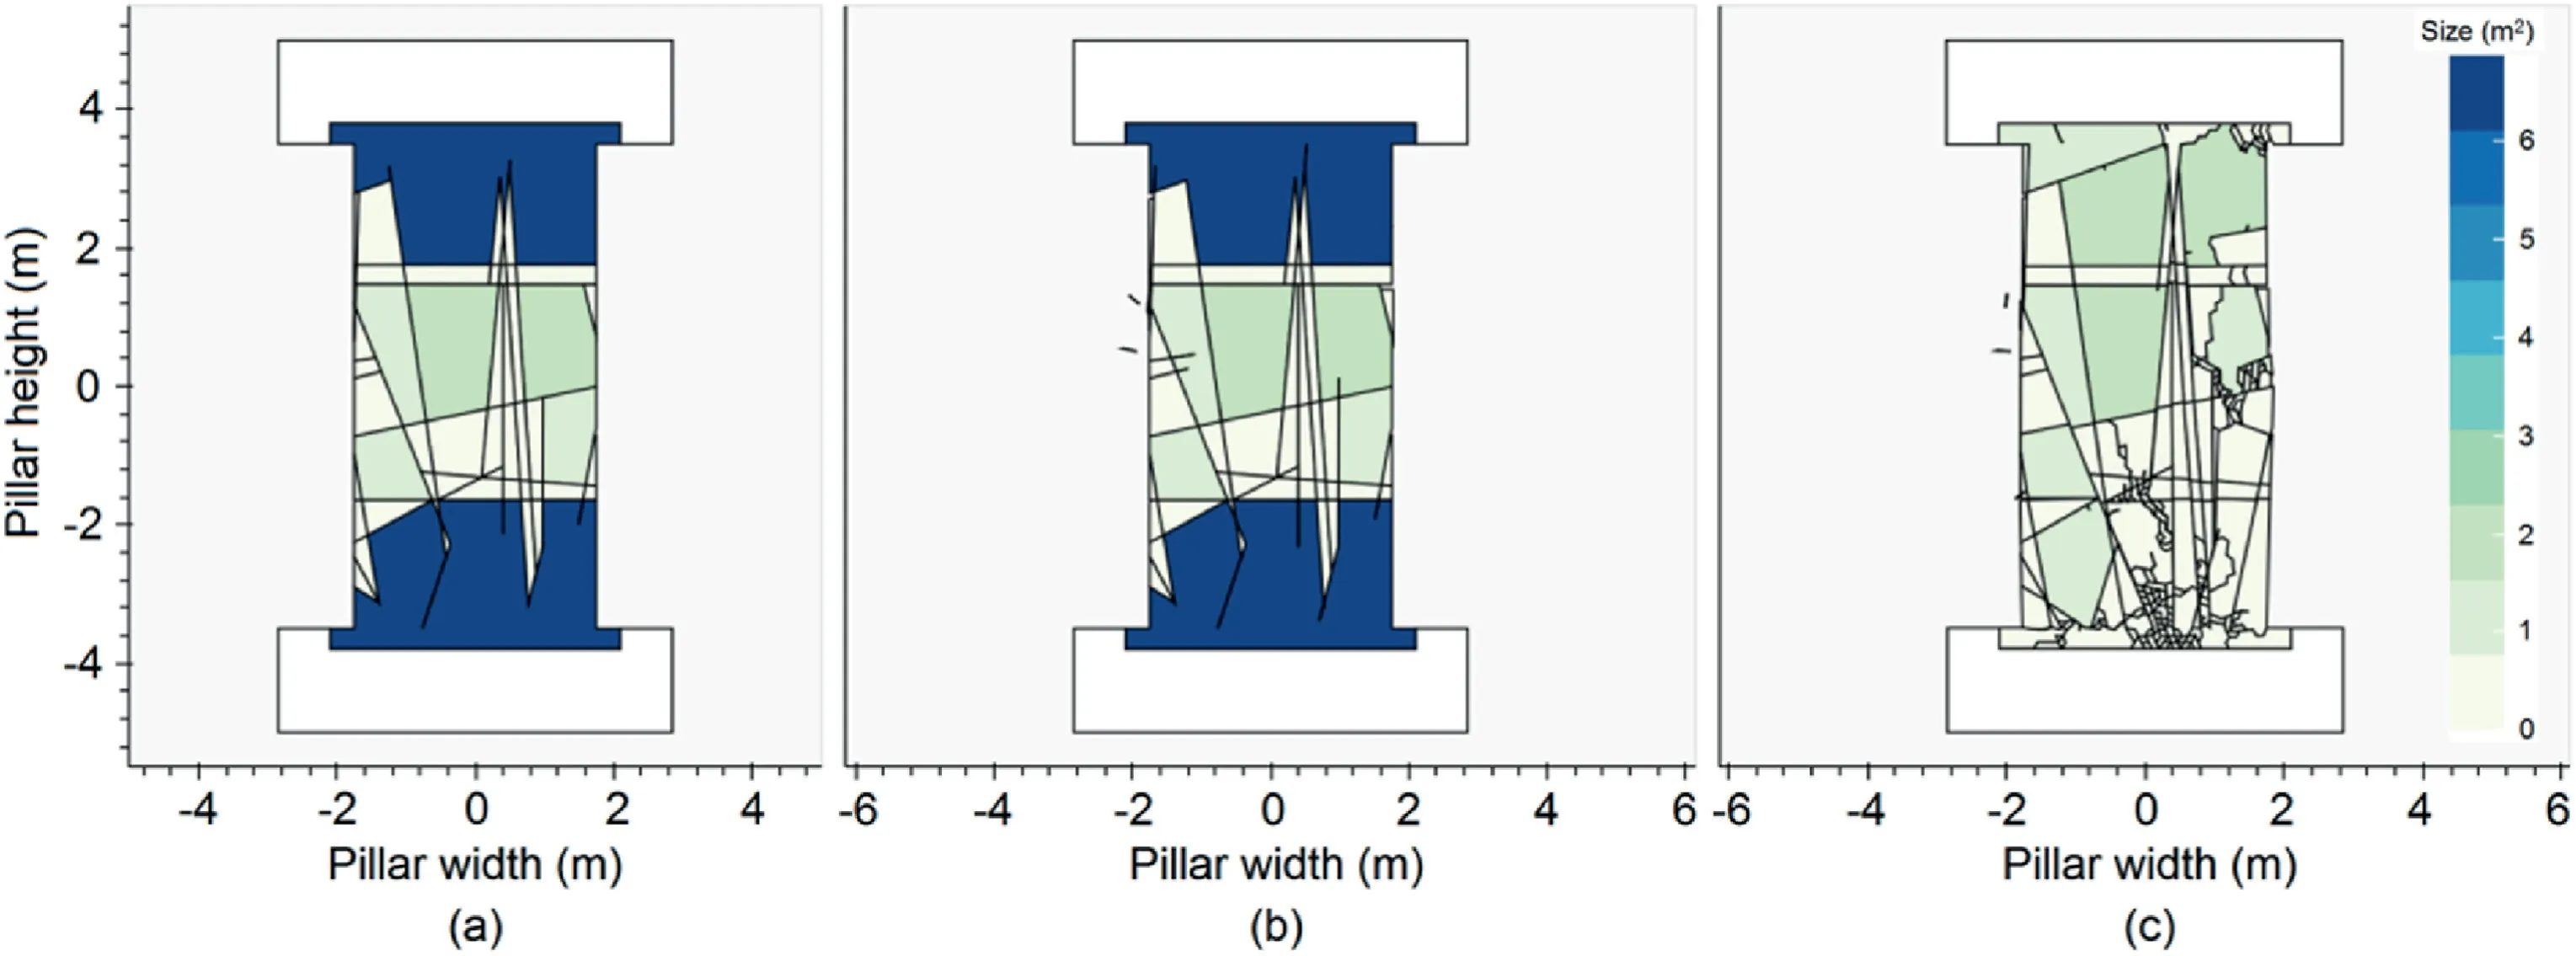
Fig.13.Block size density map visualisation at 3 different timesteps using shared colour density block size: (a) At initial stage;(b) At 50% peak stress;and (c) At peak stress.
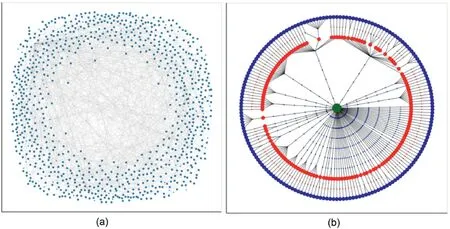
Fig.14.Examples of (a) block tracking tree,and (b) circular tree layout in which green denotes the initial timestep,red the 50% peak stress,and blue the peak stress.The circles correspond to the block size maps shown in Fig.5.
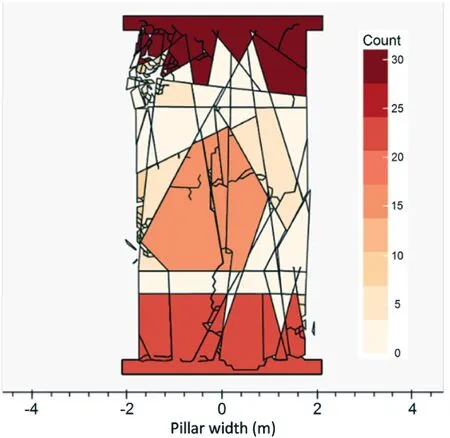
Fig.15.Fragmentation map calculated based on the number of fragmented blocks generated at the peak stress level,normalised to the initial timestep,and shown for each block configuration.
5.Conclusions
We presented a new method to characterise damage processes(initiation and propagation of fractures) using FDEM modelling technique.Understanding the path along which fractures intersect and large and fragmented blocks are created is the key to understand how rock masses with equivalent conditions (defined by fracture intensity and jointing conditions)but different spatial characteristics behave under similar loading conditions.Collecting the mesh element data across timesteps is the starting point in the fracture and block calculation workflow.The following two important aspects should be considered during calculations include: (1) the large amount of data can be collected for a given model per timestep;and(2)the data to be analysed would increase significantly as a function of the assigned mesh element size,and thus the application would have to track a very large number of mesh elements.
We have developed new algorithms to extract newly generated fracture lines from the simulation output using geometrical computations.The proposed algorithm(i.e.DEMFA)uses the extensive amount of mesh data generated during the modelling process.A block calculator algorithm (DEMBC) has been introduced utilising graph analysis.This algorithm provides information on the newly generated blocks at each simulation timestep.A block tracking tree was then introduced to provide a graphical representation of block growth across timesteps.A block fragmentation map was subsequently generated which indicates the number of block divisions throughout the simulation.This map provides a detailed analysis of the fragmented areas.
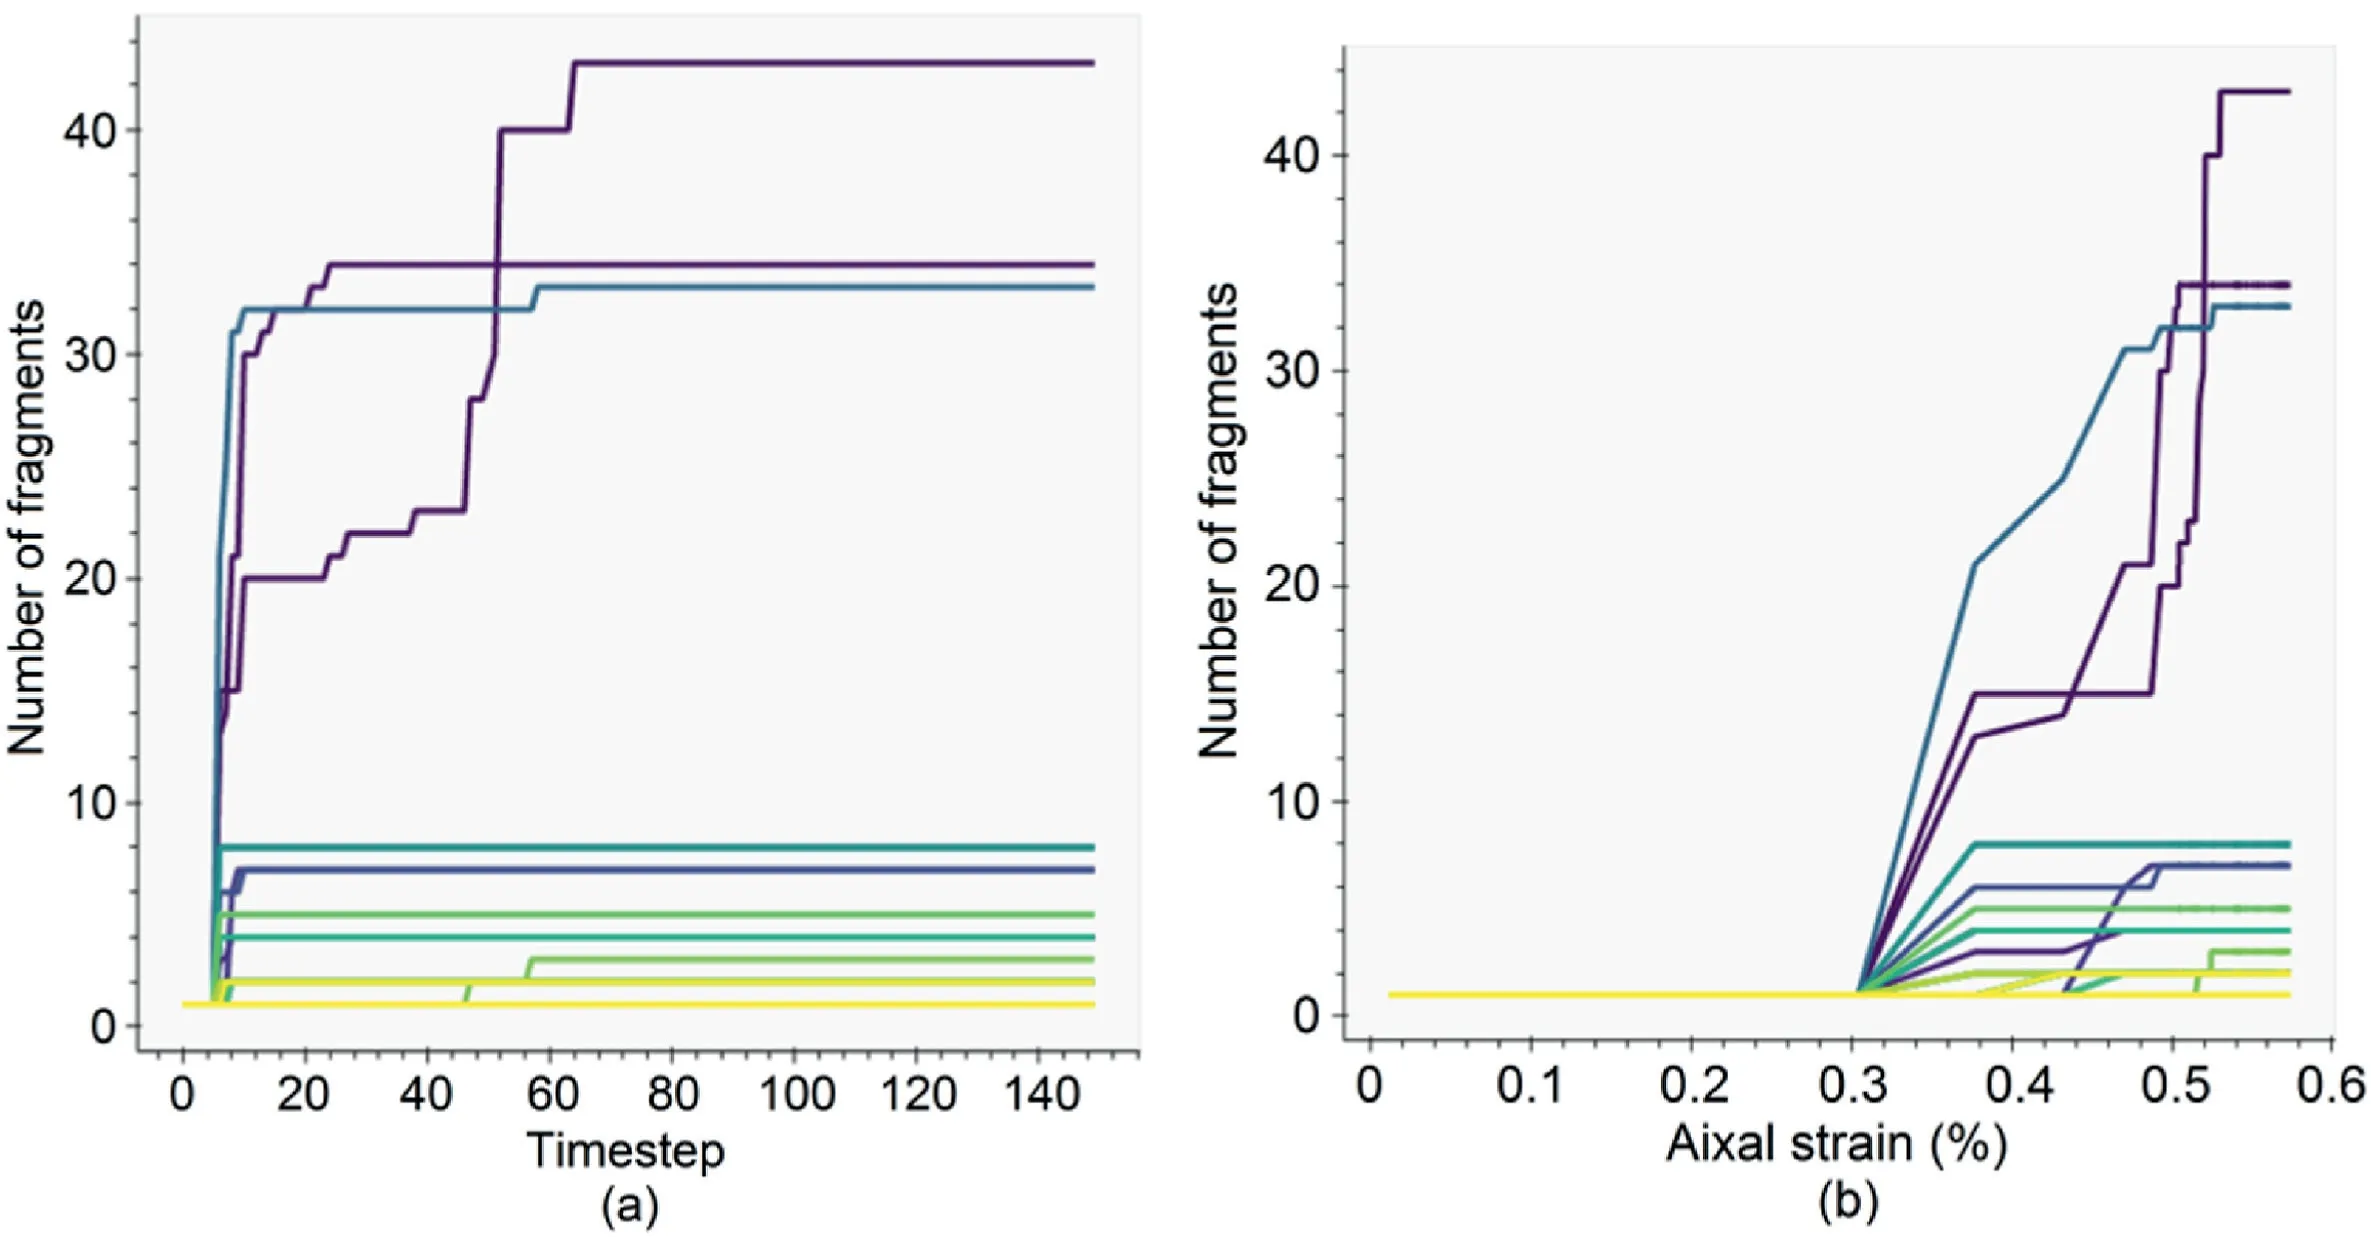
Fig.16.(a) Number of fragments for each block vs.timestep;and (b) Number of fragments for each block vs.axial strain.
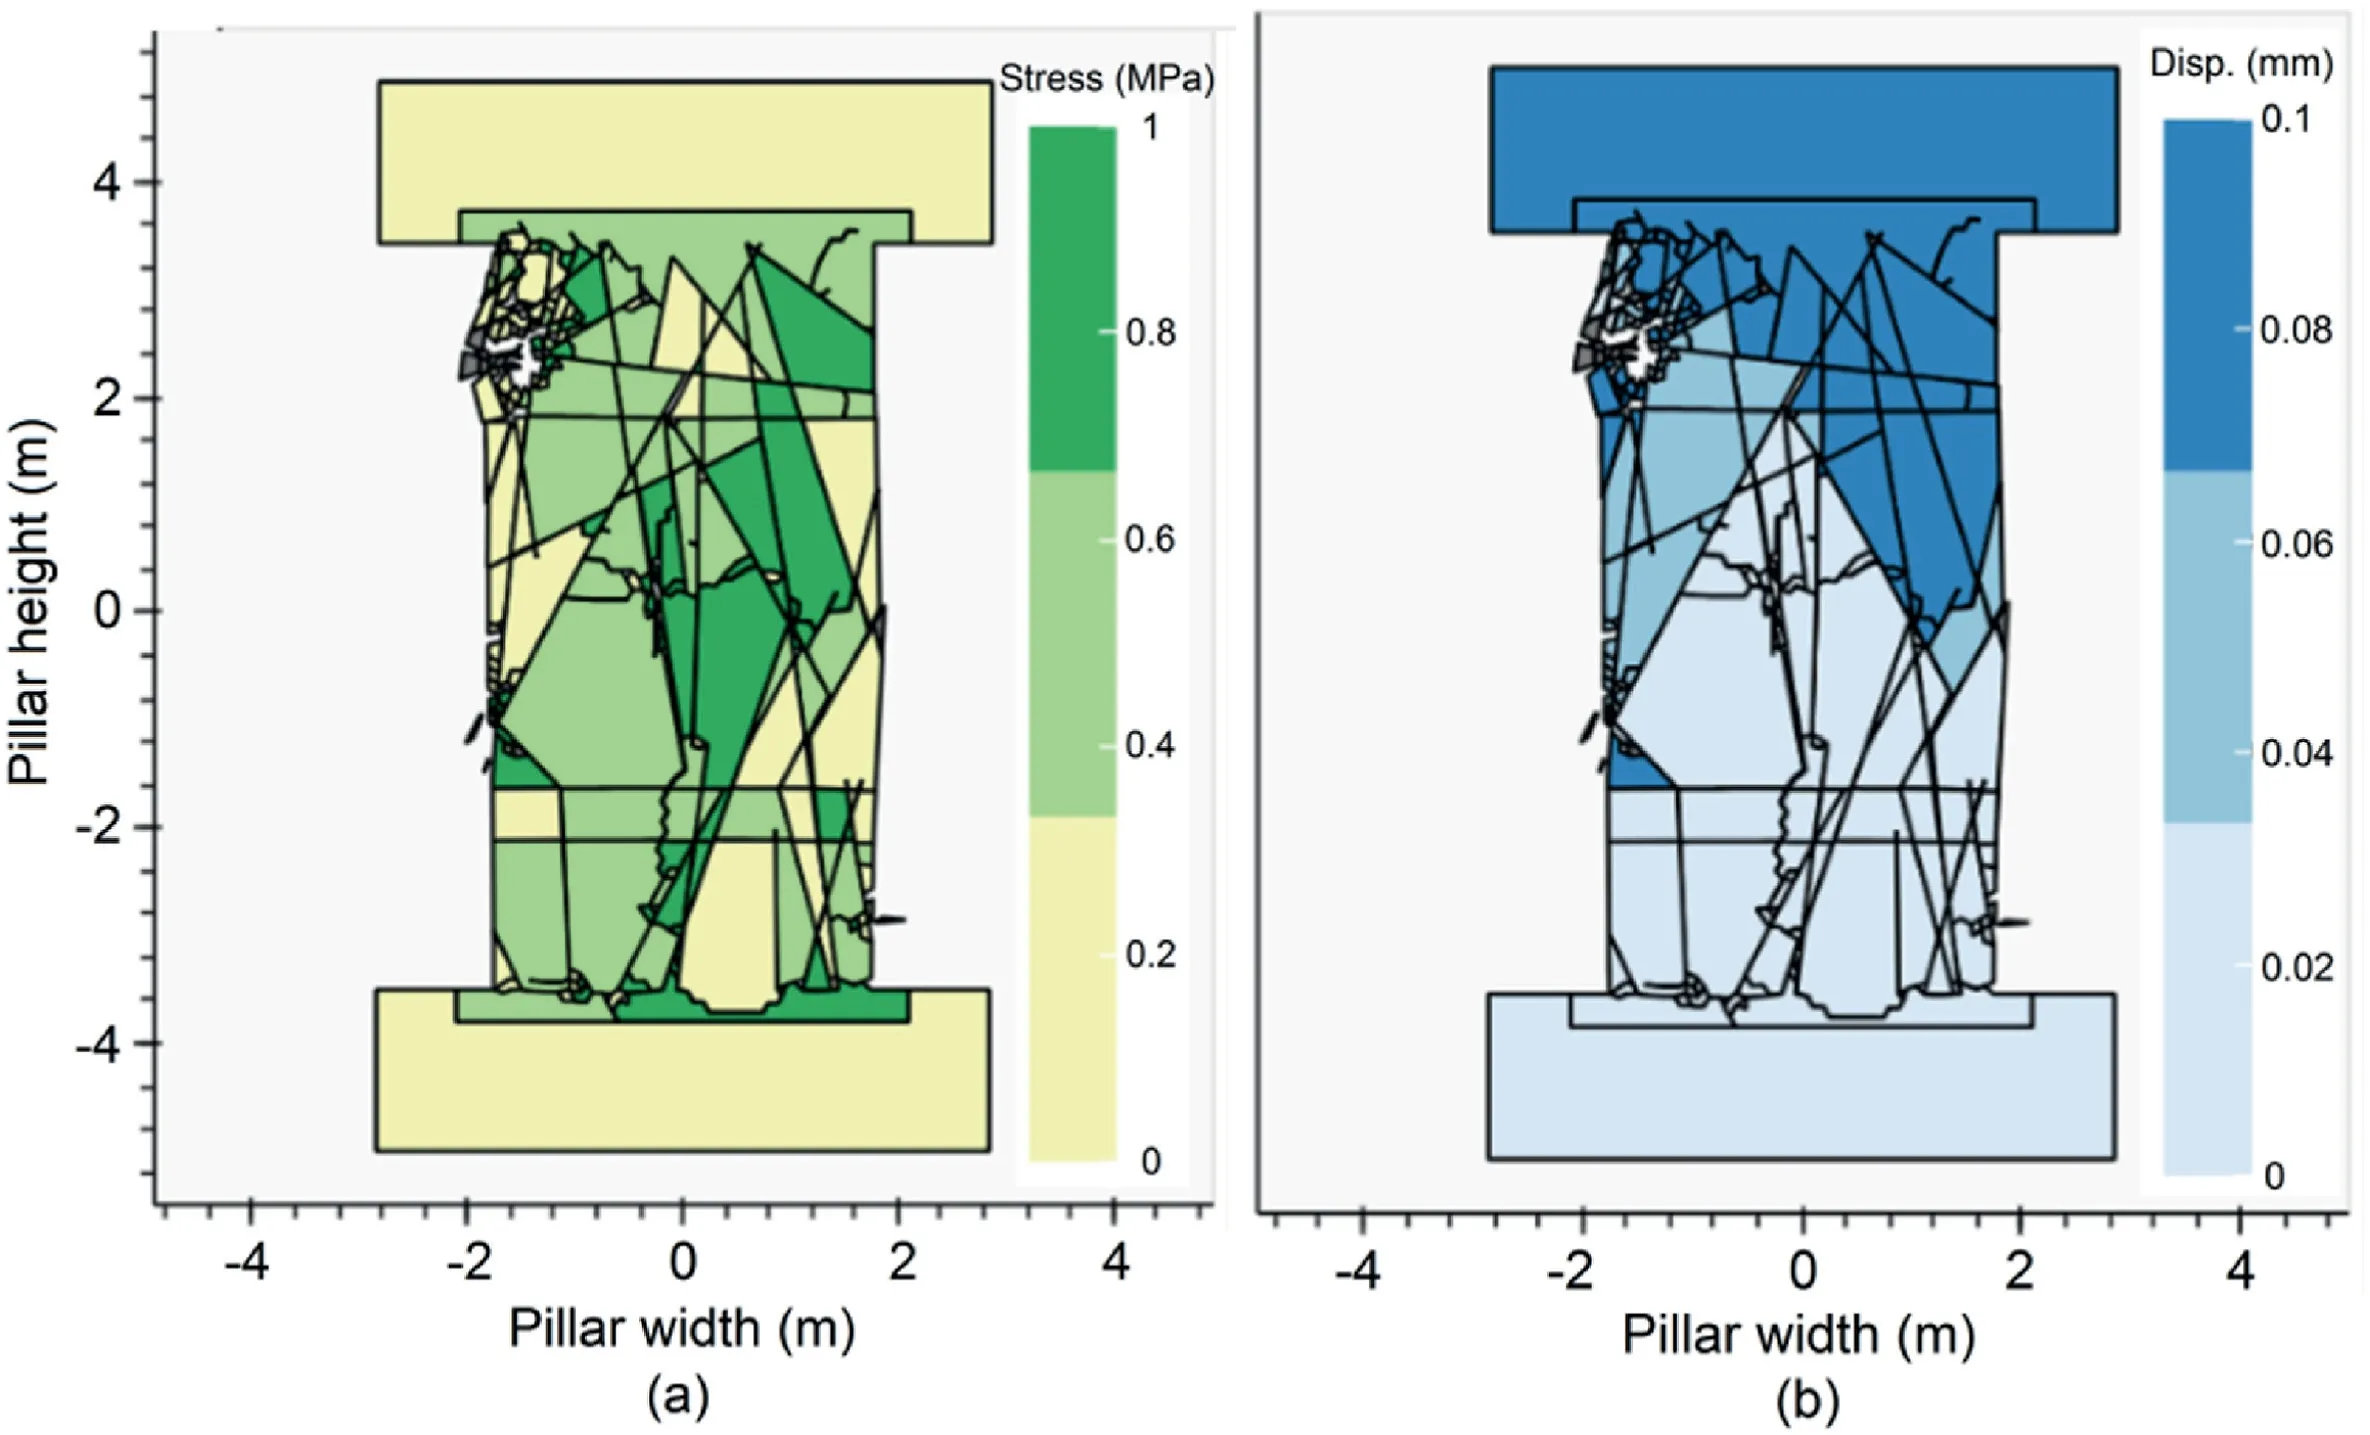
Fig.17.(a) Axial stress of individual blocks at peak stress;and (b) Vertical displacement of individual blocks at peak stress using finite-element simulation output.Grey indicates that the displacement is not output due to the history points located on the model boundary.
Results of 2D numerical analysis of a typical pillar model confirm that the definition of rock mass damage as a real-time analysis process can be achieved using block formation.The developed approaches for extracting fracture lines and blocks provide the engineer with the required information to allow further analysis and pillar failure/damage characterisation.Using a sample pillar model allowed the applicability of the proposed methods to be demonstrated in a sequential step by step process.The cumulative block distribution analysis of the simulation model is completed per timestep and shows that the influence of brittle damage becomes more significant as the rock bridges fail resulting in increased connectivity and the formation of larger blocks.Damage evolution and fracture propagation were analysed with respect to either stress conditions(peak stress)or strain evolution.The coalescence and continued propagation of fractures were monitored in relation to each other.All the suggested approaches have been tested using the pillar model,however,it is emphasised that they are well suited to analyse rock bridge failure and important connectivity problems in a wide range of engineering problems.
The main objective of the paper was to introduce new methods to study how rock mass blockiness changes as the modelled pillars approach failure.Nonetheless,we agree that damage distribution could be spatially variable.Further work will focus on the characterisation of rock mass damage in terms of both magnitude (D21)and spatial location.
Declaration of competing interest
The authors declare that they have no known competing financial interests or personal relationships that could have appeared to influence the work reported in this paper.
Acknowledgements
The author would like to acknowledge the financial support through the Natural Sciences and Engineering Research Council of Canada (NSERC) grants held by Dr.Davide Elmo.
 Journal of Rock Mechanics and Geotechnical Engineering2023年2期
- Journal of Rock Mechanics and Geotechnical Engineering的其它文章
- On the critical particle size of soil with clogging potential in shield tunneling
- Strength and deformation characteristics of irregular columnar jointed rock mass: A combined experimental and theoretical study
- Spatial distribution and failure mechanism of water-induced landslides in the reservoir areas of Southwest China
- Characteristics of electromagnetic vector field generated from rock fracturing
- A multi-purpose prototype test system for mechanical behavior of tunnel supporting structure: Development and application
- Geotechnical investigation of low-plasticity organic soil treated with nano-calcium carbonate
