
Electroluminescence explored internal behavior of carriers in InGaAsP single-junction solar cell
2023-02-20 13:16XueFeiLi李雪飞WenXianYang杨文献JunHuaLong龙军华MingTan谭明ShanJin金山DongYingWu吴栋颖YuanYuanWu吴渊渊andShuLongLu陆书龙
Chinese Physics B 2023年1期
Xue-Fei Li(李雪飞), Wen-Xian Yang(杨文献), Jun-Hua Long(龙军华), Ming Tan(谭明),Shan Jin(金山), Dong-Ying Wu(吴栋颖), Yuan-Yuan Wu(吴渊渊), and Shu-Long Lu(陆书龙),†
1School of Nano-Tech and Nano-Bionics,University of Science and Technology of China,Hefei 230026,China
2Key Laboratory of Nanodevices and Applications,Suzhou Institute of Nano-Tech and Nano-Bionics,Chinese Academy of Sciences,Suzhou 215123,China
Keywords: electroluminescence,S-shaped,InGaAsP solar cell,molecular beam epitaxy
1. Introduction
The quaternary alloy InGaAsP matching with InP has the advantages of variable bandgap from 0.74 eV to 1.34 eV,corresponding to a wide spectrum ranging from the visible to the near-infrared, which makes it a promising candidate for absorber material in both photodetectors[1]and multi-junction photovoltaic (PV) devices[2–4]for space applications. Since Dimrothet al. reported the wafer bonded four-junction GaInP/GaAs//GaInAsP/InGaAs solar cell with a highest efficiency of 46.0% at approximately 500 suns,[5]the InGaAsP solar cell has received more and more attention motivated by achieving higher conversion efficiency.[6–12]In this regard, a better understanding of the internal behaviors of carriers in InGaAsP solar cell should be desired. On the other hand, as is well known, quaternary alloy with different ionic radii is difficult to grow[13]because the miscibility gap inhibits the mixing of constituents within the alloy, different kinds of clustering (atomic ordering, quantumdots-like formations,and atomic content fluctuation,etc.) are preferred to be formed due to the complex internal structure.For example, atomic ordering was taken into consideration more often in GaInP material,[14]quantum-dots-like formation was found in GaAsNP[15]and GaAs(In, Sb)N epilayers related to the incorporation of group V element by analyzing low-temperature photoluminescence (PL) spectra,[16,17]and atomic content fluctuation has been experimentally observed in InGaAsP and InGaAsB epilayers.[18,19]Just like quantumwell(QW)structures,an undulating energy landscape caused by localized potential fluctuations in the band structure was formed.[20]Under these circumstances,localization and delocalization of carriers can be simultaneously existed,which will significantly affect the optical and electrical properties of devices. Unlike carrier dynamics of PL in the absorption thickness of the epilayer, the electroluminescence (EL) may have a potential to conduct an in-depth study on some fundamental physical processes occurring inside p–n junction-based solar cells under forward bias voltage.[21]
To the best of our knowledge, there are few reports on the investigation of internal behaviors in InGaAsP solar cell by using EL spectroscopy.
In this paper,the localized states,carrier transfer,and redistribution in InGaAsP single-junction solar cell with variable injected current are studied by the temperature-dependent EL.Two emission peaks are observed at low temperatures under low excitation. The relationship of power indexαwith temperature shows the competition between two kinds of recombination mechanisms. Besides,the position of continuum bandedge peak displays an inverted“S-shape”tendency with temperature increasing, and the behavior of carriers is discussed.Furthermore, the correlations of integrated EL intensity with temperature under different excitations are also investigated.
2. Experiment
2.1. Epitaxy and fabrication of InGaAsP solar cell
Material growth was performed by Veeco Gen20A dualchamber all-solid-source molecular beam epitaxy (SSMBE)system equipped with arsenic(As)and phosphorus(P)cracker cells. Silicon (Si) and beryllium (Be) were used as n- and ptype dopants, respectively. Before material growth, surface pretreatment of InP (100) substrate was taken in the preparation module at 360°C for 1 h,followed by thermal desorption in the growth chamber at 495°C (measured by pyrometer)within phosphorus(P2)ambient for 5 min. The typical growth temperature was 498°C and the growth rate was 1 μm/h.Figure 1 illustrates the schematic structure of the InGaAsP single-junction solar cell. After epitaxy was completed, the device structure was processed following the standard III–V solar cell device procedure including lithography, development, and electrodes.[10]The cell size was 2.5 mm×2.5 mm.The metal in the frond grid was based on the AuGe/Ni/Au,after the InGaAs contact layer was etched, an anti-reflecting coating (ARC) layer of TiO2/SiO2/TiO2/SiO2was deposited on the devices with an average loss of less than 8%.

Fig.1. Schematic structure of InGaAsP single-junction solar cell.
2.2. Measurement of InGaAsP solar cell
The current density (J)versusvoltage (V) characteristic of the InGaAsP solar cell was tested under AM1.5G spectrum which emitted from the Sun 2000 solar simulator produced by Abet technologies, and a silicon standard solar cell(RR-32-0)was used to calibrate the irradiance. The EL measurements were conducted on the InGaAsP solar cell that had been mounted on the cold finger of a Janis closed-cycle cryostat with a varying temperature range of 10 K–300 K.During EL measurements,the direct current inputs were provided by Keithley 2400 power supply,and the emission signal from the sample was dispersed with a Horiba iHR320 monochromator and detected by charge-coupled device(CCD)detectors.
3. Results and discussion
3.1. Device performance
As shown in Fig.2(a),the device presents a short-circuit density (Jsc) of 32 mA/cm2, an open-circuit voltage (Voc) of 0.56 V,according to a bandgap-voltage offset(Woc)of 0.55 V based on the peak emission wavelength of 1160 nm from EL measurements,and a fill factor(FF)of approximately 75.79%.A conversion efficiency (Eff) of 13.85% is derived. The inset of Fig. 2(a) shows the current–voltage curve under dark condition, according to the solar cell equivalent circuit of the two-diode model, the current density can be expressed asJ=Jsc-J0(exp(qV/nkBT)-1),whereJ0is the reverse saturation current density,nis the ideality factor,kBis the Boltzmann constant, andTis the temperature in unit Kelvin. By fitting the curve, we can infer that the reverse saturation current is about 1×10⁻⁷A,andnis 2.29,suggesting that recombination current dominates in the space-charge region. Figure 2(b)displays the external quantum efficiency(EQE)of the InGaAsP solar cell,the spectral response ranges from 300 nm to 1200 nm, and the maximum value is about 80%. By integrating the directed measured EQE values with AM1.5G solar spectra, the current density is calculated to be 32.8 mA/cm2,which is consistent with the measured value ofJscfrom theJ–Vcurve.

Fig.2. Device performance of InGaAsP single-junction solar cell: (a) J–V characteristic under AM1.5G spectrum, the inset shows the J–V characteristic under dark condition, and (b) external quantum efficiency of InGaAsP solar cell.
3.2. Excitation-dependent EL spectra at 10 K
The EL spectra of InGaAsP single-junction solar cell with a range of injected current from 10 mA to 100 mA measured at 10 K are shown in Fig. 3. For the sake of clarity, the EL intensity is displayed in arbitrary units. In addition to the continuum band-edge peak, a low-energy shoulder peak can also be observed. For the convenience of comparison, PL spectra are deconvoluted by using multiple Gaussian curves as shown in the inset of Fig.3(a). The peak positions with different injected currents are extracted and presented in Fig.3(b). With the injected current increasing, slightly blue-shifts of the two peaks are presented, which is mainly due to the state filling effect.

Fig.3. (a)Typical EL spectra of solar cell under different injected currents at 10 K, with inset showing Gaussian devolution of EL spectrum, and (b)variations of the peak position with injected current.
3.3. Excitation-dependent EL under varying temperature
Besides the emission peak position, the excitationdependent integrated EL intensity of the InGaAsP solar cell is also examined for several different temperatures as shown in Fig.4(in log–log scale). It is apparent that the intensities of band-edge peaks and localized state peaks tend to saturate at high injected current in a low-temperature range,which is normally a sign of the localization phenomenon.[22]Moreover,the tendency becomes linear and sublinear with the temperature increasing. Generally, the integral intensity is proportional to the excitation power, which can be expressed asI∝Pα,whereIandPrepresent the integrated intensity and excitation power, respectively. Andαis the power index whose value depends on whetherIincreases super-linearly (α >1),linearly(α=1),or sub-linearly(α <1),corresponding to different recombination processes.It is said that when the steadystate concentration of excited electrons is much larger than the concentration in material,namely,Δn ≫n,α=2 will be obtained if Shockley–Read–Hall(SRH)recombination is dominant,andα=2/3 will be obtained if Auger recombination is dominant.[23]In our case,as shown in the inset of Fig.4(a),the fitted value ofαis nearly 2 at low temperature and decreases rapidly to 1 at around 150 K,and further reduced to about 0.7 at 300 K.The results suggest that SRH recombination appears to be dominant at low temperatures,and it becomes less effective with temperature increasing.

Fig.4. (a) Variations of integrated EL intensity of continuum band-edge peak with injected current in a temperature range of 10 K–300 K,with inset showing relationship between power index and temperature, and (b) variations of localized states peak position with injected current at different temperatures.
Meanwhile, Auger recombination begins to work, when SRH recombination and Auger recombination are comparable to each other,α=1 is observed. As the temperature continues to increase, Auger recombination dominates the process, which may contribute to the lower short-current density of InGaAsP single-junction solar cell. It is said that rapid thermal annealing can reduce defects in material and prolong the longer minority carrier diffusion length,which leads to more effective transport and collection of photo-generated carriers.[10]Therefore,rapid thermal annealing can be taken to improve the performance of InGaAsP solar cell.
3.4. Temperature-dependent EL spectra under fixed injection
Figure 5 presents the typical EL spectra of InGaAsP solar cell at different temperatures under a fixed injected current of 20 mA. It is found that the intensity decreases with temperature increasing and quenches at about 40 K due to the thermal activation of non-radiative centers. However, the continuum band-edge peak position presents an inverted“S-shaped”temperature dependence. Besides, an asymmetric line shape with a long high-energy tail and relatively faster declining low energy edge is observed when the temperature is higher than 100 K.This phenomenon can be explained by the conventional band-to-band transition model, which predominately reflects the density of states of electronic structure and the Boltzmann distribution of carriers.[24]Similarly,the intensity of the bandedge peak decreases with temperature increasing, which will be analyzed later.
To further study the spectral behaviors of emission peaks,the peak position versus temperature is plotted in Fig. 5(b),Gaussian devolution is alsoused to separate the two peaks.A blue-shift of about 5 meV can be observed from 10 K to 50 K.As is well known,In and Ga atoms in InGaAsP quaternary alloys may randomly fluctuate, according to the Anderson localization concept. This kind of electronic states formed in the disordered region in the continuum band-edge should be localized states,[25]resulting in undulating energy landscape. At low temperatures,free carriers prefer to be trapped at the bottom of localized states due to potential fluctuation at the band edge. These trapped carriers are thermally activated and become more dispersed at higher temperatures,and hence recombine at higher energy states, resulting in “blueshift”. When the temperature continues to increase,the carriers escape from the fluctuation related to localized states in the continuum band, and then the temperature-induced bandgap shrinkage effect occurs, which contributes to a red-shift of 7.6 meV in a range from 60 K to 200 K. However, when the temperature is higher than 200 K,the band-edge peak position displays blue-shift tendency again. As described by band-toband transition model,the spectrum is a product of state density and occupation probability.[24]At higher temperatures,all carriers are thermally escaped, transferred, and redistributed between the fluctuated band and energy valley, and the occupation distribution turns broader and broader, leading to a thermal redistribution and higher Fermi-level-like energy level formed where carriers are recombined as higher-energy emission. Thus, the peak position shifts toward higher energy region. However,the temperature dependency of localized state peak is not distinct at 20 mA,which is mainly due to the states being filled and thus insensitive to temperature.
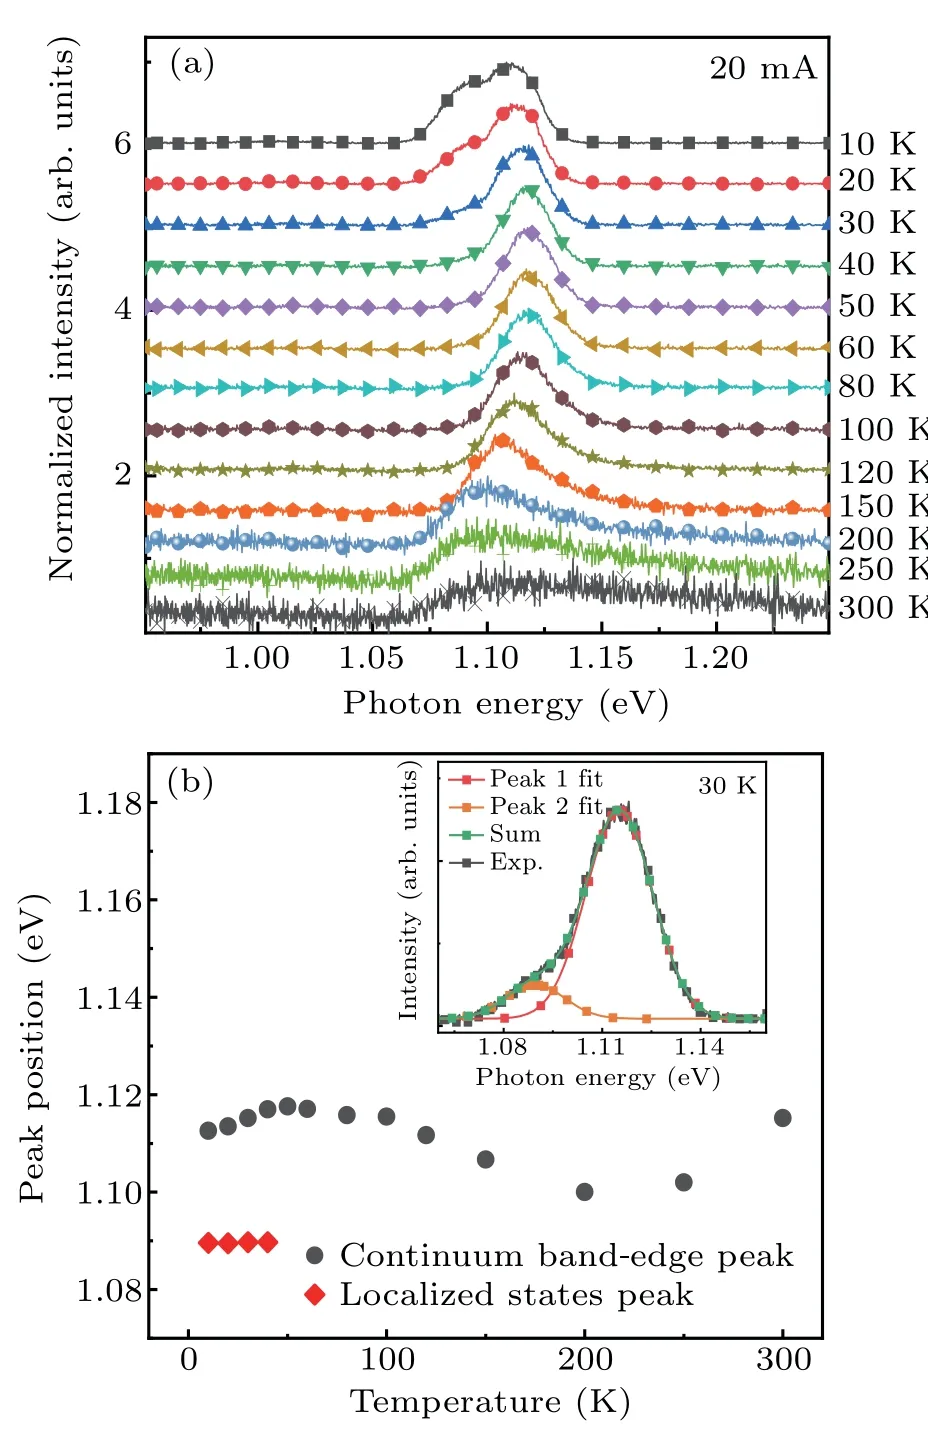
Fig.5. (a) EL spectra of solar cell at different temperatures with fixed injected current of 20 mA,and(b)temperature-dependent peak position.
3.5. Temperature-dependent EL under varying injection
Figure 6 shows the plots of temperature-dependent peak position varying with injected current. A similar inverted Sshape tendency is found for all injection levels. It is obvious that the blue-shift of continuum band-edge peak position from 10 K to 50 K turns smaller with injected current rising,which can be attributed to the band filling effect.[26]Furthermore,as shown in Fig.6(b),the localized states’peak positions all show a blue-shift at 10 mA,while they keep almost stable with the temperature increasing at 20 mA, and begins red-shift when the injected current is over 30 mA.As mentioned in the Introduction,quantum-dots-like formations can be another kind of clustering in InGaAsP alloy,which will induce localized states in the bandgap. Therefore,it is reasonable to assume that the low-energy peak is caused by quantum-dots-like clusters.

To further understand the carrier behavior inside the In-GaAsP solar cell,the Arrhenius-like equation is used to fit the experimental data of the EL intensity,[27]which can be expressed as whereTis the measured temperature,I(T) is the integrated EL intensity,E1andE2are the thermal activation energies of the non-radiative recombination process,C1andC2are the ratio of non-radiative to radiative probability for different nonradiative recombination mechanisms.

Fig.6. (a) The trend of continuum band-edge peak position with temperature rising under different injection levels, and (b) the trend of localized states peak position with temperature rising under different injection levels.
The relationships between intensity and the reciprocal temperature for the continuum band-edge peak position under different injections are shown in Fig. 7. Figure 7 also shows the experimental data of the continuum band-edge peak position are fitted by Eq.(1)under different injections. The fitting parameters are summarized in Table 1. Since the SRH recombination dominates at low temperatures,E1corresponding to SRH recombination is expected to be much smaller thanE2corresponding to Auger recombination. It can be seen from Table 1 that the values ofE1are in a rang of 3.34 meV–6.44 meV for different injected currents. However, the value ofE2monotonically decreases from 66.72 meV to 25.79 meV withginjected current increasing. This phenomenon has also been observed in InAs/GaAs quantum dots.[28]The strong reduction of activation energy at high excitations indicates that electrons and holes escape independently,and tells which type of carriers escape first. Besides, the activation energy is coincident with the barrier height of the faster-escaping carrier.Since the holes are less confined, we can conclude that the faster-escaping carriers in InGaAsP solar cell are holes. Furthermore, the value extracted from the ratio ofE2is 38.6%(25.79 meV/66.72 meV),which is in good agreement with the reported value of 37%in Ref.[28].

Fig.7.Variations of normalized integrated EL intensity with reciprocal temperature for continuum band-edge peak,with solid lines representing Arrhenius fitting results.

Table 1. Fitting parameters extracted by using Eq.(1).
4. Conclusions
In this work,InGaAsP single-junction solar cell grown by molecular beam epitaxy(MBE)is fabricated and studied. TheJ–Vcurve under dark condition suggests that recombination current dominates in the space charge region. The EL spectra of InGaAsP solar cell under a variable injection level at different temperatures are also investigated. The results show bandedge peak and localized states peak at low temperatures under low injection,and the saturation trend of the intensity of both peaks indicates the existence of carriers’ localization. The trend of power indexαextracted from excitation-dependent EL spectra at different temperatures implies that there is a competition between Shockley–Read–Hall recombination and Auger recombination. With the temperature increasing, the value ofαdecreases from 1.85 at low temperature to 0.7 at 300 K, indicating that Auger recombination is predominant,which may responsible for the lower current density in In-GaAsP solar cell.Meanwhile,the anomalous“S-shape”(bluered-blue)trend with the temperature of band-edge peak position is attributed to potential fluctuation and carriers’redistribution in the continuum band-edge,and the blue-shift at high temperature is caused by the broader distribution of escaped carriers. The evolution of localized states’peak position with injection suggests that quantum-dot-like clusters are formed in the bandgap. Furthermore, The EL intensities of InGaAsP solar cell under different injection levels at several temperatures are also examined,and the strong reduction of activation energy at high injection level demonstrates that electrons and holes escape independently and the faster escaping carrier are holes. To further improve the performance of InGaAsP solar cell,rapid thermal annealing should be considered.
Acknowledgements
The authors are thankful to the Nano Fabrication Facility and the Platform for Characterization&Test in SINANO for technical support.
Project supported by the National Key Research and Development Program, China (Grant No. 2018YFB2003305),the National Natural Science Foundation of China (Grant Nos. 61774165 and 61827823), and the Key Laboratory Fund in Suzhou Institute of Suzhou Nano-Tech and Nano-Bionis (SINANO), Chinese Academy of Sciences (Grant No.Y4JAQ21005).
猜你喜欢
速读·下旬(2021年11期)2021-10-12
书城(2020年1期)2020-01-15
快乐学习报·教研周刊(2020年11期)2020-01-03
大东方(2019年12期)2019-10-20
锦绣·中旬刊(2019年5期)2019-09-10
科学与财富(2017年22期)2017-09-10
中国公路(2017年9期)2017-07-25
商情(2017年1期)2017-03-22
四川党的建设(2016年12期)2017-01-03
中共党史研究(2012年1期)2012-04-27

- Chinese Physics B的其它文章
- The coupled deep neural networks for coupling of the Stokes and Darcy–Forchheimer problems
- Anomalous diffusion in branched elliptical structure
- Inhibitory effect induced by fractional Gaussian noise in neuronal system
- Enhancement of electron–positron pairs in combined potential wells with linear chirp frequency
- Enhancement of charging performance of quantum battery via quantum coherence of bath
- Improving the teleportation of quantum Fisher information under non-Markovian environment