
Prediction of flexoelectricity in BaTiO3 using molecular dynamics simulations
2023-02-20 13:16:14LongZhou周龙XuLongZhang张旭龙YuYingCao曹玉莹FuZheng郑富HuaGao高华HongFeiLiu刘红飞andZhiMa马治
Chinese Physics B 2023年1期
关键词:张旭
Long Zhou(周龙), Xu-Long Zhang(张旭龙), Yu-Ying Cao(曹玉莹), Fu Zheng(郑富),Hua Gao(高华), Hong-Fei Liu(刘红飞), and Zhi Ma(马治),2,†
1School of Physics and Electronic-Electrical Engineering,Ningxia University,Yinchuan 750021,China
2State Key Laboratory of High-Efficiency Utilization of Coal and Green Chemical Engineering,Ningxia University,Yinchuan 750021,China
Keywords: flexoelectric effect,molecular dynamics,phase transition,hysteresis loop
1. Introduction
With the rapid development of science and technology,smart devices are becoming ever more intelligent and portable,but the size of the device is to be smaller and smaller.Recently,nanogenerators,[1]nanocapacitors, energy harvesters,[2,3]and actuators are considered to be very promising technologies,in which flexoelectric effect will play a key role. So the larger flexoelectric effect is desired.A new method of measuring flexoelectric response on freestanding cantilever beams by using nanoindentation instrumentation has been presented.[4]The measured flexoelectric response of ferroelectric ceramics is usually several orders of magnitude larger than the theoretically calculated response.[5]Flexoelectricity has aroused more and more interest due to the fact that flexoelectricity is the fourth rank tensor and appliable for nano-scale devices under certain conditions.
Normally,the flexoelectric effect occurs in nonuniformly deformed dielectrics and the deformation induced polarization is usually proportional to the strain gradient. Since the strain gradient can break the inversion symmetry of even a centrosymmetric crystal, flexoelectricity even exists in nonpiezoelectric material. So the flexoelectric effect is possible to occur in dielectrics of any symmetry. It has a wider scope of applications. Thus,the flexoelectric effect plays an important role in describing the interaction between elastic strain and free electrons in a non-piezoelectric crystal. When the deformation of the dielectric can be made very large in the sense of nanoscale, the polarization caused by the flexoelectric effect becomes more obvious and therefore it will have a practical value and diverse applications.
In the early stage of research on flexoelectric effect, all earlier investigators agreed that the effect is tiny in simple crystalline dielectrics. The flexoelectric coefficient is relatively small, about 10-9C/m.[6]Later, Ma and Cross[7–9]obtained large flexoelectric coefficients of some piezoelectric materials through a series of experimental tests, and they reported that the flexoelectric coefficient of barium strontium titanate(BST)can reach 10-4C/m,which is five orders of magnitude higher than the theoretically predicted value. However,the microscopic mechanism and macroscopic mechanism of the extremely large flexoelectric effect are still not clear.
With the development of computer technology,the theoretical calculation of flexoelectric effects has achieved a breakthrough in this century. Maranganti and Harma developed core–shell modeling methods to performab initiocalculations for the flexoelectric coefficients in some semiconductor materials.[10]The first-principles calculated flexoelectric coefficient is between 10-8C/m and 10-10C/m, which is basically consistent with the theoretical value,[11,33]generally much smaller than the experimental measurement. This discrepancy between experimental result and theoretical result remains unexplained to date.
In fact, there are many difficulties in accurately measuring the flexoelectric coefficient. Recently, two approaches to measuring the flexoelectric parameters were developed: one is a cantilevered beam based dynamic approach and the other is an approach based on static measurement by using severalpoint bending fixtures. The point bending is more popular.However, for the cause of the brittleness, the deformation of the dielectric sample cannot be made much larger. The flexoelectric coefficients can only be determined from a few small bending cases. On the other hand,the flexoelectric coefficient of the bending strip is usually obtained under the condition of a certain fixed length. As is well known, the longer the free length of the sample,the greater the generated strain gradient will be. Thus when the flexoelectric coefficient is determined,the effect of this factor cannot be ignored,either.
Barium titanate (BaTiO3) is part of the most widely investigated perovskite-type ferroelectrics and possesses many technological applications. Either in theory or in experiment/simulations, BaTiO3is really a much better model for comparative research. In this work, we consider the influences of different loading conditions on the flexoelectric coefficient of BaTiO3and propose a general method of predicting the flexoelectric coefficient.Since much physical infromation cab be obtained from molecular dynamics simulation on a nanoscale and a relatively continuous strain gradient can be made to extremely large,it is believed that the predicted flexoelectric coefficient from this method is more accurate,and the effect of bending angle on the flexoelectric coefficient can be fully revealed.
2. Theory and methodology
In classical molecular dynamics,each molecule is considered as a point mass and Newton’s equations are integrated to compute their motion.From the motion of the ensemble,it can extract a variety of useful microscopic and macroscopic information.It contains all the physics of the model system in a potential function from which the individual force equations can be derived for each atom. In this work,the molecular dynamics method is used through LAMMPS.[12,13]The model employed in the simulation is the adiabatic core–shell model proposed by Mitchell and Fincham.[14]The schematic diagram of the core–shell model is presented in Fig.1.And it takes the interaction potential parameters used from the core–shell model potential function developed by Sepliarskyet al.,[15]which are summarized in Table 1. The core–shell model is widely used in the simulation of perovskite oxides because it can consider both ion polarization and electronic polarization. The core–shell model is composed of a positively charged core and a negatively charged shell. Since the shell is massless,the shell is very sensitive to the movement of the core. During the simulation,one way is to assign a small mass to the shell to make the shell and core have a similar movement. It has proven this method effective in numerous researches.[14–16]
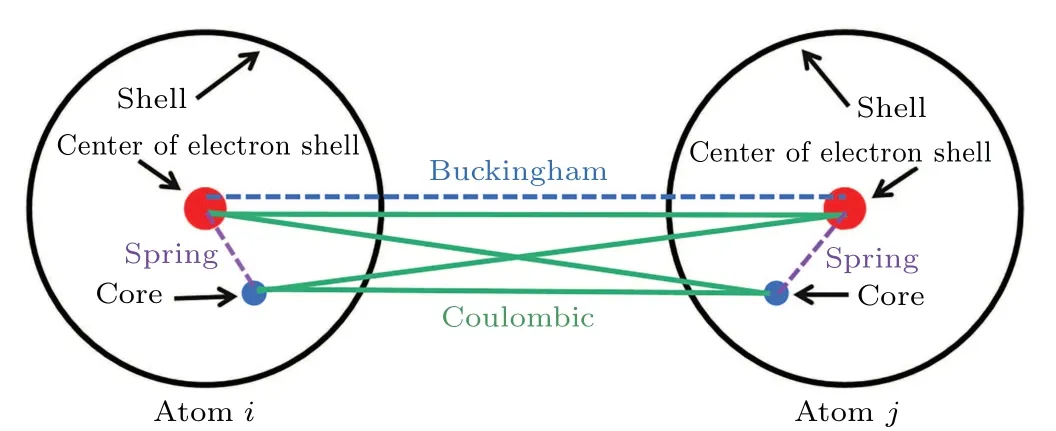
Fig.1. Schematic diagram of core–shell model, which is composed of a positively charged core and a negatively charged shell.
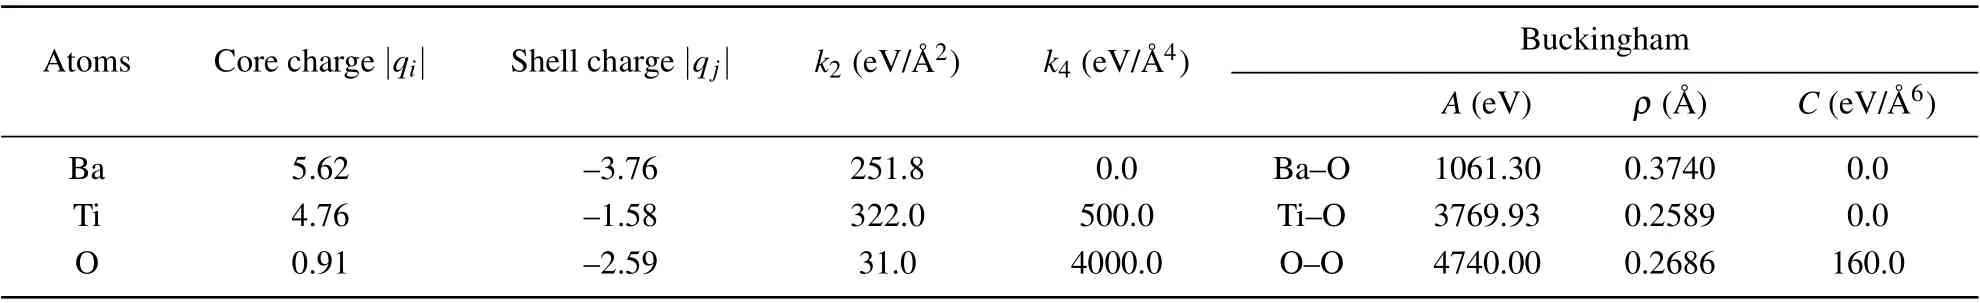
Table 1. Parameters for core–shell model of BaTiO3 ferroelectrics.[15]
The interaction potential of BaTiO3core–shell model comprises three parts. The first part is the potential that is the short-range interaction between shell–shell and described by Buckingham potential. Buckingham potential reflects the repulsive force and van der Waals gravitation between shell–shell. The formula is as follows:

Here,ri jis the distance between two core–cores, andA,ρ,andCare the parameters of the potential. The second part is the potential that is the Coulomb potential, which considers the long-range electrostatic interaction between two particles.The Coulomb potential reflects the core–shell interaction between different particles. The potential is

Here,qiandqjare the charge of particlesiandj,ε0is the vacuum permittivity. The third part is the interaction between the core–shells of the same atom. The interaction between the core and the shell of an atom is treated exclusively as anharmonic spring with the potential parametersk2andk4. The formula is written as

Classical molecular dynamics is a useful computational tool for simulating the properties of liquids, solids, and molecules. From the motion of the ensemble of atoms,it can extract structural or conformational properties from the simulation process. In studying the radial distribution function,the phase transition and its behavior under an applied electric field can be obtained. A size of 10×10×10 supercell, which consists of 10000 atoms,is established. Both the periodic boundary conditions and the conjugate gradient method are used in this simulation. This method needs a small amount of storage, has step convergence and high stability, and requires no external parameters. All the equilibrium processes of molecular dynamics simulation use the NPT ensemble. The pressure control method adopts Nose–Hoover pressure control,and the damping parameter is 0.4. Unlike the equilibrium process,the NVE ensemble is chosen for the calculations of flexoelectric effect and the radial distribution function.Because of the high vibration frequency of the shell,we adopt a time step of 0.4 fs,which is enough small for the entire simulation process. In addition,when the flexoelectric effect of BaTiO3is studied,a cantilever beam structure with a size of 64×8×8 supercell is established, which consists of 40960 atoms. One end of the cantilever beam is fixed,and then a downward(asYdirection)force is exerted on the other end. After continuous testing,we impose periodic boundary conditions in theZdirection, nonperiodic ones in theXdirection,and shrink-wrapped boundary condition in theYdirection.
3. Results and discussion
3.1. Radial distribution function
The radial distribution functiong(r) is used to describe the distribution of the distance between atoms in the system.[17,18]At the distancerfrom the fixed atom, the average number of atoms in the shell with the width dris denoted asn(r). In the method of calculatingn(r), all atoms in the system are regarded as solid atoms,thus then(r)of each solid atom can be calculated,and finally the mean value is obtained.If the atoms in the system are evenly distributed, the ratio ofn(r) to the total number of atoms in the shell is described as the radial distribution functiong(r)below:

whereg(r)depends on the structure of the crystal.For an ideal crystal,g(r)has an infinitely tall peak at a certain distance.
In order to better understand the stability of the established BaTiO3model and its microscopic behaviors at different temperatures, the radial distribution functions (RDFs) of BaTiO3with anR3mphase structure are calculated at four different temperatures of 10 K,50 K,100 K,and 150 K,respectively.
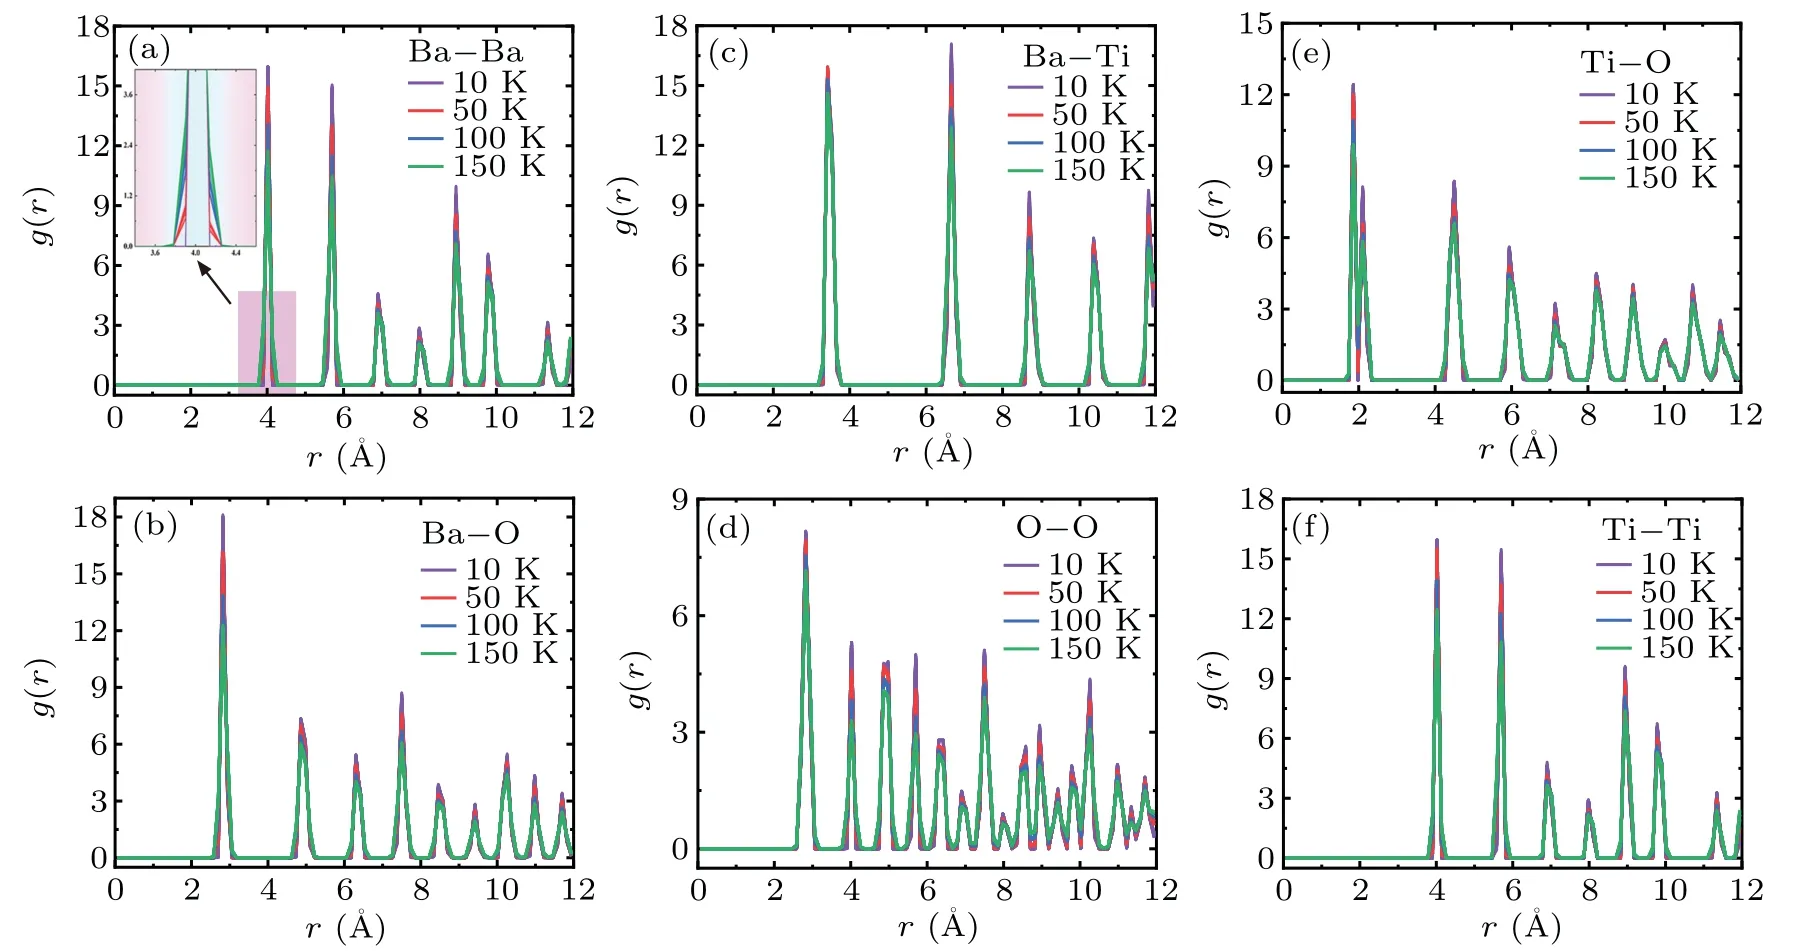
Fig.2. RDF plots of BaTiO3 at temperatures of 10 K,50 K,100 K,and 150 K,with radial distribution function g(r)calculated between atoms(a)Ba–Ba,(b)Ba–O,(c)Ba–Ti,(d)O–O,(e)Ti–O,and(f)Ti–Ti.
It can be seen from Fig.2 that the radial distribution function shows sharp peaks at temperatures of 10 K,50 K,100 K,and 150 K. Figures 2(a)–2(f) show the calculated RDFg(r)between atoms Ba–Ba, Ba–O, Ba–Ti, O–O, Ti–O, and Ti–Ti respectively. These peaks indicate that the atoms of the system are closely packed. By comparing the RDF of the pairs atoms at different temperatures,it can be found that the higher the temperature, the smaller theg(r) value is and the wider the peak width(see the inset in Fig.2(a)). Because when the temperature rises, the crystal lattice vibration becomes more active. In addition, the RDF can also indicate the distance between the pairs atoms. For example, the first peak of the Ba–Ba RDF is located at 4.02 ˚A,which can be interpreted as the bond length of Ba–Ba. Table 2 shows the interatomic distance and the first coordination numbers of BaTiO3at 10 K,50 K,100 K,and 150 K.The result of the coordination number is verified by its perovskite structure. The coordination numbers of BaTiO3remains unchanged at the three temperatures,which explains that BaTiO3is stable in the temperature range of 10 K–150 K.The results of this molecular dynamics simulation illustrate that the basis/primitive crystal does not change with temperature.

Table 2. Interatomic separations and first coordination numbers of BaTiO3 at 10 K,50 K,100 K,and 150 K.
3.2. Phase transition
BaTiO3always has diverse phase transitions in a wide temperature range. To further verify the correctness and validity of the core–shell potential function,the phase transition of BaTiO3is investigated. It established rhombohedral phase BaTiO3as an initial structure. The lattice constant is 4.016 ˚A,the tilt angle is 89.67°, and the initial size of the model is 10×10×10, where 10 is the number of unit cells along each side of the simulation box.The time step of the simulation process is 0.4 fs, the temperature increases from 10 K to 460 K within 5×10⁵steps. The simulated results are displayed in Fig.3.
From Fig. 3 it can be seen that the molecular dynamics simulation with the core–shell potential can correctly reproduce the three phase transitions of BaTiO3: rhombohedral→orthorhombic→tetragonal→cubic.In Fig.3,the dashed line divides the area into different phase ranges,where R,O,T,and C in the figure denote the rhombohedral,orthorhombic,tetragonal, and cubic phases, respectively. The calculated BaTiO3phase transition temperatures are listed in Table 3. Figure 3(a)shows the variation of polarization with temperature,which is similar to that of lattice parameter in Fig. 3(b). It is shown that the lattice parameters with various symmetries increase as temperature increases, but the basis/primitive BaTiO3phase remains even unchanged in the temperature range of 10 K–150 K(As shown in Table 2). These results are in agreement with those reported in the literature.[19]This phenomenon reveals that the distortion of the crystal lattice is one of the most important reasons for the change in the polarization properties of the crystal.
For comparison between different research methods, the phase transition results are divided into three categories. The first category is to study the phase transition temperature of BaTiO3by using molecular dynamics method. We can see that the same method is used,but the results are different. The reason for this difference may be that the parameter settings are different, such as pressure, damping parameters, heating rate,etc. In addition,Luis’s research shows that the size effect is also an important influencing factor. The second category is the experimental results. Obviously,compared with other MD results,except that the phase transition temperature of O→T is slightly lower than the experimental value,our research results are very close to the experimental values.The third category is the BaTiO3phase transition temperature obtained by Cross[26]through Landau theory. Compared with the Cross’s research results,except that the phase transition temperature of T→C is close to the Cross’s result,the other two phase transition temperatures are lower than the Cross’s research results but near the experimental values.

Fig.3. BaTiO3 phase transitions at temperatures ranging from 10 K to 460 K,showing (a) polarization intensity with temperature, and (b) lattice parameters with temperature,where dashed line denotes phase transition temperature value and R,O,T,and C denote rhombohedral,orthorhombic,tetragonal,and cubic phases,respectively.

Table 3. Comparison among BaTiO3 transition temperatures.
3.3. Hysteresis loop
Indeed,the polarizations in perovskites can be induced by the temperature or an external electric field or a stress field.To investigate the anisotropy of rhombohedral BaTiO3under an applied electric field, an electric field of up to 180 MV/m is applied in three directions[001], [110], and[111]separately.Owing to the effect of anisotropy, some hysteresis loops are saturated under the maximum applied field,while others often do not. The simulated hysteresis loops of BaTiO3crystal are shown in Fig.4.
Figures 4(a)–4(c) show the polarizations of BaTiO3in three directions[001],[110],and[111]at 100 K,respectively.It is found that the hysteresis loop along the [111] direction is saturated under the maximum applied field,but not in other directions. Experimentally,the measured hysteresis loops are usually difficult to reach a saturated level due to the presence of the breakdown field. This phenomenon makes it very difficult to determine the intrinsic parameters of the ferroelectric samples.Eventually,a new model of polarization-electric field hysteresis loops is derived mathematically by Maet al. The external energy such as the temperature field and the stressstrain field have been analyzed as an energetic parameter synthetically in this model.[25]

wherePis polarization.Thereout,the ferroelectric intrinsic parameters can be calculated directly by the geometric shapes of hysteresis loop. This model implies that the hysteresis loop of ferroelectric material can be determined by four parameters: the saturation of polarizationPS, the coercive fieldEC,the electric susceptibilityχ, and the equivalent energyU. In Table 4 listed are the fitted intrinsic parameters provided by Eq.(5). It can be observed that under the same applied maximum electric field,coercive field is significantly different,but the intensity of their saturation polarization varies very little.This result demonstrates that anisotropy can have an important effect on the structure and motion of ferroelectric domains,but not on saturation polarization.

Fig.4.Simulated hysteresis loops of BaTiO3 in three directions of(a)[001],(b)[110],and(c)[111],where discrete data points are from molecular dynamics simulations,while the lines are obtained from theoretical model of hysteresis loop.

Table 4. BaTiO3 intrinsic parameters from fitting of hysteresis loops.
3.4. Flexoelectric effect
Flexoelectric effect is a property of a dielectric material, its mechanism is that the strain gradient breaks the spatial inversion symmetry inside the dielectric material, so that the center of positive changes and negative charges no longer overlap with each other and their polarizations occur whereby exhibiting an electrical polarization induced by a strain gradient. Flexoelectricity is closely related to piezoelectricity. The piezoelectric effect is limited to non-centrosymmetric materials, whereas flexoelectric effect is universal in all dielectrics.Flexoelectric effect is significant due to larger strain gradients on a nanoscale. Ma and Cross studied the flexoelectric properties of high-dielectric ceramics such as barium strontium titanate (BST), lead zirconate titanate (PZT), and lead magnesium niobate (PMN) experimentally. The flexoelectric effect in flexible materials is very significant, and the flexoelectric coefficient reaches 10-6C/m.[7–9,26]Maranganti and Sharma calculated the flexoelectric coefficient to be about 10-9C/m[27]through the first-principles method. The firstprinciples calculated value of the flexoelectric coefficient is usually between 10-8C/m and 10-10C/m, which is basically consistent with the theoretical calculations of Pikin and Indenbom.[28]
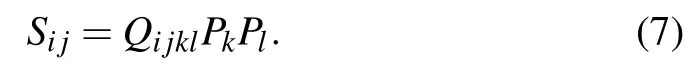
The molecular dynamics method can simulate the flexoelectric effect of the dielectric material at a large angle,which is difficult to achieve experimentally. The simulation process can continuously change the bending angle,which is also problematic in the experiment that only a few small angles can be measured. In general, the positive flexoelectric effect is studied by flexoelectric coefficientμi jkl, which is a fourthorder tensor. The mathematical form of positive flexoelectric effect is[26,29]
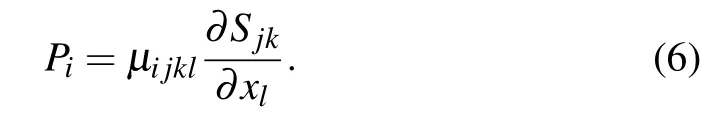
For the convenience of description,the four subscripts of flexoelectric coefficientμi jklcan be omitted.[26,30]It is believed that the flexoelectric coefficient and the electrostriction coefficient have the same symmetry. The electrostriction coefficient is generally expressed as[26]
Therefore,takingμi jklunder a cubic crystal for example,μijklhas a total of 3 non-zero independent components,namelyμ11,μ12, andμ44, whereμ11refers to the longitudinal coefficient,μ12the transverse coefficient,andμ44the shear coefficient.[31]
The key to calculating the flexoelectric coefficient is how to calculate the strain gradient. According to the strain gradient of the cantilever beam model, its schematic diagram is shown in Fig.5.
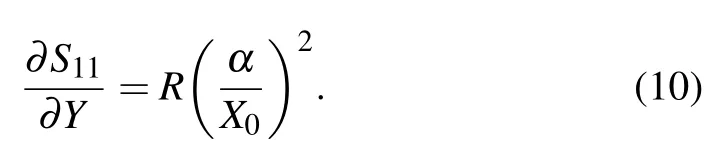
As shown in Fig.5,after the cantilever beam is deformed,the coordinates of the top right corner vertex change from(X0,0) to pointM(P,Q), the thickness of the cantilever beam is known to beY0,the full length of the cantilever beam isX0,and the bent cantilever beam can be regarded as a small segment of a circle with radiusR, whereαis the angle corresponding to the small arc. The position coordinates of the upper right vertexM(P,Q)of the cantilever beam after bending are as follows:

The strain gradient can be obtained from the following equation:[32]
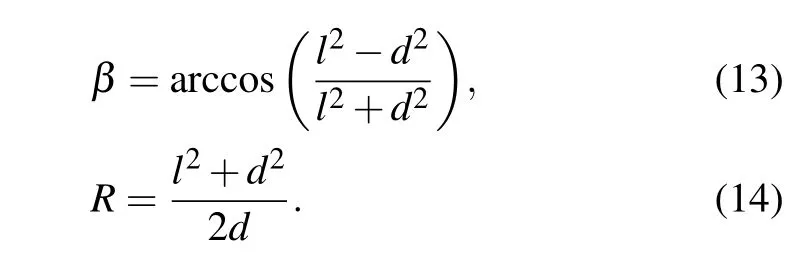
When the bending of a cantilever beam becomes greater, this bent cantilever beam can be regarded as a segment of a circle arc as shown in Fig. 6. It is assumed thatβis the angle corresponding to a circle arc.
It can be seen from Fig.6,if itlis assumed to be the distance from pointMto theyaxis anddthe distance from pointMto thexaxis,the expression oflanddare respectively

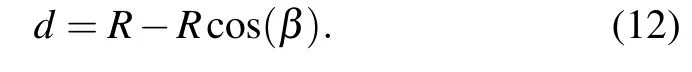
Combining the two equations above, the ultimate expression ofRandβare
Since the value oflanddcan be calculated from the atom position atMpoint, the strain gradient can be calculated. In this work,a 64×8×8 cell model with a total of 40960 atoms is built. And in thexdirection, the model consists of three parts: the fixed part, the free part, and the forced part. The fixed part refers to grouping a certain number of cells into a group at the left end of the model, and all the atoms in this group are fixed so as to achieve the effect of fixing one end of the cantilever beam and bending the other end. The relaxing part refers to the middle part of the cantilever beam. Cells are grouped, and they are not subjected to force in the entire simulation process, and can be changed freely in the entire simulation process.The forced part is set up at the right end of the model, and it has applied a downward force to this group of atoms to make the cantilever beam bent.
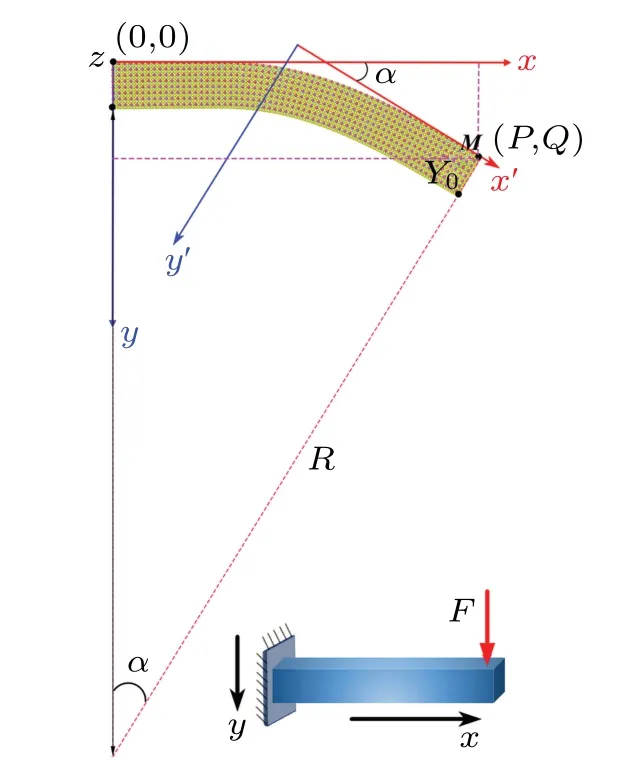
Fig.5. Cantilever beam bending diagram,with lower right corner illuminating the direction of applied force in y direction, and α denoting the angle between the end of the bending beam and the horizontal axis.
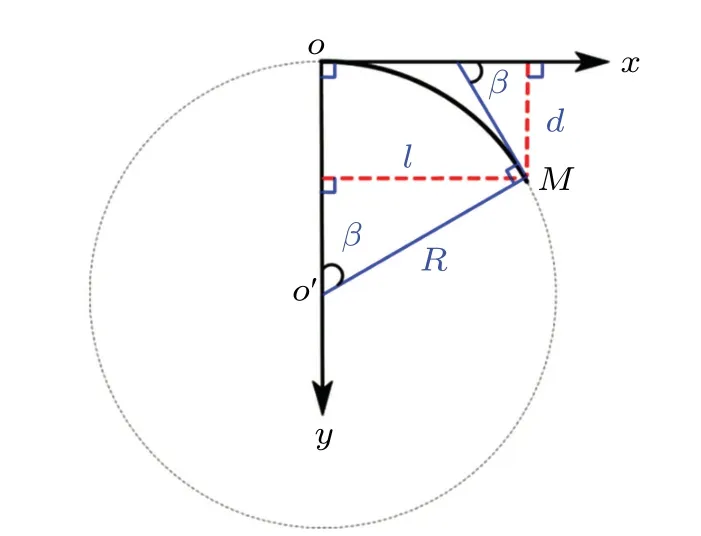
Fig.6. Bent cantilever beam regarded as a segment of circle arc,with l denoting the distance from point M to the y axis and d the distance from point M to x axis.
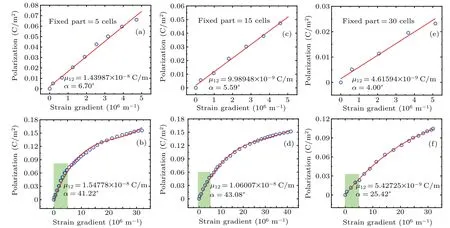
Fig.7. Small angle and large angle bendings at different fixed lengths of cantilever beam. Each upper panel shows the analyses of part of plot(marked by shade area)on its corresponding lower panel. The length of the fixed part is(a)–(b)5 cells,(c)–(d)15 cells,and(e)–(f)30 cells,separately.
Owing to the fact that flexoelectric effect is related to the curvature of the cantilever beam, the effects of different lengths of the fixed end on the flexoelectric coefficient of BaTiO3are investigated. During the simulation, a constant downward force of 0.05 kPa is exerted on the forced part. The entire simulation is performed at a temperature of 10 K, the conjugate gradient method is used to minimize the energy,and the time step is 0.4 fs. By changing the length of the fixed end to obtain different angles of bending, the length of the fixed part increases continuously from 5 cells to 8 cells, 10 cells,13 cells,15 cells,18 cells,20 cells,23 cells,25 cells,28 cells,and 30 cells. All the small angle bendings and larger angle bendings are investigated and to not be cumbersome the plots in Fig.7 are only for samples with fixed 5 cells,15 cells,and 30 cells.
In Fig.7, the plots in the first row show the results for a small angle bending,corresponding to the marked shaded box of a large angle bending in the second row. It is determined that they exhibit distinct regularities,the former part presents a linear relationship while the latter part is non-linear. So it controls the upper plots with linear fitting in the smaller angle range within 7°, which is consistent with the experimental result. For the flexoelectric coefficients generated by the large-angle bending as shown in Fig. 7 in the bottom row,a third-order polynomial is used to fit the plot. The flexoelectric coefficients obtained by the two fittings are marked,and the maximum bending angle is also marked. The maximum bent angle is close to 44°. We can see it from these two rows that the small-angle bending flexoelectric coefficient maintains a good linear relationship with the strain gradient,while the large-angle bending has a nonlinear effect. In order to compare the linear effect with the nonlinear effect,we draw the obtained maximum flexoelectric coefficient in Fig.8.
Figure 8(a)shows the variation of the flexoelectric coefficient of the linear effect and the nonlinear effect on the length of the fixed cantilever beam end. It can be seen from the figure that the flexoelectric coefficient gradually decreases with the length of the fixed end increasing, but the nonlinear flexoelectric coefficient produced by larger bending is obviously greater than the linear one. Therefore, the magnitude of the flexoelectric coefficient is closely related to the length of the fixed part or the angle of the cantilever beam bending. The two sets of flexoelectric coefficients versus fixed length are shown in Fig.8(b),and a linear fit to the small angle bending is performed, then the intercept can be obtained by the linear fitting. The intercept is the theoretically obtainable maximum flexoelectric coefficient. This linear relationship can be consulted in the following analysis. When the bending angle is much smaller,l ≈R·β,the bending lengthlis much closer to the initially bent cantilever beam lengthL-x,so,flexoelectric coefficient can be obtained from the following equation:

whereLis the whole cantilever beam length,Pis the polarization,andxis the fixed length. It indicates that the flexoelectric coefficient can be obtained when the entire cantilever beam is bent in whole. This does mean that at small bending angles,the maximum factor is 1.62×10⁻⁸C/m,which is much closer to the DFT calculation result of Xuet al.[31]and Hong and Vanderbilt.[35]
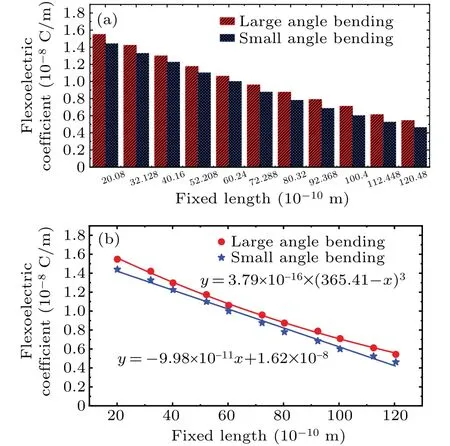
Fig.8. Relationship between length of the fixed end and flexoelectric coefficient: (a)histogram of flexoelectric coefficient with different cantilever beam bendings for different fixed lengths, and (b) discrete data points denoting results of molecular dynamics simulations and the solid line referring to theoretical fit curve.
It can be seen from Fig.8(b)that the nonlinear flexoelectric coefficient is slightly larger than the linear flexoelectric coefficient. However,the difference between the two does not seem to be very significant. A careful analysis of the physics is essential at this point. From the dimensional analysis of physics,the deflectionδis possible to obtain
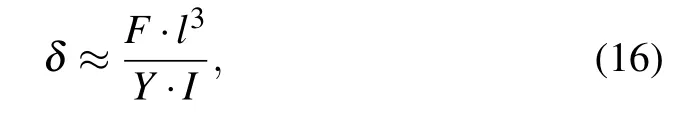
whereFis the externally applied force,Yis the Young’s modulus,andIis moment of inertia. Suppose that the length of the fixed part isx,the following relationship can be obtained:
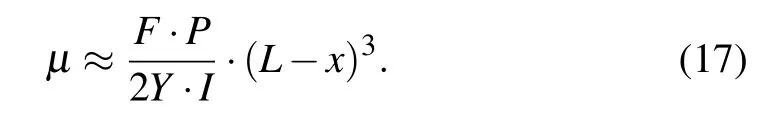
Experimentally, small angles are sometimes difficult to measure. When large angles of bending are considered, the nonlinear flexoelectric coefficient is much more accurate. So the above equation is used to fit the variable fixed length and the fitted result shows that the maximum flexoelectric coefficient of BaTiO3(BT) crystal isμ12=1.85×10⁻⁸C/m. This result is consistent with those reported by several researchers as listed in Table 5, the larger coefficient should come from the non-linear effects.
The experimental data yield larger coefficients for the flexoelectric effects, which should correlate with the nonlinear effects at a larger bending. From the preceding analysis,it linearly relate the polarization to the fixed length in the case of small angle bending, while in large angle bending the polarization satisfies a cubic proportional relationship with the fixed end length. This method provides a universal reference for predicting the maximum flexoelectric coefficient of many materials.

Table 5. Flexoelectric coefficients of BaTiO3 and other materials from simulations and experiment.
Other flexoelectric materials such as Ba0.7Ti0.3O3,SrTiO3, Ba0.67Sr0.33TiO3, NaCl, BT-8BZT, PMN-PT, and MAPbBr3. are also included in Table 5. It can be seen that the experimental flexoelectric coefficients are usually 10-6C/m–10-4C/m, which is much larger than the theoretically calculated response (about 10-10C/m–10-8C/m). The discrepancy between theoretical result and experimental result may come from two reasons. Experimentally, the measured flexoelectric effect may be incorporated into the contribution of other effects, such as the piezoelectric effect or others. This requires a more ingenious experimental design to exclude the effects of other effects so as to accurately measure the flexoelectric coefficient. On the other hand,the current theoretical study is difficult to predict the proper flexoelectric effects. It requires the current theory to be modified or reconstructed to accurately predict the flexoelectric effects. Therefore, further studies should be carried out to accurately predict the flexoelectricity of condensed materials.
4. Conclusions and perspectives
First, the stability of the core–shell model in BaTiO3is verified by calculating the radial distribution functions at different temperatures. It is found that the core–shell potential model is effective and the structure of BaTiO3is stable in the temperature range of 10 K–150 K.Second,molecular dynamics method is used to study the phase transition temperature of BaTiO3,and the obtained results are similar to experimental and theoretical calculations. It can give the correct phase transition temperatures. Simulated hysteresis loops of BaTiO3in the three directions [001], [110], and [111] demonstrate that anisotropy can have an important effect on the structure and motion of ferroelectric domain, which usually severely constrains the coercive field. Finally, the molecular dynamics method is used to predict the flexoelectric coefficient of BaTiO3. From the theoretical analysis, it can be found that it linearly relate the polarization to the fixed length when the bent angle is small, and it satisfies a cubic proportional relationship with the fixed end length as the bending angle becomes larger.
Acknowledgements
We thank Xianglai Gan of Nanchang university for the illuminating and fruitful discussion. We also heartfeltly thank professor Shanming Ke for his help.
Project supported by the Natural Science Funds of Ningxia, China (Grant No. ZR1221) and the National Natural Science Foundation of China(Grant No.11964027).
猜你喜欢
Acta Mathematica Scientia(English Series)(2022年3期)2022-06-25 02:12:52
艺术品鉴(2020年5期)2020-07-27 02:42:58
七彩语文·写字与书法(2019年8期)2019-09-18 10:18:26
水动力学研究与进展 B辑(2018年4期)2018-09-28 05:34:44
Communications in Theoretical Physics(2018年7期)2018-07-09 06:46:36
宝藏(2017年10期)2018-01-03 01:53:02
作文评点报·低幼版(2017年42期)2017-11-16 19:45:26
教育教学论坛(2017年31期)2017-08-30 04:12:02
散文诗(2017年2期)2017-06-05 15:11:09
小天使·一年级语数英综合(2017年4期)2017-04-18 18:08:14

- Chinese Physics B的其它文章
- LAMOST medium-resolution spectroscopic survey of binarity and exotic star(LAMOST-MRS-B):Observation strategy and target selection
- Vertex centrality of complex networks based on joint nonnegative matrix factorization and graph embedding
- A novel lattice model integrating the cooperative deviation of density and optimal flux under V2X environment
- Effect of a static pedestrian as an exit obstacle on evacuation
- Chiral lateral optical force near plasmonic ring induced by Laguerre–Gaussian beam
- Adsorption dynamics of double-stranded DNA on a graphene oxide surface with both large unoxidized and oxidized regions