Remote sensing of bark beetle damage in Norway spruce individual tree canopies using thermal infrared and airborne laser scanning data fusion
Agt Zkrzewsk,Dominik Kope′c,b,*
a Department of Biogeography,Paleoecology and Nature Protection,Faculty of Biology and Environmental Protection,University of Lodz,Ł′od′z,Poland
b MGGP Aero Sp.z o.o.,Tarn′ow,Poland
Keywords:Infrared thermography Picea abies Ips typographus Middle wave infrared Forest invasion Forest health K-mean clustering
A B S T R A C T Background:Increasing threat to Central Europe's forests from the growing population of the European spruce bark beetle Ips typographus(L.)calls for developing highly effective methods of detection of the infestation spots.The main goal of this study was to establish an automatic workflow for detection of dead trees and trees in poor condition of Picea abies using Middle Wave Infrared spectral range obtained from the aircraft.
1.Introduction
Increasing threat to forests from the European spruce bark beetle(Ips typographusL.)has severe economic consequences(Christiansen and Bakke,1988).Due to its detrimental effect on wood production,there is a need to develop a method for rapid and precise detection of trees infested byI.typographus.One of the current strategies for suppression relies on early detection of infested trees,followed by cutting and removal(Hedgren and Schroeder,2004).The most impacted trees in North and Central Europe are the Norway spruce(Picea abies[L.]H.Karst),and less frequently the Scots pine(Pinus sylvestrisL.),the European silver fir(Abies albaMill.),and the European larch(Larix deciduaMill.)(Grodzki,2013).The bark beetle more frequently attacks trees that have been weakened or stressed by environmental pollution,droughts and storms caused by climate change(Hl′asny et al.,2011).Older,80 to 100-year-old trees are also more susceptible to infestation.Healthy trees deter the bark beetle for example by formation of resin ducts and by local changes in metabolism(Rohde et al.,1996).
Both adult beetles and larvae ofI.typographusfeed on the live tissues of trees.In the first stage,adult forms penetrate into live tissues and create tunnels for mating and laying eggs.The larvae that feed inside the tree then create side tunnels from the main corridor.As the larvae grow,the corridors get wider and longer,causing significant damage to the tree.In the eclosion phase,another stage of supplementary feeding takes place,after which the adult forms leave the corridor to colonize another tree(Wermelinger,2004).All stages of the development in the bark beetle can lead to the dying of the tree.The presence of the spruce bark beetle in an attacked tree is manifested by discoloration and defoliation of leaves.The development of one generation in Polish weather conditions takes about two months.Two or three generations of bark beetle may be produced annually(J¨onsson et al.,2011).Also,climatic conditions such as mild winters or warm and dry summers facilitate the process.Such weather conditions have been observed in recent years in Poland where weather anomalies are increasingly shifting towards mild and warm winters(Wypych et al.,2017).
I.typographusinfestation is particularly severe in wood production forests,such as spruce monoculture(Gutowski,2004).However,it can also be present in protected forests(Rachwald et al.,2022).For instance,Wigry National Park was established in areas that previously were wood production forests.The attacked trees are not removed due to the strict protection regulations and the bark beetle is listed here as keystone species(Müller et al.,2008).Significant increases in the population and activity ofI.typographushave been observed in the Polish national parks due to the aging of forest stands and the fact that human interference in natural processes is prohibited or restricted in their territory(Gutowski and Krzysztofiak,2005).In northeastern Poland,and also in Wigry National Park territory,I.typographusoutbreaks tend to occur more frequently(Gutowski,2002).
Due to the large-scale beetle population attacks as well as its rapid growth and specific life cycle,it is necessary to develop a method for quick and effective detection of both spots of infestation and individual dead trees.Large populations ofI.typographuscan result in the reduction of significant forest areas in Eurasia(Grodzki et al.,2004).Using remote sensing data to identify infestation spots is entirely justifiable considering not only the speed of data acquisition for a large study area but also the progressing accuracy of data recording instruments.It seems necessary to create an automatic workflow for data acquisition and processing.Quick and regular identification of weakenedP.abies,followed by their removal,can be effective in controlling theI.typographusspread.AlthoughI.typographusis one of the causes of dying of coniferous species,e.g.,Pinus sylvestris(Jaime et al.,2019),most of the remote sensing studies have focused on the detection of damaged and deadP.abies.The study of other coniferous species is only an addition to the main studies ofP.abies(N¨asi et al.,2018),or concern other species,i.e.,Ipid bark beetleIps acuminatus(Kuchma et al.,2021)or the Mountain pine beetleDendroctonus ponderosae(Coops et al.,2010;Sprintsin et al.,2011).
Review of literature confirms that it is possible to effectively map bark beetle invasions using remote sensing techniques through analysis of multispectral(Long and Lawrence,2016),hyperspectral(Fassnacht et al.,2012,2014),and thermal(Hais,2003)image data.To date,detecting trees that are dead or in the advanced stage of decay(called red and gray attacks)have proven particularly efficient.Satellite data,due to its spatial resolutions,has been used to identify the regions with dead trees and trees susceptible toI.typographusinfestation(Filchev,2012;Latifi et al.,2014).Alternative methods of detecting areas infested by the bark beetle are based on the data fusion.Studies using RapidEye data and TerraSAR-X data showed a relatively low classification accuracy for detection of the bark beetle infestation spots(Cohen's Kappa Coefficient(kappa)of 0.23 for TerraSAR-X data and 0.51 for RapidEye).Only the combination of both these data types yielded a high detection rate at the level of kappa=0.74(Ortiz et al.,2013).This allowed the researchers to classify a large study area with varying density of dead trees.
Hyperspectral airborne data were previously used to estimate tree health condition,where 673–724 nm region exhibited maximum sensitivity to initial damage(Campbell et al.,2004).The correlation between spectral indices and biophysical parameters varied from-0.61 to 0.88.Lausch et al.(2013)found that althoughI.typographusinfestations were best visible within the spectral range of 450–890 nm relating to prominent chlorophyll absorption,64% accuracy was still insufficient in informing the forest management intervention.Data obtained from UAVs(Unmanned Aerial Vehicles)provide better results in the early detection of lesions in trees,especially when combined with airborne laser scanning(ALS)data,as shown in assessment of pine shoot beetle(Tomicusspp.)(Lin et al.,2019,2021).
In the green attack stage of the European spruce bark beetle invasion,tree needles remain green.Detection ofI.typographus-induced tree mortality was successfully achieved by fusion of high-resolution airborne hyperspectral data and ALS(Stere′nczak et al.,2019).Incorporating ALS helped delineate single tree canopies based on Canopy Height Model(CHM).ALS data was used in the process of delineating tree crowns and assessment of their reflectance values,thus a very high accuracy of separating healthy and dead trees was obtained(kappa=0.95).However,acquisition of hyperspectral and ALS data annually for one area and then processing them can be laborious and costly(Lu et al.,2020).Therefore,trees attacked byI.typographusmay potentially be identified by alternative approach such as recording their canopy temperature.
Thermal Infrared(TIR)cameras are increasingly used in remote sensing,mainly to determine the temperature of individual objects or Land Surface Temperature mapping(Trigo et al.,2008;Jiang and Tian,2010).The tree crowns with healthy and green leaves contain a high level of chlorophyll content and maintain normal evapotranspiration process for effectively cooling the leaf surface(Kimball and Bernacchi,2006).The presence of the bark beetle causes damage to trees,including discoloration and defoliation.Consequently,chlorophyll content in leaves is reduced,and the evapotranspiration process is impaired or blocked,which may in turn increase canopy temperature(Leuzinger and K¨orner,2007).Therefore,it is possible to identify and distinguish different condition states on the thermal data mosaic.
Vegetation temperature has been used to monitor the early responses of plants to different stressors(Hern′andez-Clemente et al.,2019),and there are studies on determination of tree canopy temperature in agricultural crops(Wang et al.,2010)as well as in the natural environment for assessment of growth conditions(Kim et al.,2018).Object temperature is one of the indicators of environment condition and has numerous applications.For instance,by identifying the thermal properties of each species,the environmental and growth conditions of orchards can be estimated by monitoring the canopy temperature(M¨oller et al.,2007;Egea et al.,2017).However,acquisition of TIR data requires determination of meteorological conditions as well as the time of a day and season for the suitable signals to be used(Prakash,2000).With better understanding of these aspects,the present state of knowledge can be extended and data can be used to study damaged and dead trees in various environments.
Studies using TIR satellite data(Landsat-8 satellite)showed that the canopy temperature identifies bark beetle-induced physiological changes in trees more efficiently than spectral vegetation indices alone(Abdullah et al.,2019).Tree canopy temperature proves to be the key feature in detecting infested forest areas when combined with other spectral indices.Abdullah et al.(2019)suggest that higher efficiency may be achieved if data of higher resolution than satellite and a combination of TIR and hyperspectral data are used.It is impossible to assess individual tree canopy temperatures,because spatial resolution of thermal data obtained from Landsat-8 is 100 m(or resampled 30 m).In the study of Hais and Kuˇcera(2008),where TIR satellite data was used,temperature of dead or decaying spruce forest is on average 3.5°C higher than healthy forest areas.However,these studies were conducted not on individual trees but the entire patches of forest.It was suggested that the higher temperature may result from higher reflectance in the case of single dead trees and the different evapotranspiration in the two forest communities in different health conditions(Hais and Kuˇcera,2008).Another study that drew on the previous suggestions was Junttila et al.(2016),where the impact of the health condition of trees and forest structure on the obtained Land Surface Temperature was studied using aerial TIR and ALS data.A 1-m spatial resolution made it possible to analyze each single tree canopy temperature.Junttila et al.(2016)obtained high detectability of dead and damaged trees on the thermal data mosaic,but detecting the green attack using TIR data remains a challenge.It was suggested that similar studies should be performed in warmer weather conditions than those that were carried out during the tests(air temperature above 2.5°C;Junttila et al.,2016).
Other studies(e.g.,Hais and Kuˇcera,2008;Junttila et al.,2016;Abdullah et al.,2019)on the detection of theP.abiesattacked byI.typographus,were carried out in 8–14 μm Long Wave Infrared(LWIR),probably due to the availability of cameras in this spectral range.In our current research,we proposed the use of temperature registered in the Middle Wave Infrared(MWIR)range.This wavelength was successfully used to differentiate canopy temperatures of tree species in the natural environment(Zakrzewska et al.,2022).There are no remote sensing studies that would use the MWIR range to assessP.abieshealth status.However,the range of 3.6–4.9 μm enabled greater dynamics of imaging and consequently smaller temperature differences to be recorded(Livache,2019).This is particularly important in vegetation studies where temperature differences between species,or individuals in different condition states may be small.It is also important that changes in chlorophyll content and water deficit occur inP.abiesattacked byI.typographus(Cheng et al.,2010;Ali et al.,2021).According to Gerber et al.(2011),3–5 μm TIR atmospheric window is more dedicated to study vegetation water content,which may explain the high detection efficiency of trees in poor health condition and dead in MWIR spectral range.
Fast and inexpensive detection of dead and dying trees as a result of an attack by the spruce bark beetle is crucial in forest management.Taking into account the results and comments of previous researchers,new studies were performed.The aims of this study were to determine:(1)can the airborne TIR data registered in spectral range of 3.6–4.9 μm be used to detectP.abiesthat are in poor condition or dead due toI.typographusinfestation,and(2)is it possible to create an automatic workflow of detection of deadP.abiestrees and trees in poor condition using airborne TIR and ALS data fusion?
We used the middle wave infrared spectral range(3.6–4.9 μm)for the first time to study the health status of trees infected byI.typographus.Moreover,middle wave infrared data were obtained for the first time from airplane level to study this issue for a vast study area,much greater than standard UAV study areas.We aim to establish a functional,automatic segmentation method based on ALS and TIR data fusion,that could be a new method of fast and automatic assessment of tree health status.Our assumption is that it is possible to differentiate healthy trees from dead trees and those in poor condition only by comparing needle discoloration with canopy temperatures obtained from an aircraft level.
2.Materials and methods
2.1.Study area
The study area was located in Wigry National Park(WNP)situated in northeastern Poland(Fig.1).The analyzed area spanned 9 km2in the eastern part of WNP,where mixed coniferous forest is the dominant vegetation type with podzolic soil(The Forest Data Bank,https://www.bdl.lasy.gov.pl/portal).The landform of the study area is postglacial landscape and elevation fluctuation is about 140–156 m above sea level.The main forest species found in WNP include Scots pine(Pinus sylvestris)and Norway spruce(Picea abies).Other common species are the Common oak(Quercus roburL.),the Silver birch(Betula pendulaRoth),and the Black alder(Alnus glutinosa[L.]Gaertn.).Vegetation under tree canopies with a coverage of up to 50%–80%,consists of young trees,herbaceous species,and others such as buckthorn,fir,juniper,rowan and also hazel(Kliczkowska,2004).The age ofP.abiesin the study area varies from 33 to 161 years(The Forest Data Bank,https://www.bdl.lasy.gov.pl/portal).The study area was located within the strictly protected area of WNP covered by the regulation on total and permanent abandonment of direct human interference in the course of natural processes,condition of ecosystems and formations and elements of nature(Journal of Laws of Journal of Laws of 1988 No.25,Item 173).Since logging and removal of timber is prohibited,there is a large number of wood clusters and single damaged or dead trees in the area.The study area was located in a humid continental climate zone but significantly influenced by the Baltic Sea and the eastern continental block.Summer begins in the middle of June and lasts until the end of August,with an average temperature of 16–18°C(Łuczak,2019)and the highest rainfall of approximately 80 mm.The wind speed in WNP is moderate(up to 5 m⋅s-1)and the growing season is approximately 190 d(Krzysztofiak and Olszewski,1999).
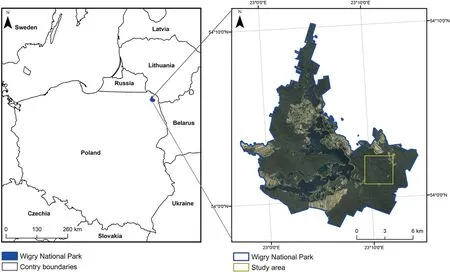
Fig.1.Location of the study area.
2.2.Airborne data acquisition
Three types of airborne data were acquired in order to conduct research using Vulcanair P-68 Observer 2 aircraft(Table 1).The airborne laser scanning data and color-infrared image were collected on August 17,2019.Measurements with both of these sensors were carried out synchronously on the same aircraft(Table 1).TIR was the main data of this research and was used to calculate tree canopy temperatures.ALS and color-infrared(CIR)was used as additional data in processing and statistical analysis.
TIR data were acquired on June 26,2020 between 14:07 and 14:28 UTC using ImageIR 9400 infrared camera by InfraTec GmbH(Dresden,Germany).The spectral range of the camera was 3.6–4.9 μm,which is described as Middle Wave Infrared(MWIR).ALS and CIR images were acquired for the study area on August 17,2019.
2.2.1.Thermal infrared data processing
Weather conditions are crucial during TIR data acquisition.During the flight,air temperature was 29°C,relative humidity was 37%,the average wind speed was 4 m⋅s-1,and there was an absence of cloud cover.IRBIS Professional v.3.1 software was used to process and correct thermal images.Atmospheric correction was applied by the atmospheric transmittance model using ambient temperature,relative humidity recorded during data acquisition,and flight altitude taken into account(method performed by Minkina and Dudzik,2009).The average emissivity ofP.abiesrange was determined at ε=0.90 based on the literature reports(Kraniotis et al.,2016).Since it is the only tree species studied,there was no need to estimate emissivity to other objects.During the TIR data acquisition,30 reference field measurements of surface temperatures were recorded in the study area using Fluke 64 MAX pyrometer(Fig.2).At the ground level,various surfaces were measured in the test area(cobblestones at 7 points,asphalt 8 points,herbs 5 points,gravel 4 points,concrete slabs 3 points,sand 2 points,and farmland 1 point).The location coordinates of each pyrometer point were recorded using a Trimble Catalyst GNSS receiver with a Trimble DA1 antenna.Additionally,temperature for each point was measured five times and these measurements were averaged for data calibration.The temperatures recorded from the points were used for radiometric correction,in order to remove radiometric errors and adjust the values obtained from the aerial level(Osi′nska-Skotak,2007).After radiometric correction,the mean difference between the airborne TIR and the pyrometer data calculated from 30 reference points was 0.49°C.The resulting thermal mosaic with Ground Sample Distance(GSD)resolution=1 m was used to determine the canopy temperature.
2.2.2.Airborne laser scanning and color-infrared image processing
CIR image was obtained using DMCII camera with a spectral range of 0.7 μm.The source CIR images have been processed in INPHO OrthoVista software package(Trimble Inc.,Sunnyvale,CA,USA).The photos were taken with a 70% forward overlap and a 30% lateral overlap.The orthophotomap was made in digital technology.The orthorectification of all photos was performed with the Inpho OrthoMaster software(Trimble Inc.,Sunnyvale,CA,USA).The geometrical accuracy of the orthophotomap was 0.1 m.GSD of CIR orthophotomap was 0.1 m.These images were used to calculate NDVI(Normalized Difference Vegetation Index)values(necessary in automatic tree crown segmentation)and as basemaps to figures.NDVI allows the determination of the developmental state and the condition of vegetation(Gandhi et al.,2015).
ALS data were acquired using Riegl VQ-780 with a density of 7.6 pt⋅m-2.Point cloud from ALS was classified in TerraScan software in TerraSolid package(Terrasolid Ltd.,Espoo,Finland).CHM with a resolution of 0.5 m was generated based on the obtained point cloud.The CHM was then used to manually delineate tree canopy polygons recorded in the field and to create an automatic individual tree crown segmentation.Additionally,ALS data were used for mapping of Gap Fraction(Maltamo et al.,2014).Gap Fraction indicates the rate of laser ray penetration through the canopy in relation to a spatial unit.The pixels in the Gap Fraction have values from 0 for complete branching(light ray absorbed by the canopy)to 1 in open areas(light ray reaches the ground)(Danson et al.,2007).
Because of the earlier acquisition of ALS and CIR data(2019)relative to TIR data(2020),the timeliness of ALS and CIR data was verified during field measurements.Ground reference points ofP.abieswere compared with airborne data from 2019.Only those trees whose health status was visible on the CIR image and crown shape did not change between 2019 and 2020 were selected as reference trees(as a last resort,340 trees were selected as shown in Section 2.3).
TIR,ALS and CIR images were used in the data fusion analysis.Center projection of TIR images may be a problem in the process of segment creation.It is especially important for tall objects,e.g.tree crowns.That's why it is necessary to reduce geometric distortion.The error from geometric distortion between ALS and TIR has been significantly reduced by the same points cloud in the orthorectification process of TIR data and by creating the CHM model of tree crowns.Additionally,the offset positions error was minimized at the stage of assigning TIR data pixel values to segments.Only pixels that were fully inside the segment were assigned to the given canopy segment.
2.3.Ground reference data
For the purpose of the analyses,340 ground reference points ofP.abiesin various health condition states were collected in the study area synchronously with the TIR data acquisition.The location coordinates of individual trees were recorded with an accuracy of 1 m using a Trimble Catalyst GNSS receiver with a Trimble DA1 antenna and MapIT application connected to it(Mapit GIS LTD,Wishaw,UK).Data in the field were recorded in the form of a point layer in GeoJSON format.Measurements were distributed evenly across the study area(Fig.3).Each tree was assigned to one of the three condition classes based on examination in the field and detection ofI.typographus(Fig.4).The trees were divided into three classes(‘healthy’,‘poor condition’and‘dead’)following visual assessment of the discoloration of needles according to the method proposed by Hanisch and Kilz(1990)(Table 2).The threshold level of discoloration for‘poor condition’was 20%,which is considered to be visually noticeable(Eichhorn et al.,2004).Three healthclasses were distinguished,and their numbers reflect the actual proportions in the studied area.These three classes can be visually separated during ground reference collection without the need for additional parameters,which is necessary because of the speed and ease of usage and repetition of this method.The acquired field data were then subjected to lab processing.

Table 1Parameters of flight and sensors used.GSD:Ground Sampling Distance.
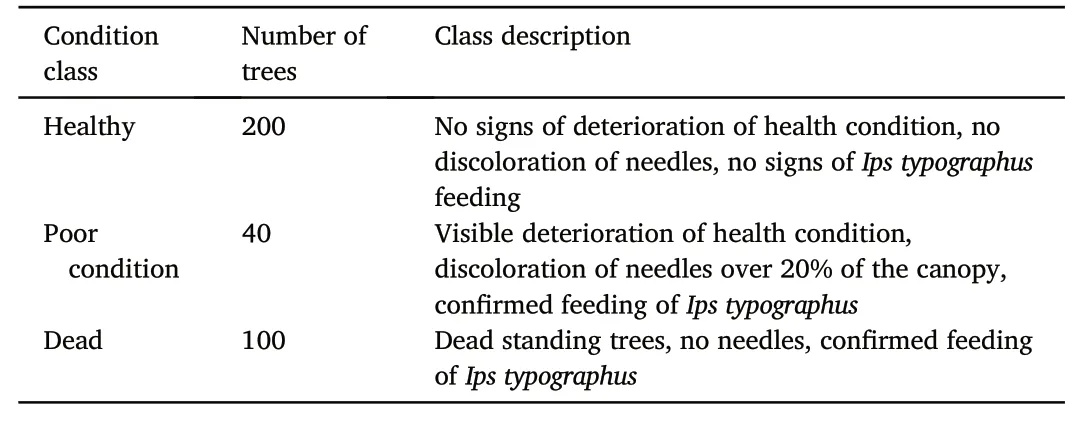
Table 2Division of ground reference data into condition classes.
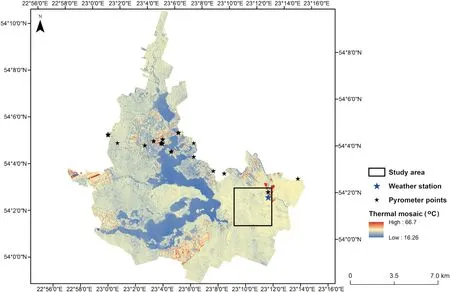
Fig.2.Locations of the weather stations and pyrometer points for Thermal Infrared data calibration.Basemap:Thermal Infrared(TIR)mosaic.

Fig.3.Distribution of reference trees of Picea abies divided by health status.In brackets,the number of collected individuals was given.Basemap:orthophotomap in real colors.(For interpretation of the references to color in this figure legend,the reader is referred to the Web version of this article.)
2.4.Segmentation of individual tree canopy using canopy height model
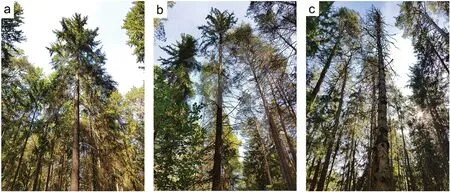
Fig.4.Representation of three health condition classes of Picea abies(a:‘healthy’,b:‘poor condition’,c:‘dead’).
The purpose of data processing was to assign the information of the canopy temperature to individual trees.For 340 points ofP.abiesidentified in the study area,Individual Tree Canopies(ITC)were delineated using two independent methods:manual/photointerpretation(ITC#1)and automatic segmentation of the CHM data(ITC#2)(Fig.5).The purpose of using two methods of identifying single canopies was to carry out the analysis of TIR data without the influence of the quality of automatic segments(method ITC#1)and to check the usage of TIR data obtained from segments in application workflow,which could be used in the forest management in the future(method ITC#2).
ITC#1 was created from ground reference data points(Fig.5),by photointerpretation of CHM data and polygon delineation of entire tree canopies.Subsequently,a 1-m buffer was formed inside each ITC#1 for reducing the tree canopy range.Thereby,extreme pixels,which might have potentially included ground or adjacent canopies,were eliminated from further analyses.At the final stage,gap fraction correction was applied.All pixels with a gap fraction value higher than 0.2 were excluded from further analyses to eliminate the influence of the ground on the canopy temperatures.
Segmentation was focused on detection of single tree canopies with a minimum peak height of 3 m.Tree segmentation was performed by determining the boundaries of individual trees using detected vertices.Tree detection and segmentation were performed using the R programming language.First stage of ITC#2 was detection of individual trees using variable size windows(Popescu and Wynne,2004).Using detected treetops as seed,watershed algorithm was used to determine the extents of single crowns.At this stage,it was necessary to determine the minimum height of the canopy of a single tree(2.5 m)that will enter its range.Also,NDVI obtained from the CIR images was used.Segments with maximum NDVI pixel values less than 0.2 were eliminated.ITC#2 were also reduced by a 1-m buffer and gap fraction high values,reducing the tree canopy range,the same way as in ITC#1 processing(Fig.6).
The final preparatory stage comprised calculating zonal statistics.Mean and standard deviation of the temperature values from the TIR data were calculated for ITC#1 and ITC#2.Statistical calculations were made using ESRI's ArcGIS 10.6 and TIBCO Software's Statistica 13.The dataset prepared in this way was analyzed to answer the research questions.
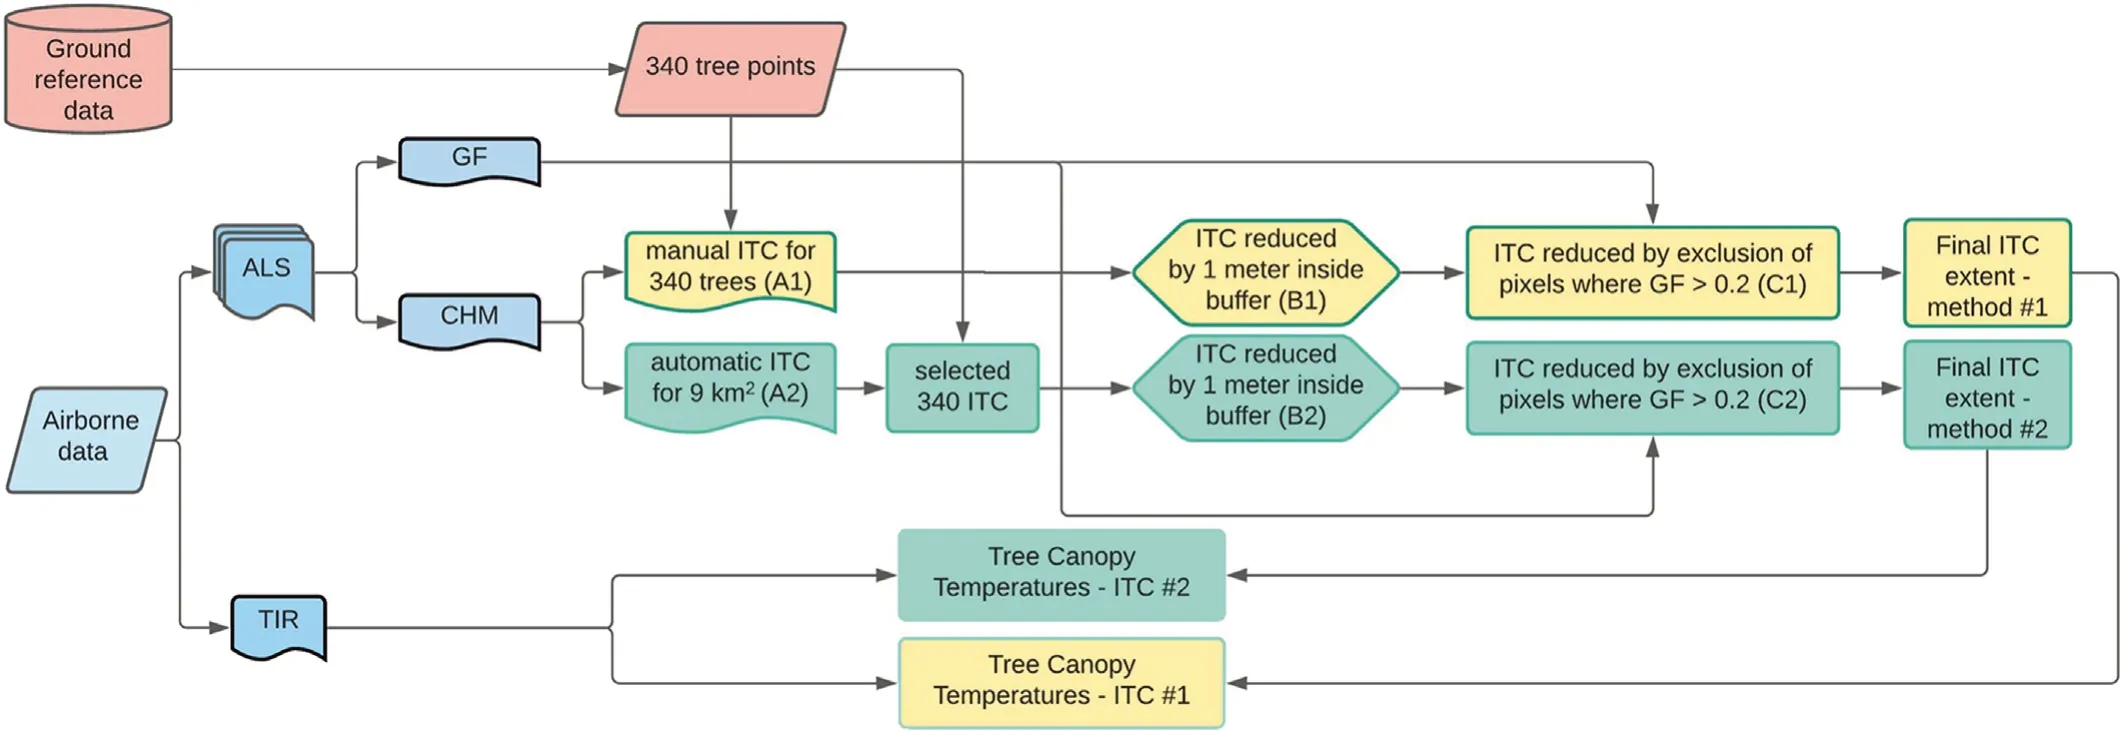
Fig.5.Workflow of data processing and creating tree canopy ranges.TIR:Thermal Infrared;ALS:Airborne Laser Scanning;GF:Gap Fraction;CHM:Canopy Height Model;ITC:Individual Tree Canopy;Shortcuts in brackets are represented in Fig.6:a1,b1,c1 for manual polygons;a2,b2,c2 for segments.

Fig.6.Examples of tree canopy ranges.a1:sample of polygon range delineated manually based on Canopy Height Model,b1:polygon reduced by 1 m buffer,c1:polygon reduced by Gap Fraction,a2:sample segment delineated automatically based on Canopy Height Model(CHM),b2:segment reduced by 1 m buffer,c2:segment reduced by Gap Fraction.Basemap:Color-Infrared.(For interpretation of the references to color in this figure legend,the reader is referred to the Web version of this article.)
2.5.K-mean clustering method
ITC#1 was divided into test dataset and validation dataset.Trees from each health class condition were divided by stratified random sampling(in 50%/50%proportions)into these two sub-datasets(Fig.7).In the validation dataset the same tree crowns are included in ITC#1 and ITC#2,which differ in a method of delineation(Fig.6).Half of the gathered ground reference was taken to the test dataset and it was used to differentiate clusters from K-mean clustering method(see below).Other half of the ground reference was used as validation dataset,to compare and check results that were obtained in the test dataset(Fig.7).
K-mean clustering method was used to divide test dataset into health class conditions.It is necessary to automate the process of detecting tree health status as it should be easy to repeat and performed in other study areas.K-mean clustering method was performed in ArcGIS without space restrictions.Only the average temperature of tree crowns was analyzed and on this basis the objects were grouped into 3 clusters(‘healthy’,‘poor condition’,and‘dead’).Three clusters‘seeds’for each group were defined by the mean value of the temperature obtained from a given class from the ground reference.Ten iterations were executed.After performing the K-mean clustering,a division into three condition groups was created.Contour coefficient index was used to check the applicability of K-mean clustering results.Contour coefficient ranges from–1 to+1,where a high value indicates that the object is well matched to its own cluster and poorly matched to neighboring clusters(Zhang et al.,2018).To check if classes differ significantly from each other ANOVA and post-hoc tests were conducted.Then,the temperature ranges for the condition classes were created,taking the extreme values from each designated group from the clusters.Tree crown temperatures from the validation dataset were assigned in class condition ranges obtained from K-mean clustering separately for ITC#1 and ITC#2.
2.6.Accuracy metrics
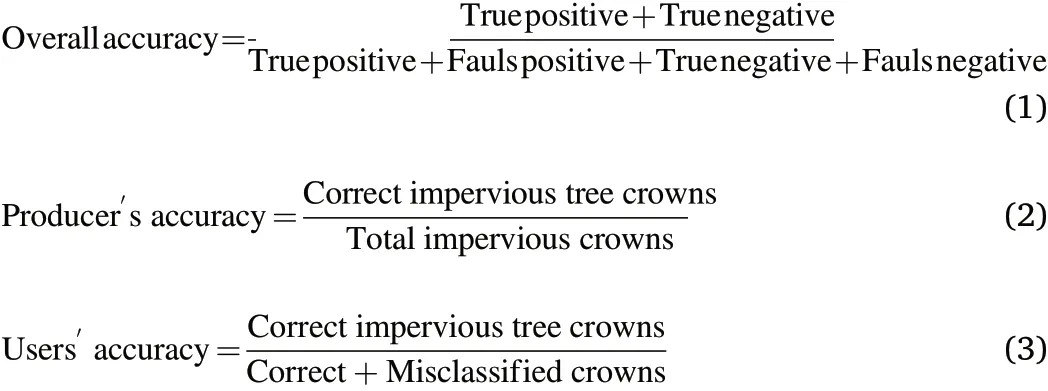
The final step was to calculate the level of accuracy of the assignment of trees to the condition classes on the validation datasets(Fig.6).The following metrics of accuracy were calculated:overall accuracy,producer's accuracy,and user's accuracy for each health condition class.
3.Results
3.1.Determination of temperature ranges of condition categories
The ITC temperatures were used in the K-mean clustering method to split trees from the test dataset into three clusters,which represent different class conditions(Fig.8).According to contour coefficient index results,the cluster with the highest value was the‘dead’(0.963),next they were the‘healthy’cluster(0.943)and the‘poor condition’cluster(0.930).High values indicate that objects(in this case canopy temperatures)were well matched to clusters.The cluster composed by‘healthy’trees has the lowest mean canopy temperature,while the mean temperature of trees from a cluster with dominant‘dead’trees is considerably higher(Fig.9).The average temperature of a‘healthy’trees cluster is 27.70°C±0.23°C and for trees in the‘poor condition’cluster it increases by 0.87°C to 28.57°C±0.31°C.The average temperature of‘dead’trees cluster is 30.17°C±0.37°C,resulting in a difference of 1.60°C between the‘poor condition’and the‘dead’.The difference in canopy temperature between the‘healthy’and‘dead’clusters is 2.47°C.
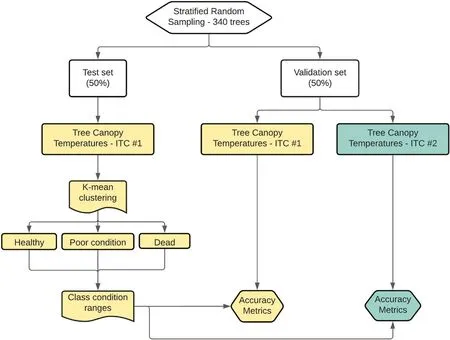
Fig.7.Workflow of statistical analysis.ITC:Individual Tree Canopy.

Fig.8.K-mean clustering visualization of three clusters,which represent three condition classes of P.abies(‘healthy’,‘poor condition’and‘dead’classes determined by K-mean clustering).Each dot represents one trees'temperature.
ANOVA test confirmed that condition clusters of the test dataset were significantly different(p<0.001).As a result,the average tree crown temperature of health condition is the factor that differentiates these clusters by obtaining three post-hoc groups.Tukey's post-hoc test confirms that there were significant differences among all three condition states.
It was assumed that the extreme values of the ITC temperatures from individual clusters,separated by the K-mean method,would create compartments that allow to distinguishP.abiesin three condition states(Table 3).According to this method,‘healthy’trees were assumed if the mean ITC temperature was less than or equal to 28.13°C.Trees in‘poor condition’class were trees with a mean ITC temperature from 28.14°C to 29.27°C.‘Dead’trees have mean ITC temperatures higher than 29.28°C.
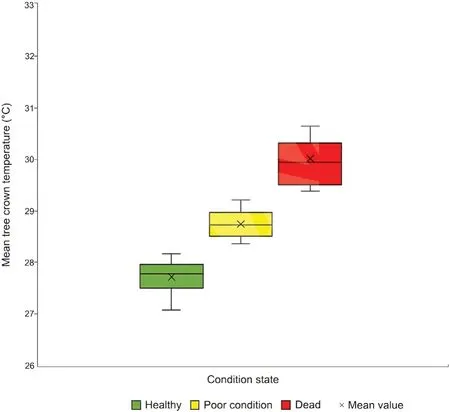
Fig.9.Mean temperature values of P.abies canopies divided by their condition state,calculated from the clusters.Box:represents the first and the third quartile;plot:the highest and the lowest temperature values in a given class;×:mean value of a given class.

Table 3Determination of temperature value ranges of condition categories.
3.2.Result comparison of validation set created with two tree canopy delineated methods
Each tree from the validation dataset was assigned to the condition class according to its ITC temperature and thresholds from Table 3.Canopy temperature of each tree was calculated from two types of tree canopies creation method(ITC#1 and ITC#2)and because of that,two validations were performed.
Firstly,validation dataset created with ITC#1 method was performed.There were 100 tree canopies in the‘healthy’,20 in the‘poor condition’and 50 in the‘dead’classes,respectively.After the trees were grouped according to the assigned values of each category,the following results were acquired(Table 4):67 were correctly classified as‘healthy’out of 100 healthy tree canopies,and 16 were accurately categorized as‘dead’out of 50 canopies of the‘dead’category;in‘poor condition’category 19 canopies from 20 were correctly classified.
A second validation was performed for the same trees used in Section 2.4.,but this time the canopy range was determined on the basis of automatic segmentation(ITC#2).Each of these segments,after zonal statistics were computed,was assigned to the appropriate category(Table 3)based on the average tree canopy temperature determined.As a result of this analysis,64 out of 100 tree canopies from this class were correctly classified to the‘healthy’category,while only 5 trees were correctly assigned to the‘dead’category(Table 5).45‘dead’trees were classified as‘poor condition’.All trees from the‘poor condition’were assigned correctly.
As a part of the presented research,the possibility of identifying trees attacked byI.typographuswas compared with two methods of delimiting the range of ITC.For the validation dataset,the value of correctly classified objects in accordance with the overall accuracy,producer's accuracy and user's accuracy for each class are presented in Table 6.Values of all metrics are similar to each other between ITC#1 and ITC#2.Despite obtaining statistically significant differences in temperature among all classes,validation results show values of overall accuracy 0.60 for ITC#1 and 0.52 for ITC#2.The highest values were obtained on producer's accuracy for‘poor condition’.Also,user's accuracy for‘healthy’and‘dead’classes are high.Very low values of producer's accuracy for the‘dead’and user's accuracy for the‘poor condition’were obtained.A large part of‘dead’trees,after creating clusters,were classified in the‘poor condition’category(Fig.8),which may affect these results.Values of overall accuracy for both ranges are similar,albeit a slightly better ITC#1 than ITC#2.The visual representation of the results was presented in Fig.10.
The applicability of the determined thresholds for classes on the basis of the tree canopy temperature values was checked on a selected fragment of the study area,whereP.abiesis the only growing tree species(Fig.11).Information on mean temperature of each canopy was added to the segments,which were assigned to the appropriate class based on the thresholds in Table 3.The results were compared with CIR,CHM,and TIR basemaps.
Another analysis was also carried out for the entire study area,where each segment was assigned to the condition class based on their mean temperature and determined thresholds(Table 3).From 426,262 segments,automatically created in the study area,414,757 segments(97.3%)were assigned to the‘healthy’class,10,713 segments(2.5%)to‘poor condition’and 792 segments(0.2%)to the‘dead’class.

Table 4Results for a validation set of ITC#1 assigned in accordance with the value of the mean tree canopy temperature.Numbers in green blocks represent True Positives.
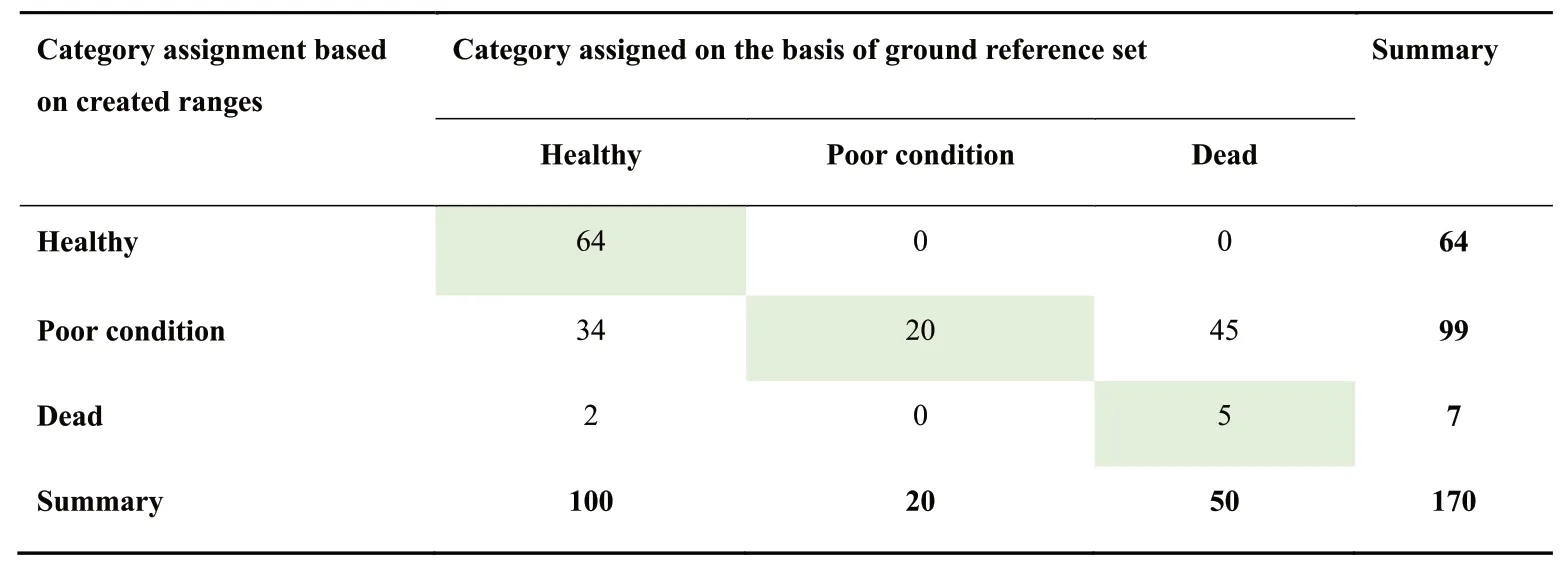
Table 5Results for a validation set of ITC#2 assigned in accordance with the value of the mean tree canopy temperature.Numbers in green blocks represent True Positives.

Table 6Accuracy Metrics of validation set for ITC#1(Individual Tree Canopies #1)and ITC#2(Individual Tree Canopies #2).
4.Discussion
4.1.Effectiveness of tree crown temperature estimation with thermal infrared data
High spatial resolution of the acquired airborne multisensor data(GSD=1 m)made it possible to analyze ITC and precisely determine their temperature.In this study we identified the average canopy temperature values ofP.abiesbased on thermal infrared and airborne laser scanning data fusion,and confirmed that the temperature of the‘healthy’tree class was lower than the‘poor condition’and the‘dead’tree classes(Fig.9).The biggest difference between individual‘healthy’and‘dead’trees reached above 5°C.Higher temperatures of‘poor condition’and‘dead’tree classes may result from both high degree of defoliation(Clark et al.,2012)and low chlorophyll fluorescence emission in discolored needles(Calder′on et al.,2013).Our research confirmed the assumption of Junttila et al.(2016)that high resolution thermal airborne data can be successfully used to distinguish dead and healthyP.abies.Moreover,a significant difference between the temperature of these classes was registered in the MWIR spectral range.
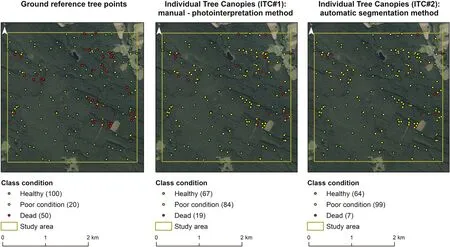
Fig.10.Comparison of tree condition classes assigned in the study area(Ground reference tree points)with the results of manual-photo interpretation method of Individual Tree Canopies(ITC#1)and automatic segmentation method of Individual Tree Canopy(ITC#2).In brackets,the number of assigned tree individuals to a given class was provided.
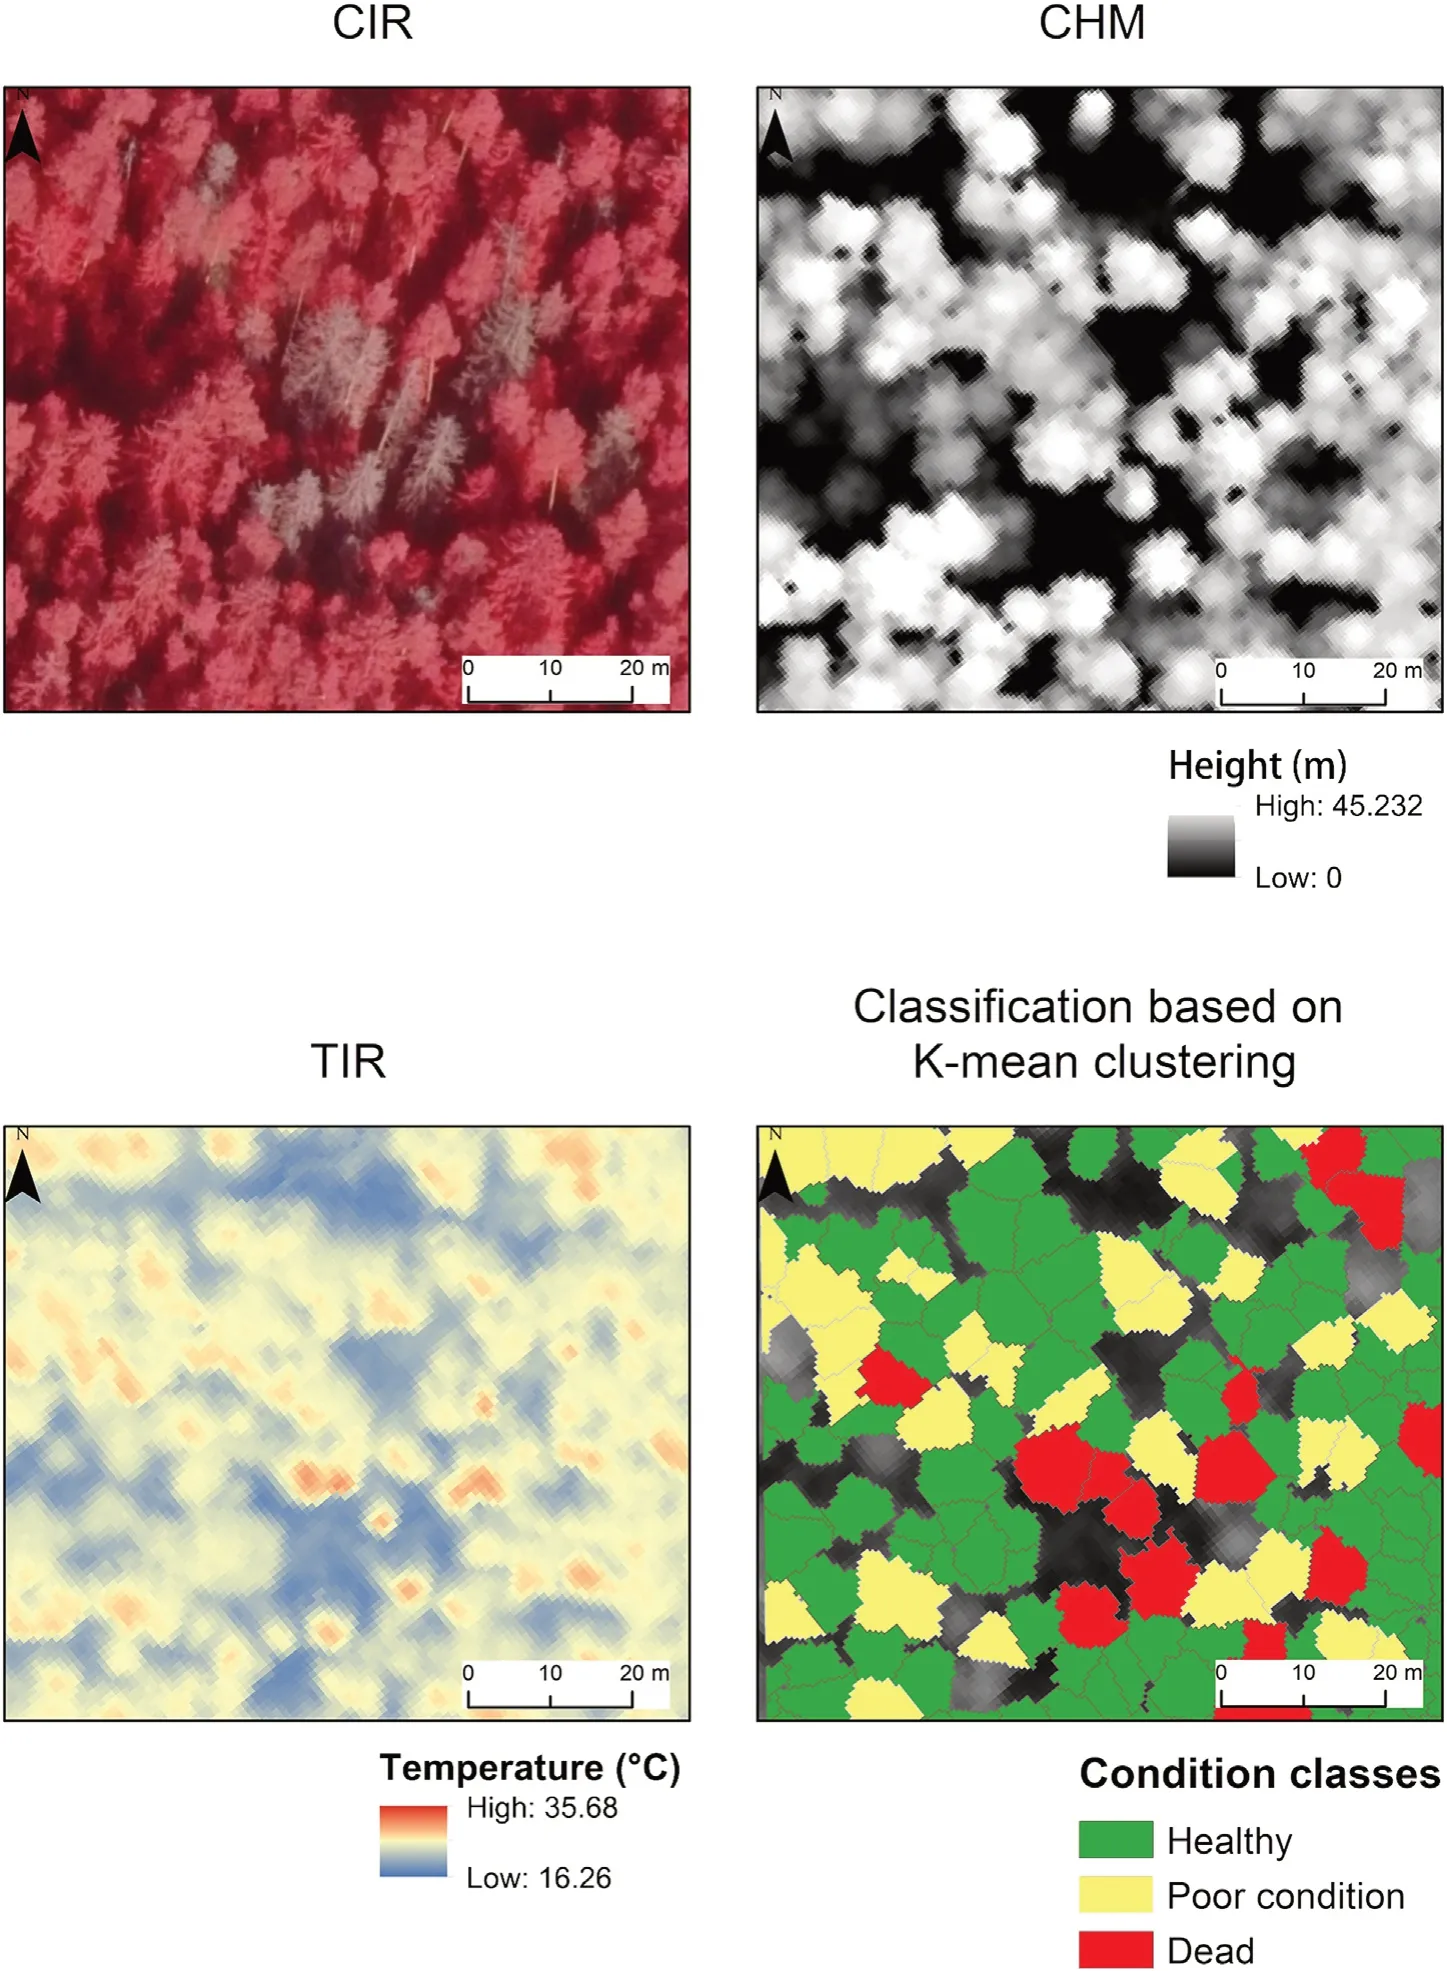
Fig.11.Fragment of the study area where classification based on K-mean clustering method was made in accordance with the mean canopy temperature values of all trees.Information about the health condition of P.abies was added to each segment based on the temperature limits assumed and established for each class.CIR:Color-Infrared;CHM:Canopy Height Model;TIR:Thermal Infrared.(For interpretation of the references to color in this figure legend,the reader is referred to the Web version of this article.)
In this study,ITC temperatures were determined for condition classes inP.abiesin homogeneous environment and under stable weather conditions,which made it possible to distinguish different health classes using thresholds(Table 3).The obtained values of the temperature ranges for the classes change depending on the weather conditions,the season and the illumination conditions.In order to be able to use them correctly to identify the health condition ofP.abieshealth,the workflow proposed in this research should be used to create condition classes of trees,based on the field reference for the conducted research.It can be assumed that the temperature values of the classes may be different,but the relationship between them can be constant.For now,it is still an issue,which must be studied in future research.
An attempt was also made to determine the transition class(‘poor condition’),which is the green attack phase.At this point,the‘poor condition’class has become a separate group(statistically significant),most of which are trees in‘poor condition’and‘dead’(Fig.8).Despite the low overall accuracy values,the results of the classification can be interpreted as creating a‘transition group’,in which there is a high probability that there are‘dead’trees and trees in‘poor condition’attacked by the bark beetle(Table 6).It is up to the user to verify the designated individuals in the field.Determination of the‘poor condition’class ofP.abiesusing only TIR data is difficult.In similar study,where thermal airborne data were used,thep<0.15 value for trees in poor condition was obtained(Junttila et al.,2016).In studies where satellite data and also the clustering method(a principal components analysis)were used,fragments of the forest dominated by the green attack phase were successfully delineated(Abdullah et al.,2018,2019).This confirms the possibility of using the workflow developed in this research for effective identification of,not the entire forest fragments,but individualP.abiestrees,which are dead or in poor health condition.At the same time,it showed the advantage of using TIR data to determineI.typographusinfestations in the‘green attack’phase.Determination of correlation between water content and vegetation temperature is widely used in remote sensing techniques,especially in agriculture studies(Hern′andez-Clemente et al.,2019).MWIR can be particularly precise in determining water content in vegetation(Gerber et al.,2011).Our research confirmed this statement,by separating‘healthy’trees from‘dead’trees and trees in‘poor condition’(Fig.7).
Even better results could be provided if TIR data would be collected together with other indices,which describes crown diameter and its structure,e.g.,leaf area index.Wang et al.(2022)found high correlation between shoot damage ratio and canopy temperature(determination coefficients of 0.7890 and 0.5532),proving the significant influence of tree structure on its temperature.Many results and methodologies,which were obtained from UAVs level,could be repeated at aircraft level.However,a different scale of study area and different resolution of airborne data could be a limiting factor for implementing these solutions.Eventually a fusion of satellite,aircraft and UAV data can be another way for sophisticated monitoring(Kakooei and Baleghi,2017).
4.2.Potential application of the results
Using an appropriate reference dataset and simple classification algorithms(such as K-mean clustering)available in programs like ArcGIS or Statistica,it is possible to isolate a group of trees with a high risk of attack by the bark beetle.It is still possible to process and identify this group quickly with the present method,contrary toI.typographusdetection methods which use hyperspectral data,thus requiring more complicated data processing.The Kappa score of 0.60 was obtained in other studies using hyperspectral data from the UAV level,examining three condition states(healthy,infested and dead)of individual tree crowns(N¨asi et al.,2015).A similar finding was also obtained for multi and hyperspectral data from UAV in Honkavaara et al.(2020),but their method was only good for small fragments of the forest.On the other hand,studies using satellite data also show high efficiency in detecting forest areas attacked byI.typographus,but with focuses on the analysis of entire forest fragments with limited presence and not on individual tree crowns(Filchev,2012;Immitzer and Atzberger,2014;Yang,2019).Another method of highly effective detection of attackedP.abies,especially in the green stage,is the use of airborne hyperspectral data(Hellwig et al.,2021).Here we established a new method,which combines both hyperspectral and thermal data,believing it would improve the results even more.As suggested by previous publications,the selection of data and methods for determining outbreaks ofI.typographusdepends primarily on the size of the study area,disturbance case and end-user requirements.The method presented in this research can be especially useful in forest management if there are small groups of dead trees in the environment or single infestedP.abiesover a large area.It is particularly important to consider the life cycle ofI.typographus,which may infest trees placed over 100 m away from earlier infestedP.abies(Stere′nczak et al.,2019).Dynamics ofI.typographusdevelopment is crucial in examining its outbreaks in the study area.In our research,the lack of synchronization of TIR data with ALS and CIR did not affect our findings,because in the study area no outbreak of the bark beetle was found between August 2019 and June 2020.Still,all airborne data(in the case of the application of the described method)should be obtained synchronously,and it is especially important for areas with high dynamics of bark beetle development.
The benefit of airborne TIR data is that the results are easy to interpret.Moreover,data can be quickly processed using basic Geographic Information System(GIS)software and the results can be applied in the field(Fig.11).An additional advantage of this method are lower acquisition costs.The drawbacks are difficulties in data processing(especially appropriate radiometric accuracy calibration),and problems with data acquisition under thermally stable conditions(Khanal et al.,2017).The temperature of the objects is a feature that changes over time,and it is difficult to be determined unequivocally.It depends primarily on the analyzed object and its emission properties(Bandfield and Smith,2003).Weather conditions(especially precipitation,average temperature,and air humidity)during the day and throughout the year are the second key factor.Canopy temperature depends on taxonomic affiliation,canopy architecture(its branching),ground,position in the field,and proximity of other objects(Zheng et al.,2018).For the study of mixed,multi-species forests,this method of canopy temperature assessment may work,because species have different canopy temperatures(Grace,1988).With so many factors that need to be taken into account,there is a problem to obtain thermally stable data with accurate radiometry.The potential for the application of TIR data in environmental studies is very high,but further research in this area is required to examine different tree species in various environments and determine suitable acquisition parameters.
5.Conclusions
The results of the studies conducted in WNP are an initial phase of research into the analysis of airborne TIR data application for the detection of dead and in‘poor condition’trees in forest communities.Airborne data with very high spatial resolution(GSD=1 m)made it possible to determine the canopy temperature of individual trees in various condition states and compare them.Based on the obtained result and reference to aims of this study,we draw the following conclusions:
1)TIR data registered in the spectral range of MWIR(3.6–4.9 μm)can be used to detectP.abiesthat are in‘poor condition’or dead due toI.typographusinfestation.A statistically significant difference was obtained between the three conditional states(‘healthy’,‘poor condition’,‘dead’).
2)The comparison of the effectiveness of identifying the tree health condition based on two methods of determining the individual range of tree canopy indicates that the automatic segmentation method(ITC#2)lowers the accuracy of the identification of dead trees by 11%compared to the manual method(ITC#1),obtaining the overall accuracy=0.52.The obtained results confirmed that TIR and ALS data fusion allow for creating a quick and simple workflow,which can successfully separate individual tree canopies and identifyI.typographusinvasion stages.The method based on the K-mean clustering algorithm and automatic segmentation of tree canopies based on CHM,allows to distinguish a class of‘healthy’trees with the producer's accuracy=0.64.The class of trees in‘poor condition’is distinguished by low user's accuracy=0.22 and‘dead’trees by producer's accuracy=0.10,because within these classes,individuals are mixed.Therefore,it can be concluded that the‘poor condition’class is a‘transition group’that contains trees from all condition classes with high probability ofI.typographusinfestation.
Further studies using TIR data are necessary,despite the fact that the‘transition group’has a high probability of making up individualP.abiestrees that are either‘dead’or‘in poor condition’.Increasing the precision of distinguishing trees depending on the invasive stage,should be prioritized in further studies,as identifyingI.typographusinfestation spots in the early stages of its attack and removing the infested tree is an effective method of reducing the bark beetle's population.
Author contributions
Conceptualization,D.K.;Supervision,D.K.;Investigation,A.Z.,Resources preparation,A.Z.;Statistical analysis,A.Z.;Data postprocessing,A.Z.;Results interpretation,A.Z.,D.K.;Writing–original draft,A.Z.;Draft correction,D.K.
Funding
This work was co-financed by the European Union from the European Social Fund under the“InterDOC-STARt”project(POWR.03.02.00–00-I033/16–00)and from the Operational Programme Infrastructure and Environment under the program 2.4.4d–assessment of the state of natural resources in national parks using modern remote sensing technologies,“Acquisition of multi-source remote sensing data and their analysis for the area of Wigry National Park with a part of Wigry lake and the Czarna Ha′ncza river”project.
Declaration of competing interest
The authors declare that they have no known competing financial interests or personal relationships that could have appeared to influence the work reported in this paper.
- Forest Ecosystems的其它文章
- Replanting of broadleaved trees alters internal nutrient cycles of native and exotic pines in subtropical plantations of China
- Fine root morphology and soil properties under influence of different tree stands along an altitudinal climosequence in the Carpathian mountains
- Ground-based/UAV-LiDAR data fusion for quantitative structure modeling and tree parameter retrieval in subtropical planted forest
- Effects of forest canopy density and epixylic vegetation on nutrient concentrations in decaying logs of a subalpine fir forest
- Urbanization strengthens the edge effects on species diversity and composition of woody plants in remnant forests
- Patterns of species diversity and its determinants in a temperate deciduous broad-leaved forest

