The Patatin-like Phospholipase Domain Containing Protein 7 (PNPLA7) Facilitates M2 Polarization of Macrophages Through a PPARγ-Dependent Mechanism
WANG Yu, HUANG Fei-Fei, HE Xiao-Hong, SUN Quan, CHANG Ping-An
(Chongqing Key Laboratory of Big Data for Bio-intelligence, College of Bio-information, Chongqing University of Posts and Telecommunications,Chongqing 400065, China)
Abstract Lysophosphatidylcholine (LPC) modulates the dynamic and integral process of macrophage polarization in immune responses, tissue inflammation and remodeling. Patatin-like phospholipase domain containing protein 7 (PNPLA7) was identified as an LPC-preferring lysophospholipase recently. However, the expression and role of PNPLA7 in macrophage polarization remained unknown. In the present study, PNPLA7 was found to be upregulated in the process of macrophage polarization toward an alternatively activated (M2) phenotype stimulated with interleukin 4 (IL-4) (P<0.05). We found that knockdown and overexpression of PNPLA7 decreased and increased the expression of M2 marker genes, including arginase 1 (Arg1) and chitinase-like 3 (Ym1), respectively (P<0.05). Further studies showed that PNPLA7 regulated the expression of peroxisome proliferator activated receptor-γ (PPARγ) at the mRNA and protein levels during M2 polarization (P<0.05). However, the phosphorylation of signal transducer and activator of transcription 6 (STAT6) was not influenced by PNPLA7. These findings suggest that PNPLA7 favors macrophage anti-inflammatory M2 polarization through a PPARγ-dependent mechanism.
Key words M2 macrophage; lysophosphatidylcholine(LPC); patatin-like phospholipase domain containing protein7; peroxisome proliferator activated receptor-γ (PPARγ)
As an essential player in the innate immune system, macrophages function in the inflammation and host defense response against different pathogens[1].Traditionally, two different activation states of macrophages have been defined-classically activated (M1) and alternatively activated (M2) states, which mirror the polarization of T cells toward T-helper type 1 (Th1) and type 2 (Th2) cells, respectively[2,3]. Lipopolysaccharide (LPS), interferon-γ (IFN-γ), and tumor necrosis factor α (TNFα) often stimulate macrophages toward the M1 phenotype, whereas M2 macrophages are induced with interleukin (IL) 4 (IL-4) or IL-13[4]. M1 macrophages produce pro-inflammatory mediators, including IL-1β, IL-6, inducible nitric oxide (NO) synthase (iNOS), and TNFα, with strong tumoricidal and microbicidal activity[5]. In contrast, M2-macrophages upregulate scavenger, mannose and galactose receptors, IL-1 receptor antagonist and decrease IL-1b and other pro-inflammatory cytokines, exhibiting anti-inflammatory functions[2].To date, the molecular mechanisms underlying macrophage polarization are not fully understood.
Lipid signaling is increasingly recognized to modulate inflammation and immune responses. Lysophosphatidyl choline (LPC) plays different roles or even opposite roles in the development of inflammatory diseases, depending on the acyl chain length and degree of saturation of LPC[6,7]. Saturated LPCs, including 16∶0 LPC, function as a potent inflammatory mediator to promote immune cell migration and the release of pro-inflammatory cytokines[6,7]. In contrast, unsaturated LPCs, especially polyunsaturated acyl LPCs such as 20∶4 and 22∶6 LPC, server as an anti-inflammatory lipid mediator, and inhibit the inflammation effect of saturated LPCs[8]. Due to the distinct roles of M1 and M2 macrophages in the inflammation, LPC may participate in the polarization of macrophages toward M1 and M2 phenotypes[7]. LPC 16∶0, promotes the development of macrophages toward an M1 phenotype via a pathway mediated by its receptor G2A, a G protein coupled receptor (GPCR), and increases the production of pro-inflammatory cytokines in macrophages[9,10]. However, schistosomal-derived LPCs, mostly LPC 16∶0 and LPC 18∶0, facilitate M2 polarization of macrophages through a peroxisome proliferator activated receptor-γ (PPARγ)-dependent pathway for immunomodulatory functions[11]. Thus, different LPCs might have distinct effects on macrophages polarization.
The metabolism of LPC is directly controlled by various enzymes. Phospholipases A2(PLA2s) cleavage phosphatidylcholine (PC) to produce LPC[12]. In contrast, lysophosphatidylcholine acyltransferases (LPCATs) convert LPC to PC in the presence of acyl-CoA[12]. In addition, LPC can be catalyzed by lysophospholipases A1, C and D[12]. Recently, we identified patatin-like phospholipase domain containing protein 7 (PNPLA7) as an intracellular LPC-preferring lysophospholipase, which hydrolyzes LPC to glycerophosphocholine (GPC) and free fatty acid (FFA)[13]. In the PNPLA family, PNPLA7 belongs to the second subgroup, which contains PNPLA6 and PNPLPA7[14,15]. PNPLA6, also named neuropathy target esterase (NTE), exhibits potent phospholipase activity to deacylate PC and LPC[16,17]. PNPLA6 is mainly expressed in the nervous system, particularly in the brain and spinal cord, and in several non-neuronal tissues including the kidney, liver, testis and spleen[18]. PNPLA7 is highly expressed in the testis and insulin target tissues such as the skeletal muscle, heart, and adipose tissue[19]. Whether PNPLA6 and PNPLA7 play a role in macrophage polarization is still unknown. In the current study, the expression ofPnpla7 was found to be higher than that ofPnpla6 in macrophages, and PNPLA7 favored the M2 phenotype of macrophages through a PPARγ-dependent mechanism.
1 Materials and Methods
1.1 Materials
6-8 week-old WT C57BL/6 mice were obtained from the Experimental Animal Center of Chongqing Medical University. RAW264.7 cells were obtained from the Shanghai Cell Center of Chinese Academy of Sciences. The lentiviral pLVX IRES Puro constructs to express GFP and PNPLA7-GFP, Mission®lentiviral pLKO.1 vectors encoding for scrambled shRNA or shRNA targeting murine PNPLA7 were maintained in our laboratory[13]. IL-4 was purchased from PeproTech. The MiniBEST Universal RNA Extraction Kit, PrimeScriptTMII 1st Strand cDNA Synthesis Kit and TB Green® Fast qPCR Mix were purchased from TaKaRa. The STAT6 (C9) mouse monoclonal antibody (mAb) was purchased from Santa Cruz Biotechnology. β-Actin mouse mAb, α-Tubulin mouse mAb, PPARγ rabbit mAb, and Phospho-Stat6 (Tyr641) rabbit mAb were obtained from Cell Signaling Technology. Goat anti-Rabbit IgG (H+L) Highly Cross-Adsorbed Secondary Antibody Alexa Fluor® 647 conjugate was purchased from ThermoFisher Scientific.
1.2 Cell culture and treatment
RAW264.7 cells were cultured in Dulbecco’s modified Eagle’s medium (DMEM) supplemented with 10% FBS, 100 units/mL penicillin, and 100 μg/mL streptomycin. Cells were maintained at 37℃, 95% humidity and 5% CO2. RAW264.7 cells were stimulated with 20 ng/mL IL-4 for the indicated times toward an M2 state.
1.3 Bone marrow-derived macrophage (BMDM) culture and treatment
Mice were kept on a 12 h/12 h light/dark cycle with standard chow. Mice were sacrificed by ether anesthesia and the bone marrow was collected immediately. Macrophages derived from the bone marrow were cultured according to an established protocol[20]. Briefly, the bone marrow was flushed from femur and tibia with culture media under aseptic conditions. Single-cell suspensions of the bone marrow were then cultured in DMEM containing 10% heat-inactivated FBS, 100 U/mL penicillin, 100 μg/mL streptomycin, and 20% L929 cell-conditioned complete medium to prepare macrophages. Macrophages were collected using an 18-gage needle to spray cells with PBS containing 1 mmol/L EDTA. Macrophages were plated for 24-48 h and stimulated with 20 ng/mL IL-4 for the indicated duration toward an M2 state. Cells were treated with vehicles alone as naïve macrophages.
1.4 Generation of lentivirus and stable infection of RAW264.7 cells
According to the manufacturer’s instructions (Clontech, Mountain View, CA, USA), lentiviral particles harboring pLVX IRES Puro vectors for the expression of GFP and PNPLA7-GFP proteins or pLKO.1 vectors for the expression of shRNAs were generated in HEK293 T cells. Before transduction, RAW 264.7 cells were seeded into 6-well plates at a density of 3×10⁵cells per well. Cells were incubated for 24 h with lentivirus-containing supernatants in the presence of 8 μg/mL polybrene. To select for stable expression, cells were maintained for 7 days in medium containing 2 μg/mL puromycin. The selected stable cell clones were verified by Western blotting or real-time quantitative PCR (qPCR) and maintained in BMDM culture containing 0.5 μg/mL puromycin.
1.5 Real-time qPCR
Total RNA was extracted and genomic DNA was digested with DNase I during the process. Total RNA was then reverse transcribed to cDNA with random primers. Synthesized cDNA was diluted at a ratio of 1∶10 as the template. Real-time qPCR was performed with Fast SYBR® Green Master Mix on a QuantStudio 3 Real-time PCR System. The following primers were used:Pnpla7 FW 5′-CGTGTTTTCCAACGACCACC-3′,Pnpla7 RV 5′-TCTGCTAGTGCCCTGAGGAT-3′,Pnpla6 FW 5′-CGGGTGCAGAAAACTCCAG-3′,Pnpla6 RV 5′-CGCATA ATCTTCCGGCCATAGA-3′, 36B4 FW 5′-GTGTTCGACA ATGGCAGCAT-3′, 36B4 RV 5′-GACACCCTCCAGGAAG CGA-3′,Arg1 FW 5′-TTGGGTGGATGCTCA CACTG-3′,Arg1 RV 5′- TTGCCCATGCAGATTCCC-3′;Ym1 FW 5′-GGGCATACCTTTATCCTGAG-3′,Ym1 RV 5′-CCACTGA AGTCATCCATGTC-3′,PparγFW 5′-TTGCTGAACGTGA AGCCCATCGAGG-3′,PparγRV 5′-GTCCTTGTAGATCT CCTGGAGCAG-3′,Stat6 FW 5′-CTGGGGTGGTTTCCTC TTG-3′,Stat6 RV 5′-GCCCGGTCTCACCTAACTA-3′, transforming growth factor beta-1(Tgfβ-1) FW 5′-CCT GCAAGACCATCGACATG-3′,Tgfβ-1 RV 5′-TGTTGT ACAAAGCGAGCACC-3′. To account for differences in cell numbers, all cycle threshold (Ct) values of sample replicates were normalized to that of 36B4. Relative mRNA levels are expressed as the fold change relative to controls with the ΔΔCt method[21].
1.6 Immunoblotting analysis
Cells were harvested, briefly sonicated, and then lysed using RIPA buffers with protease and phosphatase inhibitors, followed by centrifugation at 15 000 g for 15 min at 4 ℃. Total proteins of the supernatant was determined with a Pierce BCA Protein Assay Kit, followed by immunoblotting. Samples were subjected to SDS-PAGE and transferred onto nitrocellulose membranes. Membranes were incubated with blocking buffers (TBST containing 5% BSA) for 1 h, followed by incubation with primary antibodies at 4 ℃ overnight. Antibodies were diluted in blocking buffers at a ratio of 1∶1 000, with the exception of anti-α-tubulin (1∶5 000) and anti-β-actin (1∶5 000). After secondary HRP staining, the protein signal was detected by enhanced chemiluminescence. The blots were quantitated by ImageJet (1.43) software.
1.7 Immunofluorescence analysis
Cells seeded in 12-well plate were fixed with 4% formaldehyde in PBS for 15 min at room temperature and rinsed three times in PBS for 5 min each. Then cells were permeabilized with ice-cold 100% methanol for 10 min at -20℃ and blocked in blocking buffers (1×PBS/5% normal goat serum 0.3% Triton X-100) for 60 min. The cells were incubated with an anti-PPARγ antibody (1∶100 dilution in 1×PBS/1% BSA/0.3% Triton X-100 buffer ) for overnight at 4℃. After washing with three times in PBS for 5 min each, the cells were incubated with goat anti-Rabbit IgG (H+L) Highly Cross-Adsorbed Secondary Antibody Alexa Fluor®647 conjugate at a concentration of 2 μg/mL in PBS containing 0.2% BSA for 1-2 h at room temperature in the dark. 0.5 μg/mL DAPI was used for nuclear counter staining. Fluorescent images were acquired with BioTek’s Lionheart LX Automated Microscope. All the presented experiments were repeated independently at least 3 times.
1.8 Statistical analysis
Data are presented as mean ± standard deviation (SD). Groups were compared by one-way ANOVA and by post hoc analysis using the Student-Keuls method. A significant difference between means was determined asP< 0.05.
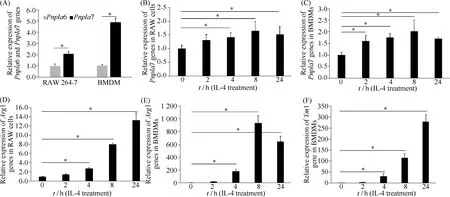
Fig.1 Pnpla6 and Pnpla7 expression in naïve and M2 macrophages RNA was isolated from RAW 264.7 cells and BMDMs, and cDNA was prepared for RT-qPCR analyses. (A) Expression of Pnpla6 and Pnpla7 messages in naïve macrophages. (B) and (C) mRNA expression of Pnpla7 in RAW 264.7 cells and BMDMs after alternative activation at the indicated IL-4 stimulation times. (D), (E) and (F) The expression of M2 marker genes, Arg1 and Ym1, in RAW cells and BMDMs at the indicated IL-4 treatment time. Data are the means ± SD generated from 5 independent measurements.*P<0.05, n=5
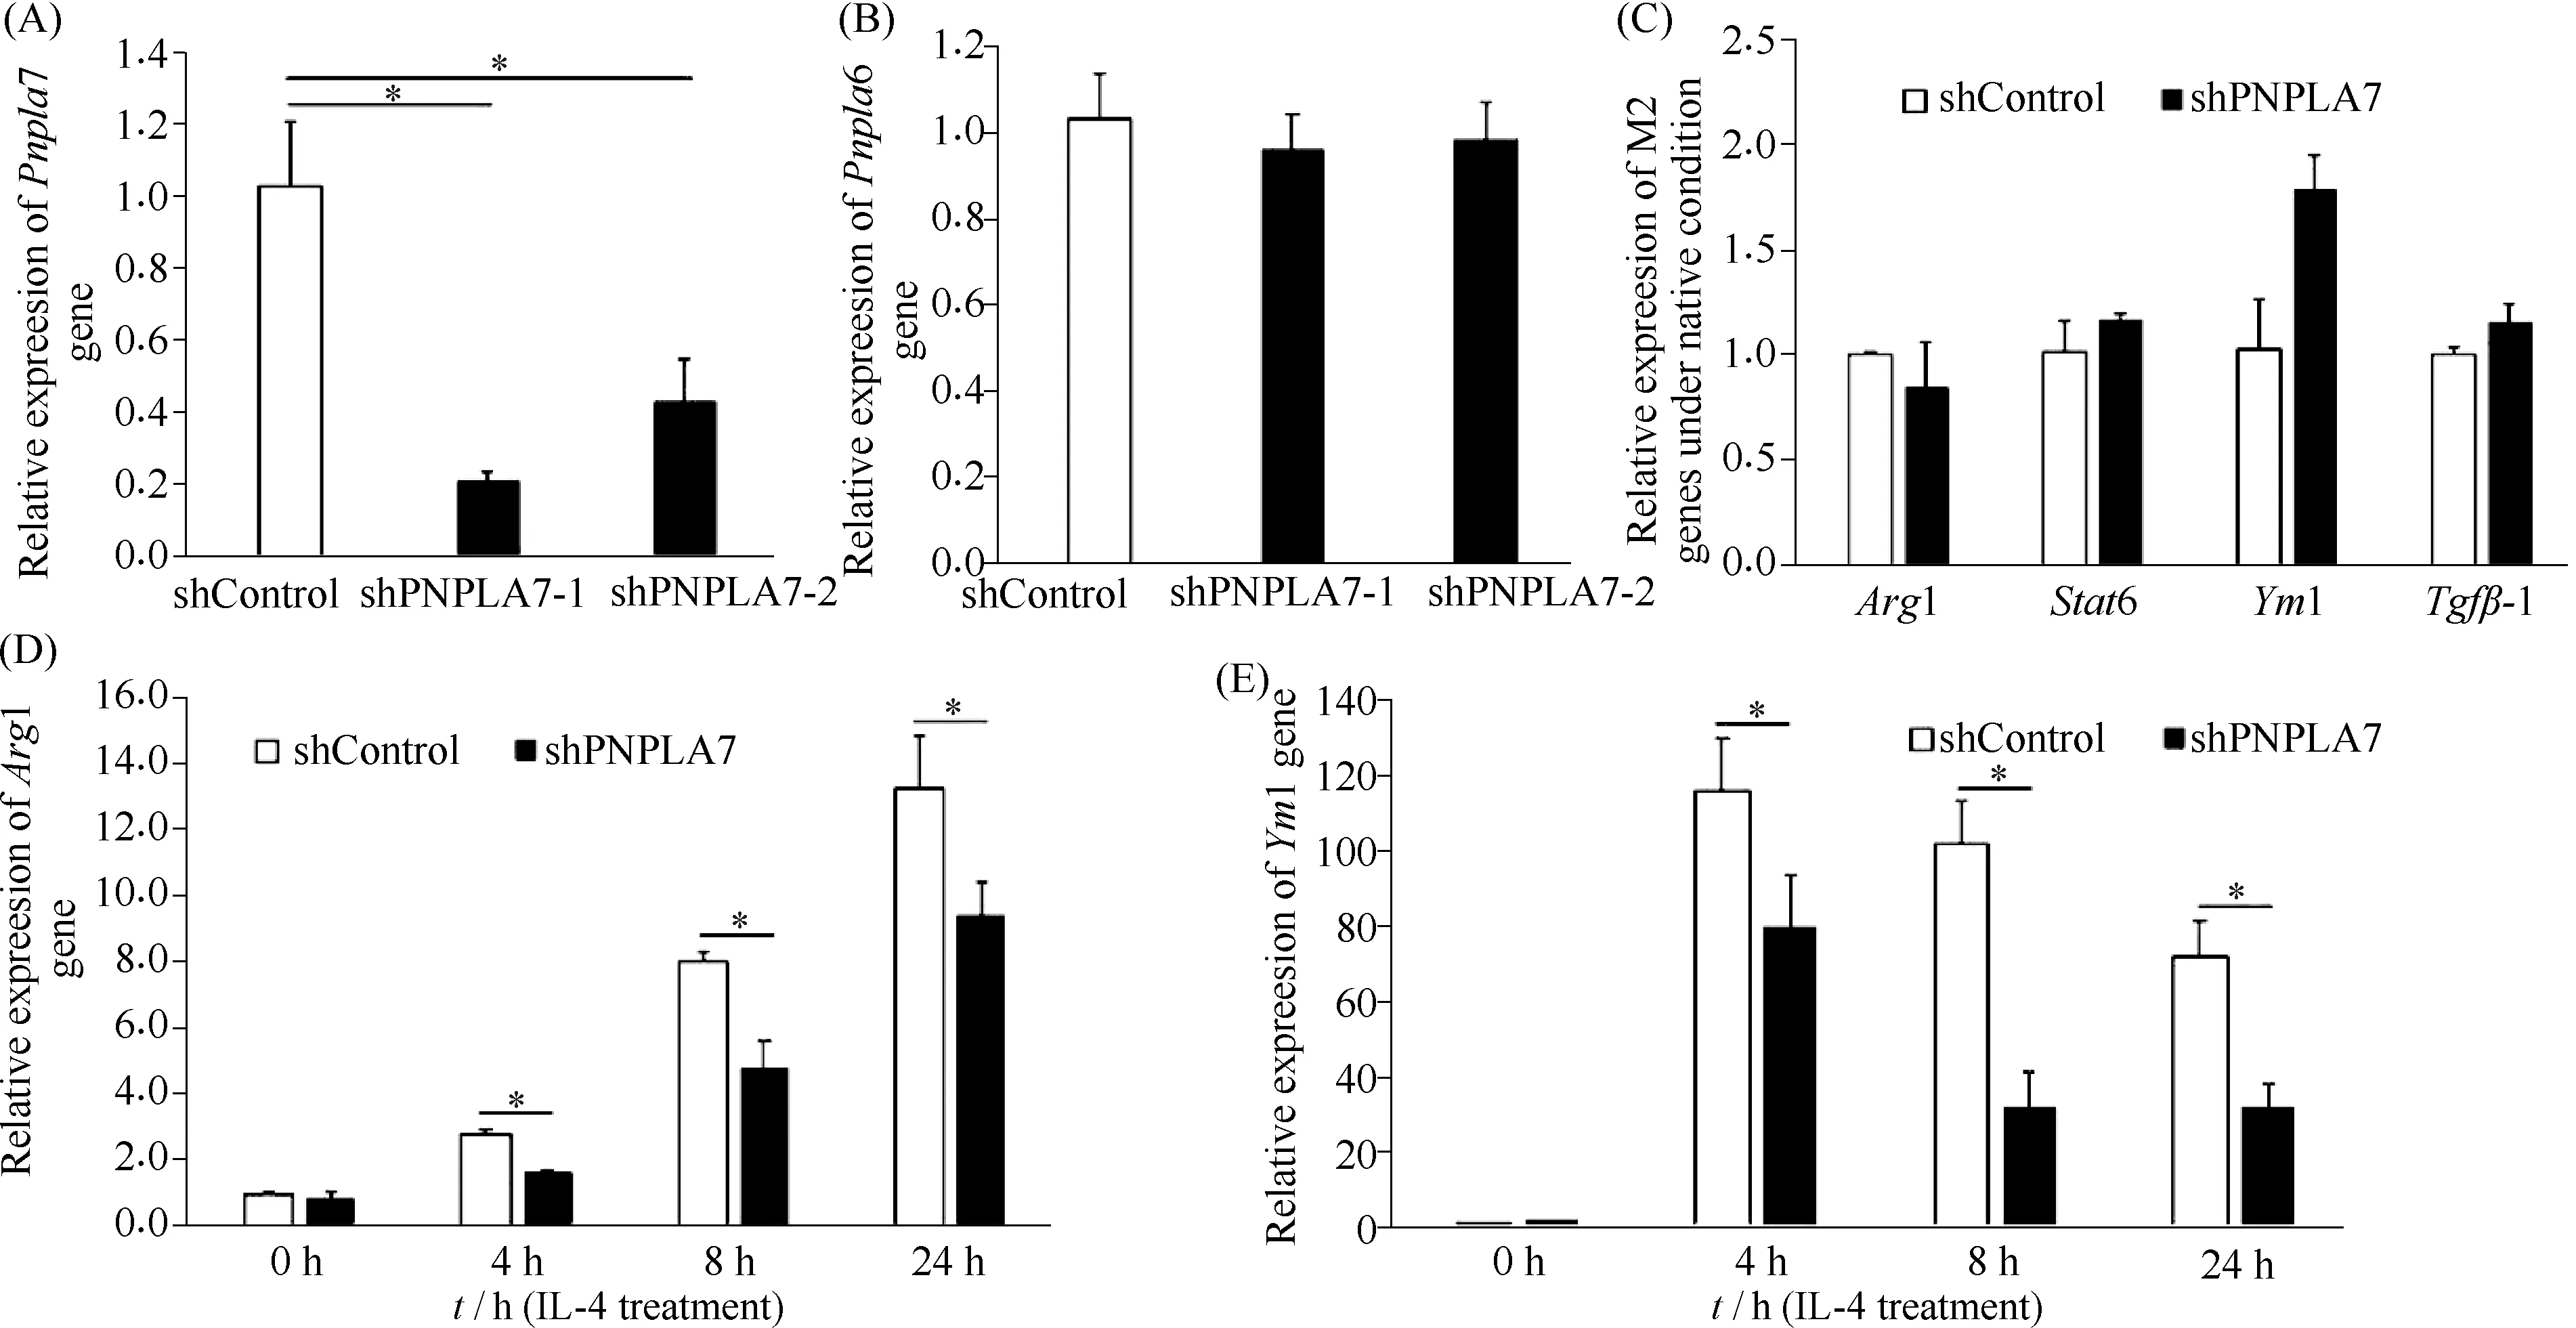
Fig.2 M2 markers in control (shControl) and PNPLA7 knockdown (shPNPLA7) macrophages Macrophage RNA was isolated under naïve conditions at the indicated alternative activation times, and cDNA was prepared for RT-qPCR analyses. (A) and (B) The expression of Pnpla7 and Pnpla6 genes in control (shControl) and PNPLA7 knockdown (shPNPLA7-1 and shPNPLA7-2) macrophages. Data were presented as the fold change of control cells. (C) Naïve conditions. Fold expression of each marker relative to control cells was presented. (D) and (E) Fold induction by IL-4 relative to their own naïve conditions was presented. Data were the means ± SD. n=5 independent measurements.*, shPNPLA7 group significantly different from corresponding control, P <0.05
2 Results
2.1 Pnpla7 was upregulated during macrophages polarization to an M2 state
The expression ofPnpla6 andPnpla7genesin macrophages including mouse RAW 264.7 cells and BMDMs was detected by RT-qPCR. As shown in Fig.1A, the mRNA levels ofPnpla7 were significantly higher than those ofPnpla6 in both types of macrophages under naïve conditions (P<0.05). This suggested that PNPLA7 may play a role in macrophages. After stimulation with IL-4, macrophages were polarized toward an M2 phenotype. Compared with macrophages without IL-4 treatment, the expression ofPnpla7 was upregulated after IL-4 challenges at the indicated times in RAW cells and BMDMs (P<0.05) (Fig.1B and 1C). At the same time, the mRNA levels of M2 macrophage marker genesArg1 andYm1 were also elevated (P< 0.05) (Fig.1D, 1E and 1F), indicating that macrophages were polarized to the M2 state. Thus, PNPLA7 could be involved in M2 polarization of macrophages.
2.2 Knockdown of PNPLA7 suppressed M2 polarization of macrophages
Next, we examined whether PNPLA7 expression influenced polarization of macrophages toward the M2 phenotype. Firstly, we knocked-down endogenousPNPLA7 in murine RAW macrophages by RNAi and assessed the expression of M2-related markers. Stable expression of two independent shRNA constructs targeting PNPLA7 (shPNPLA7-1 and shPNPLA7-2) reduced cellularPnpla7 mRNA concentrations by 78% and 50%, respectively, compared to cells expressing control scrambled shRNA (shControl) (P<0.05) (Fig.2A). In contrast, the expression of the closely relatedPnpla6 was unchanged (Fig.2B). Thus, cells stably expressing shPNPLA7-1 were selected for the following experiments.
Then, macrophages were stimulated with IL-4 for different durations and analyzed for the expression of various M2-related markers by RT-qPCR. The widely used M2 markers includedArg1,Stat6,Ym1 andTgfβ-1. Under naïve conditions, mRNA levels of these M2-related marker genes were unchanged in shPNPLA7 cells relative to shControl cells (Fig.2C). Under M2 polarizing conditions, expression ofArg1 andYm1 genes was markedly increased compared with under naïve conditions, but induction ofArg1 andYm1 was significantly decreased in shPNPLA7 macrophages relative to the control group at the indicated times (P<0.05) (Fig.2D and 2E). These findings suggested that M2 phenotype was suppressed in macrophages withPnpla7 knockdown.
2.3 Reduction of PNPLA7 downregulated the expression of PPARγ
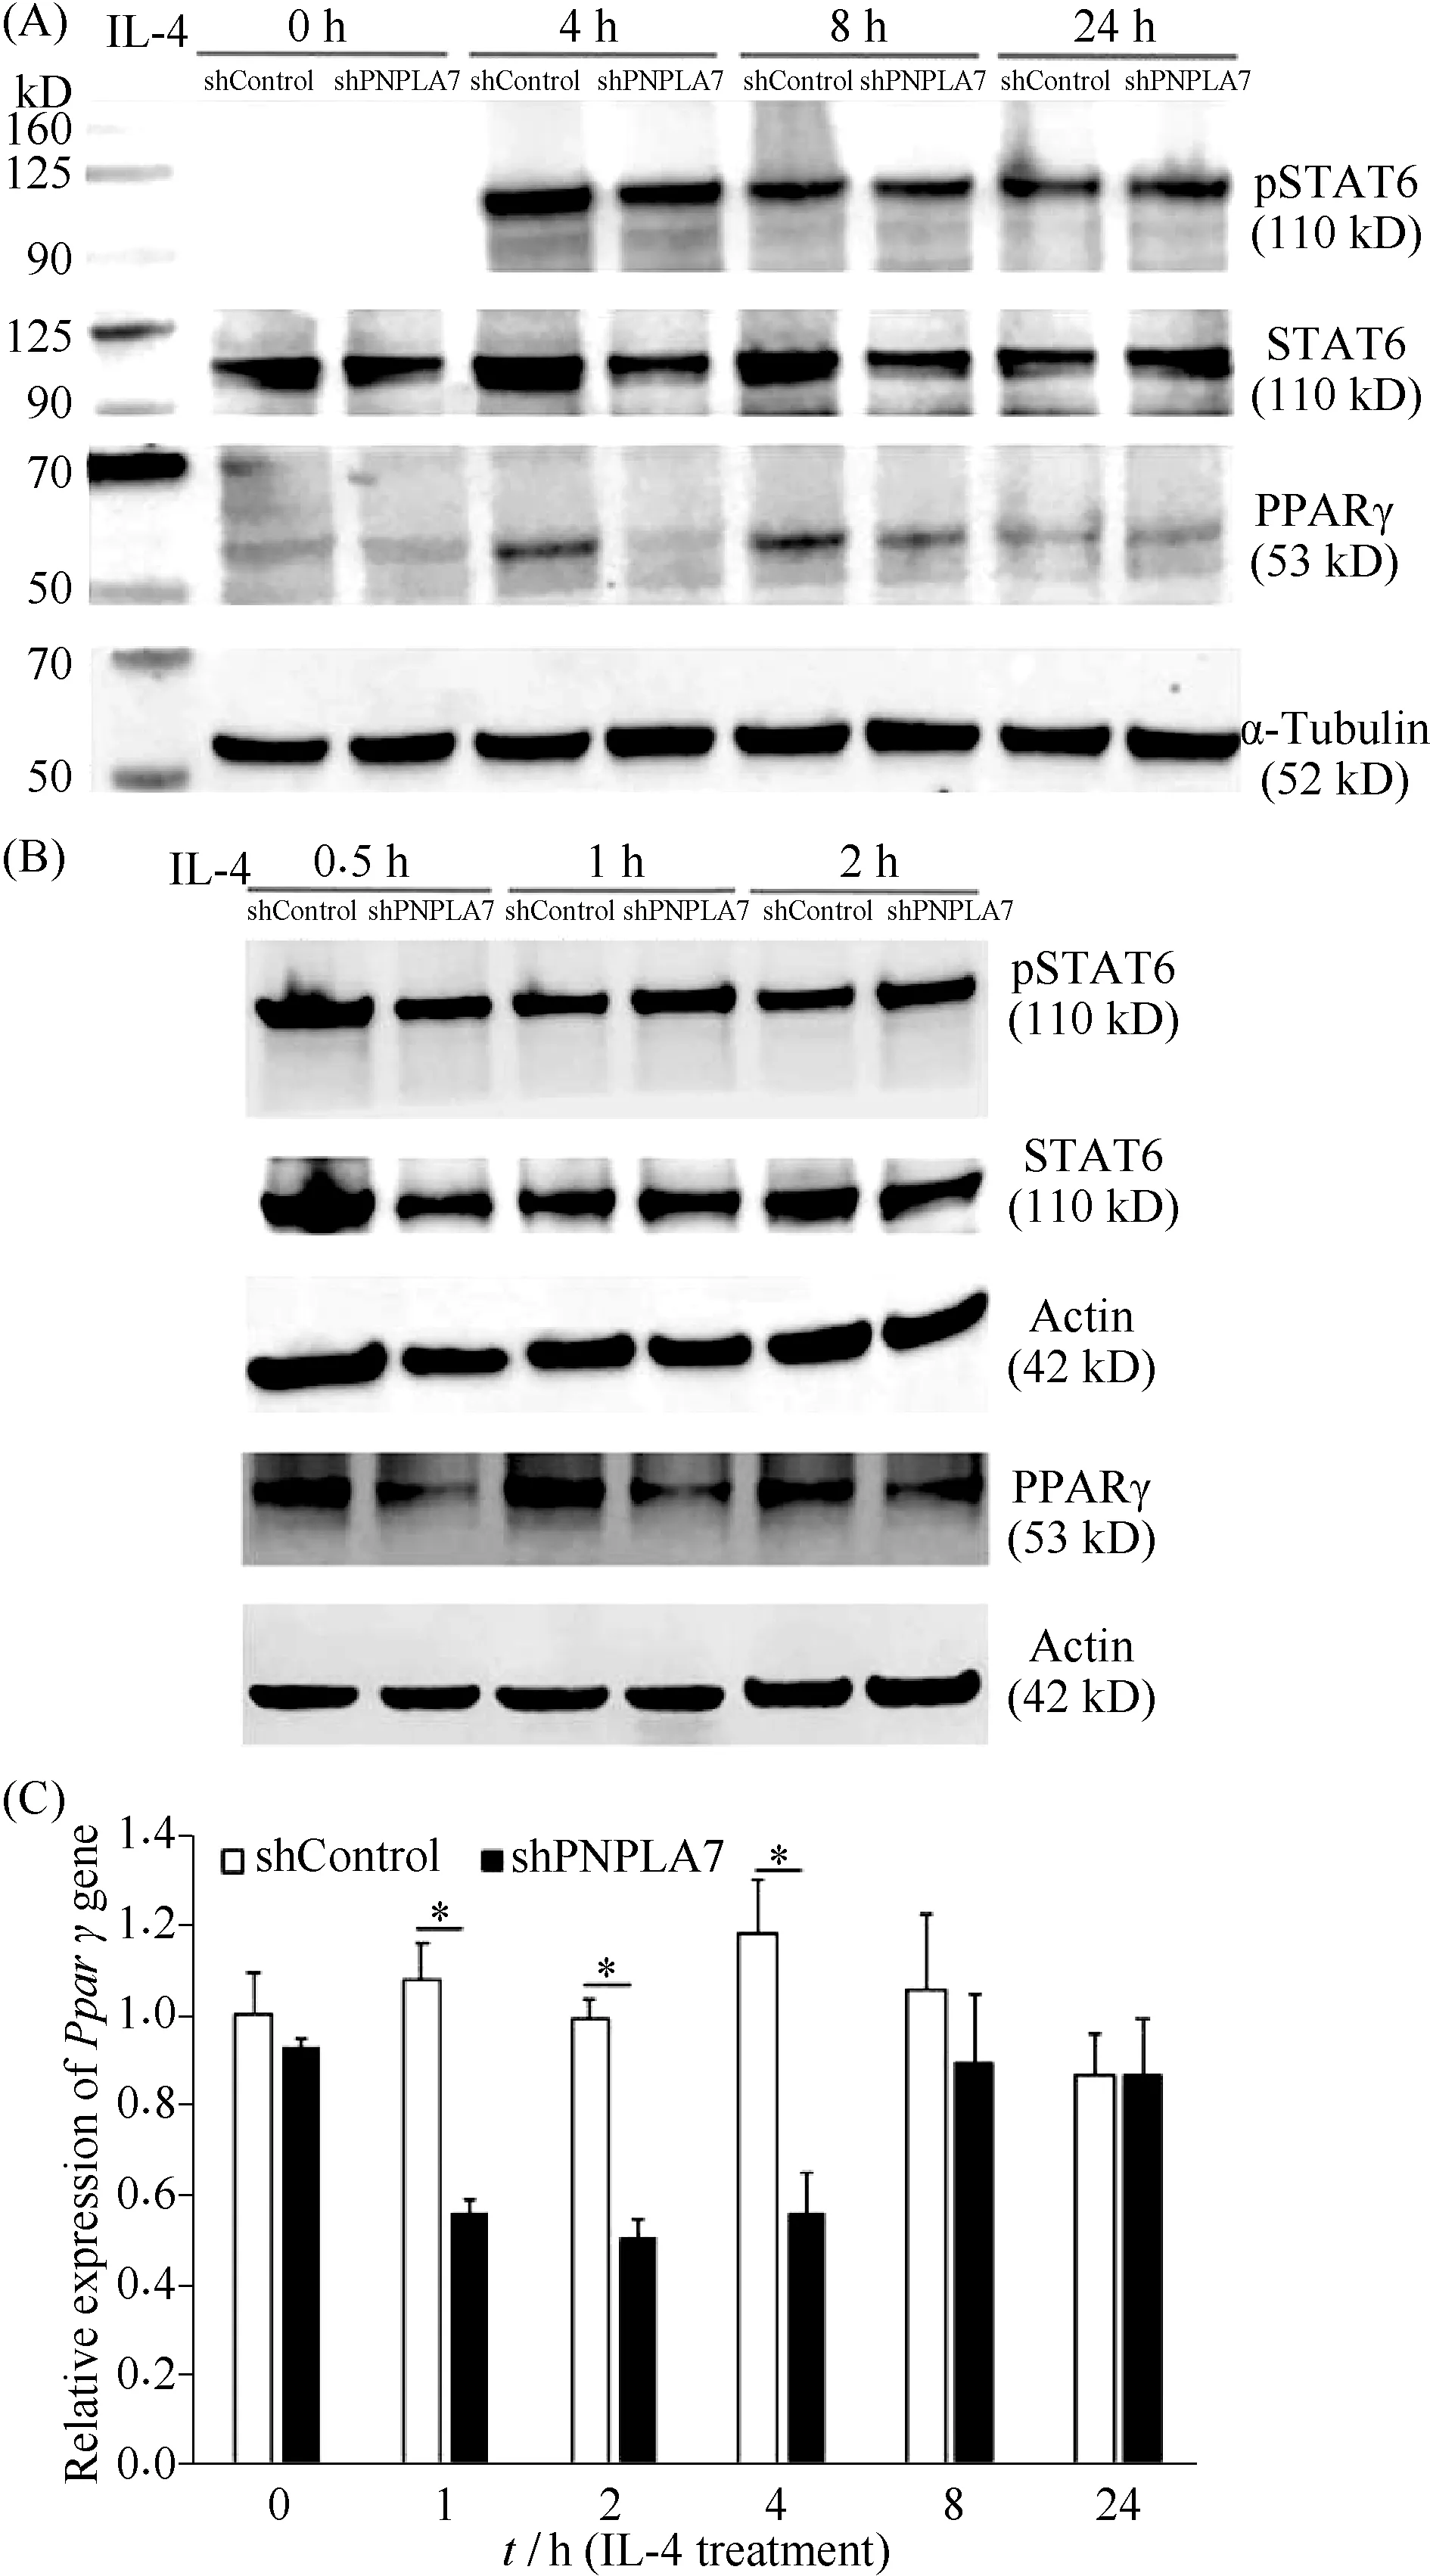
Fig.3 The expression of PPARγ was decreased in PNPLA7-knockdown macrophages (A) and (B) The expression of total STAT6, phosphorylated STAT6 (pSTAT6), PPARγ, α-tubulin and β-actin was detected by immunoblotting assays in shControl and shPNPLA7 cells treated with IL-4 for the indicated times or not (0 hour). Migration of molecular mass standard proteins was indicated on the left of the figure. Figures were representative of 3 independent experiments. (C) mRNA expression of Pparγ was detected by RT-qPCR analyses. Data are the means ± SD.*P <0.05, n=5
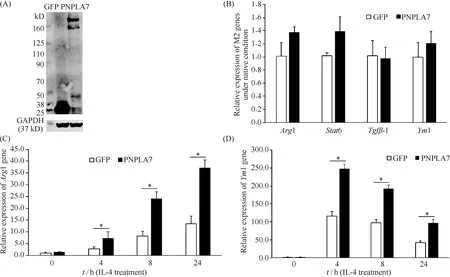
Fig.4 M2 markers in control GFP-expressing (GFP) and PNPLA7-GFP expressing (PNPLA7) macrophages (A) Western blotting of PNPLA7-GFP expression in GFP and PNPLA7-GFP expressing RAW cells using an anti-GFP antibody. Migration of molecular mass standard proteins was indicated on the left of the figure. Figures were representative of three separate experiments. (B) Total RNA was isolated under naïve conditions and cDNA was prepared for RT-qPCR analyses. Fold expression of each marker relative to control naïve was presented. (C) and (D) Fold induction of Arg1 and Ym1 by IL-4 relative to their own naïve conditions at the indicated treatment times was presented. Data were the means ± SD. n=5 independent measurements.*, PNPLA7-overexpression group significantly different from corresponding control, P <0.05
The phosphorylation of signal transducer and activator of transcription 6 (STAT6) at Tyr641 activates transcription of M2 macrophage-specific genes, such asArg1 andYm1[22]. In addition, IL-4 stimulation strongly induces expression of peroxisome proliferator activated receptor-γ (PPARγ)[23], and activation of PPARγ is essential for M2 macrophage polarization[24]. We wondered whether the reduction of M2 phenotype by the suppression of PNPLA7 correlates with STAT6 phosphorylation status and PPARγ levels. We found that STAT6 was not phosphorylated in both shControl and shPNPLA7 macrophages under naïve conditions (0 h) (Fig.3A). In contrast, STAT6 was phosphorylated in IL-4 stimulated macrophages (Fig.3A). However, the levels of phosphorylated STAT6 normalized to total STAT6 were not significantly altered in shPNPLA7 macrophages compared to control macrophages after IL-4 treatment for 4, 8 and 24 h (Fig.3A). At the same time, the expression of PPARγ was significantly downregulated by knockdown ofPNPLA7 after IL-4 activation, especially at 4 and 8 h (Fig.3A). Because the changes in STAT6 phosphorylation and PPARγ expression after IL-4 stimulation may occur at earlier times than M2-related marker genes, we detected the levels of total and phosphorylated STAT6, as well as PPARγ after IL-4 stimulation for 0.5, 1 and 2 h. As shown in Fig.3B, there were no apparent changes in STAT6 phosphorylation between control andPNPLA7 knockdown macrophages. However, PPARγ levels inPNPLA7-knockdown macrophages were significantly lower than those in control cells at an early stage. At the transcription levels, knockdown ofPNPAL7 reduced mRNA levels ofPparγat the early stages of M2 polarization, including at 1, 2 and 4 h after IL-4 challenge (P<0.05) (Fig.3C). Thus, PNPLA7 regulated the expression of PPARγ, a key factor related to M2 polarization, but not STAT6, which is required for macrophage polarization to the M2 state.
2.4 Overexpression of PNPLA7 favored M2 polarization of macrophages
Further, we examined whether overexpression of PNPLA7 affects polarization of M2 macrophages. We firstly created cell lines stably expressing PNPLA7-GFP or control GFP, respectively. RAW microphages stably expressing PNPLA7-GFP or GFP were confirmed by immunoblotting analysis with an anti-GFP antibody (Fig.4A). Then, macrophages were treated with IL-4 and the expression of various M2-related markers were analyzed. Under naïve conditions, mRNA levels of M2-related marker genes includingArg1,Stat6,Ym1 andTgfβ-1, were not affected in PNPLA7-expressing macrophages relative to GFP-expressing cells (Fig.4B). When macrophages were stimulated with IL-4, the expression ofArg1 andYm1 was significantly increased in PNPLA7-overexpressing macrophages compared to the control GFP group at 4, 8 and 24 h (P<0.05) (Fig.4C and 4D). These results indicated that overexpression of PNPLA7 facilitated M2 polarization of macrophages.
2.5 Overexpression of PNPLA7 promoted the expression of PPARγ
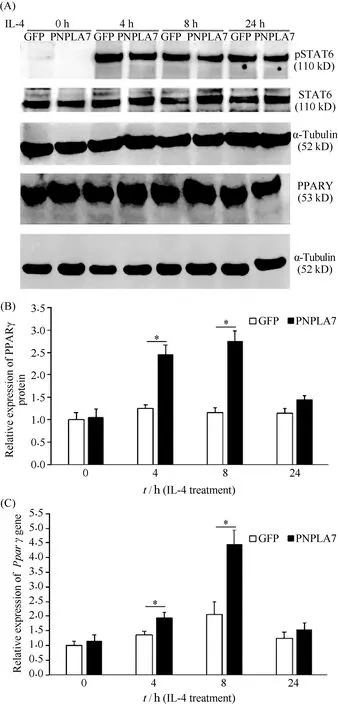
Fig.5 The expression of PPARγ is upregulated in PNPLA7 overexpression macrophages (A) Immunoblotting assays of total STAT6, pSTAT6, PPARγ and α-tubulin proteins in GFP- and PNPLA7-expressing cells treated with IL-4 for 4, 8 and 24 hours or not (0 hour). Migration of molecular mass standard proteins was indicated on the left of the figure. Figures were representative of three separate experiments. (B) The levels of PPARγ were quantified with normalization to α-tubulin and presented as the fold change of control cells without IL-4 stimulation. (C) mRNA expression of PPARγ was detected by RT-qPCR analyses and presented as the fold change of control cells at 0 hour. Data are the means ± SD.*, P<0.05, n = 5
We then asked whether the promotion of M2 phenotype by PNPLA7 was related to STAT6 phosphorylation status and PPARγ levels. As shown in Fig.5A, PNPLA7 did not significantly influence the expression of phosphorylated STAT6 normalized to total STAT6 in macrophages compared with GFP-expressing macrophages after IL-4 incubation for 4, 8 and 24 h. However, the expression of PPARγ was significantly upregulated by PNPLA7 overexpression after IL-4 activation at 4 and 8 h after IL-4 stimulation (P<0.05) (Fig.5A and 5B). Compared with GFP control cells, overexpression of PNPAL7 increased mRNA levels ofPparγat 4 and 8 h after IL-4 stimulation (P<0.05) (Fig.5C). The enhanced expression of PPARγ by PNPLA7 overexpression was further verified using immunofluorescence analysis (Fig.6). PPARγ was localized in the nucleus. In PNPLA7-expressing cells, the fluorescence of PPARγ normalized to that of the nucleus stained with DAPI was intensifier than that in GFP-expressing macrophages. Thus, overexpression of PNPLA7 upregulated PPARγ at the mRNA and protein levels to favour M2 macrophage polarization.
3 Discussion
The signaling cascade in the LPC metabolism is complex. These enzymes are coordinated to maintain LPC homeostasis, which would otherwise lead to metabolic disorders of LPC, resulting in various diseases. LPC modulates macrophage polarization, and several enzymes involved in LPC metabolism have been demonstrated to control macrophage polarization. Knockdown or inhibition of lysophosphatidylcholine acyltransferase 2 (LPCAT2) and lipoprotein-associated phospholipase A2 (Lp-PLA2) suppressed the differentiation into M1 macrophages[25,26]. In contrast, knockdown of group IVC phospholipase A2, andLPCAT3 favored M1 polarization[27,28]. Reduction of group VIA phospholipase A2facilitated polarization of macrophages toward M2 phenotype[29], whereas knockdown of group IVC phospholipase A2suppressed the differentiation into M2 macrophages[27]. We present data here that PNPLA7 was involved in the polarization of macrophages toward M2 phenotype, and reduction of PNPLA7 suppressed M2 polarization whereas PNPLA7 overexpression promoted it.
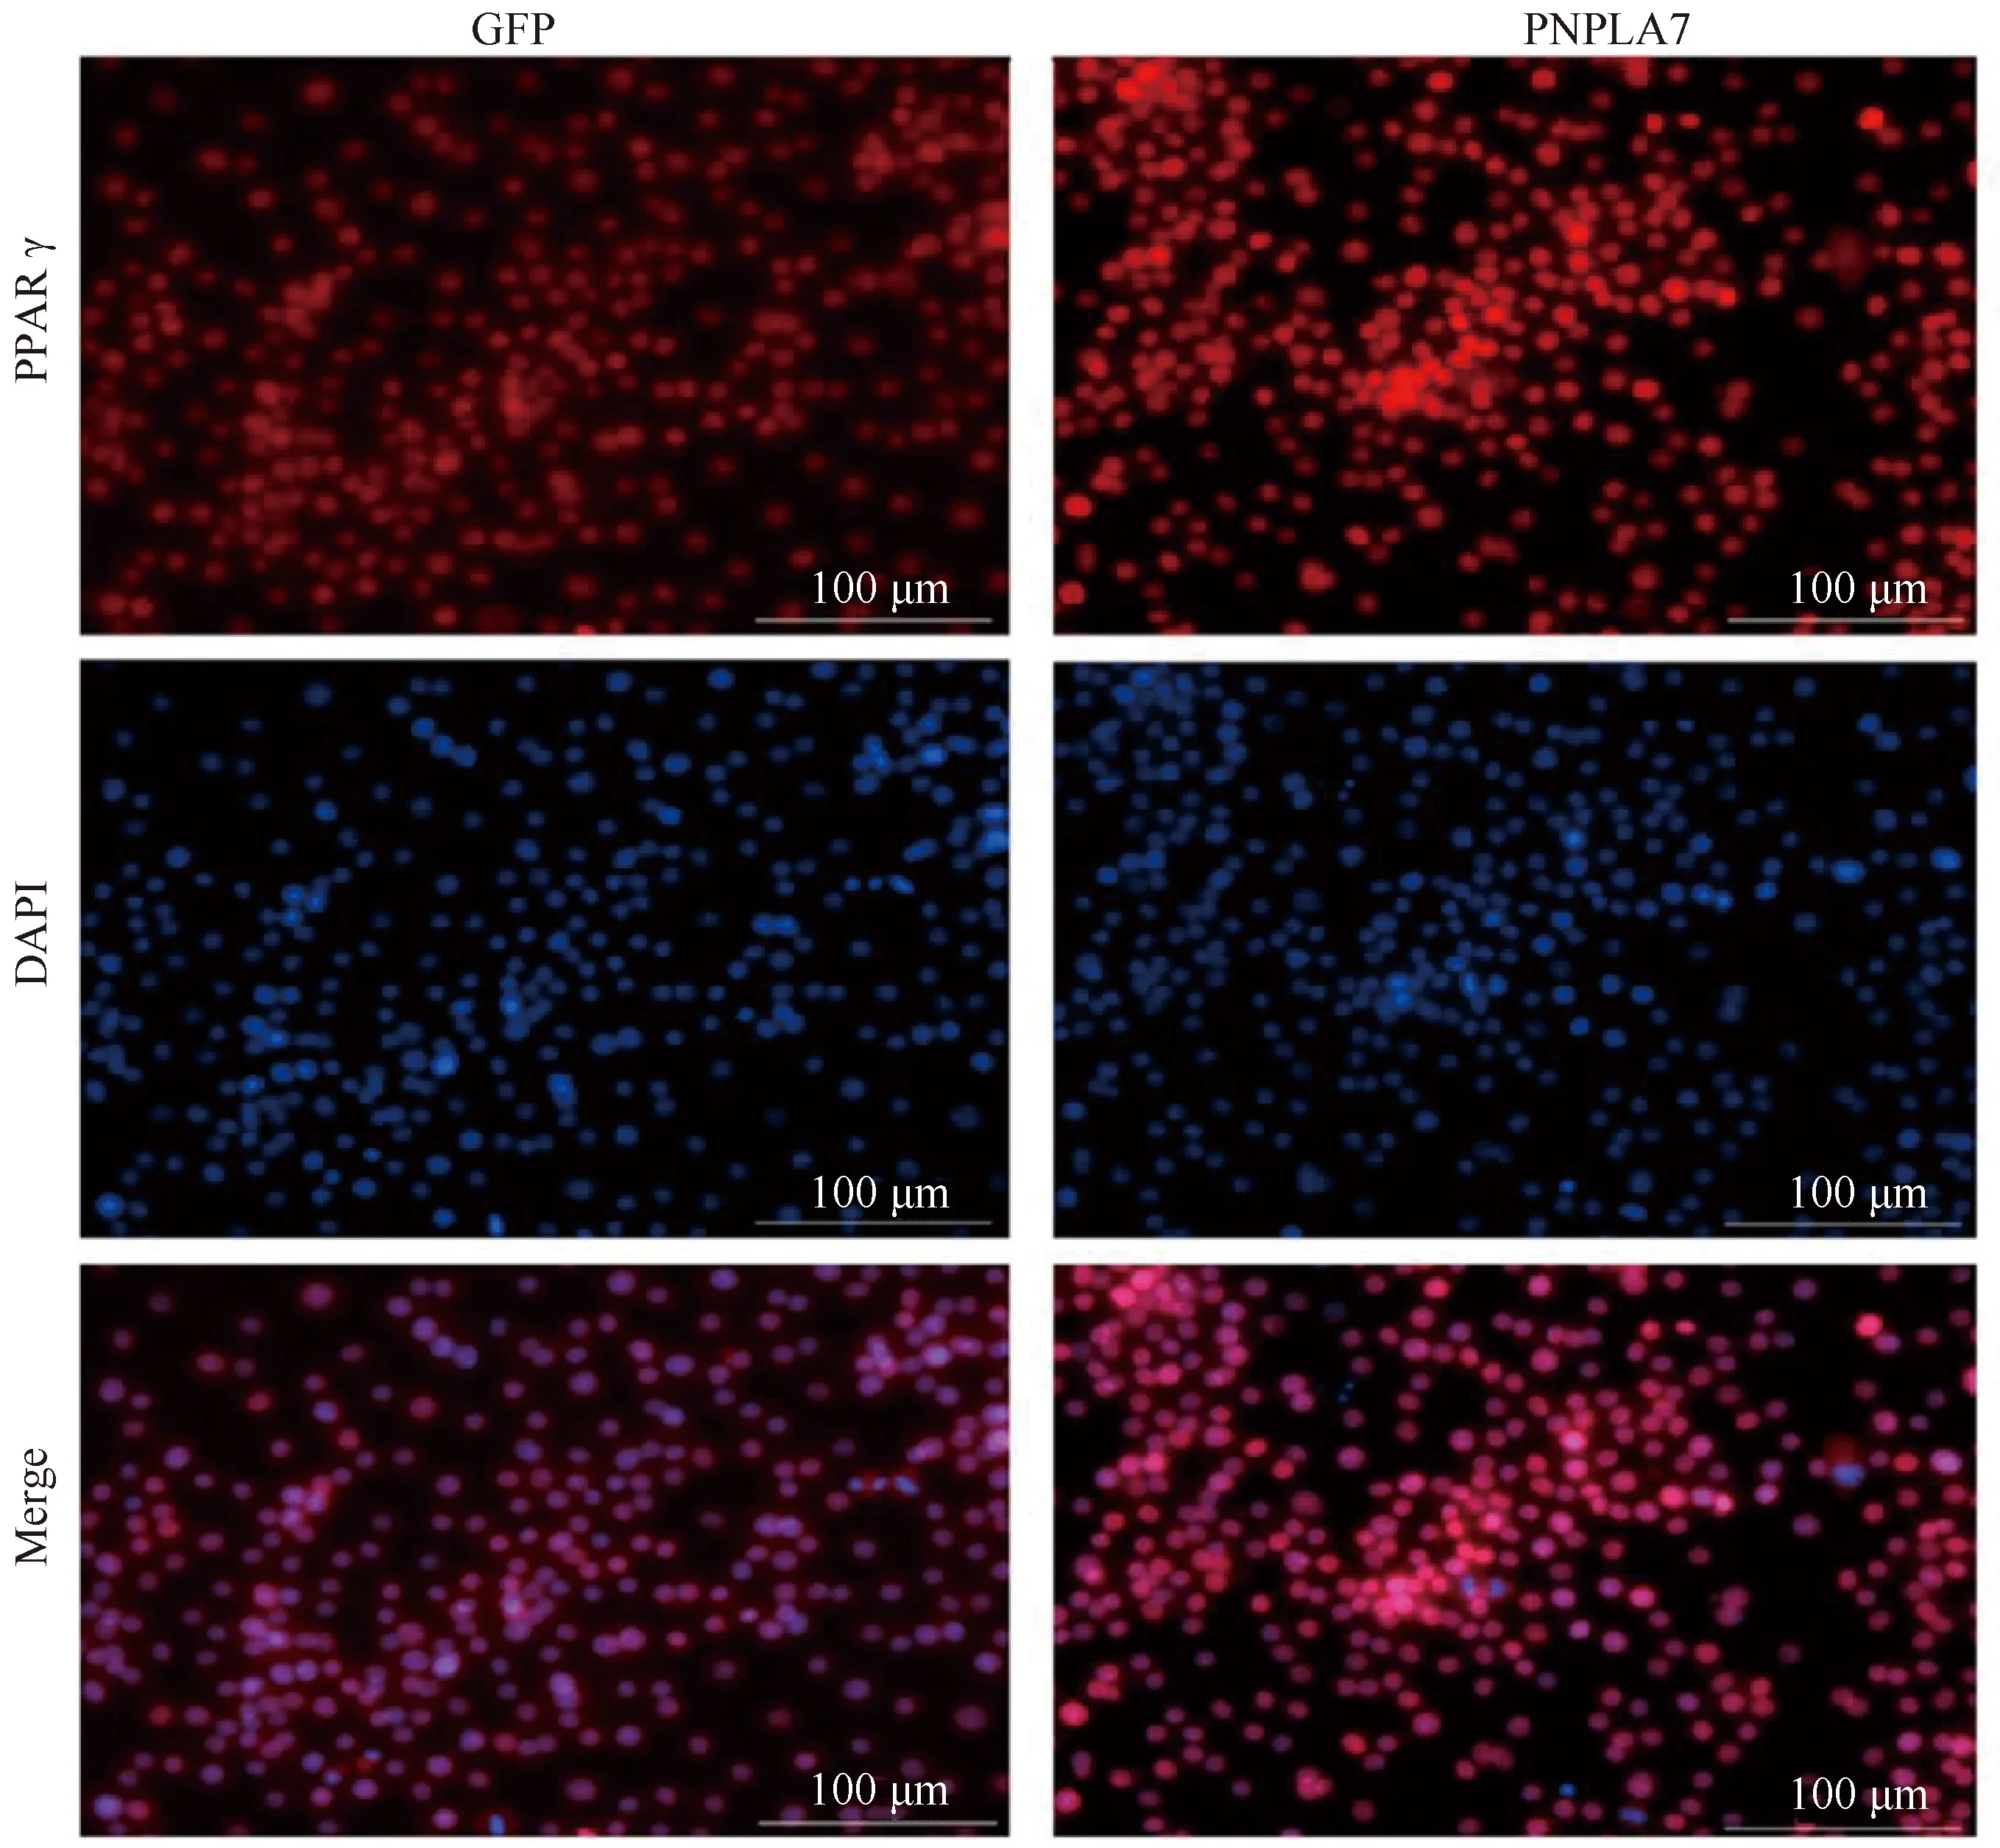
Fig.6 Immunofluorescence analysis of PPARγ in PNPLA7 overexpression macrophages Cells treated with IL-4 for 8 hours were fixed with formaldehyde and permeabilized with ice-cold 100% methanol and then blocked. The expression of PPARγ (red) was analyzed by immunofluorescence through incubation with the anti-PPARγ antibody and secondary antibody Alexa Fluor® 647 conjugate. Nuclei were stained with DAPI (blue). Fluorescent images were obtained with BioTek’s Lionheart LX Automated Microscope. All presented experiments were repeated independently at least three times. Scale bar = 100 μm
PNPLA7 was firstly identified to be an insulin-regulated lysophospholipase with homology to PNPLA6/NTE[19]. PNPLA7 was then shown to be a LPC hydrolase with a preference for unsaturated than saturated LPC species[13]. As an endoplasmic reticulum (ER)-anchored protein, PNPLA7 was promoted to be associated with lipid droplets (LDs) by cyclic AMP[13,30]. In addition to insulin, PNPLA7 was regulated by the nutritional status (fasting and feeding), suggesting its role in energy metabolism[19]. PNPLA7 facilitated hepatic very-low-density lipoprotein (VLDL) secretion by modulating apolipoprotein E (ApoE) stability under fasting condition[31]. In the current study, the expression ofPnpla7 was shown to be higher thanPnpla6 in mouse RAW macrophages and BMDMs, and to be related to M2 polarization status.
Although the cellular mechanism by which LPC triggers M2 macrophage polarization is not fully understood, activation of PPARγ is a key factor for this outcome. PPARγ was originally characterized as a master ligand-activated transcription factor of adipogenesis[32]. PPARγ expression was strongly induce by IL-4 in macrophages[23]. The active PPARγ pathway is a prominent feature of M2 macrophages, which is important for the full expression of M2 macrophages markers, especiallyArg1, a direct PPARγ target[24]. We found that knockdown ofPNPLA7 downregulated the expression of PPARγ, whereas overexpression of PNPLA7 increased its expression at the mRNA and protein levels. However, the phosphorylation of STAT6 was not affected by PNPLA7, although IL-4 activation of macrophages STAT6 acted as a licensing factor for PPARγ to promote DNA binding and transcriptional activity[33]. In addition to regulation of PPARγ expression, one product of LPC when hydrolyzed by PNPLA7, is fatty acid (FA). FA, especially unsaturated FA may be the ligand of PPARγ and may activate PPARγ to exert potent anti-inflammatory effects[32,34].IL-4-mediated macrophage plasticity resulted in a greatly extended retinoid X receptor (RXR) cistrome via activation of STAT6, leading to chromatin remodeling and RXR recruitment todenovoenhancers[35]. PPARγ appeared to be critical for the development of RXR-binding enhancersdenovo, the activity of which can be modulated by the ligands of the PPARγ:RXR heterodimer[35]. Moreover, PPARγ also drove progressive polarization of M2 macrophage in a ligand-independent manner via transcriptional memory, altering chromatin structure and facilitating IL-4 signaling[36]. Therefore, STAT6 and PPARγ are mutually regulated during M2 macrophage polarization, suggesting a complex relationship between them.
In summary, the lysophospholipase PNPLA7 is highly expressed in macrophages and is upregulated during M2 polarization. PNPLA7 facilitates M2 macrophage polarization in a PPARγ-dependent manner. Further work is needed to reveal how PNPLA7 regulates the expression of PPARγ and modulates macrophages polarization toward the M2 phenotype.
- 中国生物化学与分子生物学报的其它文章
- PM2.5通过激活NLRP3/Caspse-1通路诱导大鼠子宫炎症反应
- “金课”背景下生物化学课程教学的创新与实践
- EHD2 Affects the Proliferation of Esophageal Squamous Cell Carcinoma by Regulating the Cyclin D1-CDK4-pRb Signaling Axis
- Therapeutic Effect of Mesenchymal Stem Cells Overexpressing Interleukin-10 on Inflammatory Bowel Disease
- miR-31改善2型糖尿病小鼠的肝损伤
- 干扰NSUN2通过调控细胞周期蛋白表达抑制黑素瘤细胞增殖

