EHD2 Affects the Proliferation of Esophageal Squamous Cell Carcinoma by Regulating the Cyclin D1-CDK4-pRb Signaling Axis
ZHANG Zhi-Da, DENG Dan-Xia, WEN Bing, PENG Liu, DONG Ke, PAN De-Yuan, 3),ZHENG Hai-Xiang, LIAO Lian-Di, XU Li-Yan, , 3)*, LI En-Min*
(1)The Key Laboratory of Molecular Biology for High Cancer Incidence Coastal Chaoshan Area, Department of Biochemistry and Molecular Biology, Shantou University Medical College, Shantou 515041, Guangdong, China; 2)Guangdong Provincial Key Laboratory of Infectious Diseases and Molecular Immunopathology, Department of Pathology, Shantou University Medical College, Shantou 515041, Guangdong, China;3)Cancer Research Center, Shantou University Medical College, Shantou 515041, Guangdong, China)
Abstract Actin-binding proteins (ABPs) are important components of the F-actin cytoskeleton and affect the dynamics of F-actin by promoting the polymerization and depolymerization of actin. Numerous studies have shown that F-actin and actin-binding proteins are involved in all stages of carcinogenesis. Our analysis of esophageal carcinoma proteomic data showed that the actin-binding protein EHD2 (Eps15 homology domain-containing protein 2) is expressed at low levels in esophageal squamous cell carcinoma tissues and patients with lower EHD2 expression had poorer prognosis. Previous studies have revealed that EHD2 is involved in the regulation of glucose metabolism, autophagy and tumor cell migration. However, the role and mechanism of EHD2 in esophageal squamous cell carcinoma progression remain unclear. This study aimed to explore the effect of EHD2 on the proliferation of esophageal squamous cell carcinoma. Immunofluorescence and cell fractionation analysis showed that EHD2 was not only localized in the cell membrane and cytoplasm, but also in the nucleus. Colony formation, EdU labeling and flow cytometry were used to determine the effect of EHD2 on the proliferation of esophageal squamous cell carcinoma. The results showed that overexpression of EHD2 and EHD2-3×NLS (nuclear localization signal) inhibited proliferation, cell cycle G1/S transition, and Wnt signaling pathway activity in esophageal squamous cell carcinoma. Dual-luciferase reporter gene assay revealed that overexpression of EHD2 and EHD2-3×NLS inhibited Wnt pathway activity. While siRNA-mediated knockdown of EHD2 displayed the opposite results. Co-immunoprecipitation (Co-IP) and Duolink-PLA experiments demonstrated that EHD2 interacted with β-catenin and TCF3, the key molecules of the Wnt signaling pathway. Western blotting and quantitative real-time PCR (qRT-PCR) results confirmed that EHD2 inhibited the transcription of TCF3 downstream target genes associated with proliferation and cell cycle, as well as the protein expression of cyclin D1, CDK4 and pRb. These results suggest that EHD2 interacts with β-catenin and TCF3 after being transported to the nucleus, and regulates the proliferation and cell cycle progression of esophageal squamous cell carcinoma through the cyclin D1-CDK4-pRb signaling axis.
Key words actin-binding protein (ABP); Eps15 homology domain-containing protein 2 (EHD2); proliferation; T-cell factor 3(TCF3); esophageal squamous cell carcinoma (ESCC)
Actin-binding proteins (ABPs) are key elements of the F-actin cytoskeleton. They affect the dynamics of F-actin by promoting the polymerization and depolymerization of actin. Numerous studies have shown that F-actin and actin-binding proteins are involved in all stages of carcinogenesis. For example, ABPs such as DNA-binding protein SATB1 (SATB1), WASP, nesprin and villin, are involved in the initial steps of carcinogenesis by regulating the expression of oncogenes[1]. In addition, ABPs such as the Arp2/3 complex, filamin A, Fascin, α-actinin and cofilin are involved in the formation of pseudopodia to promote the migration and invasion of cancer cells. Meanwhile, an increasing number of scientists believe that F-actin, together with actin-binding proteins, mediates tumor angiogenesis[2]. In addition, ABPs also play an essential role in cell growth and proliferation by regulating the cell cycle progression and apoptosis of cancer cells. For example, SATB1 alters the localization of microfilaments by inhibiting apoptosis and promoting cell proliferation[3]. Anillin is an important cellular component of cytoplasmic division, and its localization changes during cell cycle[4]. During interphase, Anillin is located in the nucleus, while during mitosis, Anillin is located in the cell cortex[5]. Recently, important roles of Anillin in the proliferation of various cancer cells and tumor development have been described. Downregulating the expression of Anillin arrests cancer cells at the G2/M stage of the cell cycle, and decreases the capacity of proliferation in small cell lung cancer[6]. Considering the roles of ABPs in cancer initiation and development, they may be good therapeutic targets. Therefore, it is imperative to develop anticancer drugs and therapeutic approaches targeting ABPs. In recent years, scientists have focused their attention on identifying new cytoskeletal markers that demonstrate an accurate correlation between their expression levels and the degree of tumor malignancy. Such candidates of ABPs related molecular markers could help us better understand the onset and progression of cancer, as well as be used as effective targets for both cancer prognosis and treatment.
In this study, through esophageal squamous cell carcinoma proteomic data, we found that EHD2 (Eps15 homology domain-containing protein 2) was significantly down-regulated in esophageal squamous cell carcinoma tissues compared with matched adjacent normal tissues, and patients with low EHD2 expression had poor prognosis. EHD2 proteins are encoded by theEHD2 gene located on chromosome 19q13. EHD2 proteins contain three domains: a dynamin-like G-domain that hydrolyzes ATP, a helical domain formed by two helical regions that facilitates EHD2 oligomerization and lipid binding, and a C-terminal EH domain that binds to the asparagine-proline-phenylalanine (NPF) motif in chaperones[7, 8]. The EH domain is a domain that mediates protein interactions and is present in many endocytic regulatory proteins, including Eps15, intersectin, Reps, and γ-synergin. In EHD2, the C-terminal EH domain has a positively charged electrostatic surface, resulting in preferential binding to proteins containing an NPF motif followed by a series of acidic residue motifs[9]. EHD2 is mainly localized at the neck of caveolae and controls caveolae stability and cell surface tension[10, 11]. Previous studies have reported that EHD2 is involved in biological functions such as glucose metabolism, lipid transport, and autophagy[12, 13]. In recent years, studies have found that EHD2 is closely related to the metastasis of various types of cancer. Relevant studies have shown that the protein level of EHD2 in triple-negative breast cancer is lower than that in normal tissues, and downregulation of EHD2 promotes the migration of breast cancer cells[14]. Similar results are seen in ovarian carcinoma[15], esophageal carcinoma[16], hepatocellular carcinoma[17]and malignant melanoma[18]. However, its role in the malignant proliferation of cancer cells has been rarely studied to date. When cells received mechanical stress or signal stimulations, caveolae disintegrate to relieve the stress on the cell membrane. During this time, a fraction of EHD2 in the caveolae becomes localized in the cytoplasm and another fraction of EHD2 is transported into the nucleus[19]. To explore the function of nuclear EHD2, Pekaretalapplied a luciferase reporter gene assay system to demonstrate that the interaction between EHD2 and MOKA represses the activity of the Krueppel-like factor 7 (KLF7) transcription factor, speculating that EHD2 is a transcriptional repressor[20]. However, the molecular mechanism played by nuclear EHD2 in cancer progression needs to be further investigated. With this background in mind, the present study was conducted to explore the functions and mechanisms of EHD2 in regulating the malignant progression of esophageal squamous cell carcinoma.
1 Materials and Methods
1.1 Data sources and bioinformatics analysis
Proteomic and phosphoproteomic data from esophageal squamous cell carcinoma were generated previously[21]. This data has been recorded in the iProX database (IPX0002501000). There were 1 259 actin-binding protein sets, and the subcellular localization data of 30 candidate proteins was obtained from the Uniprot database (https://www.uniprot.org/). Metascape (https://metascape.org/) was used to perform GO enrichment analysis and KEGG pathway analysis of actin-binding proteins. Survival analysis and multivariate analysis were calculated using the SPSS Version 26 software program. Data visualization was completed by the bioinformatics online platform (https://www.bioinformatics.com.cn) and GraphPad Prism 8.0.1.
1.2 Cell culture, small-interfering RNA transfection and plasmid transfection
The human ESEC cell lines TE1, KYSE30, KYSE150, KYSE450 and KYSE510 were obtained from the American Type Culture Collection[22]. HEK293 T, a human embryonic kidney cell line, was maintained in our laboratory. KYSE30, KYSE150 and KYSE510 cell lines were cultured in RPMI 1640 medium (Thermo Scientific HyClone, USA) supplemented with 10% fetal bovine serum (Life Technologies, USA) and penicillin/streptomycin (C0222, Beyotime, China). TE1, KYSE450 and HEK293 T cells were cultured in Dulbecco’s modified Eagle’s medium (Thermo Fisher Scientific Gibco, USA), 10% FBS, and penicillin/streptomycin (C0222, Beyotime, China). The cells were cultured in a humidified atmosphere containing 5% CO2at 37 ℃.
EHD2-specific siRNA was purchased from GenePharma (GenePharma Co., Ltd., Shanghai, China). The sense strand sequences were GCAGCUGAUCCUCAAACUGTT and CCAAAUACGACGAGAUCUUTT. siRNA was diluted in DEPC-treated water to a final siRNA concentration of 20 μmol/L. Tumor cells were seeded in a 6-well plate on the day before transfection. Transfection was performed using Hieff TransTMinvitrosiRNA/miRNA Transfection Reagent (40806ES, Yeasen Biotech Co., Ltd., Shanghai, China) according to the manufacturer’s recommendations.
We used EZ Trans Plus cell transfection reagent (AC04L011, LIFE iLAB BIO, China) to transfect plasmids (GFP-Vector, GFP-EHD2, GFP-EHD2-3×NLS,TCF/LEFreporter gene plasmid and pRL-TK) into esophageal squamous cell carcinoma cell lines according to the manufacturer’s instructions.
1.3 Plasmids
The plasmids pBOBI-N-3×Flag-TCF3, theTCF/LEFreporter gene plasmid (E461A, Promega, USA) and PRL-TK (E224A, Promega, USA) were used in this study from our laboratory preserved. Other plasmids were constructed in this study using primers detailed in Table 1.

Table 1 List of plasmids used
1.4 Cell cycle analysis
Cell cycle analysis was detected using a cell cycle and apoptosis analysis kit (C1052, Beyotime, Shanghai, China). Cells were transfected for 48 h, then rinsed with 1×PBS, trypsinized and collected by centrifugation at 1 000 g for 5 min. Cells were then washed once with cold 1×PBS, resuspended in 1 mL of pre-cooled 70% ethanol, and stored at 4 ℃ for 12 h. After washing with cold 1×PBS, cells were incubated in 500 μL of PI staining solution for 30 min at 37 ℃ in the dark. Then, samples were analyzed with a BD C6 Plus flow cytometer (BD Biosciences, USA), and FlowJo v10.6.2 software was used to calculate the percentage of cells in each stage of the cell cycle.
1.5 Cell cycle synchronization
KYSE30 and KYSE510 cell lines were synchronized by double-thymidine block. In brief, cells were treated with 2 mg/mL thymidine (T1895, Sigma, USA) for 12 h, then washed thrice with 1×PBS followed by culture in thymidine-free medium for 6 h to release the cells. Then, 2 mg/mL thymidine was added again to the medium for an additional 22 h to arrest the cells at the G1/S boundary. Cells were washed thrice with 1×PBS and then released into fresh complete medium, and samples were collected at 0 h, 3 h, 6 h, 9 h, 12 h, 15 h and 24 h for analysis. Two samples were collected at each time point and divided into two fractions. In one fraction, Western blotting was used to detect the expression of EHD2, cyclin B1 and cyclin E2. The other cells were fixed with pre-cooled 70% ethanol and stained with PI, and then flow cytometry was used to detect cell cycle synchronization.
1.6 Colony formation assay
At 36 h after transfection, cells were washed with 1×PBS, and made quiescent through serum starvation for 12 h, then the cells were digested and resuspended in cell culture medium. Two hundred cells in 1 mL of complete medium were seeded into one well of a 12 well plate, and cultured at 37 ℃ in an incubator with 5% CO2for 10 -14 d. Colonies were fixed with methanol and glacial acetic acid (3∶1), stained with 0.1% crystal violet, and counted using Image J software version 1.52.
1.7 EdU assay
An EdU assay was performed with a BeyoClickTMEdU Cell Proliferation Kit with Alexa Fluor 594 (C0078 L, Beyotime, Shanghai, China). At 36 h after transfection, cells were digested and suspended in cell culture medium. Cells were counted and inoculated into 96-well plates at 1×10⁵cells in each well for 24 h. Cells were co-cultured with EdU working solution (1∶1 000) at 37 ℃ in a humidified 5% CO2atmosphere for 2 h, followed by fixation with 4% paraformaldehyde for 15 min and treatment with 0.3% Triton X-100 for 10 min at room temperature. Then, according to the manufacturer’s protocol, cells were co-incubated with click reaction solution for 30 min at room temperature in a dark environment, after which cells were treated with DAPI solution (sc2084, Santa Cruz, USA) for 10 min. Fluorescence detection and data analysis were performed using a Lionheart FXTMIntelligent living cell imaging analysis system (BioTek, USA).
1.8 Immunofluorescence
ESCC cells were seeded onto coverslips for 12 h, then fixed with 4% paraformaldehyde for 10 min at 25 ℃ and washed thrice with PBS. Then, 0.1% Triton X-100 was added for 10 min to permeabilize the cells. Cells were washed and blocked in 5% normal donkey serum for 1 h. Then, cells were incubated with anti-EHD2 antibody (L-05) (1∶100, sc-100724, Santa Cruz) overnight, and stained with Alexa Fluor 488-conjugated donkey anti-mouse IgG (H+L) (1∶500, 715-545-150, Jackson). F-actin was labeled with Alexa 555-phalloidin (1∶200, PHDH1-A, Cytoskeleton) for 1 h at 25 ℃. The samples were washed thrice with 1×PBS and counterstained with DAPI at 25 ℃ for 10 min to visualize the nuclei. Afterward, the coverslips were mounted onto slides and imaged using a Zeiss laser scanning confocal microscope (LSM 800, Carl Zeiss, Germany). The original images obtained from the LSM 800 were preprocessed using Zeiss ZEN2 software.
1.9 In situ proximity ligation assay
For the in-situ proximity ligation assay (PLA, Duolink, Sigma, USA), cells were labeled according to the manufacturer’s instructions. Briefly, KYSE150 cells were seeded into twelve-well plates with glass bottoms. After washing twice with PBS, the cells were fixed in 4% paraformaldehyde for 10 min at 25 ℃, and then washed thrice with PBS. 0.1% Triton X-100 permeabilization reagent was added, and after 10 min, the cells were washed and blocked with 5% normal donkey serum for 1 h. The cells were incubated with primary mouse EHD2 antibody (L-05) (1∶100, sc-100724, Santa Cruz) and rabbit anti-TCF3 (1∶200, 21242-1-AP, Proteintech), or rabbit anti-β-Catenin (1∶200, 8480 S, CST) antibodies overnight at 4 ℃. Next, the cells were washed thrice with PBS. Secondary probes (anti-mouse-PLUS and anti-rabbit-MINUS, conjugated to oligonucleotides) were diluted to final concentrations of 1∶5 in an antibody diluent. The secondary probe mix was added to each sample, incubated for 1 h at 37 ℃, and washed with wash buffer A, after which 40 μL of ligation solution was added. The dishes were incubated for 30 min at 37 ℃. After washing with wash buffer A (10 mmol/L Tris-HCl, pH 7.4, 150 mmol/L NaCl and 0.05% TWeen), 40 μL amplification solution was added and incubated for 100 min at 37 ℃. Next, the cells were rinsed thrice with wash buffer B (200 mmol/L Tris-HCl, pH 7.5, 100 mmol/L NaCl) and counterstained with DAPI at 25 ℃ for 10 min to visualize the nuclei. Images were captured using a Zeiss LSM 800 confocal microscope.
1.10 Co-immunoprecipitation
Co-immunoprecipitation (Co-IP) was performed on HEK293 T cells. Cells were transfected with HA-tagged EHD2. Then, 48 h after transfection, the cells were harvested with EBC buffer (50 mmol/L Tris-HCl, pH 7.5, 120 mmol/L NaCl, 0.5% NP-40) containing a protease inhibitor cocktail (HY-K0010, MCE, USA), and the whole-cell lysates were immunoprecipitated at 4 ℃ overnight using Pierce Anti-HA Magnetic Beads (88837, Thermo Fisher, USA). Beads were washed thrice with EBC buffer, and proteins were released by boiling them in SDS sample loading buffer and analyzed by Western blotting. For endogenous IP, cell extracts were incubated with Protein A/G Magnetic Beads (HY-K0202, MCE) and 2 μg EHD2 antibody (sc-100724, Santa Cruz) or 2 μg normal mouse IgG (sc-2025, Santa Cruz) at 4 ℃ for 4 h before use.
1.11 Cell fractionation
A total of 1×10⁷KYSE150 cells or KYSE510 cells were washed with pre-cooled 1×PBS, 1 mL pre-cooled Buffer A (10 mmol/L Tris-HCl at pH 7.5, 2 mmol/L MgCl2, 3 mmol/L CaCl2, 320 mmol/L sucrose, 1 mmol/L DTT, 0.3% NP40) containing protease inhibitors was added, and cells were collected in a 1.5 mL centrifuge tube. Cell clusters were lysed on ice for 10 min. Then, cell extracts were centrifuged at 2 800 g, 4 ℃ for 5 min, and the supernatant, representing the cytoplasmic compartment, was transferred to a clean centrifuge tube. The pellet, representing the nuclear crude extract, was washed twice with buffer A, then buffer B (20 mmol/L HEPES at pH 7.7, 1.5 mmol/L MgCl2, 420 mmol/L NaCl, 0.2 mmol/L EDTA, 25% glycerol, 1 mmol/L DTT) containing protease inhibitors was added to the pellet fraction, and incubated on ice for 30 min. After centrifugation at 8 000 g at 4 ℃ for 15 min, the supernatant was collected in another centrifuge tube and represented the soluble nuclear component. The precipitate was the insoluble chromatin component.
1.12 Plasma membrane separation
To isolate the plasma membrane, the MinuteTMPlasma Membrane Protein Isolation and Cell Fractionation Kit (SM-005, Invent Biotechnologies, USA) was used according to the manufacturer’s instructions. After digestion, the cells were collected by low-speed centrifugation (600 g, 5 min) and washed once with pre-cooled 1×PBS. Then 500 μL Buffer A was added, and the cells were resuspended and incubated on ice for 10 min. The tube was vigorously vortexed for 30 s, then the cell suspension was immediately transferred to the filter cartridge and centrifuged for 30 s at 16 000 g and 4 ℃. For the separation of nuclei from the membrane and cytosolic fractions, the ruptured cells were centrifuged at 700 g and 4 ℃ for 1 min. The supernatant was transferred to a clean reaction tube and centrifuged for an additional 30 min at 16 000 g, 4 ℃. The supernatant represented the cytosolic fraction and the pellet represented the total membrane protein fraction, including organelle and plasma membranes. The total membrane pellet was resuspended in 200 μL buffer B by vortexing. Then, samples were centrifuged at 7 800 g and 4 ℃ for 20 min. The supernatant was transferred to a new 2.0 mL reaction tube and combined with 1.6 mL cold PBS. Centrifugation was conducted at 16 000 g for 30 min and the pellet containing the plasma membrane proteins.
1.13 Luciferase reporter assay
The pGL4.49[luc2P/TCF-LEF RE/Hygro] and pRL-TK co-transfections were performed, inEHD2-knockdown or-overexpressing ESCC cell lines, using EZ Trans Plus cell transfection reagent (AC04L011, LIFE iLAB BIO, China). At 48 h after transfection, the luciferase reporter assay was performed using a Dual-Luciferase Reporter assay system kit (E1960, Promega, USA), according to the manufacturer’s protocol.
1.14 RNA extraction and quantitative real-time PCR (qRT-PCR)
Total cellular RNA was extracted using Trizol (15596018, TRIzol, Life Technologies) according to the manufacturer’s instructions. Before reverse transcription, genomic DNA was removed from the total RNA using a gDNA wiper. Reverse transcription was performed using a HiScript III-RT SuperMix Kit (R323-01, Vazyme, China). To detect transcription levels, real-time PCR reactions were performed using ChamQ Universal SYBR qPCR Master Mix (Q711-02, Vazyme, China) and an ABI QuantStudio 5 real-time PCR system. Expression levels were calculated and normalized to anACTBcontrol. Primers used for real-time PCR are listed in Table 2. The expression relative levels were determined using the 2-ΔΔCTmethod.
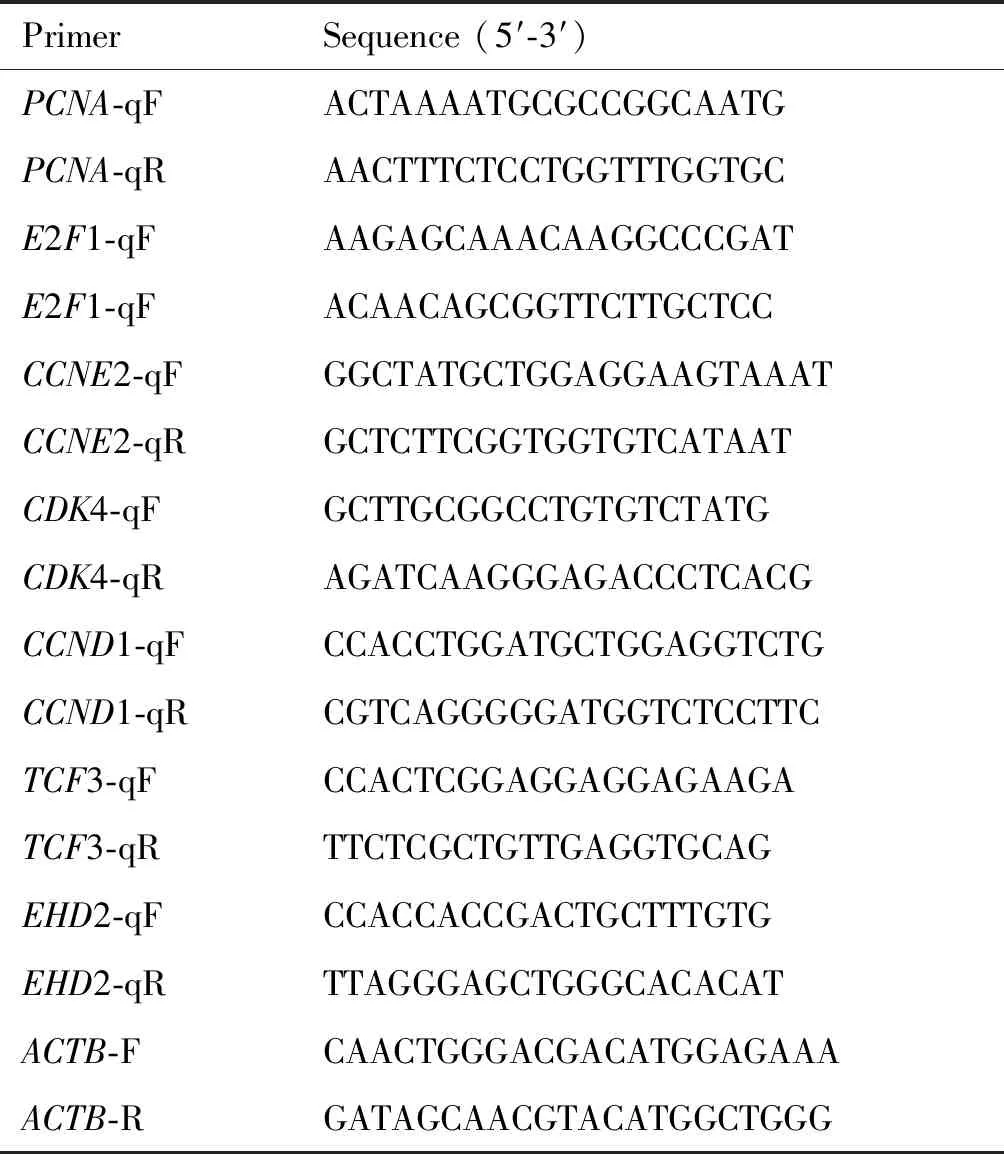
Table 2 Primers used for real-time PCR
1.15 Western blotting
Protein expression levels were analyzed by Western blotting, as described previously[23]. 1×Laemmli sample buffer (1610747, Bio-Rad, USA) was used to lyse the cells and extract the total protein. The total protein was resolved using SDS-PAGE and then transferred onto a polyvinylidene fluoride membrane. The membrane was blocked for 1 h at 25 ℃ with 5% nonfat milk diluted with Tris-buffered saline Tween-20. HA Tag monoclonal antibody (1∶1 000, 66006-2-Ig, Proteintech), EHD2 polyclonal antibody (1∶1 000, 11440-1-AP, Proteintech), GFP (B-2) mouse monoclonal (1∶1 000, sc-9996, Santa Cruz), E2A polyclonal antibody (1∶1 000, 21242-1-AP, Proteintech), cyclin B1 polyclonal antibody (1∶1 000, 55004-1-AP, Proteintech), cyclin E2 antibody (1∶1 000, 4132S, CST), β-Catenin (D10A8) XP® rabbit mAb (1∶1 000, 8480S, CST), cyclin D1 antibody (1∶1 000, 2922, CST), CDK4 (D9G3E) rabbit mAb (1∶1 000, 12790, CST), Rb (4H1) mouse mAb (1∶2 000, 9309T, CST), phospho-Rb (Ser795) antibody (1∶1 000, 9301T, CST) and HRP-conjugated GAPDH monoclonal antibody (1∶10 000, HRP-60004, Proteintech) were incubated overnight at 4 ℃. The secondary antibody (anti-mouse: 1∶5 000, sc-516102, Santa Cruz or anti-rabbit IgG: 1∶2 000, 7074S, Cell Signaling Technology) was incubated for 1 h at 25 ℃. Immunoblotting was performed using the a ChemiDoc MP system (Bio-Rad, USA).
1.16 Statistical Analysis
Statistical analyses were performed using SPSS version 26 and GraphPad Prism 8.0.1. Differences between groups were evaluated using the Student’st-test. Survival curves were analyzed using the Kaplan-Meier method with a log-rank test. Statistical significance was set atP< 0.05.
2 Results
2.1 GO and KEGG pathway enrichment analysis of actin-binding protein in esophageal squamous cell carcinoma
Numerous studies have shown that actin-binding proteins are involved in all stages of cancer progression[2]. In this study, we identified abnormal actin-binding proteins, based on esophageal squamous cell carcinoma proteomic data, and explored their role in the malignant progression of esophageal squamous cell carcinoma. A flow chart of the bioinformatics analysis is shown in Fig.1A. To identify actin-binding proteins in esophageal squamous cell carcinoma, we downloaded human actin-binding proteins from the Uniprot database. The intersection of 1 259 actin-binding proteins and 9 300 proteins of esophageal squamous cell carcinoma proteomics contained 906 overlapping proteins (Fig.1B). To verify the signaling pathways, cell locations and biological functions of the 906 actin-binding proteins, Metascape was used to perform GO and KEGG pathway enrichment analyses. KEGG enrichment analysis showed that the 906 actin-binding proteins mainly were involved in the regulation of actin cytoskeleton, FcγR-mediated phagocytosis, tight junctions, endocytosis and adherens junctions (Fig.1C). GO enrichment analysis showed that the 906 actin-binding proteins were mainly located in the cortex and cytoplasm, and were mainly involved in the polymerization and depolymerization of actin and cell adhesion (Fig.1D).
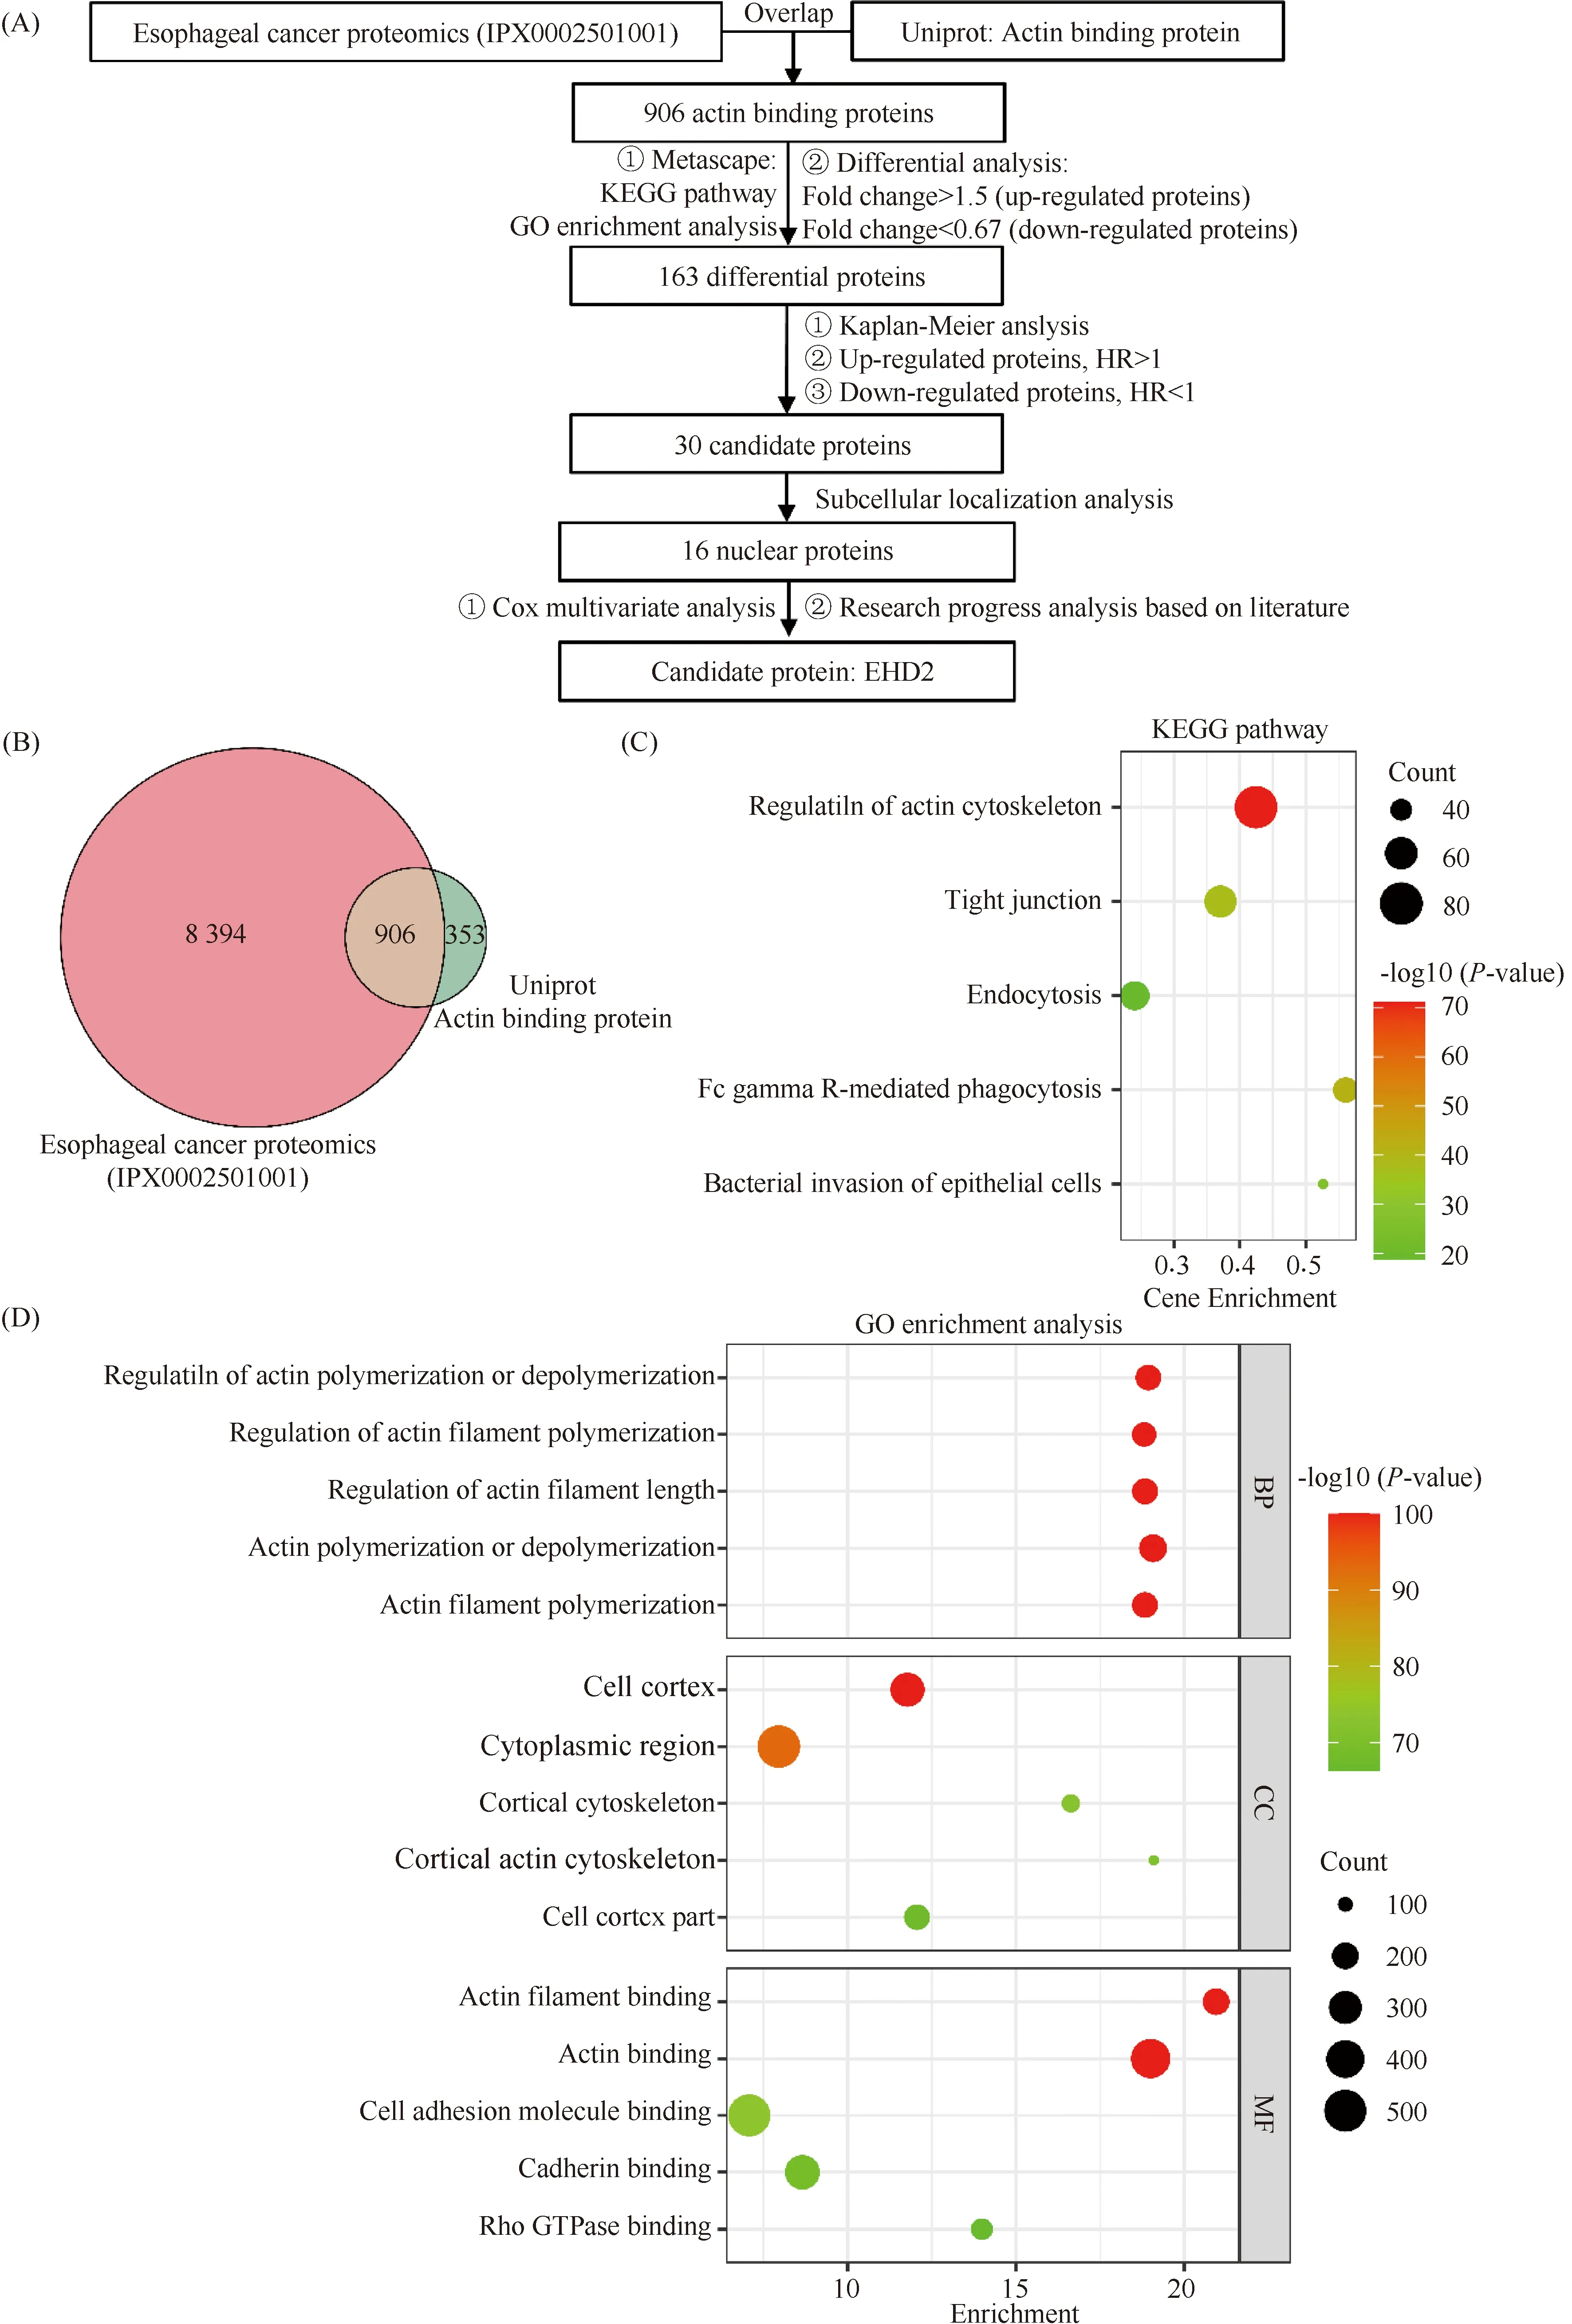
Fig.1 KEGG pathway and GO enrichment analysis of actin-binding proteins in esophageal squamous cell carcinoma (A) Flow chart of the bioinformatics screen of abnormal actin-binding proteins in esophageal squamous cell carcinoma. (B) Venn diagrams showing the degree of overlap between the esophageal squamous cell carcinoma proteomics and actin-binding protein data sets. (C) KEGG pathway enrichment analysis of the 906 actin-binding proteins in esophageal squamous cell carcinoma. The enrichment analysis was performed by Metascape (https://metascape.org/), and the bubble diagram shows the top 5 enriched pathways. (D) GO enrichment analysis of the 906 actin-binding proteins in esophageal squamous cell carcinoma. The enrichment analysis was performed by Metascape, and the bubble diagram shows the top 5 enriched pathways
2.2 Identification of candidate actin-binding proteins in esophageal squamous cell carcinoma
We performed differential expression analysis of the 906 actin-binding proteins combined with esophageal squamous cell carcinoma proteomic data. As shown in Fig.2A, 72 up-regulated proteins (FC > 1.5) and 91 down-regulated proteins (FC < 0.67) were identified. The relationship between 163 differentially-expressed proteins and the prognosis of esophageal squamous cell carcinoma was further analyzed. Patient survival analysis presented in Table 3 indicated a close correlation between the expression level of 30 proteins and the overall survival time and disease-free survival time of esophageal squamous cell carcinoma patients (Fig.2B). An increasing number of studies have demonstrated that nuclear actin plays important roles in the regulation of nuclear homeostasis, chromatin remodeling, and regulation of gene expression[24]. At the same time, the assembly and regulation of nuclear F-actin also requires the participation of nuclear actin-binding proteins. Nuclear actin-binding proteins not only participate in regulation of F-actin assembly but also regulate gene expression[25, 26]. Therefore, we queried the subcellular localization of the 30 candidate actin-binding proteins by the UniProt protein database (Fig.2C), and 16 actin-binding proteins with nuclear localization were screened. Multivariate Cox risk regression analysis was performed on the 16 nuclear actin-binding proteins, and the results showed that EHD2, IPO9, HCK and JUP proteins could be independent prognostic factors (Table 4). However, based on the relevant literature, the function of the actin-binding protein EHD2 in the nucleus has not been reported. Therefore, EHD2 was selected for further study (Fig.2D). EHD2 expression at the protein level was lower in esophageal squamous cell carcinoma tissues than in matched adjacent normal tissues (Fig.2E). Moreover, we found that low EHD2 expression was associated with poor survival in patients with esophageal squamous cell carcinoma (Fig.2F, G). Using Western blotting, we further verified that EHD2 expression levels in esophageal squamous cell carcinoma tissues were lower than those in the paired non-tumoral esophagus tissues (Fig.2H).
2.3 Expression, localization and nuclear localization of EHD2 in esophageal squamous cell carcinoma cell lines
To further investigate the role of EHD2 in the malignant progression of esophageal squamous cell carcinoma, we examined the expression and subcellular localization of EHD2 in esophageal squamous cell carcinoma cell lines. The expression of EHD2 in TE1, SHEEC and KYSE450 was lower than that in KYSE30, KYSE150 and KYSE510, based on Western blotting (Fig.3A). Immunofluorescence results indicated that EHD2 was predominantly localized to the cell membrane and colocalized with F-actin, and also localized to the cytoplasm and nucleus. (Fig.3B). This is consistent with previous findings on the involvement of EHD2 in caveola assembly[27]. To further verify the subcellular localization of EHD2, cell fractionation and plasma membrane separation were performed to separate nuclear, cytoplasmic, and membrane fractions. Western blotting showed that EHD2 was expressed in the cell membrane, cytoplasm and soluble nuclear components (Fig.3C, D). To study the function and molecular mechanism of nuclear EHD2 in the malignant progression of esophageal squamous cell carcinoma, we constructed a cell model for EHD2 nuclear localization. First, GFP-EHD2 and GFP-EHD2-3×NLS plasmids were engineered (Fig.3E). After transient transfection of either the GFP-EHD2 or GFP-EHD2-3×NLS plasmid into the TE1 cell line, the expression and localization of GFP-EHD2 and GFP-EHD2-3×NLS fusion proteins were detected by Western blotting and immunofluorescence. The results showed that GFP-EHD2 fusion protein was expressed in the cell membrane, cytoplasm and nucleus. However, GFP-EHD2-3×NLS fusion protein was localized in the nucleus subcellular model (Fig.3F, G). In summary, we successfully constructed an EHD2 overexpression and nuclear subcellular localization model.
2.4 EHD2 overexpression inhibits the proliferation of esophageal squamous cell carcinoma
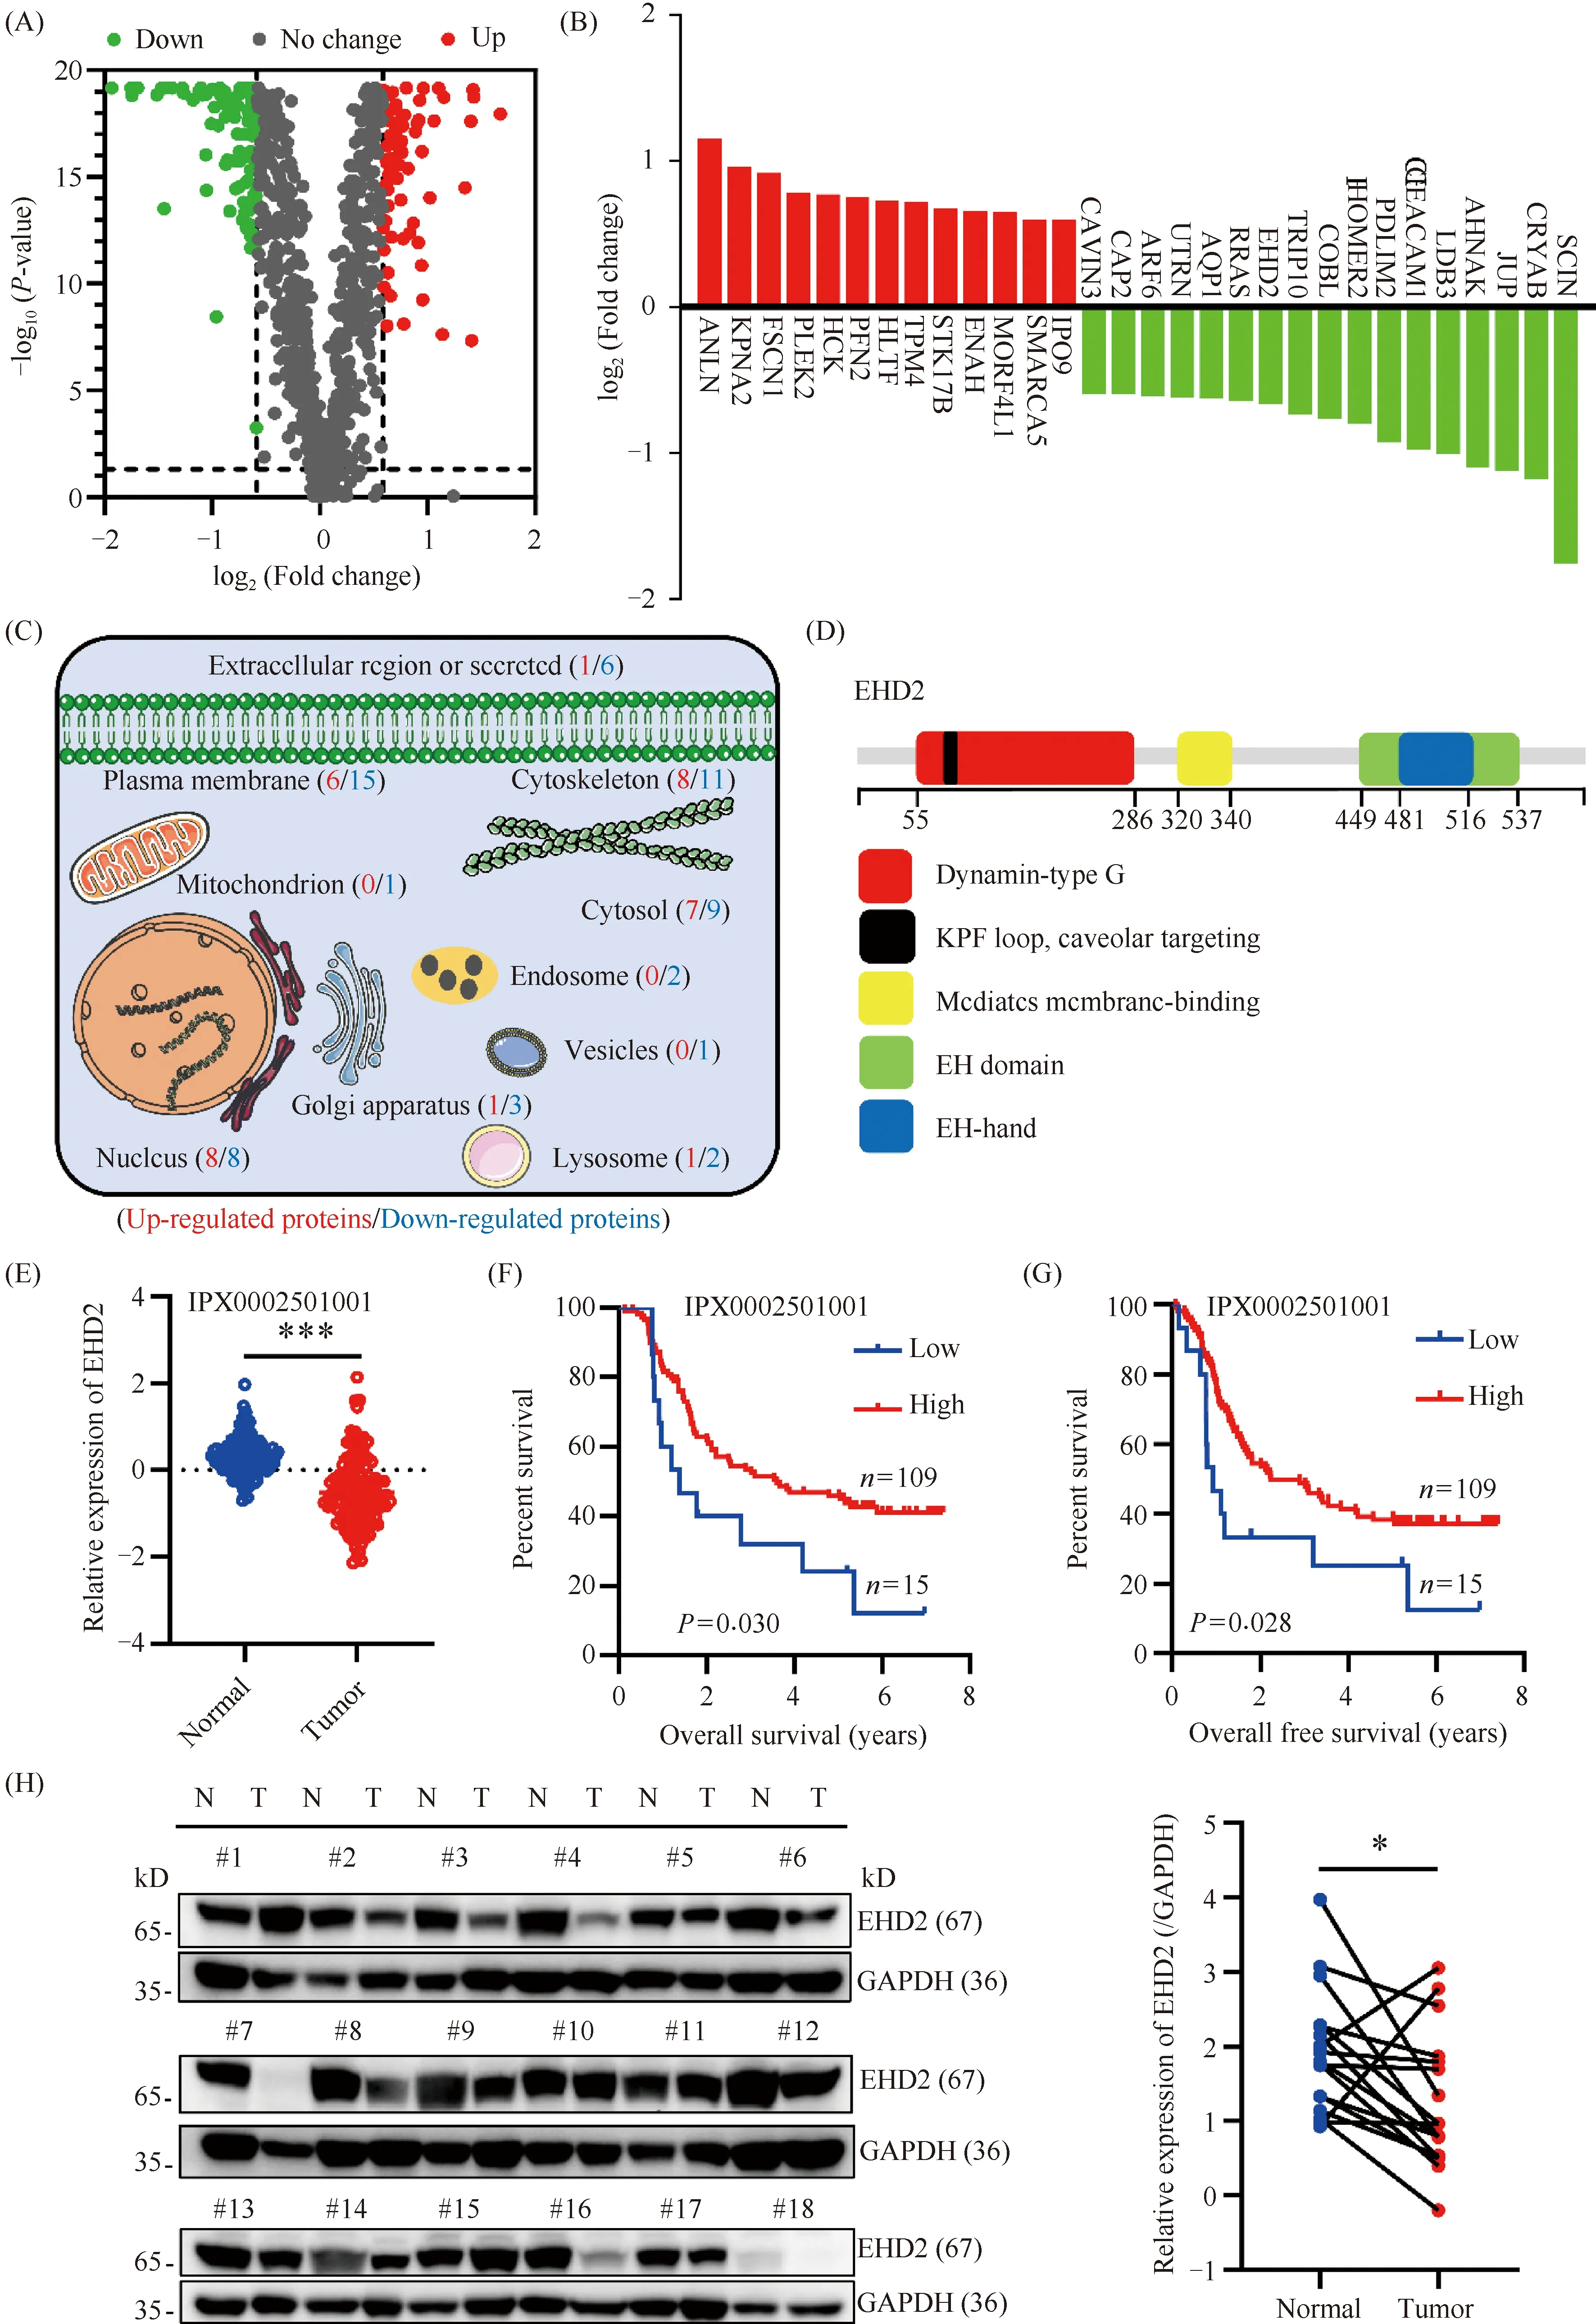
Fig.2 Identification of candidate actin-binding proteins in esophageal squamous cell carcinoma (A) Volcano plot of differentially-expressed, actin-binding proteins (FC>1.5 or FC<0.67, red indicates up-regulated proteins and green indicates down-regulated proteins). (B) Expression profiles of 30 candidate actin-binding proteins (red column represents up-regulated proteins and green column represents down-regulated proteins). (C) Subcellular distribution of up-regulated proteins and down-regulated proteins. (D) Schematic representation of the EHD2 protein structure. (E) Compared with adjacent normal tissues, EHD2 had lower expression in 124 pairs of human esophageal squamous cell carcinoma tissue.*** P < 0.001. (F, G) Kaplan-Meier overall survival (OS) and Kaplan-Meier disease-free survival (DFS) analysis for patients with low and high EHD2 protein levels. P-values were calculated using the log-rank test. (H) Western blotting confirmed a lower level of EHD2 protein in 18 pairs of human esophageal squamous cell carcinoma tissue than adjacent normal tissue (left panel). EHD2 protein expression was quantified using the grayscale of blots and normalized to GAPDH (right panel),*P < 0.05
According to the expression of EHD2 in different esophageal squamous cell carcinoma cell lines, KYSE30 and KYSE510 cells were selected to construct stableEHD2 knockdown esophageal squamous cell carcinoma cell lines. Cells were transfected with EHD2-targeting siRNA or non-targeting control siRNA. Western blotting was used to detectEHD2 knockdown efficiency (Fig.4A, C). The effect of EHD2 on the proliferation of esophageal squamous cell carcinomainvitrowas determined by colony formation assay. Knockdown ofEHD2-targeting siRNA significantly enhanced theinvitroproliferation of esophageal squamous cell carcinoma cells (Fig.4B, D). Next, TE1 and KYSE450 cells were selected to constructEHD2- andEHD2-3×NLS-overexpressing esophageal squamous cell carcinoma cell lines (Fig.4E, G). Colony formation assay showed that the proliferation of ESCC cells overexpressingEHD2 andEHD2-3×NLS was reducedinvitro(Fig.4F, H). Further, we used EdU experiments to determine the effect of EHD2 on esophageal squamous cell carcinoma cell proliferation. The results showed the proportion of EdU-positive cells increased compared with the negative control group following knockdown ofEHD2 in KYSE30 and KYSE150 cells, indicatingEHD2 knockdown enhanced cell proliferation (Fig.4I, J). Conversely, overexpression ofEHD2 andEHD2-3×NLS in TE1 cells decreased the proportion of EdU-positive cells compared with the control group, indicating that cell proliferation was reduced (Fig.4K).
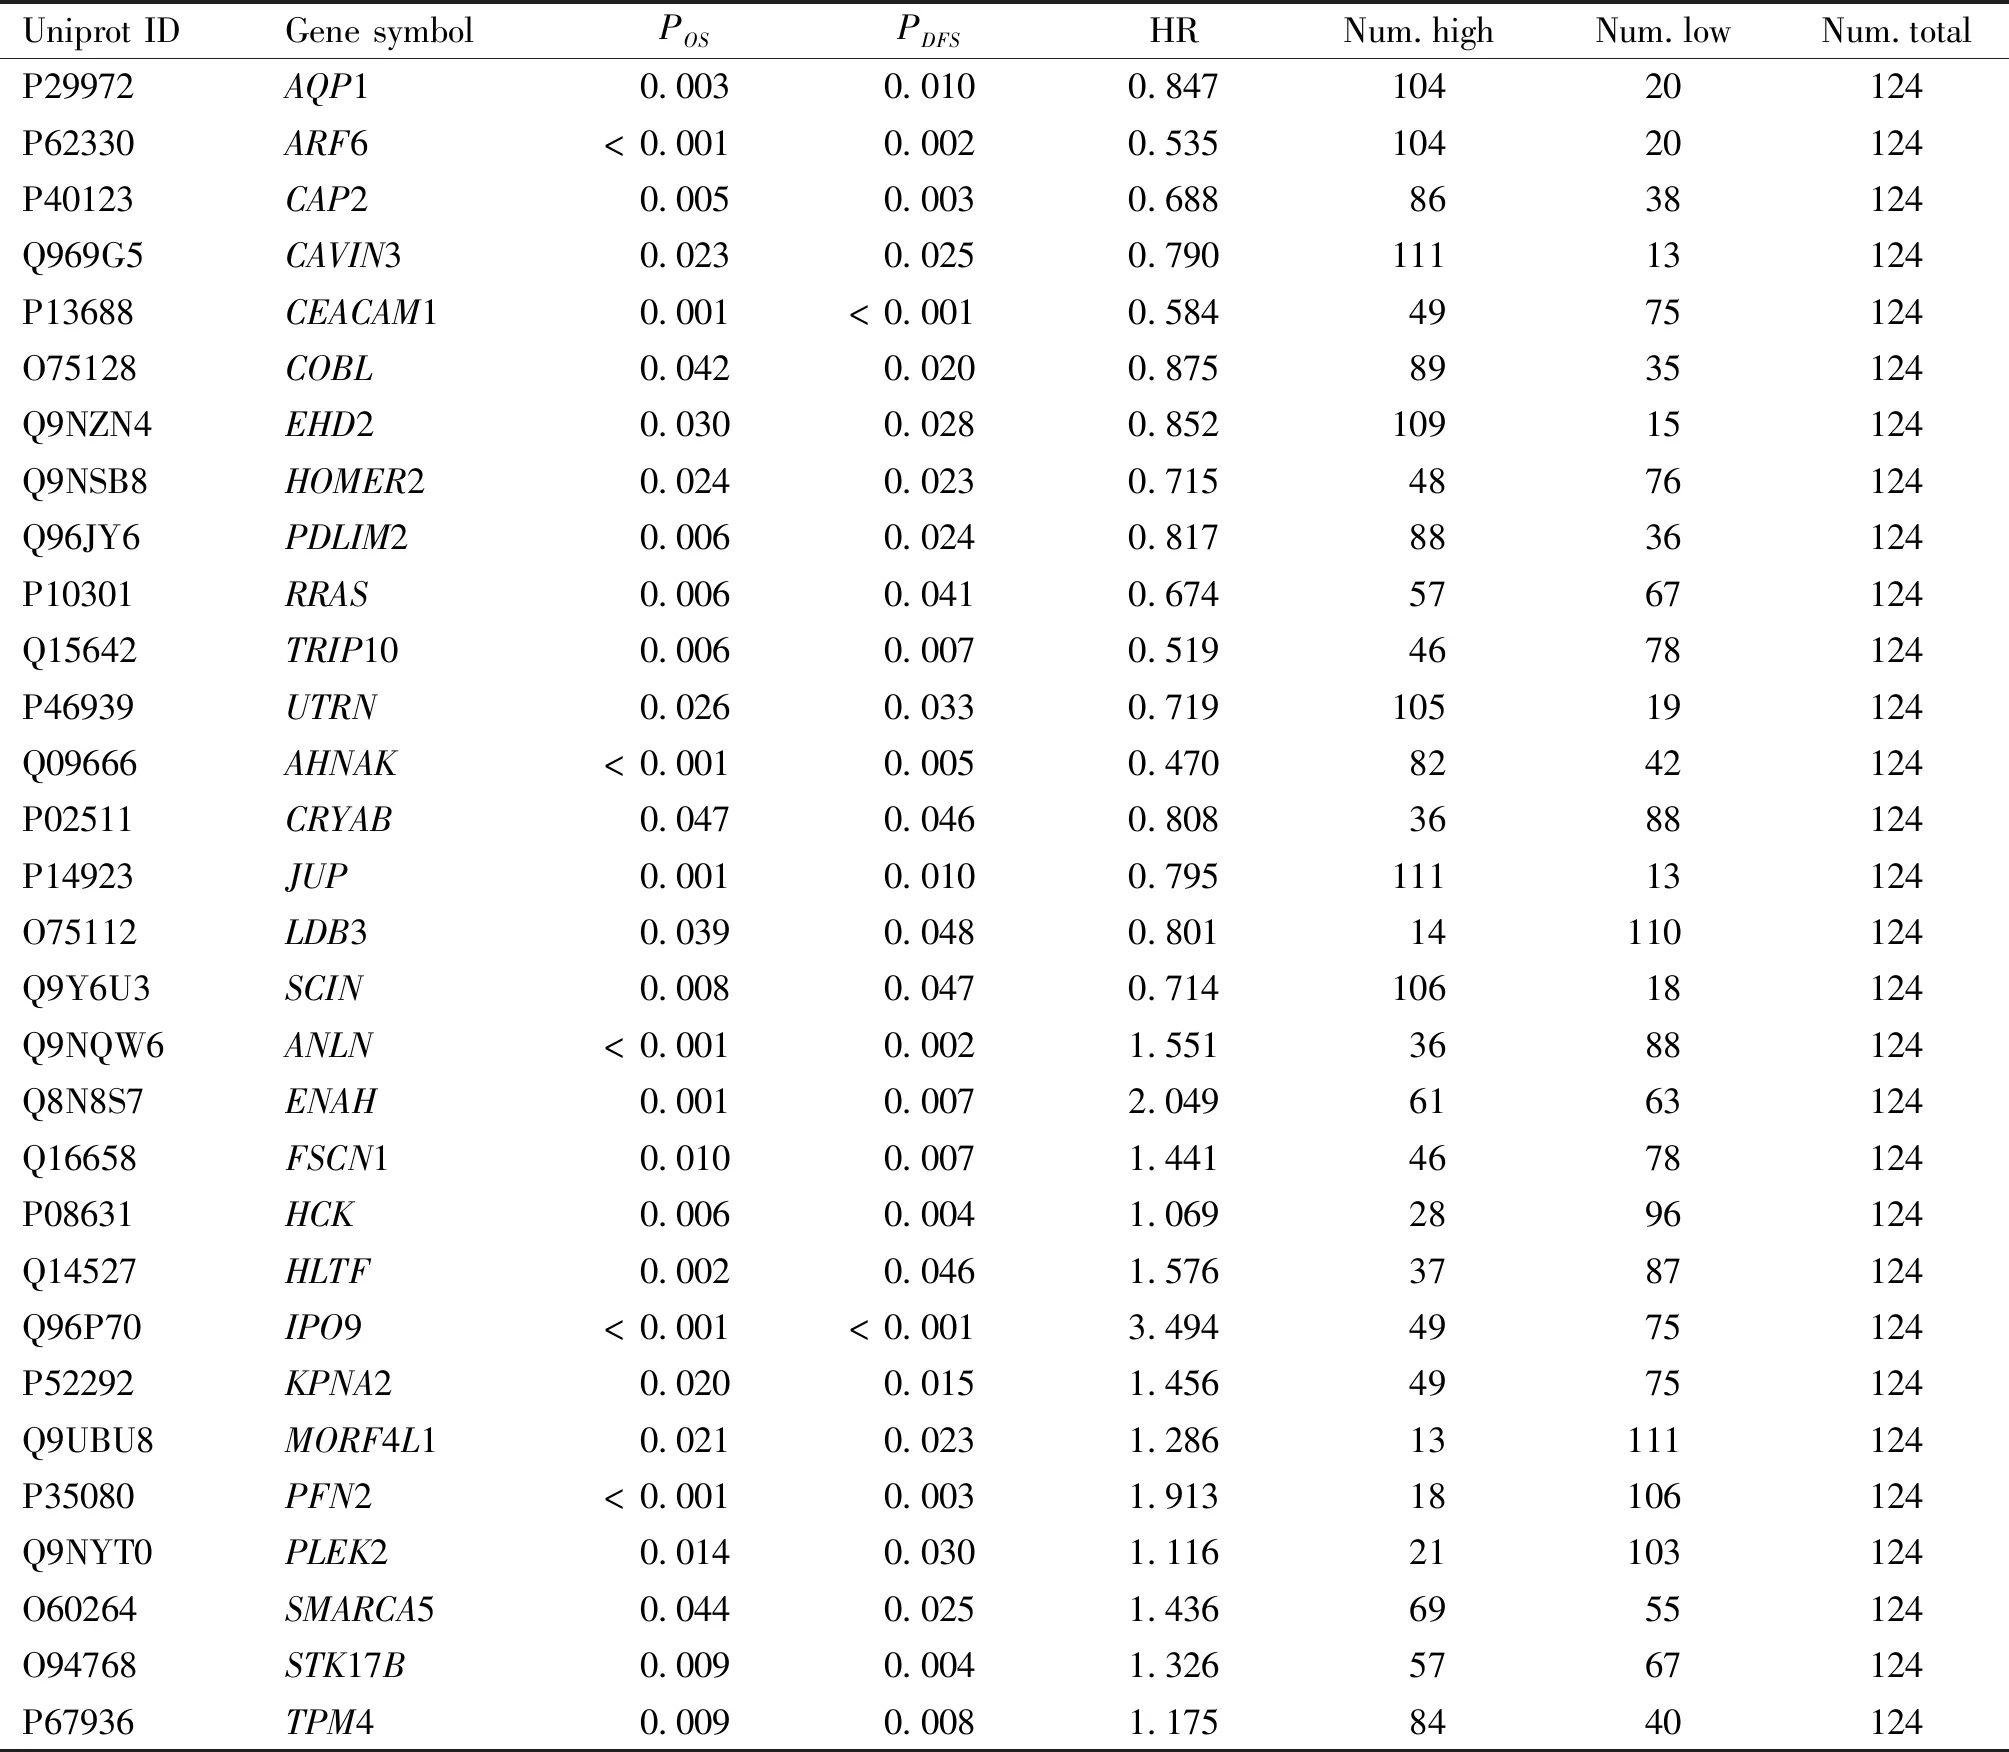
Table 3 Kaplan-Meier results of overall survival and disease-free survival for 30 candidate proteins in 124 patients with esophageal squamous cell carcinoma
2.5 EHD2 overexpression inhibits the progression of the esophageal squamous cell carcinoma cell cycle
Colony formation and EdU assays have shown that EHD2 regulates the proliferation of esophageal squamous cell carcinoma. To further determine whether the effect of EHD2 on cell proliferation of ESCC is regulated by altering cell cycle progression. We used a double-thymidine block to synchronize cells in the cell cycle[28]. Thus, cells in G1/S phase were obtained. When thymidine is removed, cells can resume the cell cycle, allowing cells of different cell cycles to be harvested at different time points (Fig.5A). After the cells were double-blocked with thymidine, the cells were harvested at 0, 3, 6, 9, 12, 15 and 24 hours. Cells were either fixed with 70% ethanol and then stained with propidium iodide, to determine cell cycle phase, or subjected to Western blotting to detect the expression of cyclin B1 and cyclin E2, and target protein EHD2. The results showed that the cells were at the G1/S transition point at 0 hour and when the expression level of cyclin E2 was the highest, and at 12 hours after release, when most of the cells were in the G2/M phase, the expression level of cyclin B1 was the highest at 12 hours after release. These results show that cell cycle synchronization was successfully achieved (Fig.5B-E). The results also indicate that EHD2 protein levels oscillate with the cell cycle, with EHD2 expression being the highest during G1/S transition, suggesting that EHD2 may play an important role in G1/S regulation of the cell cycle (Fig.5C-E). Therefore, we knocked down or overexpressedEHD2 in esophageal squamous cell carcinoma cell lines and determined the cell cycle distribution by flow cytometry. The results showed that the percentage of cells in the G1phase was significantly decreased, while the percentage of cells in the S phase increased inEHD2 knockdown ESCC cell lines (Fig.5F, G). However, the percentage of cells in the G1phase increased and in S phase decreased in theEHD2- andEHD2-3×NLS-overexpressing ESCC cell lines. These results suggest that EHD2 may regulate cell cycle progression by regulating the G1/S transition (Fig.5H).
2.6 EHD2 interacts with key downstream factors of the Wnt signaling pathway and regulates Wnt signaling pathway activity
We used GSEA enrichment analysis to explore the potential molecular mechanism by which low EHD2 expression enhances the proliferation of esophageal squamous cell carcinoma cells. Enrichment analysis showed that low EHD2 expression mainly influenced Wnt, E2F targets, G2/M checkpoint and the DNA repair signaling pathway (Fig.6A, B). The canonical Wnt pathway, the β-Catenin-dependent pathway, is caused by the binding of canonical Wnt ligands to Frizzled receptors and low-density lipoprotein receptor-related protein 5/6 (LRP5/6) leading to the accumulation of intracellular β-Catenin. Upon accumulation, β-Catenin is translocated to the nucleus to bind the T cell factor/lymphoid enhancer-binding factor (TCF/LEF) family of transcription factors and drive the transcription of Wnt target genes[29]. Activation of Wnt signaling was detected by a TCF reporter luciferase assay. Overexpression ofEHD2 andEHD2 carrying a nuclear localization signal (NLS) strongly suppressed TCF/LEF transcriptional activity and deletion ofEHD2 enhanced TCF/LEF transcriptional activity (Fig.6C-E). To further explore how EHD2 affects the activity of TCF/LEF transcription factors, HEK293T cells were transiently transfected with HA-EHD2. Cells were harvested 48 h later and subjected to immunoprecipitation analysis using the anti-HA antibody conjugated to magnetic beads. HA-EHD2 pulled down β-catenin and TCF3 in cells transfected with HA-tagged EHD2, but not in cells transfected with empty HA-Vector (Fig.6F). The interaction was further verified by Duolink-PLA and co-immunoprecipitation (Fig.6G, J). At the same time, Duolink-PLA experiments also showed that this interaction mainly occurs in the nucleus (Fig.6 I, J). These results suggested that EHD2 may act as a transcription suppressor and form a complex with β-catenin and TCF3 in the nucleus to inhibit the proliferation of esophageal squamous cell carcinoma.
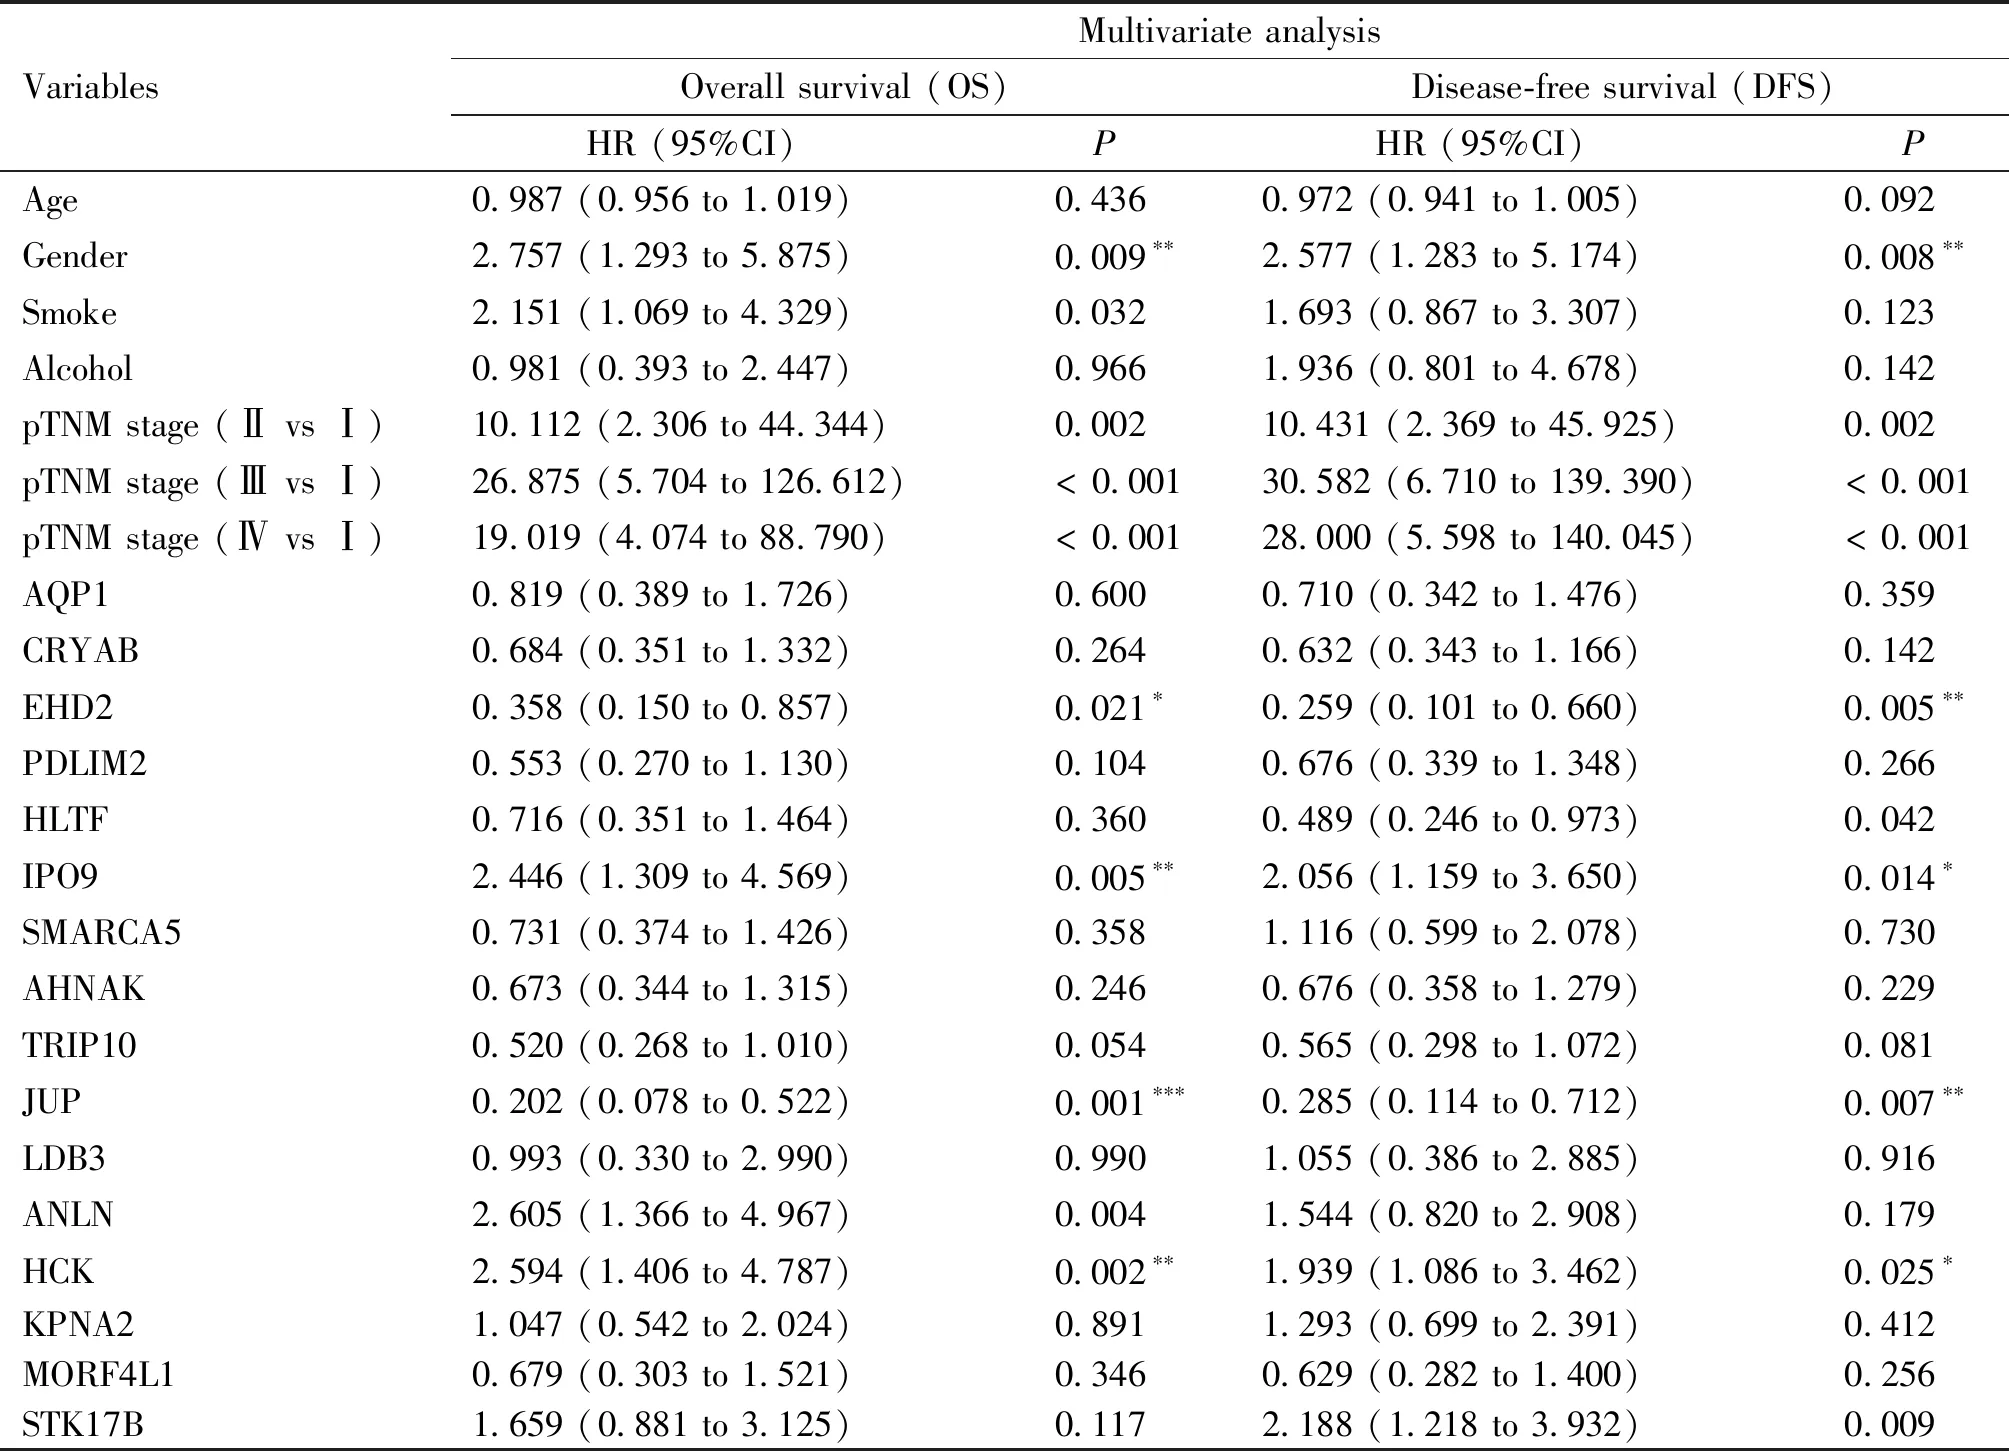
Table 4 Cox multivariate analysis of 16 candidate nuclear actin-binding proteins
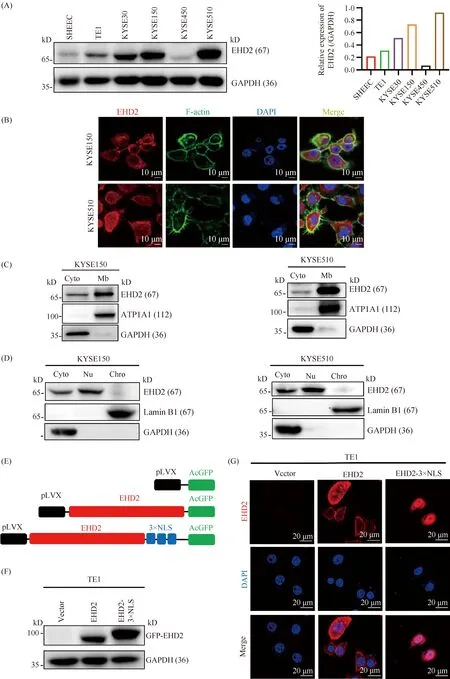
Fig.3 Expression, localization and nuclear localization of EHD2 in esophageal squamous cell carcinoma cell lines (A) Expression of EHD2 in 6 different esophageal squamous cell carcinoma cell lines (left panel). EHD2 protein expression was quantified using the grayscale of the blots and normalized to GAPDH (right panel). (B) Immunofluorescence detection of EHD2 subcellular localization in esophageal squamous cell carcinoma cell lines KYSE150 and KYSE510. F-actin was labeled with phalloidin. Scale bar, 10 μm. (C, D) Western blotting was used to detect EHD2 localization. (E) Diagrams of EHD2 plasmids. (F) Western blotting was used to detect the overexpression of the different plasmid-encoded EHD2 in the TE1 cell line. (G) Localization and expression of plasmid-encoded EHD2 in the TE1 cell line were detected by immunofluorescence. Scale bar, 20 μm
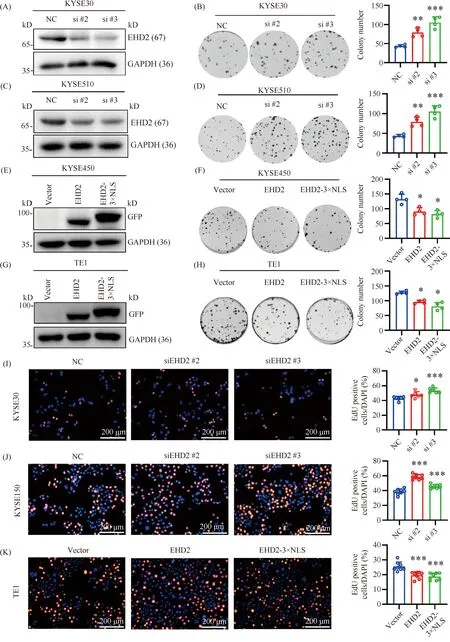
Fig.4 EHD2 overexpression inhibits the proliferation of esophageal squamous cell carcinoma (A, C) The knockdown efficiency of EHD2 was determined in KYSE30 (A) and KYSE510 (C) cells by Western blotting. (B, D) Colony formation was performed using EHD2 knockdown cell lines and negative control cell lines of esophageal squamous cell carcinoma lines KYSE30 (B) and KYSE510 (D) (left panel). All images were analyzed using Image J 1.52 software (right panel). Results represent the mean ± SD, n = 4,** P < 0.01,*** P < 0.001. (E, G) The overexpression of EHD2 and EHD2-3×NLS was determined in KYSE450 (E) and TE1 (G) cells. (F, H) Colony formation was performed using the EHD2- and EHD2-3×NLS-overexpressing cell lines and negative control cell lines of esophageal squamous cell carcinoma lines KYSE450 (F) and TE1 (H) (left panel). All images were analyzed using Image J 1.52 software (right panel). Results represent the mean ± SD, n = 4,*P < 0.05. (I, J) The proliferative capacity of cells after EHD2 knockdown in KYSE30 and KYSE150 cells was detected by EdU assay. The results represent the mean ± SD,*P < 0.05,*** P < 0.001. Scale bar, 200 μm. (K) EdU assay was used to detect the proliferative capacity of cells after overexpression of EHD2 and EHD2-3×NLS in TE1 cells. The results represent the mean ± SD,*** P < 0.001. Scale bar, 200 μm
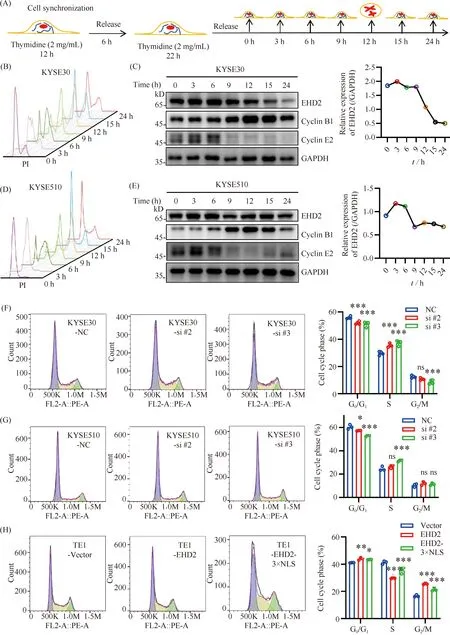
Fig.5 EHD2 overexpression inhibits the progression of the esophageal squamous cell carcinoma cell cycle (A) Outline of cell cycle synchronization in esophageal cells by using the double-thymidine block. Cells were synchronized by double-thymidine block and released at various time points. (B, D) Cell-cycle phases at each time point were determined by flow cytometry of KYSE30 (B) and KYSE510 (D) cells. (C, E) Western blotting was used to detect EHD2 protein expression in various cell cycle stages of KYSE30 (C) and KYSE510 (E) cells (left panel). EHD2 protein expression was quantified using the grayscale of blots and normalized to GAPDH (right panel). (F-H) Flow cytometry was performed to analyze cell cycle progression in the indicated ESCC cell lines. n = 3,*P < 0.05,** P < 0.01,*** P < 0.001
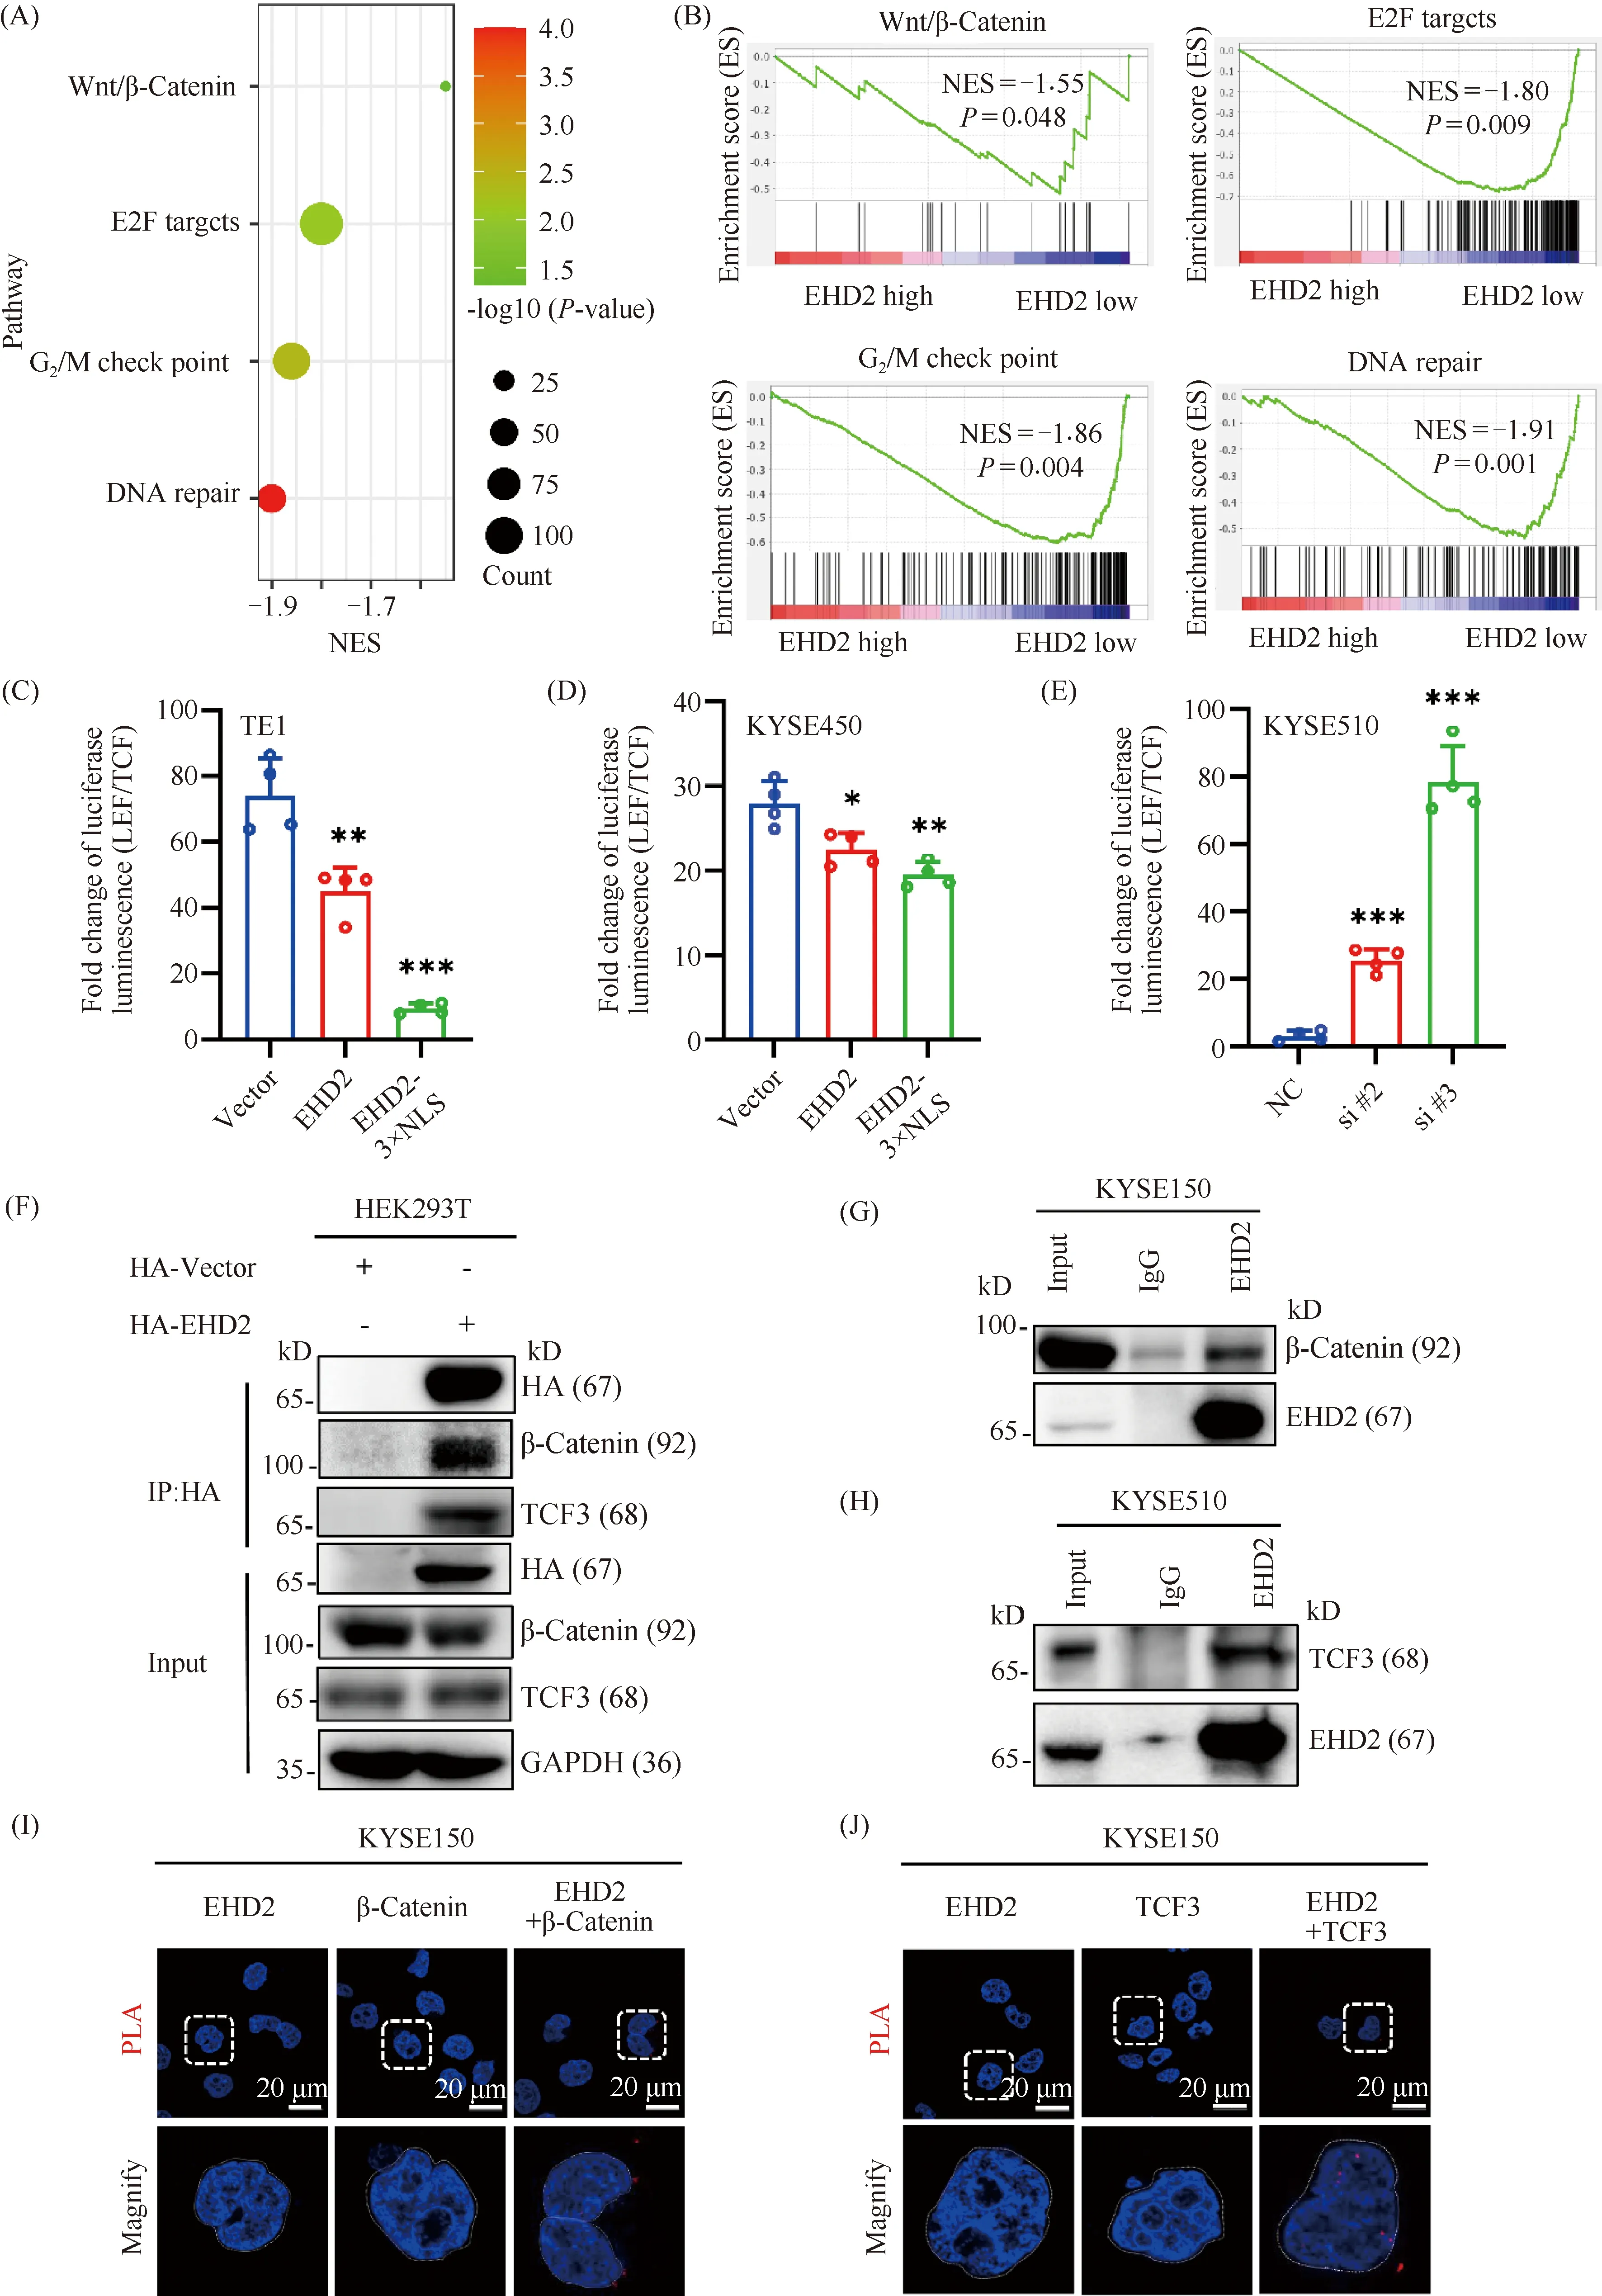
Fig.6 EHD2 interacts with key downstream molecules of the Wnt signaling pathway and regulates Wnt signaling pathway activity (A) GSEA enrichment analysis in esophageal squamous cell carcinoma with low EHD2 expression. (B) Enrichment plots from GSEA. (C, D) TCF/LEF reporter gene plasmid and PRL-TK plasmid were transiently transfected into TE1 and KYSE450 cells overexpressing EHD2 or EHD2-3×NLS. TCF/LEF transcriptional activity was measured by luciferase assay. (E) TCF/LEF reporter gene plasmids and PRL-TK plasmids were transiently transfected into KYSE510 cells with knocked down EHD2. TCF/LEF transcriptional activity was measured by luciferase assay. n = 4,*P < 0.05,** P < 0.01,*** P < 0.001. (F) The interaction of EHD2 with β-catenin and TCF3 was detected by immunoprecipitation after transient transfection of HA-EHD2 plasmid into HEK293 T cells. (G) Immunoprecipitation was used to detect the interaction between EHD2 and β-catenin in KYSE150 cells. (H) Immunoprecipitation was used to detect the interaction between EHD2 and TCF3 in KYSE510 cells. (I) Duolink-PLA was used to detect the interaction between EHD2 and β-catenin in KYSE150 cells. (J) Duolink-PLA was used to detect the interaction between EHD2 and TCF3 in KYSE150 cells
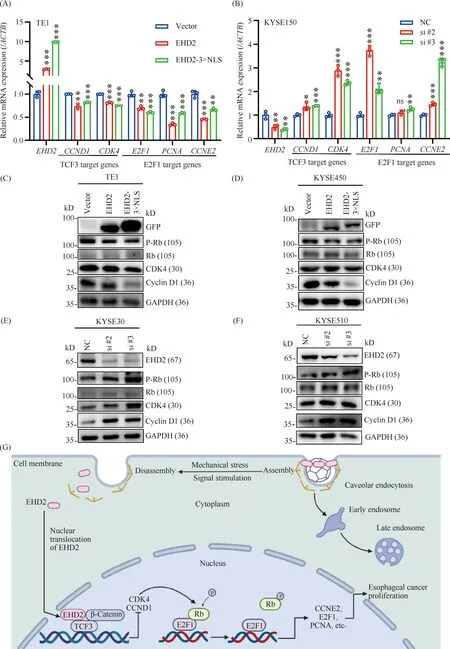
Fig.7 EHD2 overexpression inhibits cell cycle progression through cyclin D1-CDK4-pRb signaling axis (A) Transcript levels of cell cycle-related genes were estimated by real-time PCR in EHD2 and EHD2-3×NLS overexpressing TE1 cells. (B) Transcript levels of cell cycle-related genes were estimated by real-time PCR in EHD2 knockdown KYSE150 cells. n = 3,*P < 0.05,** P < 0.01,*** P < 0.001. (C-D) GFP-EHD2 and GFP-EHD2-3×NLS were transiently overexpressed in TE1 (C) and KYSE450 (D) cells and the expression of cyclin D1-CDK4-pRb signaling axis-related proteins was detected by Western blotting. (E-F) Western blotting was used to detect the expression of cyclin D1-CDK4-pRb signaling axis-related proteins in KYSE30 (E) and KYSE510 (F) cells after EHD2 knockdown. (G) Working model for EHD2-mediated regulation of the proliferation of esophageal squamous cell carcinoma cells
2.7 EHD2 overexpression inhibits cell cycle progression through cyclin D1-CDK4-pRb signaling axis
To further investigate the mechanism underlying the EHD2-mediated inhibition of ESCC cell proliferation and cell cycle progression, quantitative real-time PCR was carried out to determine the downstream cell cycle-related target genes associated with TCF3 and E2F1. Overexpression ofEHD2 andEHD2-3×NLS suppressed the mRNA expression levels of downstream cell cycle-related target genes associated with TCF3 and E2F1 (Fig.7A), whereas knockdown ofEHD2 enhanced the mRNA expression levels ofTCF3 andE2F1 target genes related to the cell cycle (Fig.7B). Expression of cyclin D1 and CDK4 have been shown to be regulated by the transcription factor TCF3, downstream of Wnt signaling pathway. CDK4 is a serine/threonine kinase that is important for controlling the cell cycle and proliferation by modulating the G1/S transition. CDK4 can phosphorylate Rb to cause E2F1 dissociation from Rb, therefore activating the transcription of E2F1 target genes, and propelling cell cycle progression toward the S phase[30]. The expression level of cell cycle related proteins, CDK4, cyclin D1 and pRb, were significantly down-regulated in EHD2-overexpressing TE1 and KYSE450 cell lines (Fig.7C, D), but up-regulated in KYSE30 and KYSE510 cell lines followingEHD2 knockdown (Fig.7E, F). These results suggest that overexpression ofEHD2 andEHD2-3×NLS may slow cell cycle progression by inhibiting G1/S transition through the cyclin D1-CDK4-pRb signaling axis.
3 Discussion
Internalization of cell surface nutrients, receptors and lipids is the basis for maintaining homeostasis of the intracellular environment. Thus, defects in internalization/endocytic trafficking can affect cell metabolism, signaling, and migration, and result in disease[31]. Endocytic trafficking requires the concerted action of a large number of proteins, including the C-terminal Eps15 homology domain-containing (EHD) proteins. In mammals, EHD2 is located in the necks of caveolae, where it stabilizes and constrains caveolae at the plasma membrane[32]. Although an NLS is present in all four mammalian EHDs, only nuclear localization of EHD2 has been observed in both animal and plant cells. Why only EHD2 enters the nuclei of cells is still an open question[20]. EHD2 membrane localization may affect cell signaling, cholesterol homeostasis, mechanical pressure transduction and other biological functions. However, nuclear EHD2 localization might act more directly to influence transcription.
Previous studies have shown that EHD2 is expressed at low levels in human cancers and correlates with poor prognosis. Overexpression of EHD2 can inhibit the malignant progression of tumors[14, 33, 34]. However, the molecular mechanism of EHD2 overexpression inhibiting tumor progression remains to be further explored. In this study, we further demonstrate that EHD2 is not only localized in the cell membrane and cytoplasm, but also is localized in the nucleus. The role and molecular mechanism of nuclear EHD2 during tumor development were unclear. Therefore, we expressed EHD2 fused to nuclear localization signal to study the nuclear function of EHD2. The results showed that overexpression ofEHD2 inhibits the proliferation of esophageal squamous cell carcinoma cells. We further found that EHD2 interacts with β-catenin and TCF3 to subsequently regulate the expression of cyclin D1 and CDK4. CDK4, as an upstream kinase of cell cycle-related protein Rb, modulated the phosphorylation of Rb, thereby affecting the activity of E2F1 transcription factors and regulating the expression of downstream cell cycle related genes. In conclusion, we found that EHD2 regulates the proliferation of esophageal squamous cell carcinoma cells through the cyclin D1-CDK4-pRb signaling axis (Fig.7G). However, the inhibitory effect of nuclear EHD2 on tumor cell proliferation still needs to be further studied at the animal level. EHBP1 is thought to be involved with endocytic trafficking by mediating actin reorganization. EHD2 was reported to connect endocytosis to the actin cytoskeleton through interactions of its N-terminal domain with membranes and its C-terminal EH domain with the novel EHBP1 protein[35]. EHD2 interacts with EHBP1 to participate in the remodeling of the microfilament skeletal system[12]. In this study, our results show that EHD2 inhibits the proliferation and cell cycle progression of esophageal squamous cell carcinoma in a manner dependent on the nuclear function of EHD2. Unfortunately, the relationship between nuclear EHD2 and microfilaments has not been reported and requires further study.
The canonical Wnt signaling pathway (Wnt/β-catenin dependent pathway) operates in two states. In the absence of a Wnt ligand, GSK3 phosphorylates β-catenin and induces its degradation through the ubiquitin-proteasome pathway. As a result, TCF/LEF family proteins repress target gene transcription by interacting with co-repressor proteins. Once Wnt ligands bind to the Frizzled (Fzd) receptors and its coreceptors LRP5/6 on the plasma membrane, the canonical Wnt signaling pathway becomes activated[36]. Under these conditions, GSK3 does not phosphorylate β-catenin, resulting in β-catenin release from the Axin complex and translocation into the nucleus where it interacts with TCF/LEF, leading to the transcription of Wnt target genes[37]. TCF3 is a member of the TCF/LEF family and a downstream effector of canonical Wnt signaling[38]. Our results demonstrate that EHD2 interacts with β-catenin and TCF3 after entering the nucleus to inhibit the transcription of downstream genes. The precise domains of interaction between EHD2, β-catenin and TCF3 deserves further study. Whether EHD2 affects the interaction between β-catenin and TCF3 remains to be explored. In addition, the binding of the TCF/LEF family to DNA is mediated through its HMG box domain, which recognizes a conserved sequence on DNA known as the Wnt response element (WRE, 5′-ACATCAAAG-3′)[39, 40]. It is not clear whether EHD2 affects the binding of TCF3 to target DNA. Future study is warranted in this area.
The D-type cyclin protein family includes three members, cyclin D1, cyclin D2, and cyclin D3. The D-type cyclin protein binds to serine/threonine kinases CDK4 and CDK6 to control cell cycle G1/S transition, thereby initiating DNA replication[30]. The expression, activation, subcellular distribution, and stability of D-type cyclins are tightly controlled in normal cells in response to cell cycle regulated signals. Conversely, overexpression, accumulation, and mislocalization of D-type cyclin proteins promote tumorigenesis and may lead to resistance to chemotherapy. Cyclin D1 is more likely to be dysregulated in expression and localization than cyclin D2 and D3 in solid tumors and hematological malignancies[41]. Genome sequencing reveals thatCCND1 is the second most frequently amplified gene in solid tumors[42]. The activity of cyclin D1 is closely related to its expression level. Tumor cells with high levels of cyclin D1 exhibit uncontrolled proliferation when cell cycle dysfunction occurs at the restriction point in G1phase. In addition to its role in regulating the cell cycle, it interacts with CDK4/6, transcription factors, and chromatin modification-related enzymes to regulate a range of key processes involved in tumorigenesis and progression. These processes include DNA repair[43], chromosome replication and stability[44], autophagy[45], mitochondrial respiration[46], migration[47], and metabolism[48]. GSEA analysis showed that the low expression of EHD2 is not only closely related to cell cycle-related pathways but also regulates DNA repair pathways. Thus, whether nuclear EHD2 regulates DNA damage repair through cyclin D1 requires further investigation. In summary, the present study reveals that EHD2 affects the proliferation of esophageal squamous cell carcinoma through the cyclin D1-CDK4-pRb signaling axis.

