
Concentration maxima of methane in the bottom waters over the Chukchi Sea shelf: implication of its biogenic source
2022-10-19 05:38:04LIYuhongZHANGJiexiaYEWangwangJINHaiyanZHUANGYanpeiZHANLiyang
Advances in Polar Science 2022年3期
LI Yuhong, ZHANG Jiexia, YE Wangwang, JIN Haiyan, ZHUANG Yanpei & ZHAN Liyang*
Concentration maxima of methane in the bottom waters over the Chukchi Sea shelf: implication of its biogenic source
LI Yuhong1, ZHANG Jiexia1, YE Wangwang1, JIN Haiyan2, ZHUANG Yanpei3& ZHAN Liyang1*
1Key Laboratory of Global Change and Marine–Atmospheric Chemistry (GCMAC) of Ministry of Natural Resources (MNR), Third Institute of Oceanography (TIO), MNR, Xiamen 361005, China;2Laboratory of Marine Ecosystem and Biogeochemistry, Second Institute of Oceanography, MNR, Hangzhou 310012, China;3Polar and Marine Research Institute, Jimei University, Xiamen 361021, China
Chukchi Sea shelf, methane, sources, nutrient, organic carbon, organic matter
1 Introduction
Methane (CH4) is the most abundant hydrocarbon in the atmosphere and plays an important role in radiation balance and atmospheric chemistry (Cicerone and Oremland, 1988). The atmospheric CH4concentration has been increasing steadily, with a modern-day level of 1.91 ppmv (parts per million by volume), which is more than twice the preindustrial value of 0.71 ppmv (IPCC, 2007). CH4accounts for 15%–20% of the radiative forcing, and the elevated CH4concentration has further intensified greenhouse effects (Chappellaz et al., 1993). To understand the dynamics of atmospheric CH4, various sources of natural CH4need to be constrained.
Oceans are net sources of atmospheric CH4(Bange et al., 1994; Bates et al., 1996), and 6–12 Tg CH4are emitted from the global ocean per year (Weber et al., 2019). Methanogenesis, an anaerobic microbial process mediated by archaea, amounts to approximately 0.1% of ocean primary productivity, is most prevalent in sediments with a high sedimentation rate (Henrichs and Reeburgh, 1987; Reeburgh, 2007), and is thought to dominate marine CH4emissions. However, seepages of thermogenic CH4and the breakdown of CH4hydrates may also be significant contributors to these emissions (Kvenvolden and Rogers, 2005). Recent estimates suggest that 7×10⁵–4×10⁶Tg CH4are stored as hydrates in the ocean (Buffett and Archer, 2004); this value is at least 2 orders of magnitude larger than the atmospheric CH4reservoir (~ 5000 Tg).
A large amount of organic carbon is buried in Arctic Ocean sediments (Gramberg et al., 1983; Shakhova and Semiletov, 2007), which makes the Arctic Ocean a potential CH4source. The Arctic Ocean is particularly sensitive to global warming, and the effects of warming on ecosystems will be the most dramatic in the Arctic (Holland and Bitz, 2003). Recently, many studies have proposed that the Arctic shelf is an important CH4source, and an additional release of CH4might result from the temperature destabilization of gas hydrates on the shallow continental shelves in the Laptev and East Siberian Seas (Shakhova and Semiletov, 2007; Shakhova et al., 2010), Spitsbergen continental margin (Damm et al., 2005; Westbrook et al., 2009). Organic matter stored in the sediment might be mobilized onto the shelves, leading to further biogenic CH4release via methanogenesis in the White Sea and Storfjorden (Savvichev et al., 2004; Damm et al., 2007). However, the sources of CH4are still not well understood in the Arctic shelf due to the complexity of the processes involved and the difficult access to these remote regions. In the Chukchi Sea, limited research has revealed CH4accumulation in the bottom waters (Li et al., 2017; Kudo et al., 2018; Bui et al., 2019). In conjunction with13CCH4values (Fenwick et al., 2017; Kudo et al., 2022), the most likely CH4source in this region is biogenic production, resulting from the decomposition of organic carbon in the seafloor. To date, it is believed that methane from the Arctic continental shelf is dominated by thermogenic origin, with a secondary of biogenic source (Berchet et al., 2020).
In this study, we present data for CH4in a water column over the Chukchi Sea shelf (CSS). We were able to obtain the characteristics of the vertical distribution of CH4in relation to the water mass structure. We also compare CH4with nutrient data and discuss possible processes that produce CH4in seawater.
2 Study area and methodology
2.1 Study area and its hydrographic setting
The CSS is one of the largest continental shelves in the world and has high biological productivity; Pacific Ocean waters transit through the Bering Strait and enter the Chukchi Sea (Figure 1). Three main transport pathways have been identified in the CSS: the inflow of warmer, fresher Alaskan Coastal Current (ACC) waters through the eastern channel (Coachman and Aagaard, 1966; Gong and Pickart, 2015); the transport of Bering Shelf Water (BSW) through the central channel between the Herald and Hanna Shoals (Woodgate et al., 2005); and the transport of colder, saltier, more nutrient-rich Anadyr Water in the west, which tends to follow Hope Valley toward Herald Canyon (Weingartner et al., 2005). Shipboard observations were conducted on the R/Vduring the 5th Chinese National Arctic Research Expedition (CHINARE); seawater samples for CH4and otherparameters were collected along 169°E meridian (named SR section) in September 2012. The sampling depths were 5, 20, 30, 40, 50, 70, 100 m and 5 m above sea floor.
2.2 Methods
CH4samples were transferred to a Biochemical Oxygen Demand (BOD) bottle (250 mL), with approximately twofold overflow of the bottle volume to avoid bubbles. To inhibit biological activity, 120 μL of saturated HgCl2solution was added to the water samples. The bottles were sealed with greased stoppers that were then fixed with a clip. The sample bottles were kept in the dark at 4 ℃until transport back to the laboratory on land for analysis. Subsamples were taken following the method of Butler and Elkins (1991). The headspace method was adopted to pretreat the water samples, and high-purity N2was introduced to create an around 7 mL headspace in 50 mL preweighed bottles. After shaking for 1 h at 30.0 ℃, full equilibrium was achieved. The 5-mL gas samples were injected into an Agilent 7890A gas chromatography equipped with a flame ionization detector (FID). The CH4gas standards were provided by the National Institute of Metrology, China. There is a linear relationship between the FID signal and the CH4concentration; a single-point standard was inserted after every 12 samples to enable assessment of the drift of the FID. The precision of repeated analyses of 10 water samples was approximately 5% (Li et al., 2017).

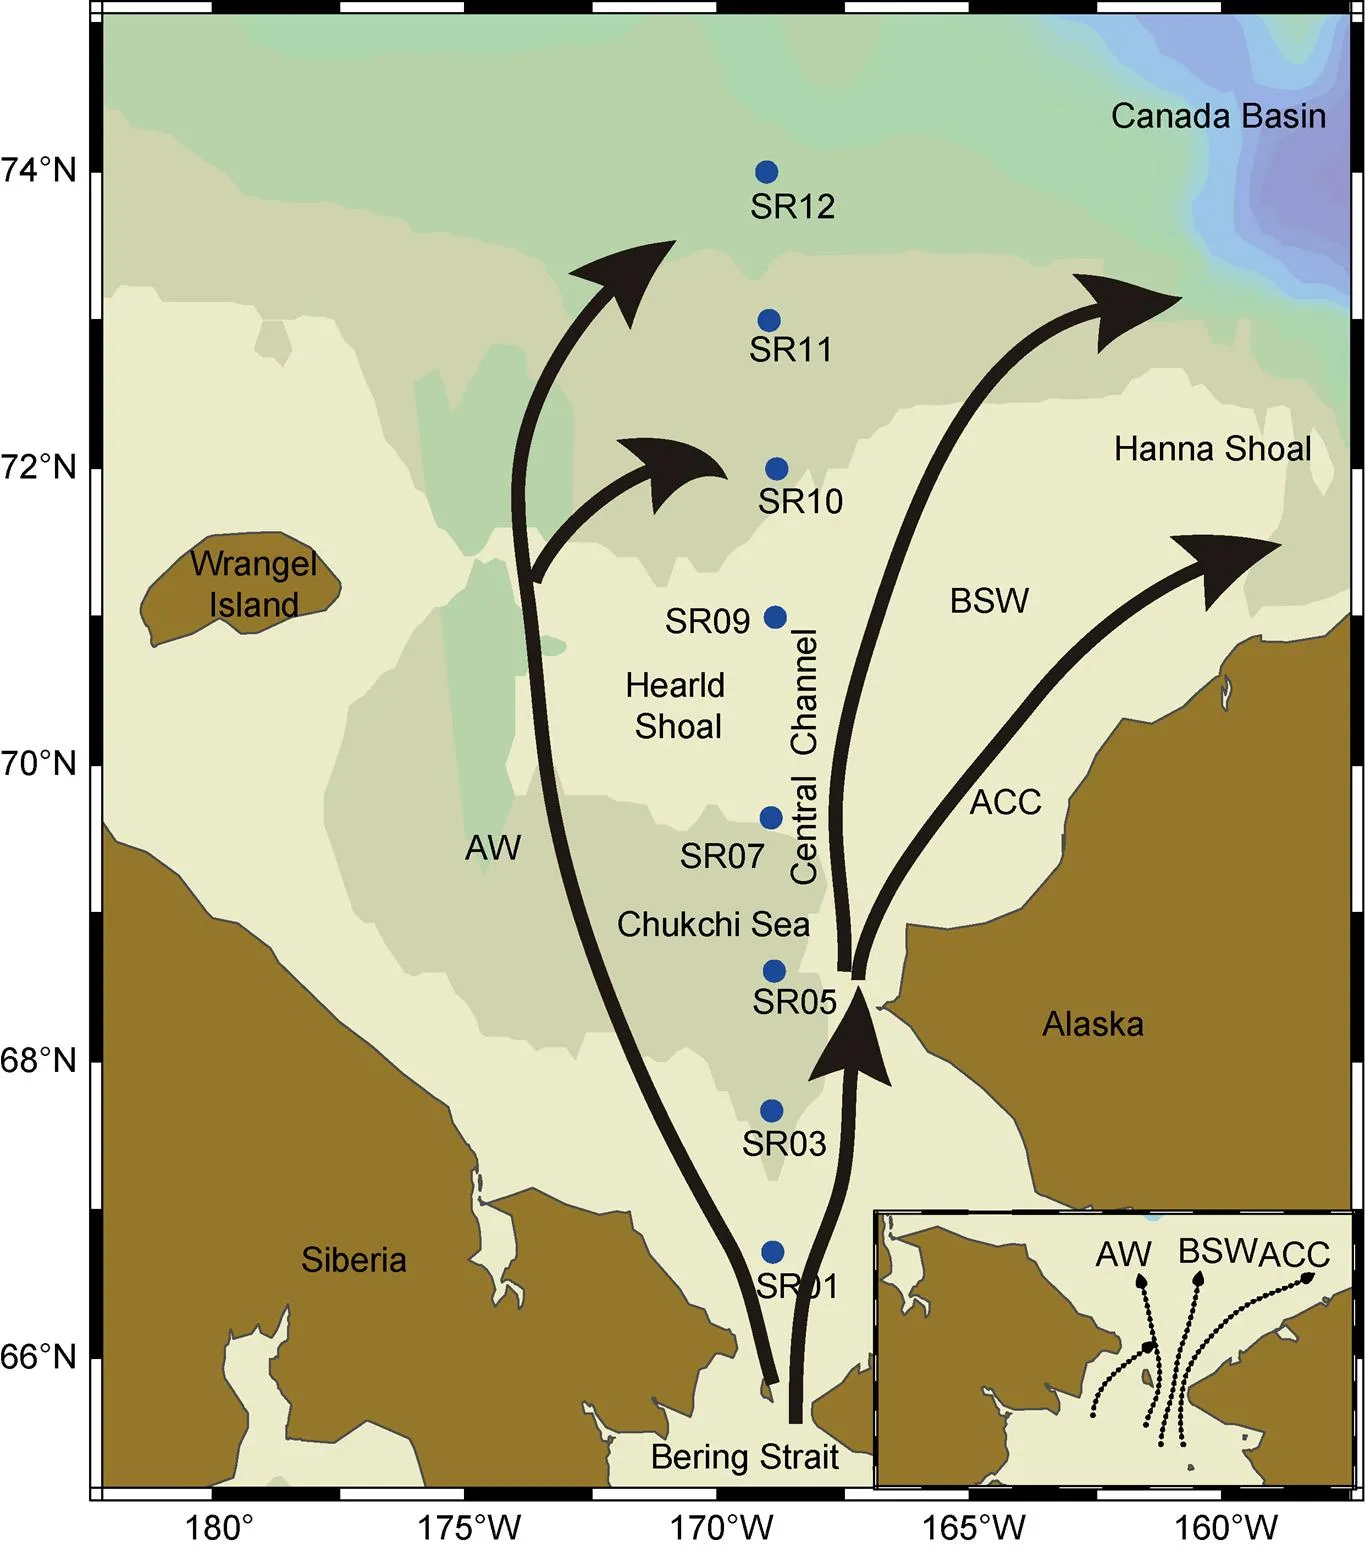
Figure 1 Sampling stations along the SR section (blue circles) in the CSS during the 5th CHINARE. The inflow of the Bering Strait is separated into three main branches: Anadyr Water (AW), Bering Shelf Water (BSW), and Alaska Coastal Water (ACC).
3 Results and discussion
3.1 Hydrology and nutrient distributions
Due to the influence of warm and saline Pacific water and cold and fresh ice-melt water, wide temperature and salinity ranges were observed in the water column of the SR transect, with values ranging from approximately −1.6–7.6℃ and 26.4–34.4, respectively (Figure 2). Cold and even freezing temperatures were observed in the northern bottom region, and warm water was distributed mainly in the southern surface layer. High-salinity (>32) water was present only in the bottom of the column, whereas low-salinity water (<32) water was widely distributed in the narrow surface waters. The distribution pattern of temperature was the opposite of that of salinity along the transect. Despite the change in temperature, the pattern of potential density was similar to that of salinity, which indicates that the water masses were mainly controlled by salinity. High stratifications could be observed in the distribution patterns, with the intensive dispersal of dense water masses at the bottom and vice versa.
Physical characteristics of the water masses were identified (Figure 3), and high-temperature and low-salinity waters (T≈6℃, S≈27) on the southern surface were distinguished from BSW (Walsh et al., 1989). An extremely fresh and relatively cold water mass (T≈−1℃, S≈27) in the northern surface typically originates from near-surface ice-melt water (SIMW) (Weingartner et al., 2005). A high-salinity water with freezing temperatures (T≈0℃, S≈33) dispersed in the bottom layer is typically regarded as a portion of remnant winter-transformed water (WW) from the previous winter (Weingartner et al., 1998; Spall, 2007). In the study area, a salinity gradient generated a pronounced pycnocline at depths of 20–30 m, and vertical diffusive transport and the mixing of biogenic elements were restricted and trapped in the bottom waters.
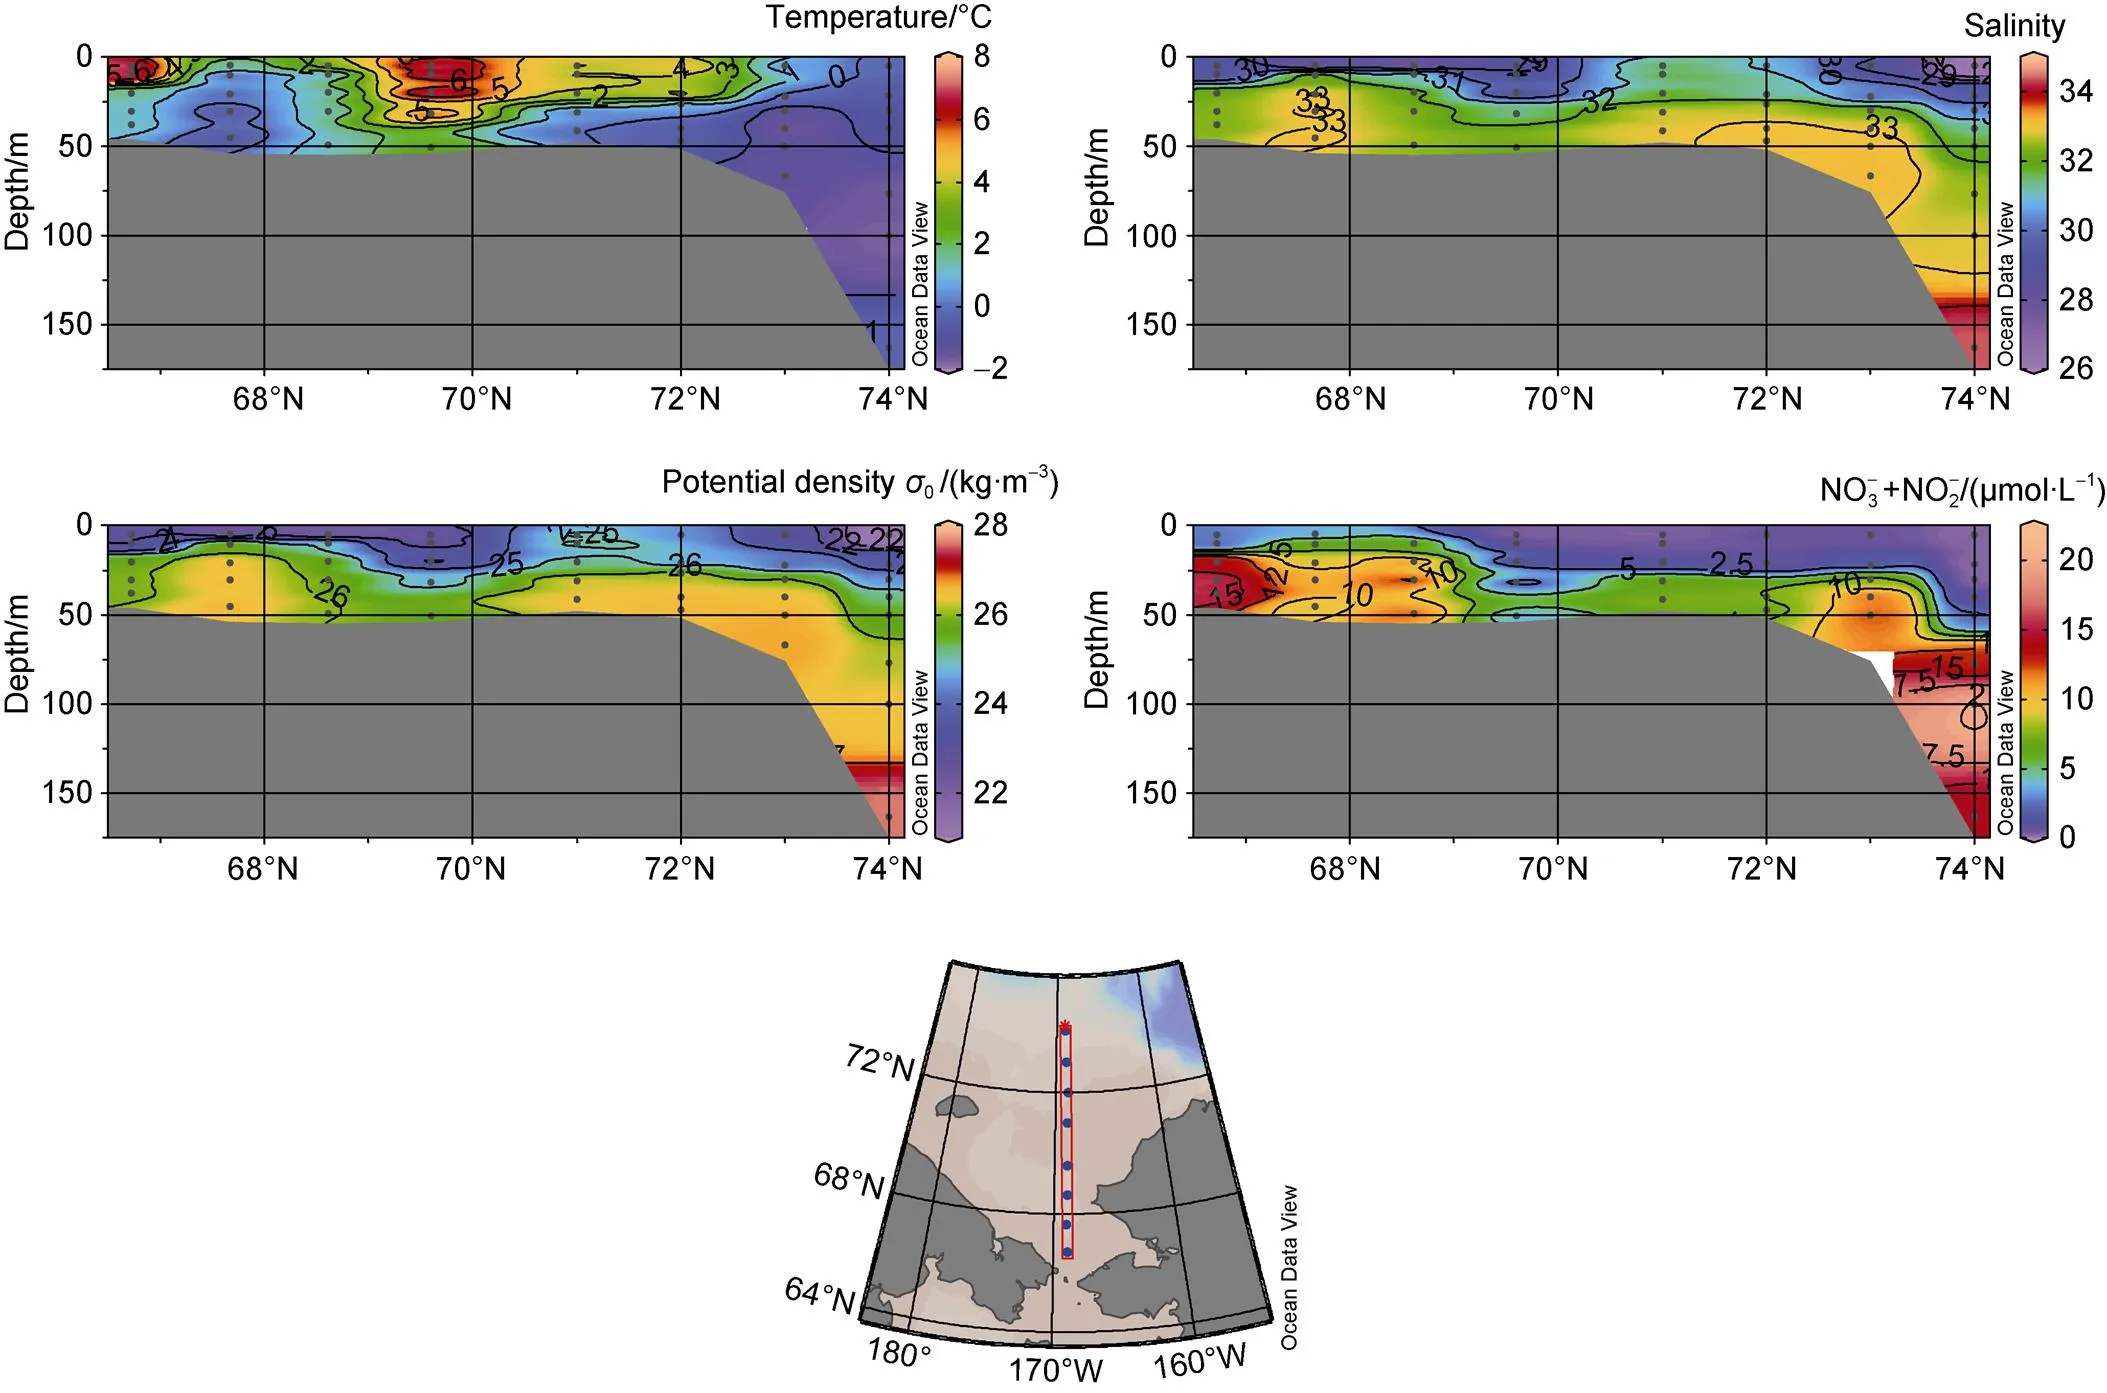

Figure 3 Temperature-salinity diagrams and CH4concentrations in the SR section of the CSS.
3.2 Distributions of CH4 in the CSS
The vertical distribution of CH4along section SR is presented in Figure 4, showing that the CH4concentrations showed marked variations; CH4in the surface waters (approximately 5 m below the sea surface) ranged from 4.6 nmol·L−1to 14.6 nmol·L−1, which were significantly higher values than the expected atmospheric equilibrium concentrations of 3.2–4.1 nmol·L−1, with saturations from 114% to 398%. This result means that surface waters in the CSS were supersaturated with CH4and could be a potential source of atmospheric CH4. In the water column,CH4concentrations ranged from 4.8 nmol·L−1to 38.8 nmol·L−1, and the maximum concentrations of CH4were distributed in the bottom waters of stations SR03, SR10, and SR11, representing CH4supersaturation of up to 962% in the dense and cold bottom waters of the CSS. The ambient dissolved oxygen (DO) of the water column ranged from 7.3 mg·L−1to 13.9 mg·L−1, with high concentrations located in the surface waters of stations SR03, SR11, SR12 and the lowest values at the bottom waters of the same stations. There were consistently high concentrations of CH4and low DO levels in the bottom waters of stations SR03, SR10 and SR11 (Figure 4, Table 1). Nutrient-rich Pacific water and sea-ice melting increase the light-stimulated primary production of ice algae andphytoplankton, maintaining high concentrations of DO in the surface and shallow depths, as well as low grazing pressure and a high flux of organic carbon settling to the seafloor (Grebmeier et al., 2006); furthermore, respiratory action consumes O2and reduces the concentration of DO in the bottom waters. In general, the distribution pattern of CH4is similar to that of salinity and potential density, with an increasing trend from the surface to bottom water (WW). Water masses are a factor controlling the gradient shape in the Chukchi Sea, suggesting that high concentrations of CH4are trapped below the pycnocline (Fenwick et al., 2017; Kudo et al., 2022); thus, the CH4concentration in surface waters is limited during the autumn stratification period (Kudo et al., 2022). The distribution of CH4showed a clear increasing downward gradient, indicating that high concentrations of CH4in near-bottom waters at these stations might correlate with the production and emission of CH4from the organic-rich sediment interface.
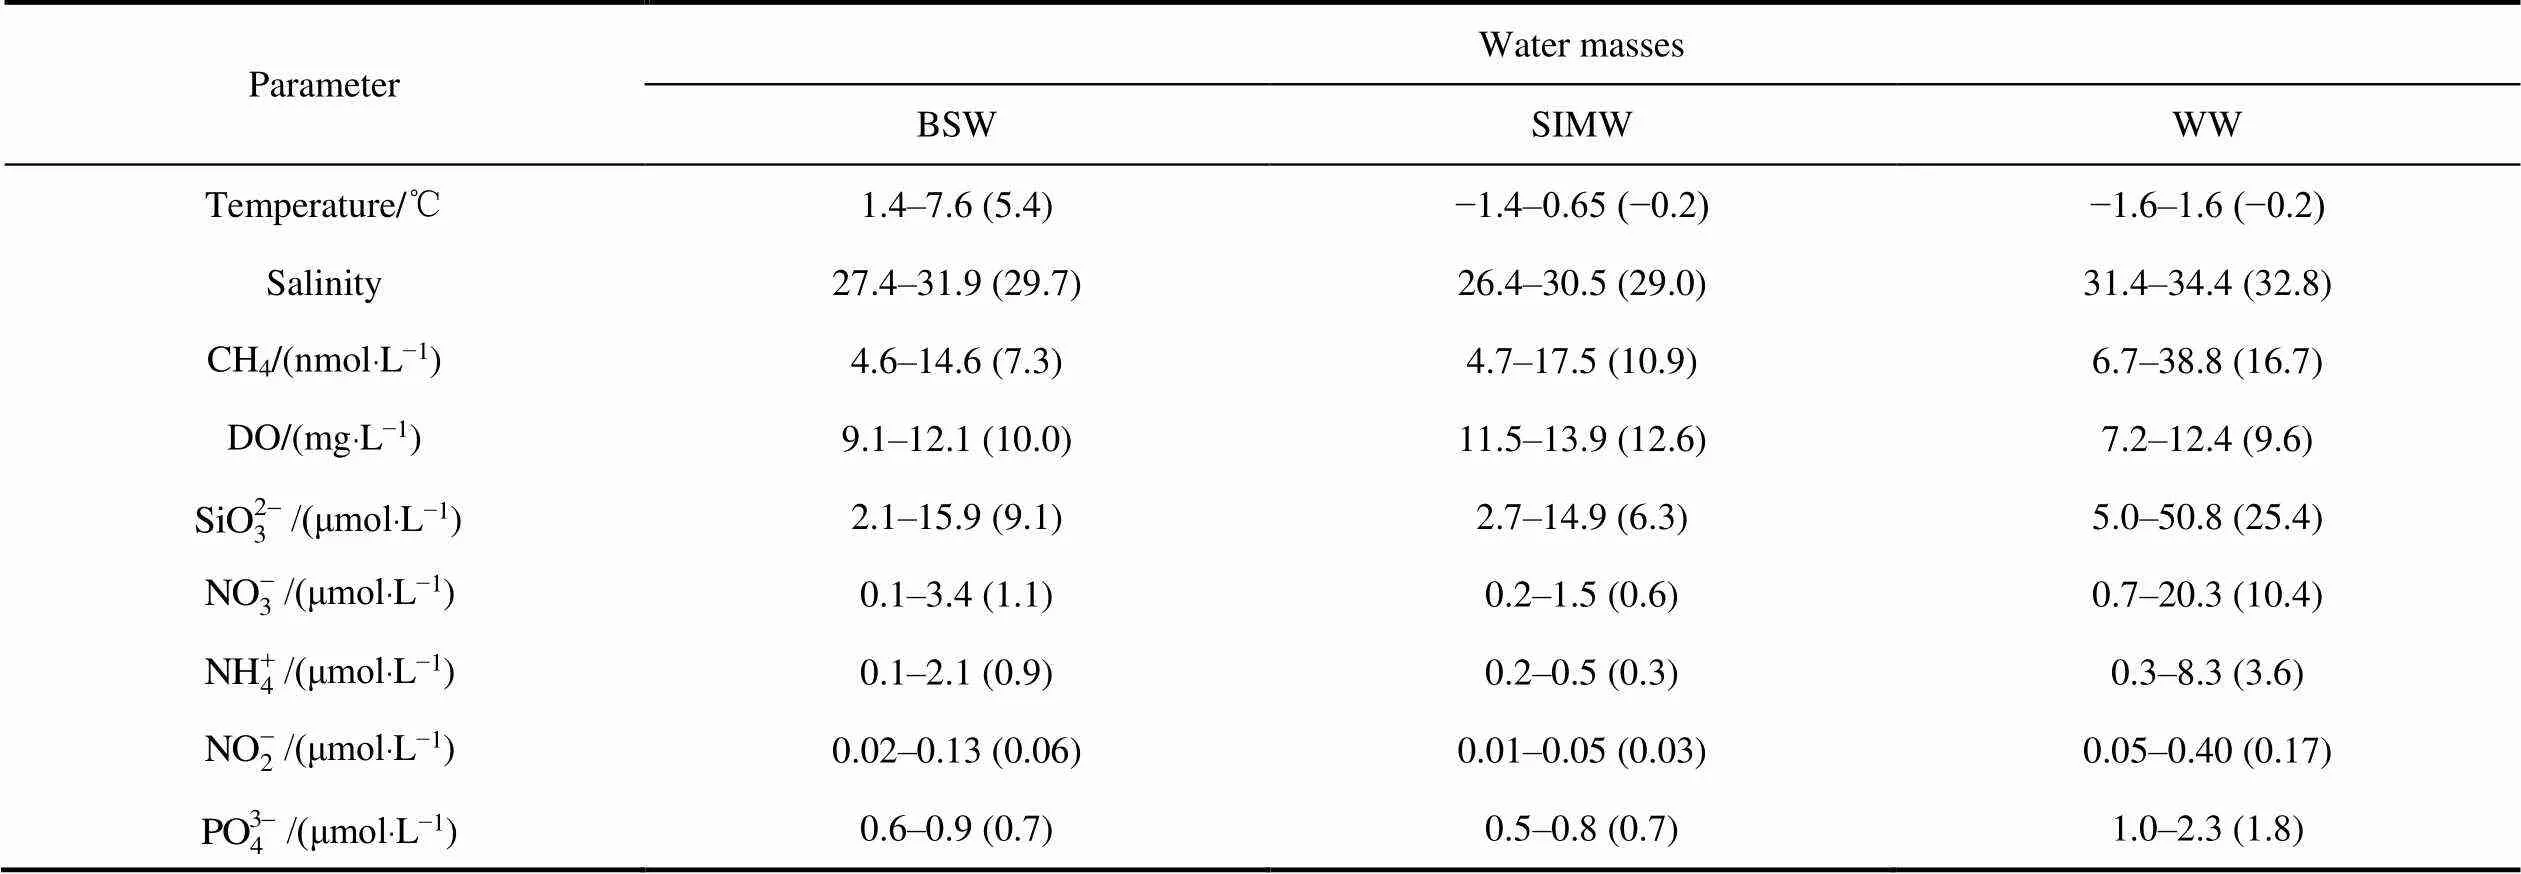
Table 1 Mean (in brackets) and variation ranges of the main parameters in different water masses in the CSS
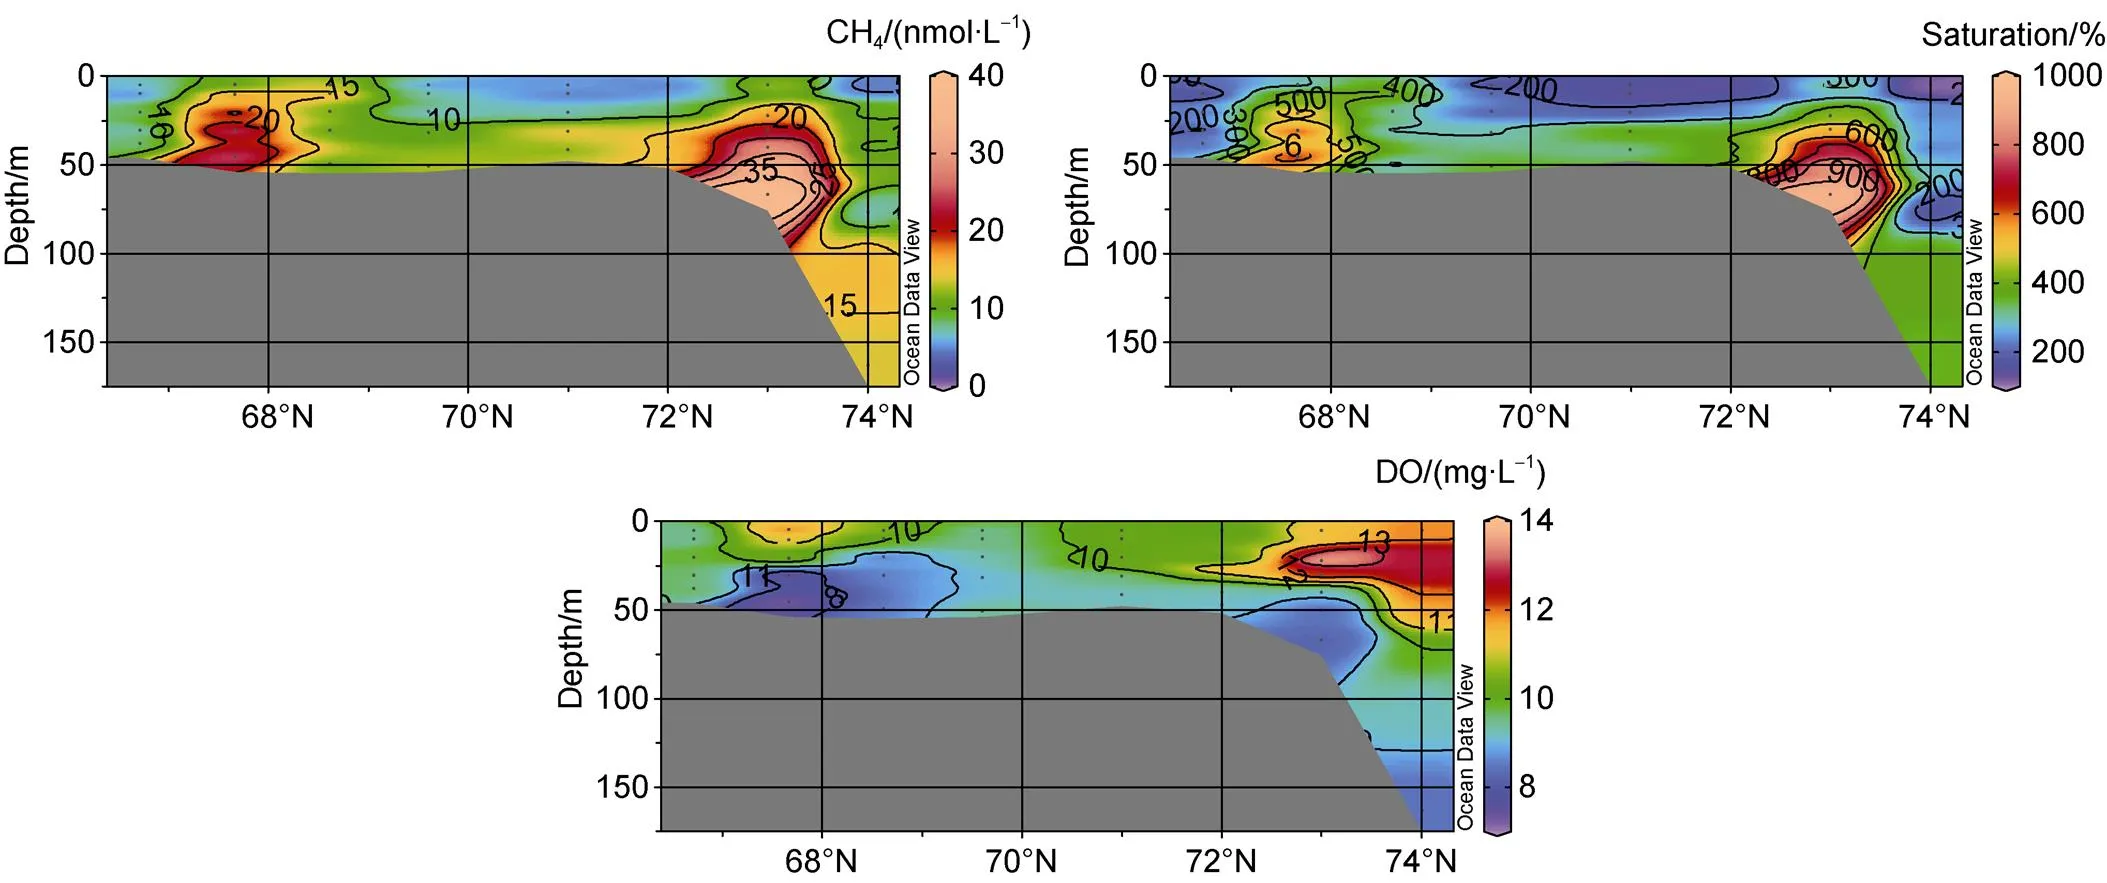
Figure 4 Distributions of methane (CH4), methane saturations and dissolved oxygen (DO) in the SR section of the CSS.
3.3 Sources of CH4 in the CSS
3.4 Comparison with other areas in the Arctic Ocean
CH4can be produced through the bacterial degradation of organic materials in sediments and subsequent release into the overlying near-bottom waters through sediment water exchange, seepages of thermogenic methane from the decomposition of hydrates, the leakage of gas, and serpentinization reactions that may occur in specific areas (Reeburgh, 2007). As this area does not apparently contain subsea permafrost or gas hydrates (Ruppel, 2015), and13CCH4values are indicative of biogenic production (Whiticar and Faber, 1986), the most likely CH4source in this region is seafloor methanogenesis resulting from the decomposition of organic carbon (Fenwick et al., 2017). In the CSS areas, the concentrations in the bottom layer were higher (up to 55.9 nmol·L−1), whereas13C values were lower (down to −63.8‰) than in the surface layer, indicating that CH4was produced mainly by organic matter degradation in seafloor sediment via methanogens (Kudo et al., 2022). As a result, the release of CH4from the sediments into the water column results in a dome-like structure of relatively high CH4concentrations in the dense bottom water of the CSS. We summarized CH4concentrations and sources in different areas of the Arctic Ocean (Table 3) and distinguished the origin of CH4from sedimentary release. Compared to the open ocean, in the East Siberia Sea, because of a lack of sunlight and highly turbid waters, primary production is suppressed by factors of 100 to 1000, whereas the CH4levels are elevated 10-fold, which could be attributed to the thawing of the subsea permafrost and the consequentially increased permeability for CH4(Shakhova et al., 2010). In SW-Spitsbergen, CH4concentrations 2 orders of magnitude higher than the equilibrium concentrations with the atmosphere are discharged from thermogenic processes or hydrate on top of sandy and gravelly banks, with distinctly heavy13CCH4values (Damm et al., 2005). The highest concentration of CH4in the White Sea and Storfjorden was approximately 50 nmol·L−1in the bottom waters because of high accumulation rates of organic carbon (Damm et al., 2007; Savvichev et al., 2004); thus, both areas are ideal environments for the formation of biogenic methane near the sediment surface (Daniel and Jochen, 2005). For dome-like structure formation and turbulent mixing models, a dilution factor of 104is assumed (Lupton et al., 1985). Therefore, a potential initial CH4concentration of approximately 0.4 mmol·L−1in the sediments is sufficient to create a plume with the CH4concentrations detected in the CSS bottom waters (approximately 40 nmol·L−1) and the maximum CH4concentration of 2 mmol·L−1in the seafloor over the CSS (Matveeva et al., 2015). Indeed, the Chukchi Sea bottom sediments have been shown to support methanogenesis rates of up to 67 μmol·m−2·d−1(Savvichev et al., 2007). This intensive CH4production in shallow sediment could supply CH4to the bottom waters, resulting in high CH4concentrations (Fenwick et al., 2017). Thus, we suggest that the decomposition of organic carbon from primary production underlies the biogenic formation of CH4in the CSS.

Table 2 Correlation analysis between ΔCH4 and +, , , , and with Pearson and Spearman models
Note: **<0.01, indicating all correlations are significant at the 0.01 level.

Table 3 CH4 concentrations and sources in different areas of the Arctic Ocean
4 Conclusion
This work was supported by the Scientific Research Foundation of the Third Institute of Oceanography, MNR (Grant nos. 2022011, 2018031 and 2018024) and the Natural Science Foundation of Fujian Province, China (Grant no. 2020J01102). We appreciate two anonymous reviewers, and Associate Editor Dr. Daiki Nomura for their constructive comments that have further improved the manuscript.
Bange H W, Bartell U H, Rapsomanikis S, et al. 1994. Methane in the Baltic and North Seas and a reassessment of the marine emissions of methane. Global Biogeochem Cycles, 8(4): 465-480, doi:10.1029/ 94gb02181.
Bates T S, Kelly K C, Johnson J E, et al. 1996. A reevaluation of the open ocean source of methane to the atmosphere. J Geophys Res, 101(D3): 6953-6961, doi:10.1029/95jd03348.
Berchet A, Pison I, Crill P M, et al. 2020. Using ship-borne observations of methane isotopic ratio in the Arctic Ocean to understand methane sources in the Arctic. Atmos Chem Phys, 20(6): 3987-3998, doi:10.5194/acp-20-3987-2020.
Berner R A. 1982. Burial of organic carbon and pyrite sulfur in the modern ocean: its geochemical and environmental significance. Am J Sci, 282(4): 451-473, doi:10.2475/ajs.282.4.451.
Buffett B, Archer D. 2004. Global inventory of methane clathrate: sensitivity to changes in the deep ocean. Earth Planet Sci Lett, 227(3-4): 185-199, doi:10.1016/j.epsl.2004.09.005.
Bui O T N, Kameyama S, Kawaguchi Y, et al. 2019. Influence of warm-core eddy on dissolved methane distributions in the southwestern Canada Basin during late summer/early fall 2015. Polar Sci, 22: 100481, doi:10.1016/j.polar.2019.100481.
Butler J H, Elkins J W. 1991. An automated technique for the measurement of dissolved N2O in natural waters. Mar Chem, 34(1-2): 47-61, doi:10.1016/0304-4203(91)90013-M.
Chappellaz J, Bluniert T, Raynaud D, et al. 1993. Synchronous changes in atmospheric CH4and Greenland climate between 40 and 8 kyr BP. Nature, 366(6454): 443-445, doi:10.1038/366443a0.
Cicerone R J, Oremland R S. 1988. Biogeochemical aspects of atmospheric methane. Global Biogeochem Cycles, 2(4): 299-327, doi:10.1029/gb002i004p00299.
Coachman L K, Aagaard K. 1966. On the water exchange through Bering Strait. Limnol Oceanogr, 11(1): 44-59, doi:10.4319/lo.1966.11.1. 0044.
Damm E, Mackensen A, Budéus G, et al. 2005. Pathways of methane in seawater: plume spreading in an Arctic shelf environment (SW- Spitsbergen). Cont Shelf Res, 25(12-13): 1453-1472, doi:10.1016/j. csr.2005.03.003.
Damm E, Schauer U, Rudels B, et al. 2007. Excess of bottom-released methane in an Arctic shelf sea polynya in winter. Cont Shelf Res, 27(12): 1692-1701, doi:10.1016/j.csr.2007.02.003.
Daniel W, Jochen K. 2005. Recent distribution and accumulation of organic carbon on the continental margin west of Spitsbergen, Geochem Geophy Geosy, 6(9): 117-134, doi:10.1029/2005GC000916.
Devol A H, Codispoti L A, Christensen J P. 1997. Summer and winter denitrification rates in western Arctic shelf sediments. Cont Shelf Res, 17(9): 1029-1050, doi:10.1016/S0278-4343(97)00003-4.
Fenwick L, Capelle D, Damm E, et al. 2017. Methane and nitrous oxide distributions across the North American Arctic Ocean during summer, 2015. J Geophys Res, 122(1): 390-412, doi:10.1002/2016JC012493.
Gentz T, Damm E, Schneider von Deimling J, et al. 2014. A water column study of methane around gas flares located at the West Spitsbergen continental margin. Cont Shelf Res, 72: 107-118, doi:10.1016/j.csr. 2013.07.013.
Gong D, Pickart R S. 2015. Summertime circulation in the eastern Chukchi Sea. Deep Sea Res Part II Top Stud Oceanogr, 118: 18-31, doi:10.1016/j.dsr2.2015.02.006.
Gramberg I S, Kulakov Y N, Pogrebitskiy Y Y, et al. 1983. Arctic oil- and gas-bearing superbasin. Paper presented at the 11th World Petroleum Congress, London, UK, August 1983.
Grebmeier J M, Bluhm B A, Cooper L W, et al. 2015. Ecosystem characteristics and processes facilitating persistent macrobenthic biomass hotspots and associated benthivory in the Pacific Arctic. Prog Oceanogr, 136: 92-114, doi:10.1016/j.pocean.2015.05.006.
Grebmeier J M, Cooper L W, Feder H M, et al. 2006. Ecosystem dynamics of the Pacific-influenced northern Bering and Chukchi Seas in the Amerasian Arctic. Prog Oceanogr, 71(2-4): 331-361, doi:10.1016/j. pocean.2006.10.001.
Henrichs S M, Reeburgh W S. 1987. Anaerobic mineralization of marine sediment organic matter: rates and the role of anaerobic processes in the oceanic carbon economy. Geomicrobiol J, 5(3-4): 191-237, doi:10.1080/01490458709385971.
Holland M M, Bitz C M. 2003. Polar amplification of climate change in coupled models. Clim Dyn, 21(3): 221-232, doi:10.1007/s00382- 003-0332-6.
Intergovernmental Panel on Climate Change (IPCC). 2007. Climate change 2007–the physical science basis: Working Group I contribution to the fourth assessment report of the IPCC. Cambridge: Cambridge University Press.
Ivanov M V, Pimenov N V, Rusanov I I, et al. 2002. Microbial processes of the methane cycle at the north-western shelf of the black sea. Estuar Coast Shelf Sci, 54(3): 589-599, doi:10.1006/ecss.2000.0667.
Knies J, Damm E, Gutt J, et al. 2004. Near-surface hydrocarbon anomalies in shelf sediments off Spitsbergen: evidences for past seepages. Geochem Geophys Geosyst, 5(6): 135112194, doi:10.1029/2003gc 000687.
Kudo K, Toyoda S, Yamada K, et al. 2022. Source analysis of dissolved methane in Chukchi Sea and Bering Strait during summer–autumn of 2012 and 2013. Mar Chem, 243: 104119, doi:10.1016/j.marchem. 2022.104119.
Kudo K, Yamada K, Toyoda S, et al. 2018. Spatial distribution of dissolved methane and its source in the western Arctic Ocean. J Oceanogr, 74(3): 305-317, doi:10.1007/s10872-017-0460-y.
Kvenvolden K A, Lilley M D, Lorenson T D, et al. 1993. The Beaufort Sea continental shelf as a seasonal source of atmospheric methane. Geophys Res Lett, 20(22): 2459-2462, doi:10.1029/93gl02727.
Kvenvolden K A, Rogers B W. 2005. Gaia’s breath—global methane exhalations. Mar Petroleum Geol, 22(4): 579-590, doi:10.1016/j. marpetgeo.2004.08.004.
Lammers S, Suess E, Hovland M. 1995. A large methane plume east of Bear Island (Barents Sea): implications for the marine methane cycle. Geol Rundsch, 84(1): 59-66, doi:10.1007/BF00192242.
Lapham L, Marshall K, Magen C, et al. 2017. Dissolved methane concentrations in the water column and surface sediments of Hanna Shoal and Barrow Canyon, Northern Chukchi Sea. Deep Sea Res Part II Top Stud Oceanogr, 144: 92-103, doi:10.1016/j.dsr2.2017.01.004.
Lepore K, Moran S B, Grebmeier J M, et al. 2007. Seasonal and interannual changes in particulate organic carbon export and deposition in the Chukchi Sea. J Geophys Res, 112(C10): C10024, doi:10.1029/2006jc003555.
Li Y, Zhan L, Zhang J, et al. 2017. A significant methane source over the Chukchi Sea shelf and its sources. Cont Shelf Res, 148: 150-158, doi:10.1016/j.csr.2017.08.019.
Lupton J E, Delaney J R, Johnson H P, et al. 1985. Entrainment and vertical transport of deep-ocean water by buoyant hydrothermal plumes. Nature, 316(6029): 621-623, doi:10.1038/316621a0.
Matveeva T, Savvichev A, Semenova A, et al. 2015. Source, origin, and spatial distribution of shallow sediment methane in the Chukchi Sea. Oceanography, 28(3): 202-217, doi:10.5670/oceanog.2015.66.
Moran S B, Kelly R P, Hagstrom K, et al. 2005. Seasonal changes in POC export flux in the Chukchi Sea and implications for water column-benthic coupling in Arctic shelves. Deep Sea Res Part II Top Stud Oceanogr, 52(24-26): 3427-3451, doi:10.1016/j.dsr2.2005. 09.011.
Nishino S, Kikuchi T, Fujiwara A, et al. 2016. Water mass characteristics and their temporal changes in a biological hotspot in the southern Chukchi Sea. Biogeosciences, 13(8): 2563-2578, doi:10.5194/bg-13- 2563-2016.
Reeburgh W S. 2007. Oceanic methane biogeochemistry. Chem Rev, 107(2): 486-513, doi:10.1021/cr050362v.
Ruppel C. 2015. Permafrost-associated gas hydrate: Is it really approximately 1% of the global system? J Chem Eng Data, 60(2): 429-436, doi:10.1021/je500770m.
Savvichev A S, Rusanov I I, Iusupov S K, et al. 2004. The biogeochemical cycle of methane in the coastal zone and littoral of the Kandalaksha Bay of the White Sea. Mikrobiologiia, 73(4): 540-552.
Savvichev A S, Rusanov I I, Pimenov N V, et al. 2007. Microbial processes of the carbon and sulfur cycles in the Chukchi Sea. Microbiology, 76(5): 603-613, doi:10.1134/s0026261707050141.
Shakhova N, Semiletov I. 2007. Methane release and coastal environment in the East Siberian Arctic shelf. J Mar Syst, 66(1-4): 227-243, doi:10.1016/j.jmarsys.2006.06.006.
Shakhova N, Semiletov I, Salyuk A, et al. 2010. Extensive methane venting to the atmosphere from sediments of the East Siberian Arctic Shelf. Science, 327(5970): 1246-1250, doi:10.1126/science.1182221.
Spall M A. 2007. Circulation and water mass transformation in a model of the Chukchi Sea. J Geophys Res, 112(C5): C05025, doi:10.1029/ 2005jc003364.
Steinbach J, Holmstrand H, Shcherbakova K, et al. 2021. Source apportionment of methane escaping the subsea permafrost system in the outer Eurasian Arctic Shelf. Proc Natl Acad Sci, 118(10): e2019672118, doi:10.1073/pnas.2019672118.
Walsh J J, McRoy C P, Coachman L K, et al. 1989. Carbon and nitrogen cycling within the Bering/Chukchi Seas: source regions for organic matter effecting AOU demands of the Arctic Ocean. Prog Oceanogr, 22(4): 277-359, doi:10.1016/0079-6611(89)90006-2.
Weber T, Wiseman N A, Kock A. 2019. Global ocean methane emissions dominated by shallow coastal waters. Nat Commun, 10: 4584, doi:10.1038/s41467-019-12541-7.
Weingartner T, Aagaard K, Woodgate R, et al. 2005. Circulation on the north central Chukchi Sea shelf. Deep Sea Res Part II Top Stud Oceanogr, 52(24-26): 3150-3174, doi:10.1016/j.dsr2.2005.10.015.
Weingartner T J, Cavalieri D J, Aagaard K, et al. 1998. Circulation, dense water formation, and outflow on the northeast Chukchi Shelf. J Geophys Res, 103(C4): 7647-7661, doi:10.1029/98jc00374.
Westbrook G K, Thatcher K E, Rohling E J, et al. 2009. Escape of methane gas from the seabed along the West Spitsbergen continental margin. Geophys Res Lett, 36(15): L15608, doi:10.1029/2009gl039191.
Whiticar M J, Faber E. 1986. Methane oxidation in sediment and water column environments—isotope evidence. Org Geochem, 10(4-6): 759-768, doi:10.1016/S0146-6380(86)80013-4.
Wiesenburg D A, Guinasso N L. 1979. Equilibrium solubilities of methane, carbon monoxide, and hydrogen in water and sea water. J Chem Eng Data, 24(4): 356-360, doi:10.1021/je60083a006.
Winkelmann D, Knies J. 2005. Recent distribution and accumulation of organic carbon on the continental margin west off Spitsbergen. Geochem Geophys Geosyst, 6(9): 117-134, doi:10.1029/2005 gc000916.
Woodgate R A, Aagaard K, Weingartner T J. 2005. A year in the physical oceanography of the Chukchi Sea: moored measurements from autumn 1990–1991. Deep Sea Res Part II Top Stud Oceanogr, 52(24-26): 3116-3149, doi:10.1016/j.dsr2.2005.10.016.
10.13679/j.advps.2022.0095
1 July 2022;
7 September 2022;
30 September 2022
: Li Y H, Zhang J X, Ye W W, et al. Concentration maxima of methane in the bottom waters over the Chukchi Sea shelf: implication of its biogenic source. Adv Polar Sci, 2022, 33(3): 235-243,doi:10.13679/j.advps.2022.0095
, ORCID: 0000-0002-1380-453X, E-mail: zhanliyang@tio.org.cn
 Advances in Polar Science2022年3期
- Advances in Polar Science的其它文章
- Evaluation of Arctic sea ice simulation of CMIP6 models from China
- Meteorological and sea ice anomalies in the western Arctic Ocean during the 2018–2019 ice season: a Lagrangian study
- Population size and distribution of seabirds in the Cosmonaut Sea, Southern Ocean
- Dissolved nutrient distributions in the Antarctic Cosmonaut Sea in austral summer 2021
- Variability of size-fractionated chlorophyll a in the high-latitude Arctic Ocean in summer 2020
- Spatial variability of δ18O and δ2H in North Pacific and Arctic Oceans surface seawater