
Variability of size-fractionated chlorophyll a in the high-latitude Arctic Ocean in summer 2020
2022-10-18 12:59CAITingHAOQiangBAIYouchengLANMushengHEJianfengCHENJianfang
Advances in Polar Science 2022年3期
CAI Ting, HAO Qiang*, BAI Youcheng, LAN Musheng, HE Jianfeng & CHEN Jianfang
Variability of size-fractionated chlorophyllin the high-latitude Arctic Ocean in summer 2020
CAI Ting1,2, HAO Qiang1,2*, BAI Youcheng1,2, LAN Musheng3, HE Jianfeng3& CHEN Jianfang1,2
1Key Laboratory of Marine Ecosystem Dynamics, Ministry of Natural Resources, Hangzhou 310012, China;2Second Institute of Oceanography, Ministry of Natural Resources, Hangzhou 310012, China;3Key Laboratory of Polar Science, MNR, Polar Research Institute of China, Shanghai 200136, China
The size structure of phytoplankton has considerable effects on the energy flow and nutrient cycling in the marine ecosystem, and thus is important to marine food web and biological pump. However, its dynamics in the high-latitude Arctic Ocean, particularly ice-covered areas, remain poorly understood. We investigated size-fractionated chlorophyll(Chl) and related environmental parameters in the highly ice-covered Arctic Ocean during the summer of 2020, and analyzed the relationship between Chldistribution and water mass through cluster analysis. Results showed that inorganic nutrients were typically depleted in the upper layer of the Canada Basin region, and that phytoplankton biomass was extremely low (mean= 0.05 ± 0.18 mg·m−3) in the near-surface layer (upper 25 m). More than 80% of Chlvalues were <0.1 mg·m−3in the water column (0–200 m), but high values appeared at the ice edge or in corresponding ice areas on the shelf. Additionally, the mean contribution of both nanoplankton (2–20 μm) (41%) and picoplankton (<2 μm) (40%) was significantly higher than that of microplankton (20–200 μm) (19%). Notably, the typical subsurface chlorophyll maximum (0.1 mg·m−3) was found north of 80°N, where the concentration of sea ice reached approximately 100%. The Chlprofile results showed that the deep chlorophyll maximum of total-, micro-, nano-, and picoplankton was located at depth of 40, 39, 41, and 38 m, respectively, indicating that nutrients are the primary factor limiting phytoplankton growth in the ice-covered Arctic Ocean during summer. These phenomena suggest that, despite the previous literatures pointing to significant light limitation under the Arctic ice, the primary limiting factor for phytoplankton in summer is still nutrient.
phytoplankton, size-fractionated chlorophyll, sea ice, Arctic Ocean
1 Introduction
Sea ice is one of the most important environmental features of the Arctic Ocean ecosystem. In summer, the ice-covered area of the Arctic Ocean is approximately 8×10⁶km2, accounting for nearly 60% of the total area. In winter, the Arctic Ocean is completely covered by sea ice, except for a few polynyas (Wang et al., 2005). The melting of sea ice produces approximately 40% of the surface meltwater in the Arctic Ocean (Eicken, 2002). Reduction of sea ice increases the surface water temperature of the Arctic Ocean, which could enhance both the availability of light and the growth rates of phytoplankton (Steele et al., 2008; Perovich and Richter-Menge, 2009). Light has generally been considered the primary limiting factor of phytoplankton growth in the high-latitude Arctic Ocean (Soltwedel et al., 2005, 2016; Wassmann and Reigstad, 2011). However, the melting of sea ice also enhances stratification and results in weaker mixing, which reduce the renewal of nutrients to the euphotic zone, further limiting primary productivity. The seasonal retreat and thinning of sea ice inhibit phytoplankton blooms by regulating the stratification and light conditions of the water column (Mundy et al., 2005; Leu et al., 2011). The cell abundances and species of sea ice diatoms decrease, whereas the dominance of green algae increases in the ice-covered area and at the ice–water interface (Macklin et al., 2002). The phytoplankton biomass in the Arctic Ocean has become higher than that on the shelves (Arrigo and van Dijken, 2015), accompanied by a shift in bloom dynamics (Ji et al., 2013). Ultimately, sea ice retreat in the Arctic Ocean is essential for the timing, quality, and quantity of primary production, which influences the standing stock of zooplankton and consequently the food web (Hunt et al., 2002, 2011).
The size structure of phytoplankton is controlled by complex interactions among the marine physical mixing conditions, light environment, and nutrient concentrations (Li et al., 2009; Wassmann and Reigstad, 2011). According to cell volume, phytoplankton is usually classified into microplankton (>20 µm), nanoplankton (2–20 µm), and picoplankton (<2 µm) (Beardall et al., 2009). Of the three forms, microplankton is the more morphologically plastic and has a lower cell surface to volume ratio; however, picoplankton is dominant in marine planktonic ecosystems (Li et al., 2009), and it affects both energy flow and nutrient cycling in the Arctic Ocean (Mills et al., 2018). Small cells are mainly distributed in the oligotrophic and stratified ocean waters (Eppley and Peterson, 1979; Falkowski and Woodhead, 1992; Li et al., 2009). Variations in the size structure of the phytoplankton community and the species composition are essential for the migration of organic carbon to sediments because larger cells have a greater sinking rate and contribute to a highly efficient biological pump (Finkel et al., 2009). Therefore, it is important to understand the changes in phytoplankton community structure during the melting of sea ice (Sigman and Boyle, 2000).
Owing to the influence of topography and sea ice, there are fewdata on chlorophyll(Chl) concentration in the high-latitude Arctic Ocean. Numerous earlier studies showed that the Chlconcentration exceeds 0.5 mg·m−3in the high-latitude Arctic Ocean (Cota et al., 1996; Coupel et al., 2015; Zhu et al., 2019; Kim et al., 2020). However, Lee and Whitledge (2005) reported that under-ice Chlconcentration was only 0.02 ± 0.01 mg·m−3in the surface layer. Moreover, most observations of size-fractionated Chlin the Arctic Ocean were conducted in shelf areas (e.g., the Barents and Chukchi seas) (Carmack and Wassmann, 2006), while few measurements were relevant to the high-latitude area (Poulin et al., 2010; Wassmann and Reigstad, 2011). Therefore, we investigated size-fractionated Chland related environmental parameters in the high-latitude Arctic Ocean (74°N–82°N; 160°E– 150°W) during the summer 2020 to determine the main factors affecting the phytoplankton distribution.
2 Materials and methods
2.1 Study sites and sampling locations
In this study, we used a conductivity–temperature–depth profiler to obtain physical properties such as water temperature and salinity at 43 stations in the Arctic Ocean between July and August 2020 (Figure 1). Additionally, 1 L Niskin bottles were used to collect water samples from the surface to the depth of 200 m (seven different depths: 5, 30,50, 75, 100, 150, and 200 m) for size-fractionated Chland nutrient analyses. Sea ice concentration data were derived from the EUMETSAT OSI SAF product (https://osi-saf. eumetsat.int/products/sea-ice-products).
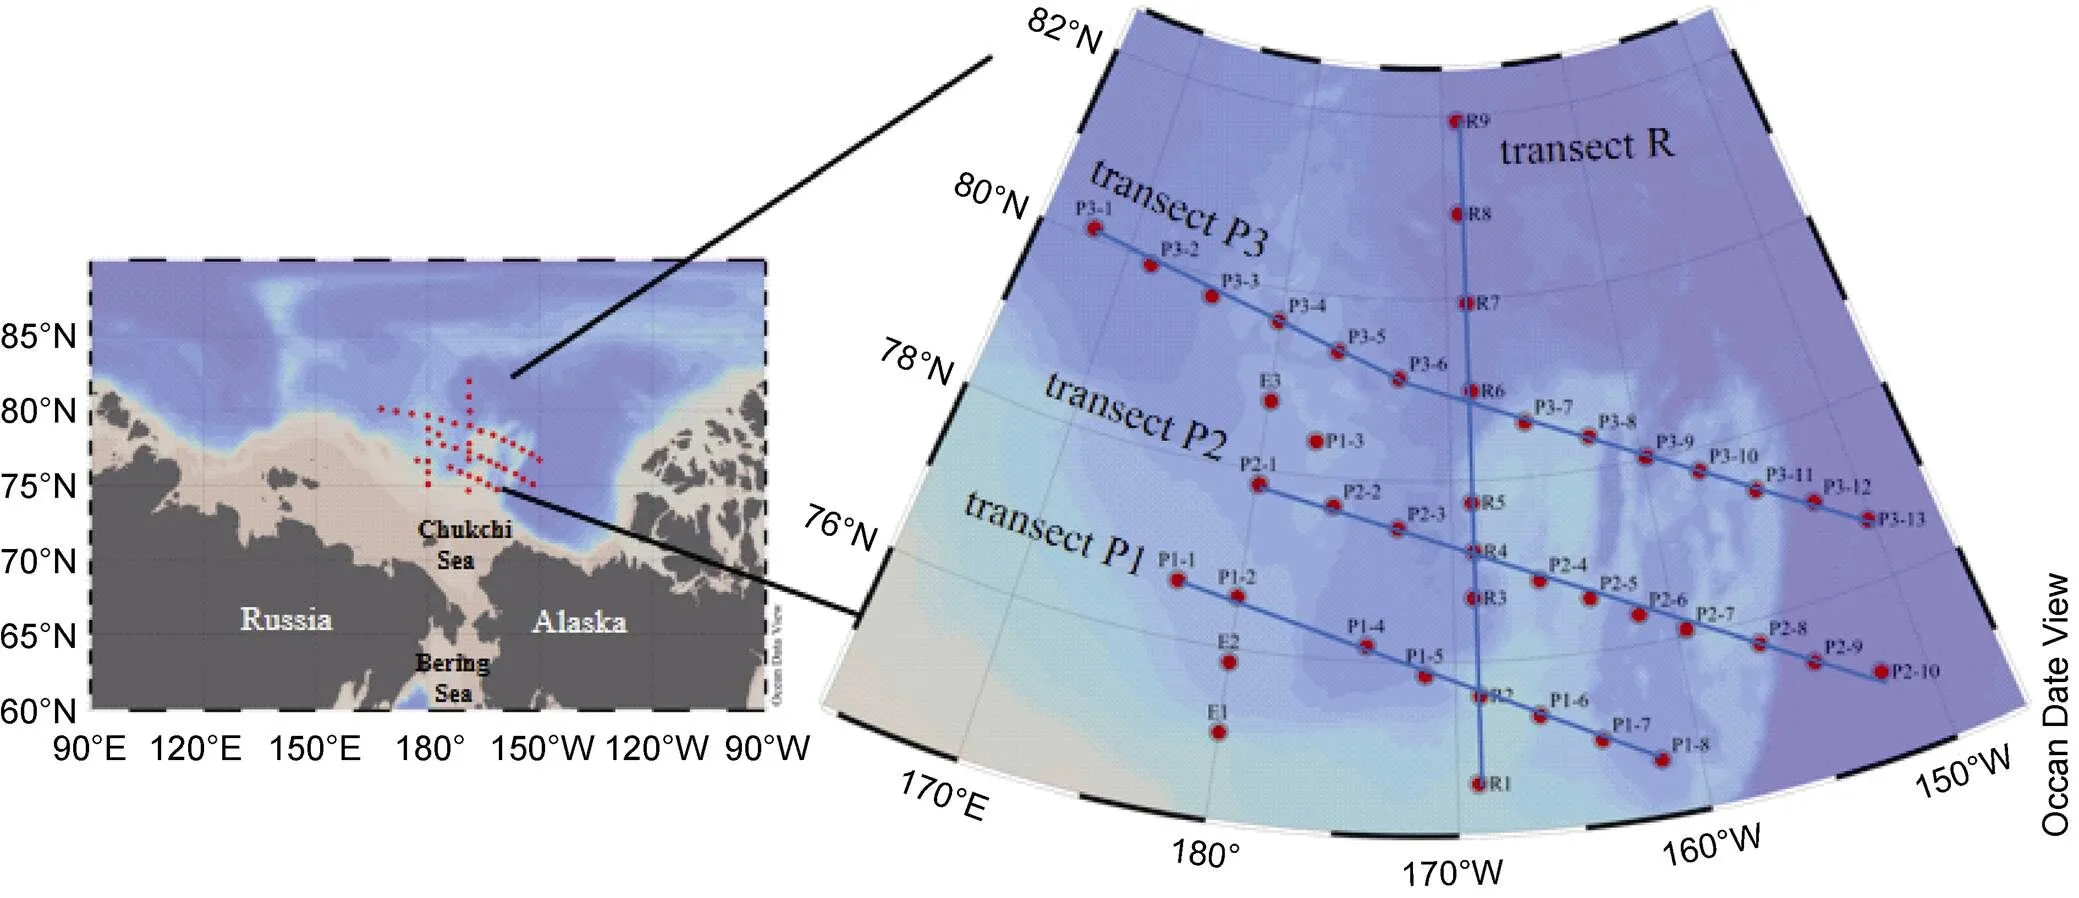
Figure 1 Location of the sampling stations (red dots) in the Arctic Ocean during summer 2020. Blue solid lines represent transects P1, P2, P3, and R.
2.2 Size-fractionated Chl a analysis
The phytoplankton biomass was size-fractionated into micro- (20–200 μm), nano- (2–20 μm), and picoplankton (0.7–2.0 μm). First, water samples were filtered through 200 μm Nitex filters to remove zooplankton. The water samples (0.5–1.0 L) for size-fractionated Chlanalysis were sequentially filtered through 20 and 2 μm Nucleopore filters (25 mm in diameter) and 0.7 μm Whatman GF/F filters (25 mm in diameter). All samples were extracted with 90% acetone at −20℃ for 24 h and measured using a fluorometer (10-AU; Turner Designs, San Jose, CA, USA), which was calibrated before the analysis was performed (Holm-Hansen et al., 1965; Welschmeyer, 1994).
2.3 Chl a profile fitting
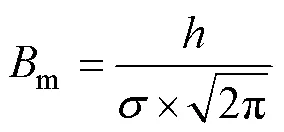
The Chlprofile fitting was parameterized using the equation originally given in Lewis et al. (1983) but later modified by Platt and Sathyendranath (1988):

whereis the normalized concentration of Chlat depth(mg·m−3),0is the background mixed-layer Chlconcentration (mg·m−3),is the integrated chlorophyll above0(mg·m−2),mis the depth of maximum chlorophyll (m), andis the standard deviation of the width of the Chlmaximum peak (m).mrepresents the maximum value of deep chlorophyll (mg·m−3).
2.4 Nutrient analyses
2.5 Data analysis
The vertical distribution of Chlwas drawn using Ocean Data View (4.6.7). Multidimensional scaling (MDS) and cluster analysis were performed using PRIMER 6.0 to reveal the spatial patterns in sized-fractionated Chl. The Pearson correlation coefficient at the confidence level of< 0.05 was determined using R software (version 3.6).
3 Results
3.1 Hydrographic conditions and sea ice concentration
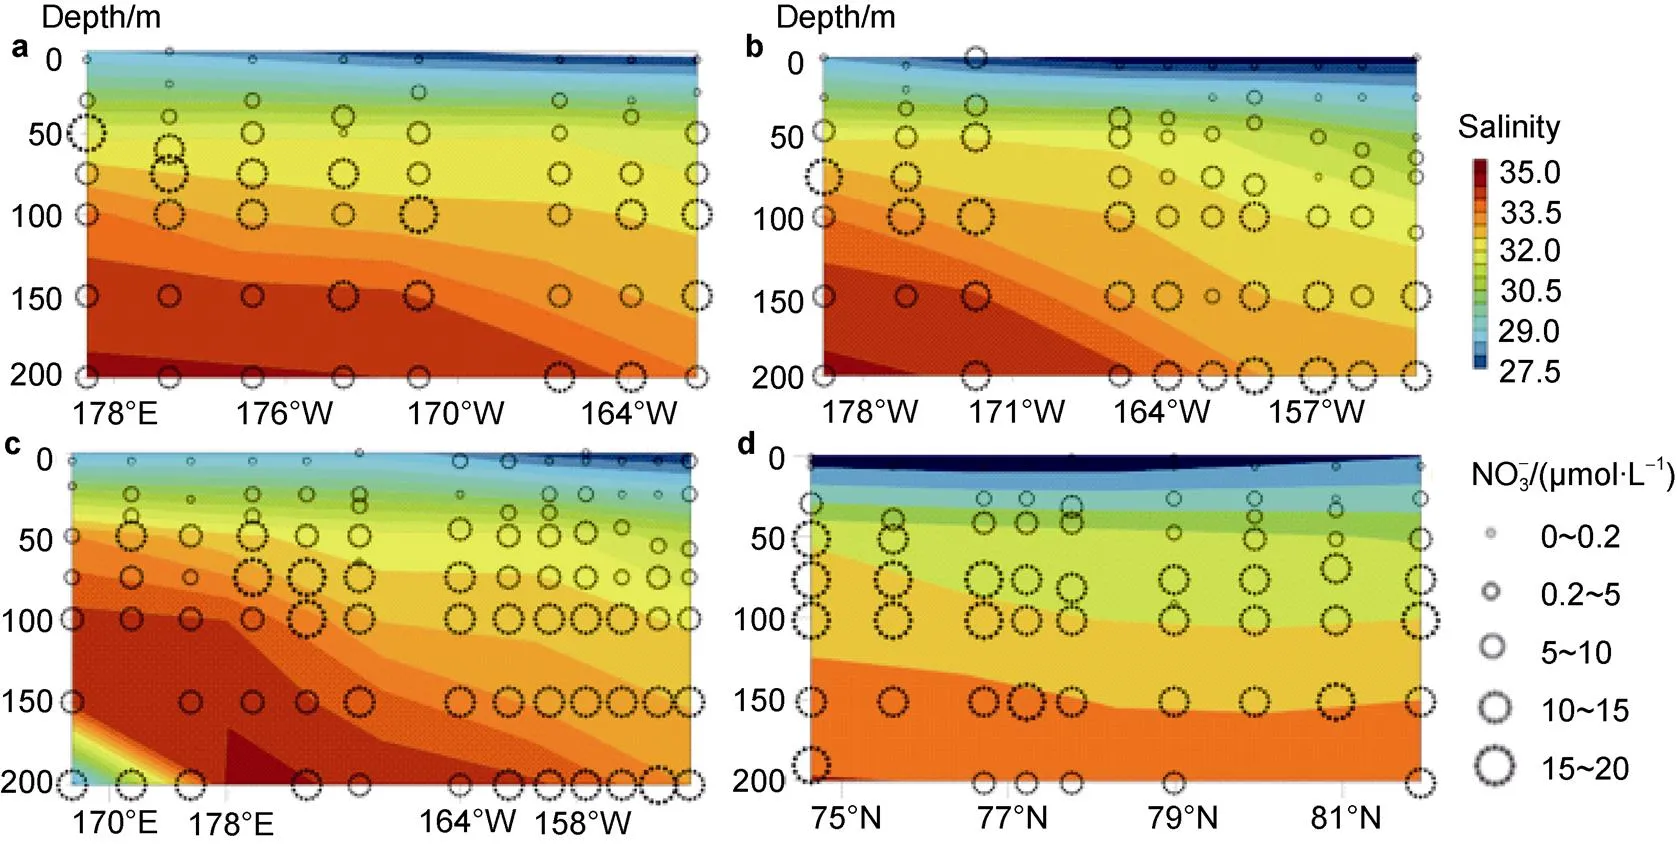
Water temperature and salinity from the surface to the depth of 200 m in the Arctic Ocean are shown in Figure 2. Water temperature ranged from −1.73℃ to 1.00℃ (mean= −1.02±0.52℃), and salinity ranged from 26.5 to 34.7 (mean=31.6±2.18). The temperature–salinity relationships indicated the presence of certain water masses in the upper water column. According to both Gong and Pickart (2015) and Mills et al. (2018), water mass properties reflected mainly off-shelf meltwater (potential temperature ()<−1℃ and salinity ()<31.5), Atlantic Water (>−1℃ and>33.6), and Chukchi Summer Water (−1℃<<3℃ and 30<<33.6) (Figure 2a).
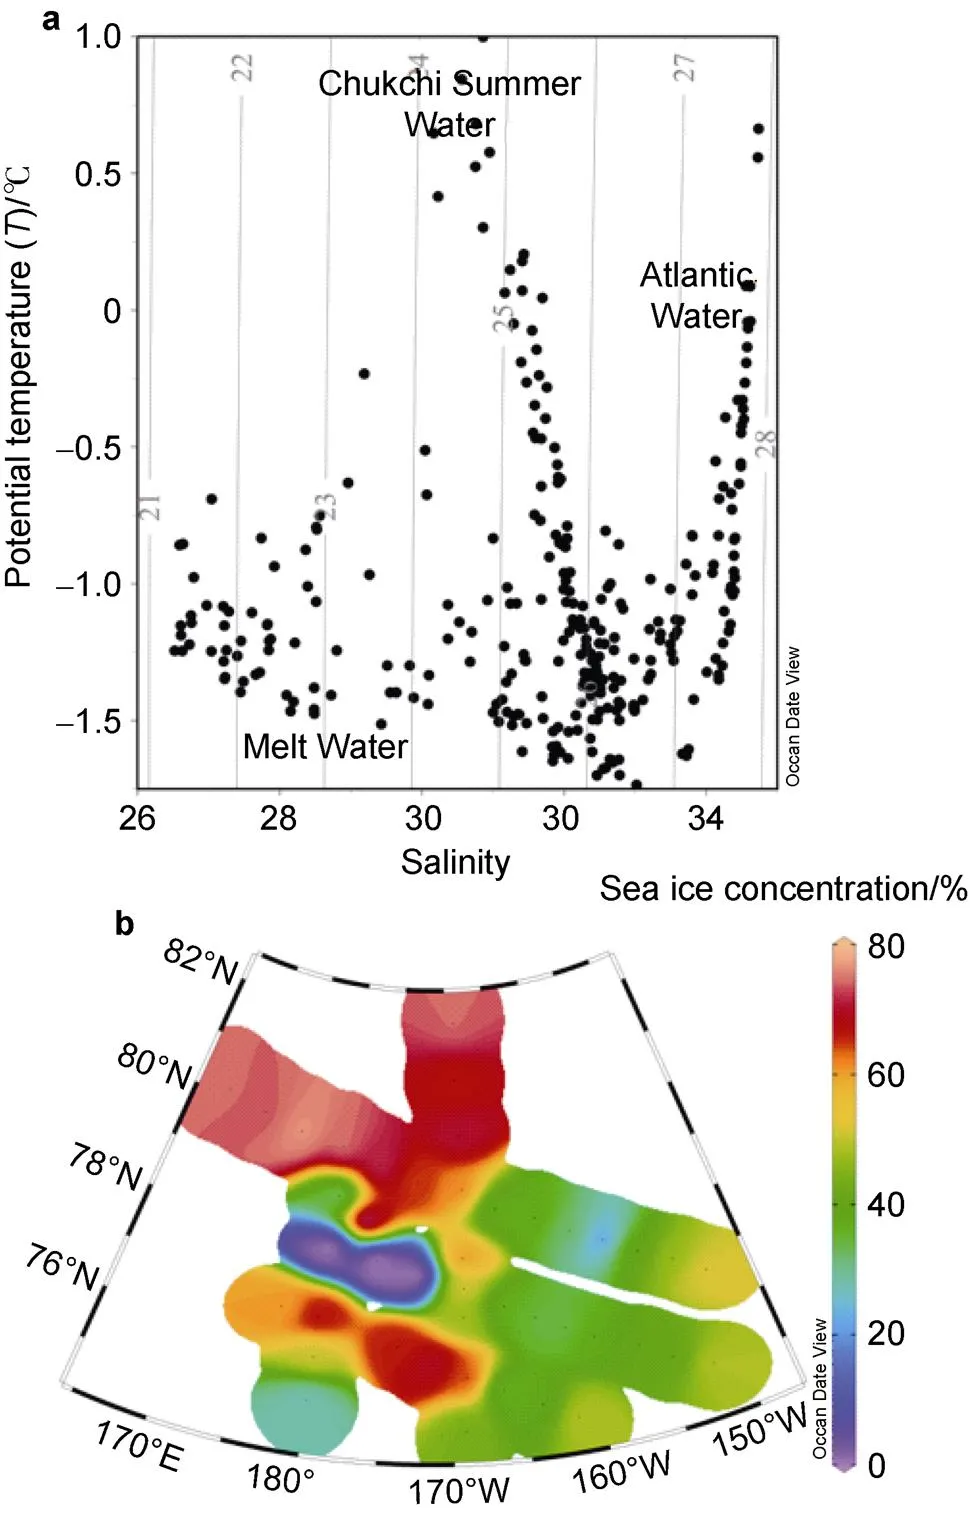
Figure 2 Temperature–salinity (-) relationship of seawater (a) and sea ice concentration (b) at each station.
The coverage of sea ice was relatively high because the investigation was conducted in the middle of the period of sea ice melting. The surface water temperature was −1.21±0.19℃ and the salinity was 27.6±0.78. The northern part of the basin, called the “heavy-ice basin”, is where sea ice concentration was >70% and the surface water temperature was <−1.4℃. The “marginal ice zone” in the east of the Canada Basin is associated with partial ice cover (20%–70%), and the surface water temperature was −1.0℃ and the salinity was <27.5. The Chukchi Borderland (P2-1, P2-2, and P2-3 stations), characterized by ice-free conditions (<20%), is designated the “ice-free basin” (Coupel et al., 2012).
3.2 Distribution of Chl a
The concentration of Chlvaried by two orders of magnitude throughout the study area, i.e., from 0.01– 2.68 mg·m−3(mean=0.05±0.18 mg·m−3). More than 80% of the Chlconcentration values in the water column (0–200 m) were <0.1 mg·m−3(Figure S1). The average surface Chlconcentration was 0.02±0.01 mg·m−3(Figure 3a). High values were found in the southern shelf zone and low values were found in the east of the Canada Basin. The subsurface chlorophyll maximum (SCM) was one order of magnitude higher than the surface Chlconcentration, with an average of 0.21 mg·m−3. In the water column, nearly 80% of the micro- and nano-Chlvalues were <0.01 mg·m−3, whereas nearly 40% of the pico-Chlvalues were >0.01 mg·m−3(Figure S1). The proportions of micro-, nano-, and picoplankton in the water column were 19%, 40%, and 41%, respectively (Figure S2b). However, the proportions of micro-, nano-, and picoplankton in the surface water were 17%, 28%, and 55%, respectively (Figure S2a). Micro-, nano-, and pico-Chlconcentrations in the surface water were >0.01 mg·m−3, and the distribution was more uniform in the southern shelf zone. However, the micro-Chlconcentration was extremely low in the east of the Canada Basin and at the stations north of 78°N, whereas the pico- Chlconcentration was >0.01 mg·m−3at stations north of 80°N.

Figure 3 Distributions of total- (a), micro- (b), nano- (c), and pico-Chlconcentrations (d) in the surface layer.
As shown in Figure 4, the average Chlconcentration was 6.60 ± 9.40 mg·m−2in the integrated water column (0–200 m). A high value (61.58 mg·m−2) occurred at station R2 on the southern shelf edge and a low value (2.00 mg·m−2) occurred at station P3-11 in the east of the Canada Basin. The percentage of microplankton in the water column was only 19%, while the percentage of nanoplankton and picoplankton was 41% and 40%, respectively (Figure S2b). Microplankton was overwhelmingly dominant at the southern shelf edge, whereas picoplankton was the main contributor in the east of the Canada Basin and the northern ice zone. Nanoplankton served as the main contributor only at station E2. The percentages of microplankton and nanoplankton were elevated in the subsurface layer. Although the Chlconcentration in the water column below 50 m was lower than that of the surface layer, the percentage of nanoplankton was 51%.
3.3 Distribution of size-fractionated Chl a at transects P1, P2, P3, and R
Figure 5 presents the vertical distributions of total-, micro-, nano-, and pico-Chlfrom the surface to the depth of 200 m at transects P1, P2, P3, and R. The total-Chlat stations P1-2 and P1-6 was 0.25 mg·m−3, and both were dominated by nanoplankton with a proportion of approximately 52% and 56%, respectively. Micro-Chlreached 0.1 mg·m−3at station P1-2, comprising 40% of the phytoplankton biomass. However, a high value of nano-Chloccurred at 60 m depth at station P1-2 and in the subsurface water at station P1-6. Picoplankton was the primary contributor at stations P1-7 and P1-8, comprising 64% and 79%, respectively.
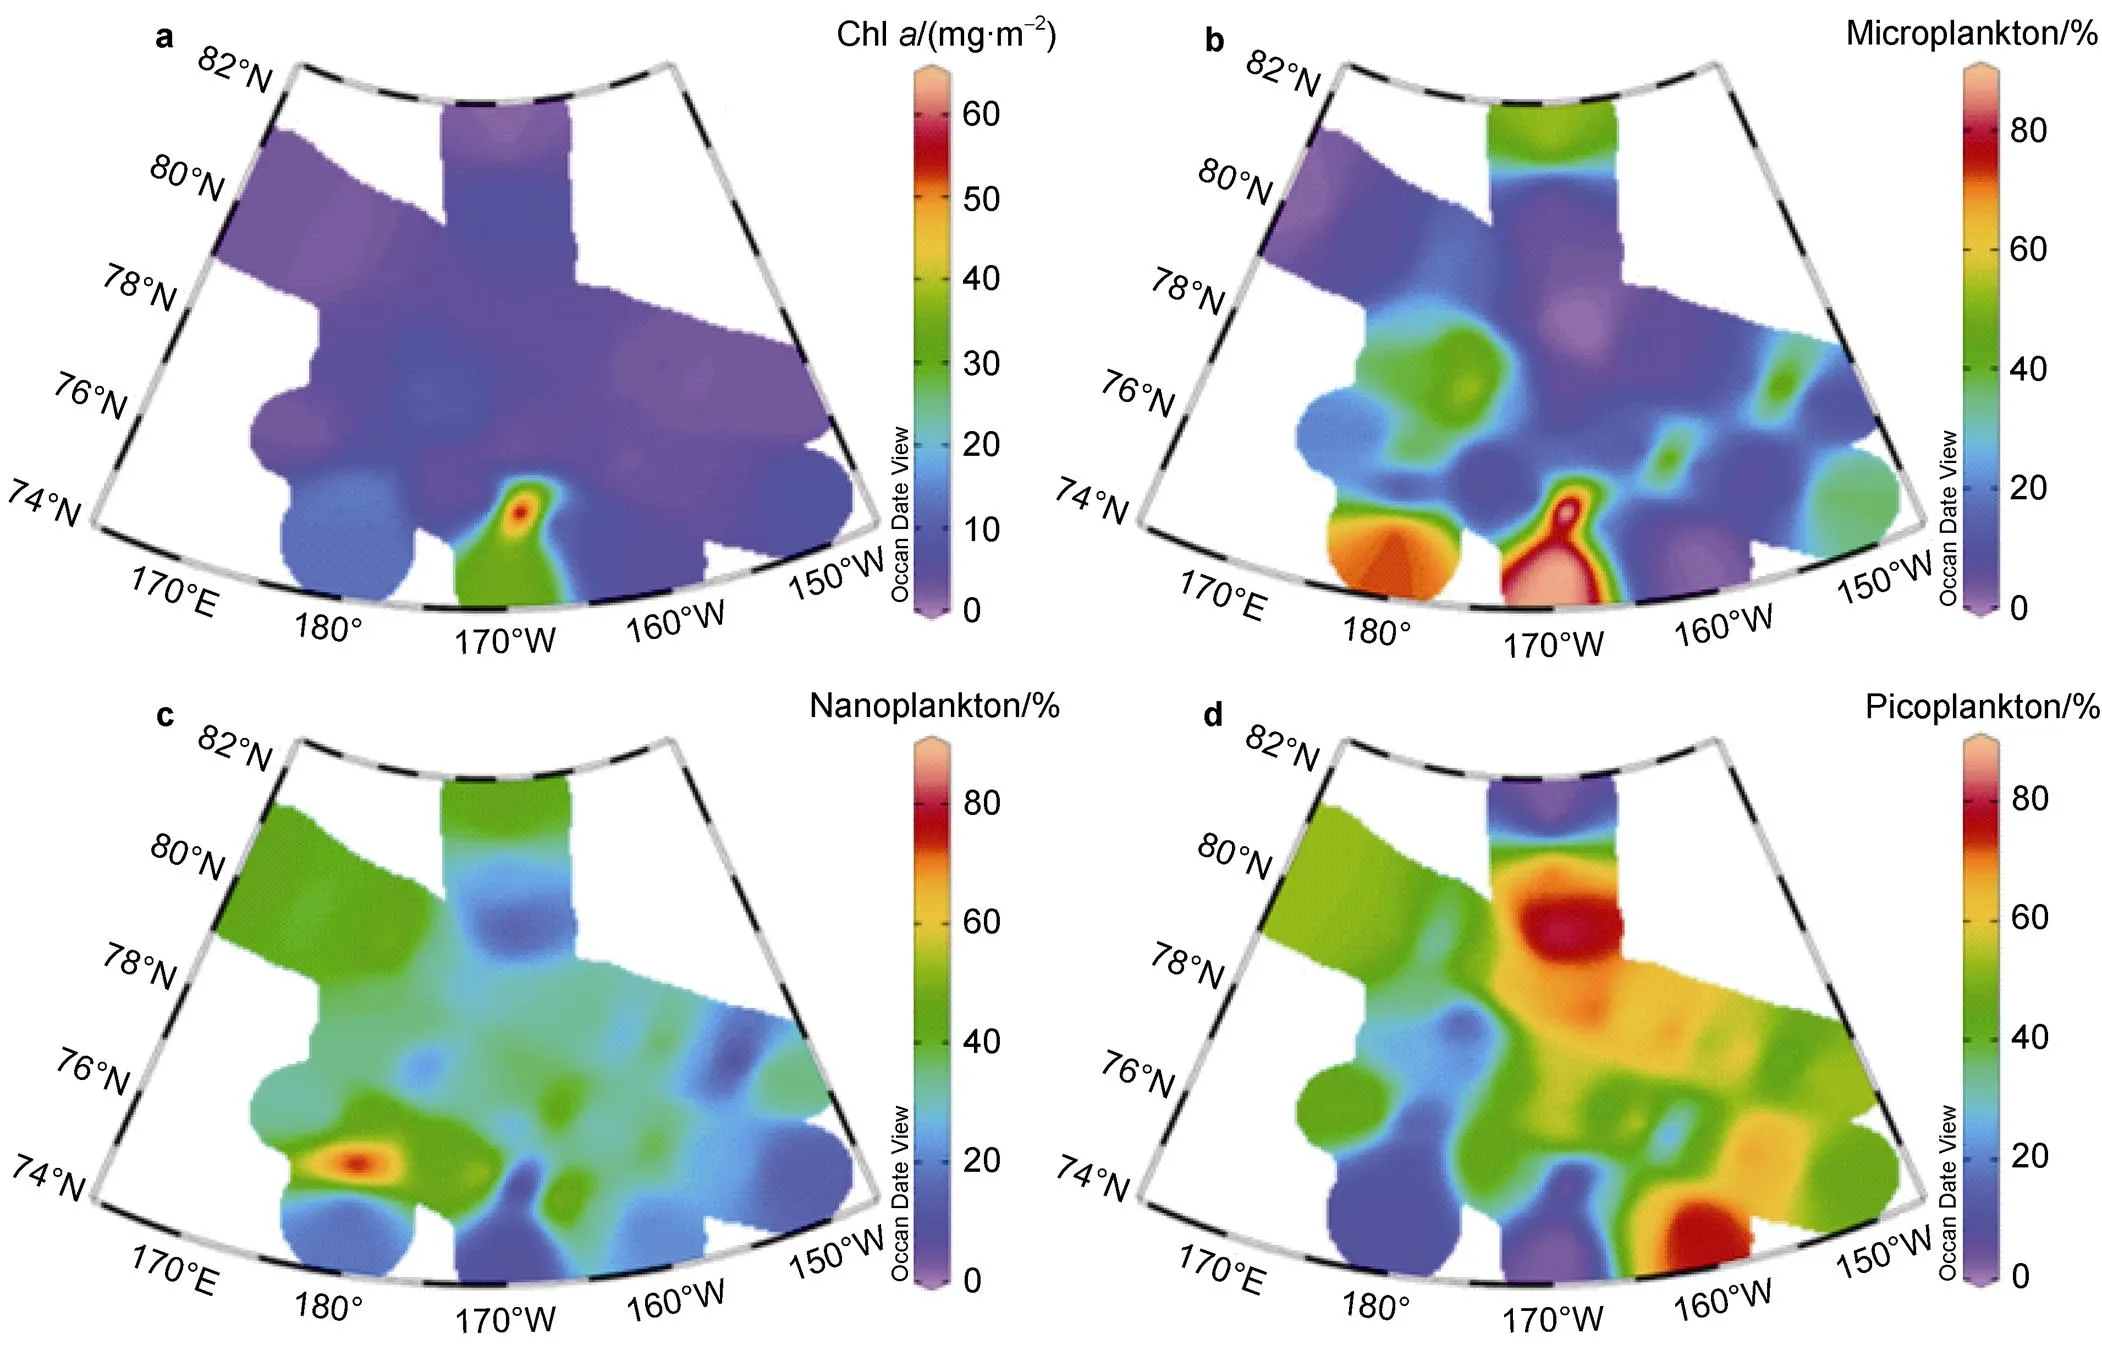
Figure 4 Total column-integrated Chlconcentration (0–200 m) at all stations (a), and the contributions of micro- (b), nano- (c), and pico-Chl(d) to the total-Chl(%) in the water column.
The vertical distribution of Chlalong transect P2 indicated that the SCM was usually distributed in the upper 50 m of the water column. A high value (0.47 mg·m−3) was observed at station P2-2, primarily attributable to microplankton that comprised 64%. A low value (0.03 mg·m−3) was observed at station P2-10 in the east of the Canada Basin, which was contributed only by picoplankton. Additionally, picoplankton comprised approximately 67% at station P2-9 in the east of the Canada Basin (Figures 5b, 5f, 5j, 5n).
The concentration of sea ice along transect P3 was usually >70% during the study period. There were no significant differences in the physicochemical properties of the water between stations. The vertical distribution of Chlwas relatively consistent from east to west. Extremely low values (<0.01 mg·m−3) appeared in the surface layer and reasonably high values (>0.05 mg·m−3) occurred in the subsurface layer. The highest Chlvalue (0.13 mg·m−3) was observed at stations P3-7 and P3-8, contributed primarily by picoplankton, which comprised 69% and 62%, respectively. However, the highest micro-Chlvalue (0.06 mg·m−3) was found only at station P3-12, located at 75-m depth. In contrast, micro-Chlwas <0.01 mg·m−3at other stations (Figures 5c, 5g, 5k, 5o).
The vertical distribution of Chlalong transect R (Figures 5d, 5h, 5l, 5p) showed that the concentration of Chldecreased significantly, and extended northward from the Chukchi Sea shelf. The SCM generally occurred in the water column at depths <25 m. Additionally, the Chlconcentration decreased rapidly with increasing water depth at locations south of 76°N. In contrast, the SCM (~2 mg·m−3) at stations R1 and R2 was two orders of magnitude higher than that at the surface. These high values were contributed primarily by microplankton, which comprised >80%. The proportion of microplankton in the water column decreased rapidly at high latitudes. The concentration of Chlwas 0.19 mg·m−3at stations R7 and R8, of which 95% and 74%, respectively, was contributed by picoplankton.
3.4 Chl a profile parameters
The profile parameters of Chlcan provide a detailed characterization of phytoplankton vertical distribution. In the fitted equations of Lewis et al. (1983),mrepresents the maximum value of the deep Chl,mis the depth of the maximum concentration of Chlin the water column, andis a parameter that indicates the peak width. Figure 6 shows the vertical distribution of total-, micro-, nano-, and pico-Chl, and the Gaussian curve fitting parametersm,m, andfor all stations. A high value of total-Chlof 0.06 mg·m−3was found at station E1, where the proportion of nanoplankton was relatively high (50%). The total concentration of Chlwas 0.04 mg·m−3in the ice-covered area north of 82°N (station R9), which comprised 50% picoplankton. High values of Chl(0.03 mg·m−3) were found on the Chukchi Plateau, whereas low values (<0.01 mg·m−3) were observed in the east of the Canada Basin and along transect R.
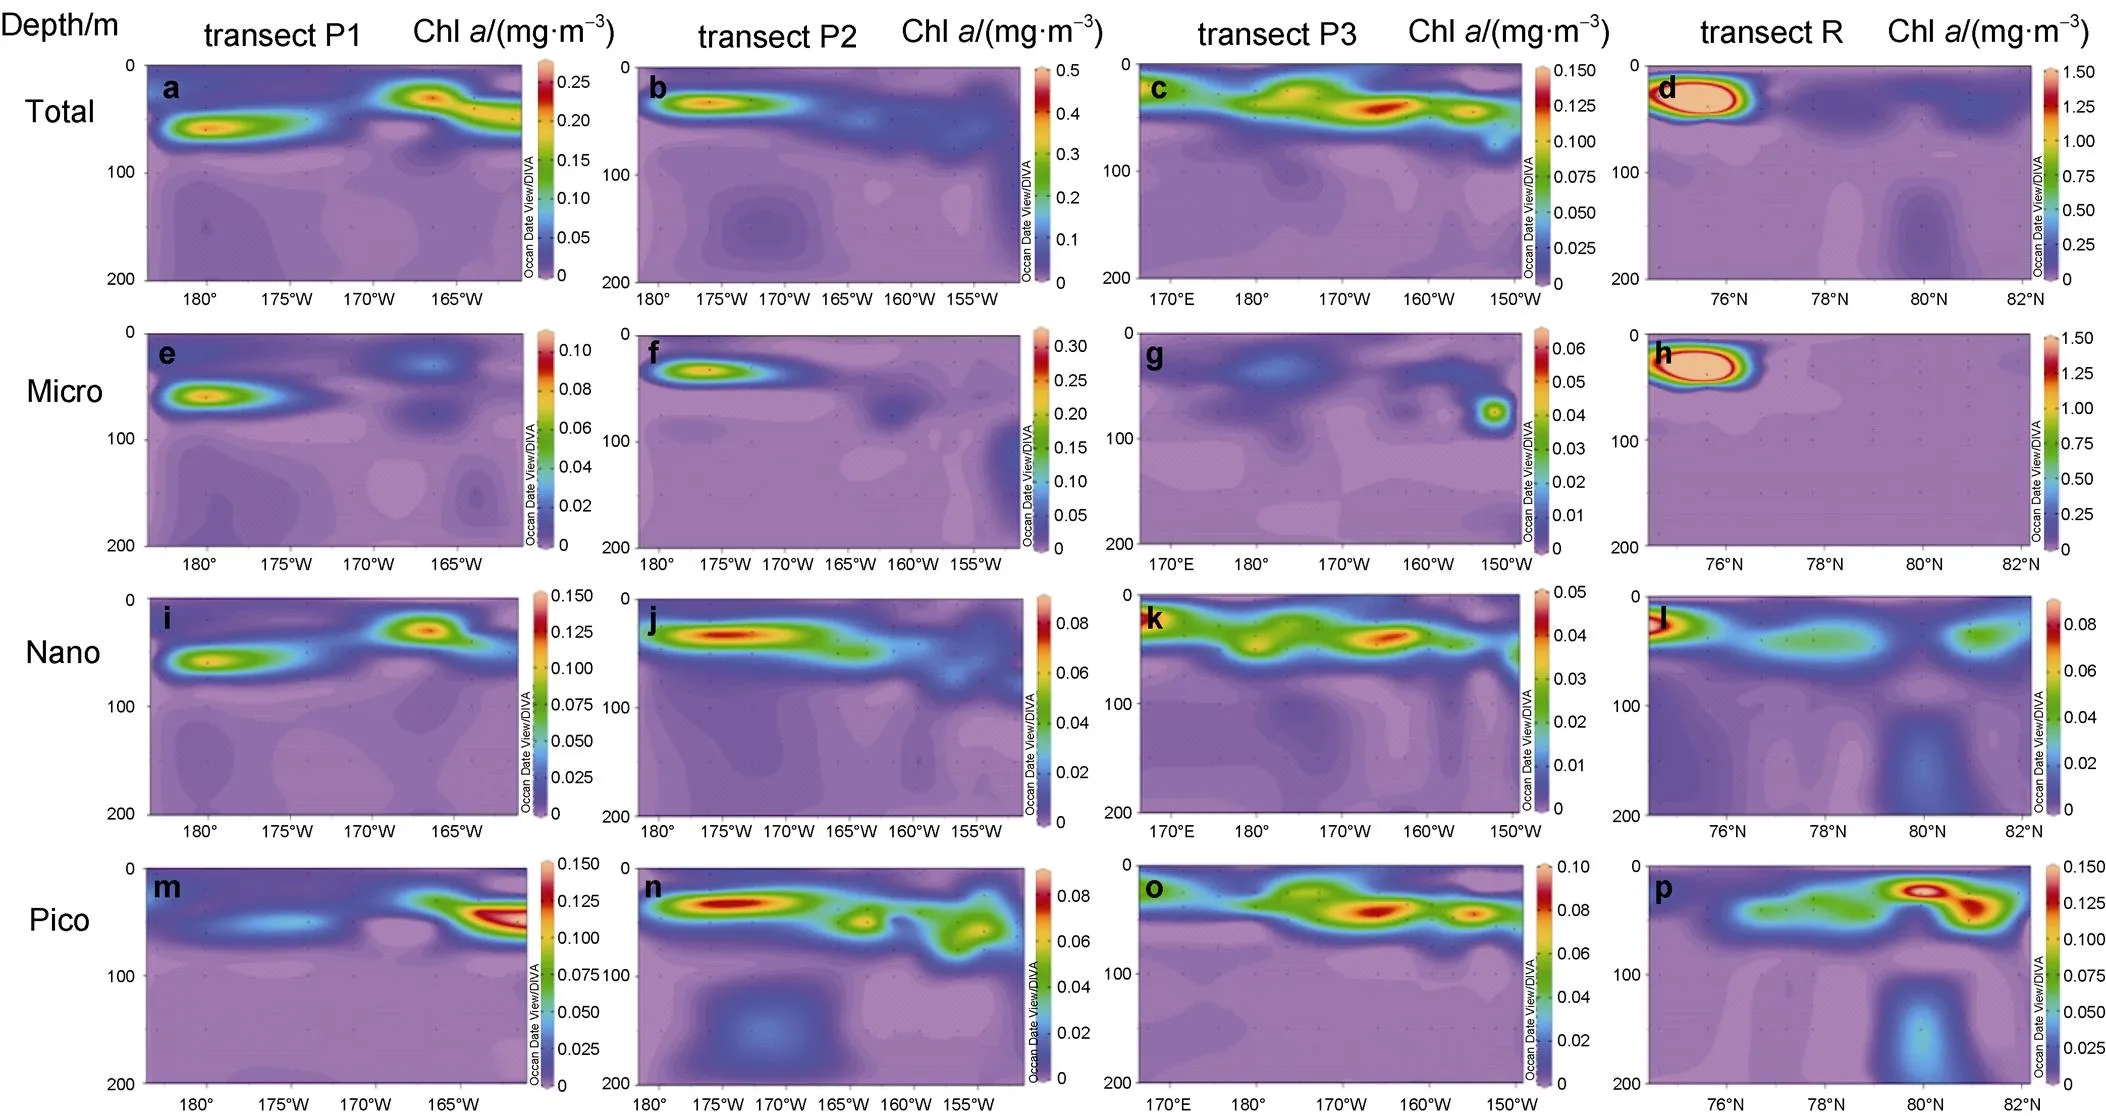
Figure 5 Vertical distributions of total-, micro-, nano-, and pico-Chlfrom the surface to the depth of 200 m at transect P1, P2, P3, and R. a–d, Total-Chldistribution along transect P1, transect P2, transect P3 and transect R, respectively; e–h, Micro-Chldistribution along transect P1, transect P2, transect P3 and transect R, respectively; i–l, Nano-Chldistribution along transect P1, transect P2, transect P3 and transect R, respectively; m–p, Pico-Chldistribution along transect P1, transect P2, transect P3 and transect R, respectively.
Figure 6 Vertical distributions of total-, micro-, nano-, and pico-Chlconcentrations and the Gaussian curve parametersm,m, and. a–d, Total-, micro-, nano-, and pico-Chlconcentrations, respectively; e–h, Total-, micro-, nano-, and pico-mvalues, respectively; i–l, Total-, micro-, nano-, and pico-mvalues, respectively; m–p, Total-, micro-, nano-, and pico-values, respectively.
Themvalues for total-, micro-, nano-, and picoplankton are presented in Figure 6e–6h, respectively. The total value ofmranged from 0.02–1.49 mg·m−3(mean= 0.19 mg·m−3). The highest value (1.49 mg·m−3) occurred at station E1 and consisted of Chl, while lower values (<0.15 mg·m–3) were found in the east of the Canada Basin and along transect R. The mean value of micro-mwas 0.13 mg·m−3, and the highest value (1.43 mg·m−3) was observed in the southern shelf area at station R1. Lower values occurred in the northern ice-covered area and on the eastern Chukchi Plateau. The nano-mvalues ranged from 0.01–0.61 mg·m−3(mean=0.07 mg·m−3). Low values occurred along transect P3, in the northern ice-covered area, and in the east of the Canada Basin, while high values were found in the southern shelf region. The average value of pico-mwas 0.07 mg·m−3, and high values appeared at stations P1-7 and P1-8. Overall, the mean value of micro-mwas significantly higher than that of either nano- or pico-m, andmwas higher in the southern shelf edge region.
The meanmvalues of total-, micro-, nano-, and picoplankton were 39.78, 39.10, 41.09, and 37.76 m, respectively (Figure 6i–6l), and they were found in shallow water (<50 m). High values were found in the east of the Canada Basin. The total-, micro-, nano-, and pico-mvalues were 27.21, 25.73, 27.12, and 27.87 m, respectively, in the high-latitude area covered with sea ice (station R9). The surface water was dominated by picoplankton, and high values were found in the high-latitude ice-covered area, along transect P3, and in the east of the Canada Basin.
The parameterindicates the peak width of Chl. Thevalues of total-, micro-, nano-, and picoplankton are shown in Figure 6m–6p, respectively. The meanvalues for total-, micro-, nano-, and picoplankton were 13.29, 12.41, 12.29, and 12.85 m, respectively. Relatively high values were present in the high-latitude ice-covered area, along transect P3, and in the east of the Canada Basin. However, nano-σ (<10 m) decreased significantly in the southern shelf area.
3.5 Sized-fractionated Chl a clustering analysis and MDS

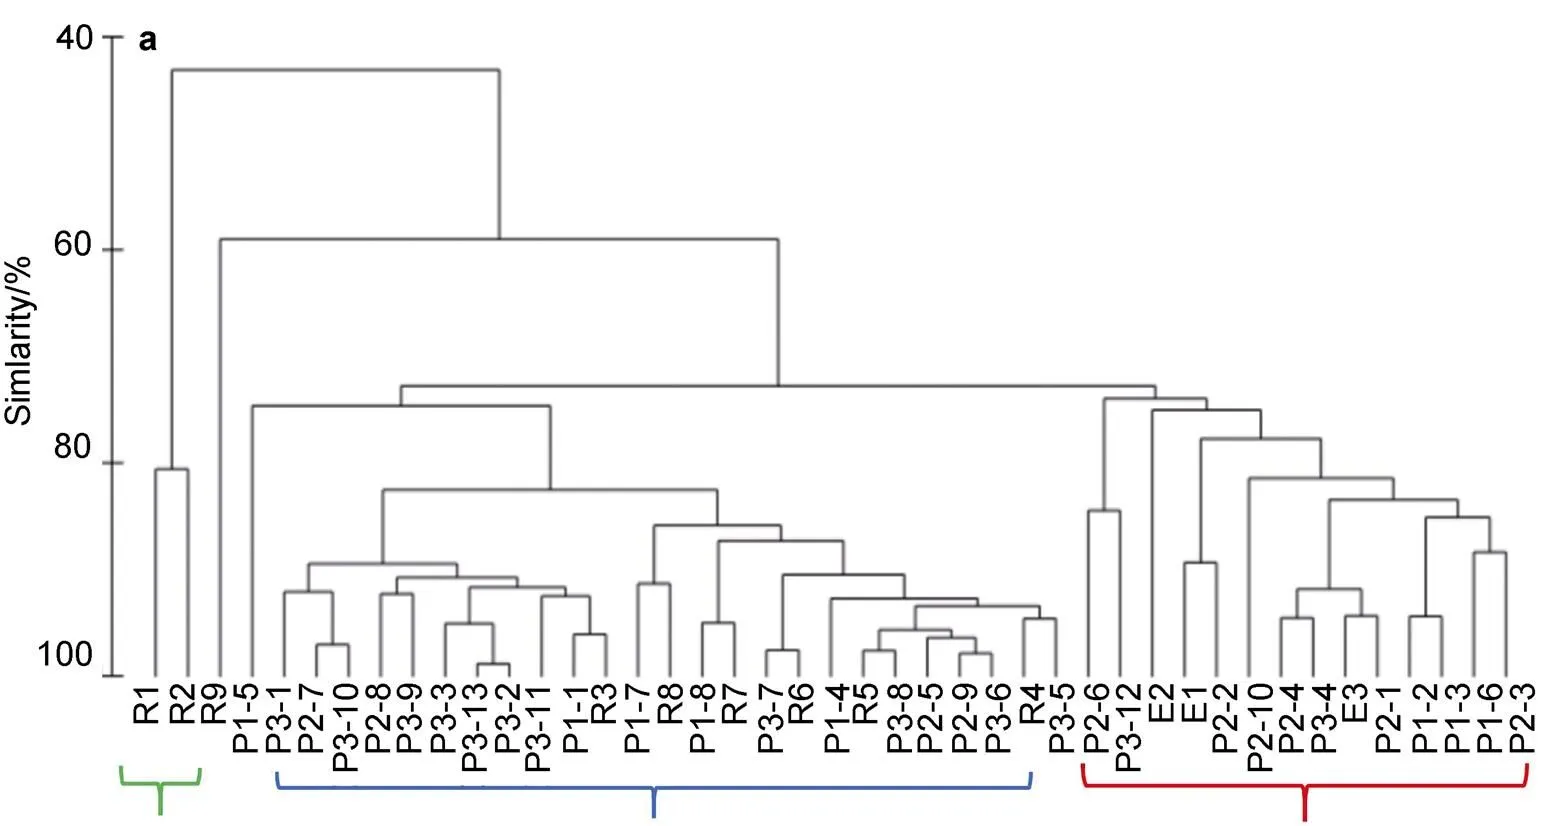
Figure 7 Cluster analysis (a) and MDS (b) of micro-, nano-, and picoplankton column-integrated chlorophyll (0–200 m) at all stations. Red indicates first assemblage, blue indicates second assemblage, and green indicates third assemblage.

Table 1 Concentration of size-fractionated Chl a (mean±SD) and environmental parameters of the different ecological assemblages in the water column
4 Discussion
4.1 Chl a dynamics
The distribution of Chlin the high-latitude Arctic Ocean is significantly influenced by topography and sea ice. Topography controls the circulation (Ryan et al., 2010), while sea ice primarily controls the light in the oligotrophic surface waters (Kwok and Rothrock, 2009). An extremely low phytoplankton biomass (mean=0.05± 0.18 mg·m−3) was found in this study, and more than 80% of Chlconcentration values were <0.1 mg·m−3. These findings are highly consistent with previous related studies, where the mean phytoplankton biomass in surface waters was only 0.04±0.02 mg·m−3in ice-free areas and even lower (0.02±0.01 mg·m−3) in ice-covered areas (Lee and Whitledge, 2005). However, numerous studies found that phytoplankton Chlconcentration exceeds 0.5 mg·m−3in the high-latitude Arctic Ocean (Table 2). Arrigo et al. (2014) found that the surface Chlconcentration reached 2.5 mg·m−3in the northern Chukchi Sea, because the phytoplankton had experienced a two-week ice-free period. In this study, fewer than 10% of the Chlconcentration values were >0.5 mg·m−3. The extremely low phytoplankton biomass could reflect the fact that the study cruise was conducted in the middle of the ice-melting period, when the concentration of sea ice was >70% at most stations.

4.2 Relationship between phytoplankton cluster and water mass
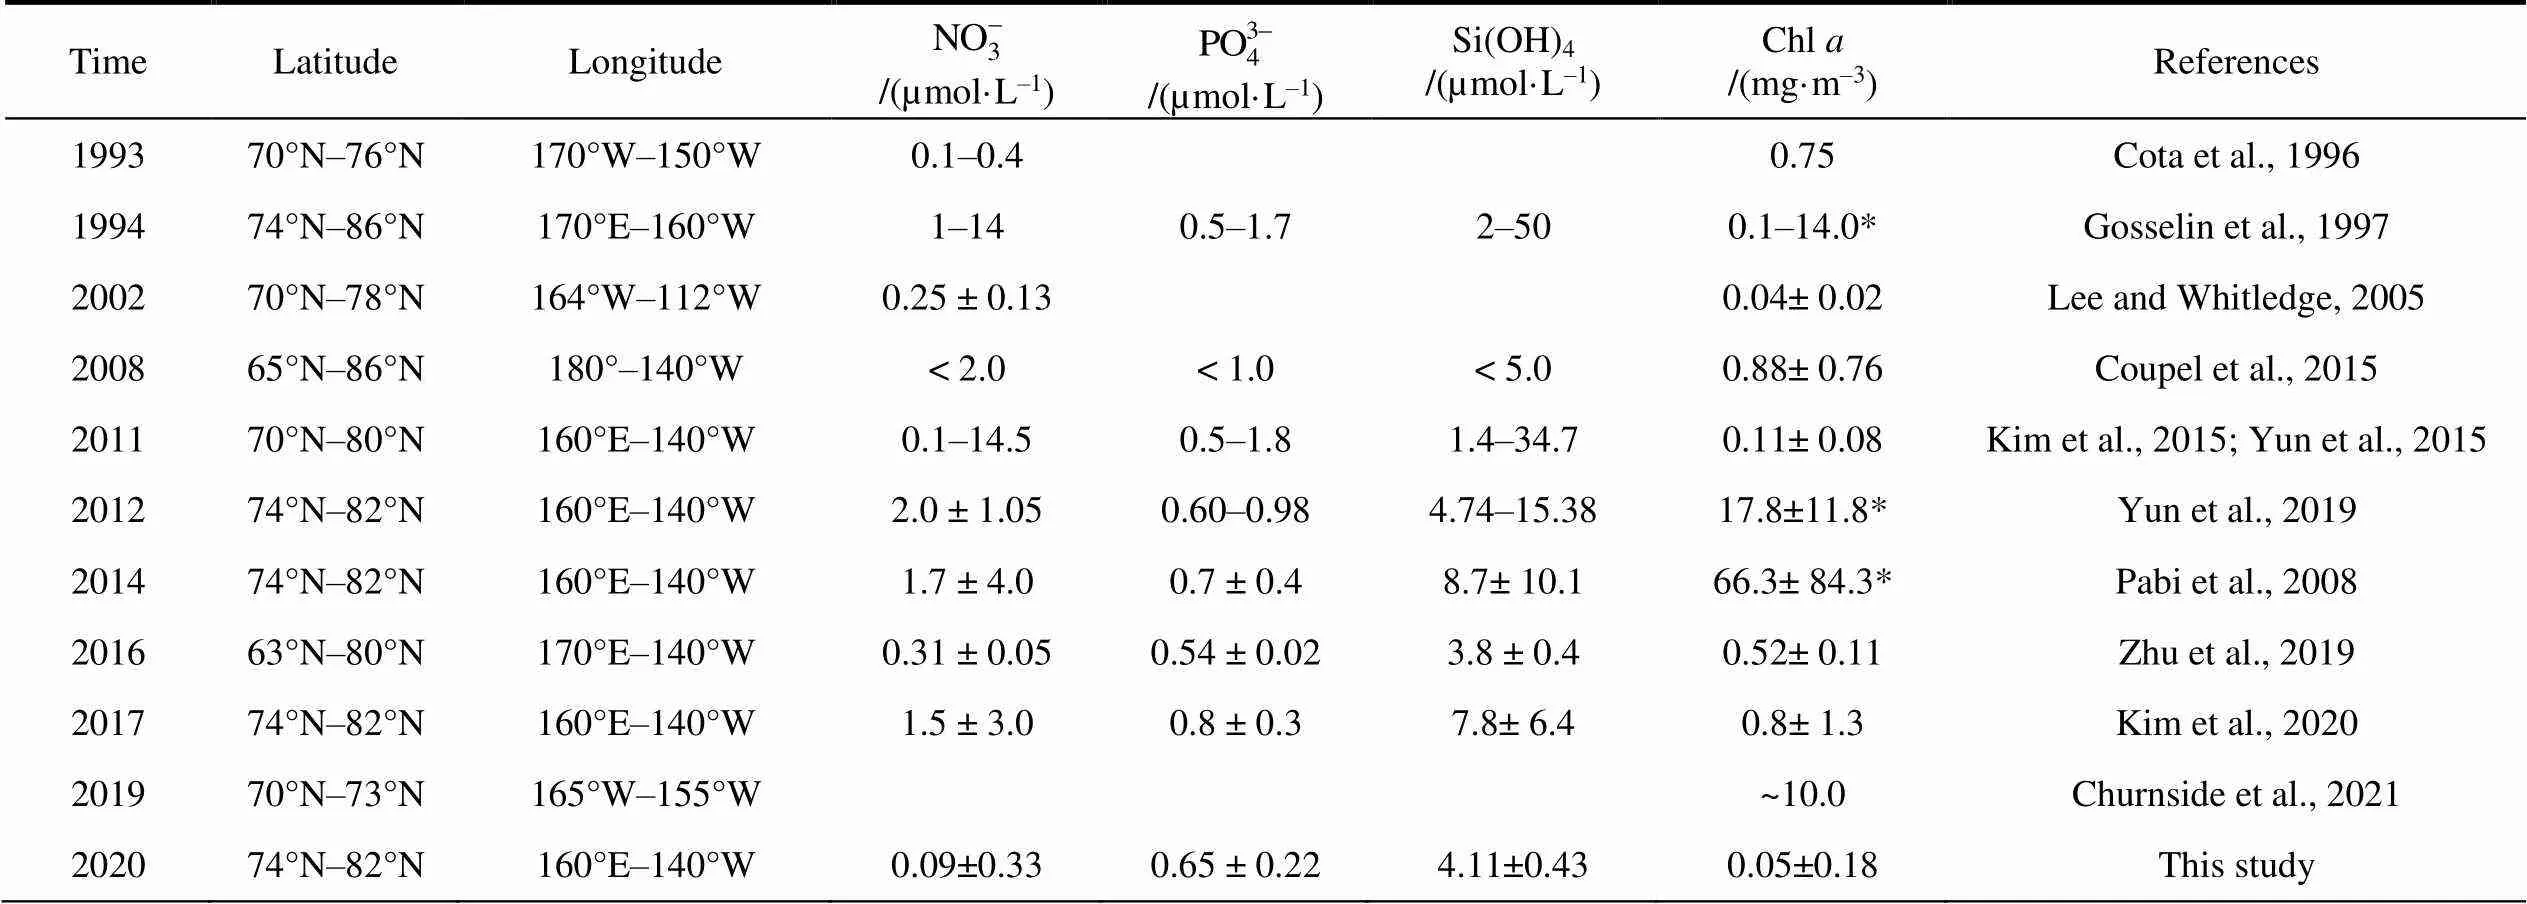
Table 2 Surface Chl a concentration in the high-latitude area of the Arctic Ocean


The coastal Cluster 3 was affected by Chukchi Summer Water (Gong and Pickart, 2015), where microplankton contributed more than 90% of total Chl. Coupel et al. (2012) found that large cells, such as diatoms and dinoflagellates, dominate in the Bering Strait and on the Chukchi shelf where the concentration of sea ice is extremely low. The value ofmwas significantly higher in the southern shelf area (station E1), but the correspondingmvalue was located at the depth of 30 m. One possible reason that could account for this phenomenon is the low sea ice concentration (27.6%) at station E1. Another reason could be the shallow water depth in the area and the ease of nutrient replenishment, which could provide opportunities for diatom blooms in specific and more stable water layers (Codispoti et al., 2013). Additionally, the availability of nutrients is often the primary factor that influences phytoplankton size structure (Marañón et al., 2015). We found that micro-m(0.13 mg·m−3) was significantly higher than nano- (0.07 mg·m−3) and pico-m(0.07 mg·m−3), possibly owing to the rapid settlement of microplankton (e.g., diatoms). When nutrients are depleted, microplankton is more likely to form deep chlorophyll maximum layers (Codispoti et al., 2013).
In summary, the contribution of both nano- (41%) and picoplankton (40%) in the water column was significantly higher than that of microplankton (19%), indicating significant miniaturization of the community structure (Figure S2). Due to decreasing in the nutrient supply and low availability of light, the surface phytoplankton biomass was relatively low and dominated primarily by picoplankton in the Arctic Ocean (McLaughlin and Carmack, 2010). These findings are highly consistent with numerous other studies that indicated that picoplankton could adapt more effectively to low-nutrient environments in ice-covered areas (Lovejoy et al., 2006, 2007; Li et al., 2009; Coupel et al., 2015; Mills et al., 2018). The averagemandvalues were 39.42 and 12.71 m, respectively, implying that the range of phytoplankton distribution was extremely limited. Possible reasons for the variability in the vertical distribution ofminclude differences in losses to predators, growth, and sinking or migration among the different phytoplankton groups (Cullen, 2015).
5 Conclusions
Our study showed that the phytoplankton biomass was extremely low in the high-latitude Arctic Ocean during the summer 2020. Relatively high Chlconcentrations were found in the eastern part of the Chukchi Plateau, where the sea ice concentration was <20% and the supplement of nutrients increased. Picoplankton dominated the phytoplankton community, indicating that the efficiency of the biological pump was substantially reduced, and that the carbon cycle was necessarily dominated by physical processes. The Chlprofile analysis showed that the vertical distribution ofmwas relatively stable, and that the sized-fractionatedmwas located at the depth of approximately 40 m. It implies that phytoplankton productivity was limited by nutrients rather than by light. According to the cluster analysis, the under-ice phytoplankton distribution was coupled with water masses because the mixing conditions cause nutrients distributions to vary. These results contribute to our understanding of the biogeochemical features of the high-latitude Arctic Ocean during the period of sea ice melting.
Q. H. designed this study. Y. B., M. L., J. H., and J. C. performed the experiments and analysis. T. C. wrote the manuscript and prepared the tables and figures. All authors edited the manuscript. All authors have read and agreed to the published version of the manuscript. T. C. and Q. H. contributed equally to this work and both should be considered co-first author.
The authors declare that the research was conducted in the absence of any commercial or financial relationships that could be construed as a potential conflict of interest.
We would like to thank the captain, officers, and crew of R/Vfor their admirable assistance during the onboard sampling and measurements conducted as part of the study. This research was supported by the National Key R&D Program of China (Grant no. 2019YFE0120900) and the National Natural Science Foundation of China (Grant nos. 41941013, 41976230, 41206181, and 41976229). We appreciate two anonymous reviewers, and Associate Editor Dr. Jana Kvíderová for their constructive comments that have further improved the manuscript.
Arrigo K R, Perovich D K, Pickart R S, et al. 2014. Phytoplankton blooms beneath the sea ice in the Chukchi Sea. Deep Sea Res Part II Top Stud Oceanogr, 105: 1-16, doi:10.1016/j.dsr2.2014.03.018.
Arrigo K R, van Dijken G L. 2004. Annual cycles of sea ice and phytoplankton in Cape Bathurst polynya, southeastern Beaufort Sea, Canadian Arctic. Geophys Res Lett, 31(8): L08304, doi:10.1029/2003 gl018978.
Arrigo K R, van Dijken G L. 2015. Continued increases in Arctic Ocean primary production. Prog Oceanogr, 136: 60-70, doi:10.1016/j.pocean. 2015.05.002.
Beardall J, Allen D, Bragg J, et al. 2009. Allometry and stoichiometry of unicellular, colonial and multicellular phytoplankton. New Phytol, 181(2): 295-309, doi:10.1111/j.1469-8137.2008.02660.x.
Carmack E, Wassmann P. 2006. Food webs and physical-biological coupling on pan-Arctic shelves: Unifying concepts and comprehensive perspectives. Prog Oceanogr, 71: 446-477, doi:10.1016/j.pocean.2006. 10.004.
Churnside J H, Marchbanks R D, Marshall N. 2021. Airborne lidar observations of a spring phytoplankton bloom in the western Arctic Ocean. Remote Sens, 13(13): 2512, doi:10.3390/rs13132512.
Codispoti L A, Kelly V, Thessen A, et al. 2013. Synthesis of primary production in the Arctic Ocean: III. Nitrate and phosphate based estimates of net community production. Prog Oceanogr, 110: 126-150, doi:10.1016/j.pocean.2012.11.006.
Cota G F, Pomeroy L R, Harrison W G, et al. 1996. Nutrients, primary production and microbial heterotrophy in the southeastern Chukchi Sea: Arctic summer nutrient depletion and heterotrophy. Mar Ecol Prog Ser, 135: 247-258, doi:10.3354/meps135247.
Coupel P, Jin H Y, Joo M, et al. 2012. Phytoplankton distribution in unusually low sea ice cover over the Pacific Arctic. Biogeosciences, 9(11): 4835-4850, doi:10.5194/bg-9-4835-2012.
Coupel P, Ruiz-Pino D, Sicre M A, et al. 2015. The impact of freshening on phytoplankton production in the Pacific Arctic Ocean. Prog Oceanogr, 131: 113-125, doi:10.1016/j.pocean.2014.12.003.
Cullen J J. 2015. Subsurface chlorophyll maximum layers: enduring enigma or mystery solved? Ann Rev Mar Sci, 7: 207-239, doi:10.1146/annurev-marine-010213-135111.
Eicken H. 2002. Tracer studies of pathways and rates of meltwater transport through Arctic summer sea ice. J Geophys Res, 107(C10): 8046, doi:10.1029/2000jc000583.
Eppley R W, Peterson B J. 1979. Particulate organic matter flux and planktonic new production in the deep ocean. Nature, 282(5740): 677-680, doi:10.1038/282677a0.
Falkowski P G, Woodhead A D, Vivirito K. 1992. Primary productivity and biogeochemical cycles in the sea. Boston: Springer US, doi:10.1007/978-1-4899-0762-2.
Finkel Z V, Beardall J, Flynn K J, et al. 2009. Phytoplankton in a changing world: cell size and elemental stoichiometry. J Plankton Res, 32(1): 119-137, doi:10.1093/plankt/fbp098.
Gong D L, Pickart R S. 2015. Summertime circulation in the eastern Chukchi Sea. Deep Sea Res Part II Top Stud Oceanogr, 118: 18-31, doi:10.1016/j.dsr2.2015.02.006.
Gosselin M, Levasseur M, Wheeler P A, et al. 1997. New measurements of phytoplankton and ice algal production in the Arctic Ocean. Deep Sea Res Part II Top Stud Oceanogr, 44(8): 1623-1644, doi:10.1016/ S0967-0645(97)00054-4.
Holm-Hansen O, Lorenzen C J, Holmes R W, et al. 1965. Fluorometric determination of chlorophyll. ICES J Mar Sci, 30(1): 3-15, doi:10.1093/icesjms/30.1.3.
Hunt G L, Stabeno P, Walters G, et al. 2002. Climate change and control of the southeastern Bering Sea pelagic ecosystem. Deep Sea Res Part II Top Stud Oceanogr, 49(26): 5821-5853, doi:10.1016/S0967- 0645(02)00321-1.
Hunt G L, Coyle K O, Eisner L B, et al. 2011. Climate impacts on eastern Bering Sea foodwebs: a synthesis of new data and an assessment of the Oscillating Control Hypothesis. ICES J Mar Sci, 68(6): 1230-1243, doi:10.1093/icesjms/fsr036.
Ji R, Jin M, Varpe Ø. 2013. Sea ice phenology and timing of primary production pulses in the Arctic Ocean. Glob Change Biol, 19(3): 734-741, doi:10.1111/gcb.12074.
Kim B, Jung J, Lee Y, et al. 2020. Characteristics of the biochemical composition and bioavailability of phytoplankton-derived particulate organic matter in the Chukchi Sea, Arctic. Water, 12(9): 2355, doi:10.3390/w12092355.
Kim B K, Lee J H, Yun M S, et al. 2015. High lipid composition of particulate organic matter in the northern Chukchi Sea, 2011. Deep Sea Res Part II Top Stud Oceanogr, 120: 72-81, doi:10.1016/j.dsr2. 2014.03.022.
Kwok R, Rothrock D A. 2009. Decline in Arctic sea ice thickness from submarine and ICESat records: 1958-2008. Geophys Res Lett, 36(15): L15501, doi:10.1029/2009gl039035.
Latasa M, Cabello A M, Morán X A G, et al. 2017. Distribution of phytoplankton groups within the deep chlorophyll maximum. Limnol Oceanogr, 62(2): 665-685, doi:10.1002/lno.10452.
Lee S H, Whitledge T E. 2005. Primary and new production in the deep Canada Basin during summer 2002. Polar Biol, 28(3): 190-197, doi:10.1007/s00300-004-0676-3.
Leu E, Søreide J E, Hessen D O, et al. 2011. Consequences of changing sea-ice cover for primary and secondary producers in the European Arctic shelf seas: timing, quantity, and quality. Prog Oceanogr, 90(1-4): 18-32, doi:10.1016/j.pocean.2011.02.004.
Lewis M R, Cullen J J, Platt T. 1983. Phytoplankton and thermal structure in the upper ocean: consequences of nonuniformity in chlorophyll profile. J Geophys Res, 88(C4): 2565, doi:10.1029/ jc088ic04p02565.
Li W K W, McLaughlin F A, Lovejoy C, et al. 2009. Smallest algae thrive as the Arctic Ocean freshens. Science, 326(5952): 539, doi:10.1126/science.1179798.
Lovejoy C, Massana R, Pedrós-Alió C. 2006. Diversity and distribution of marine microbial eukaryotes in the Arctic Ocean and adjacent seas. Appl Environ Microbiol, 72(5): 3085-3095, doi:10.1128/AEM.72.5. 3085-3095.2006.
Lovejoy C, Vincent W F, Bonilla S, et al. 2007. Distribution, phylogeny, and growth of cold-adapted Picoprasinophytes in Arctic seas. J Phycol, 43(1): 78-89, doi:10.1111/j.1529-8817.2006.00310.x.
Macklin S A, Hunt G L, Overland J E. 2002. Collaborative research on the pelagic ecosystem of the southeastern Bering Sea shelf. Deep Sea Res Part II Top Stud Oceanogr, 49(26): 5813-5819, doi:10.1016/S 0967-0645(02)00320-X.
Marañón E, Cermeño P, Latasa M, et al. 2015. Resource supply alone explains the variability of marine phytoplankton size structure. Limnol Oceanogr, 60(5): 1848-1854, doi:10.1002/lno.10138.
McLaughlin F A, Carmack E C. 2010. Deepening of the nutricline and chlorophyll maximum in the Canada Basin interior, 2003-2009. Geophys Res Lett, 37(24): L24602, doi:10.1029/2010gl045459.
Mills M M, Brown Z W, Laney S R, et al. 2018. Nitrogen limitation of the summer phytoplankton and heterotrophic prokaryote communities in the Chukchi Sea. Front Mar Sci, 5: 362, doi:10.3389/fmars.2018. 00362.
Mundy C J, Barber D G, Michel C. 2005. Variability of snow and ice thermal, physical and optical properties pertinent to sea ice algae biomass during spring. J Mar Syst, 58(3-4): 107-120, doi:10.1016/j. jmarsys.2005.07.003.
Pabi S, van Dijken G L, Arrigo K R. 2008. Primary production in the Arctic Ocean, 1998-2006. J Geophys Res, 113(C8): C08005, doi:10.1029/2007jc004578.
Perovich D K, Richter-Menge J A. 2009. Loss of sea ice in the Arctic. Ann Rev Mar Sci, 1: 417-441, doi:10.1146/annurev.marine.010908.163805.
Platt T, Sathyendranath S. 1988. Oceanic primary production: estimation by remote sensing at local and regional scales. Science, 241(4873): 1613-1620, doi:10.1126/science.241.4873.1613.
Poulin M, Daugbjerg N, Gradinger R, et al. 2010. The pan-Arctic biodiversity of marine pelagic and sea-ice unicellular eukaryotes: a first-attempt assessment. Mar Biodiv, 41(1): 13-28, doi:10.1007/s 12526-010-0058-8.
Redfield A C, Ketchum B H, Richards F A. 1963. The influence of organisms on the composition of the sea water//Hill M N. The Sea,Vol. 2, New York: Interscience Publishers, 26-77.
Ryan J P, McManus M A, Sullivan J M. 2010. Interacting physical, chemical and biological forcing of phytoplankton thin-layer variability in Monterey Bay, California. Cont Shelf Res, 30(1): 7-16, doi:10.1016/j.csr.2009.10.017.
Sigman D M, Boyle E A. 2000. Glacial/interglacial variations in atmospheric carbon dioxide. Nature, 407(6806): 859-869, doi:10. 1038/35038000.
Soltwedel T, Bauerfeind E, Bergmann M, et al. 2005. HAUSGARTEN: multidisciplinary investigations at a deep-sea, long-term observatory in the Arctic Ocean. Oceanography, 18(3): 46-61, doi:10.5670/ oceanog.2005.24.
Soltwedel T, Bauerfeind E, Bergmann M, et al. 2016. Natural variability or anthropogenically-induced variation? Insights from 15 years of multidisciplinary observations at the Arctic marine LTER site HAUSGARTEN. Ecol Indic, 65: 89-102, doi:10.1016/j.ecolind. 2015.10.001.
Steele M, Ermold W, Zhang J. 2008. Arctic Ocean surface warming trends over the past 100 years. Geophys Res Lett, 35(2): L02614, doi:10.1029/2007gl031651.
Wang J, Cota G F, Comiso J C. 2005. Phytoplankton in the Beaufort and Chukchi Seas: distribution, dynamics, and environmental forcing. Deep Sea Res Part II Top Stud Oceanogr, 52(24-26): 3355-3368, doi:10.1016/j.dsr2.2005.10.014.
Wassmann P, Reigstad M. 2011. Future Arctic Ocean seasonal ice zones and implications for pelagic-benthic coupling. Oceanography, 24(3): 220-231, doi:10.5670/oceanog.2011.74.
Welschmeyer N A. 1994. Fluorometric analysis of chlorophyllin the presence of chlorophylland pheopigments. Limnol Oceanogr, 39(8): 1985-1992, doi:10.4319/lo.1994.39.8.1985.
Yun M S, Joo H M, Kang J J, et al. 2019. Potential implications of changing photosynthetic end-products of phytoplankton caused by sea ice conditions in the northern Chukchi Sea. Front Microbiol, 10: 2274, doi:10.3389/fmicb.2019.02274.
Yun M S, Lee D B, Kim B K, et al. 2015. Comparison of phytoplankton macromolecular compositions and zooplankton proximate compositions in the northern Chukchi Sea. Deep Sea Res Part II Top Stud Oceanogr, 120: 82-90, doi:10.1016/j.dsr2.2014.05.018.
Zhu Y, Suggett D, Liu C, et al. 2019. Primary productivity dynamics in the summer Arctic Ocean confirms broad regulation of the electron requirement for carbon fixation by light-phytoplankton community interaction. Front Mar Sci, 6: 167218194, doi:10.3389/fmars.2019. 00275.

Figure S1 The frequency of the total- (a), micro- (b), nano- (c) and pico-Chlconcentrations (d) in the Arctic Ocean.
Figure S2 The compositions of size-fractionated Chlin the surface (a) and in the water column (b) in the study area.
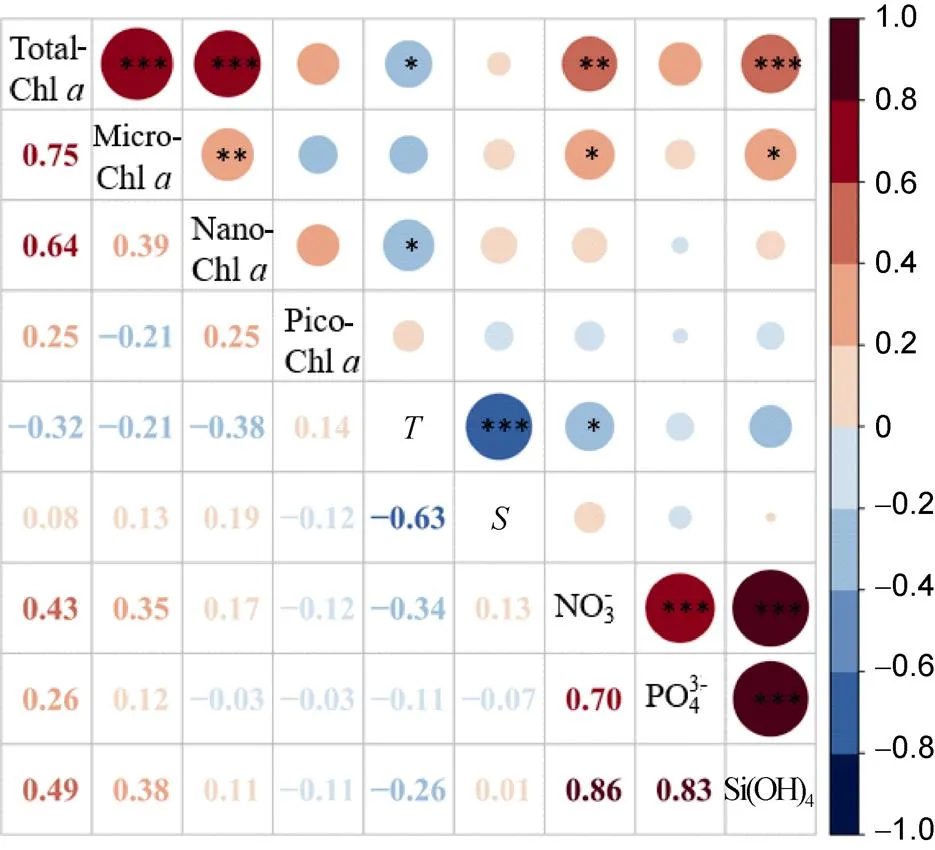
Figure S3 Pearson’s Correlation Coefficient between biological variables and environmental parameters in the water column (0–200 m) in the Arctic Ocean (total-, micro-, nano- and pico-Chlhas taken logarithm; * represent< 0.05, ** represent< 0.01 and *** represent< 0.001).
Figure S4 The vertical distributions of nitrate, phosphate and silicate from the surface to a depth of 200 m at transect P1, P2, P3, R.
10.13679/j.advps.2021.0056
10 December 2021;
10 June 2022;
30 August 2022
: Cai T, Hao Q, Bai Y C, et al. Variability of size-fractionated chlorophyllin the high-latitude Arctic Ocean in summer 2020. Adv Polar Sci, 2022, 33(3): 253-266,doi:10.13679/j.advps.2021.0056
, ORCID: 0000-0003-2145-2703, E-mail: haoq@sio.org.cn
 Advances in Polar Science2022年3期
- Advances in Polar Science的其它文章
- Spatial variability of δ18O and δ2H in North Pacific and Arctic Oceans surface seawater
- Dissolved nutrient distributions in the Antarctic Cosmonaut Sea in austral summer 2021
- Population size and distribution of seabirds in the Cosmonaut Sea, Southern Ocean
- Some thoughts on the development of polar microbial resources
- One special issue will be published in September 2023
- “Opinion Editorials” category attracts more attention