
Dissolved nutrient distributions in the Antarctic Cosmonaut Sea in austral summer 2021
2022-10-18 13:01:50HUANGWenhaoYANGXufengZHAOJunLIDongPANJianming
Advances in Polar Science 2022年3期
HUANG Wenhao, YANG Xufeng, ZHAO Jun*, LI Dong & PAN Jianming
Dissolved nutrient distributions in the Antarctic Cosmonaut Sea in austral summer 2021
HUANG Wenhao1,2, YANG Xufeng1,2, ZHAO Jun1,2*, LI Dong1,2& PAN Jianming1,2
1Key Laboratory of Marine Ecosystem Dynamics, Ministry of Natural Resources, Hangzhou 310012, China;2Second Institute of Oceanography, Ministry of Natural Resources, Hangzhou 310012, China
Dissolved nutrients are essential to marine productivity and ecosystem structures in the Southern Ocean. The spatial distributions of dissolved nutrients in the Cosmonaut Sea were studied during the 37th Chinese National Antarctic Research Expedition in 2021. The relative standard deviations of the nitrate (NO3-N), nitrite (NO2-N), ammonium (NH4-N), phosphate (PO4-P), and silicate (SiO3-Si) concentrations found in duplicate samples (=2) were 1.01%, 9.04%, 6.45%, 0.94%, and 0.67%, respectively. The mean NO3-N, NO2-N, NH4-N, PO4-P, and SiO3-Si concentrations in the mixed layer were 26.41±4.13, 0.15±0.09, 0.51±0.22, 1.73±0.23, and 41.48±6.94 μmol·L−1, respectively, and were higher than the relevant limitation concentrations. The concentrations were generally bounded horizontally by the Southern Boundary (SB) of the Antarctic Circumpolar Current, the NO3-N, NO2-N, NH4-N, and PO4-P concentrations being higher northeast than southwest of the SB but the SiO3-Si concentrations being higher southwest than northeast, indicating that the SB dominates nutrient distributions in the mixed layer. The NO3-N, NH4-N, and PO4-P concentrations gradually increased moving vertically down from the mixed layer to 200 m deep and then remained at 33.73±3.51, 0.26±0.13, and 2.28±0.10 μmol·L−1, respectively, to the bottom. The SiO3-Si concentration increased as depth increased and reached a maximum in the bottom layer. The NO2-N concentration decreased rapidly as depth increased and was ~0 μmol·L−1at >150 m deep. Circumpolar Deep Water upwelling may cause high nutrient concentrations in shallower layers up to the 100 m layer between 62.5°S and 64°S.
dissolved nutrients, water masses, mixed layer, circulation, Antarctic, Cosmonaut Sea
1 Introduction
Dissolved nutrients are required for the growth of phytoplankton (i.e., primary productivity) in the ocean, which is critical to marine ecosystems (Millero, 2013). The Southern Ocean generally has high nutrient and low chlorophyll concentrations (Boyd et al., 2000). The Antarctic marine biological pump is markedly different from the other oceans because of the geographical environment characteristics of Antarctic Ocean (Arrigo et al., 2008). Upwelling of Circumpolar Deep Water (CDW) and Antarctic Intermediate Water off Antarctic coasts provide abundant nutrients near Antarctica (Pollard et al., 2006). An ocean circulation model has indicated that nutrients exported from the Southern Ocean leads to ~75% of primary productivity in the oceans north of 30°S (Weber and Deutsch, 2010). Nutrient supplies and cycles in the Southern Ocean are therefore very important to marine primary productivity across the world.
The Cosmonaut Sea, which is west of Enderby Land in East Antarctica and borders the Cooperation Sea (to the east) and the Lisser–Larsen Sea (to the west), is an important fishery and component of the Southern Ocean ecosystem (Nicol and Foster, 2003; Wright et al., 2010). In recent decades, global warming has quadrupled the rate at which Antarctic glaciers are melting (Shepherd et al., 2018) and increased interannual sea ice changes in the Cosmonaut Sea (Geddes and Moore, 2007). These changes may cause fluctuations in the availability of light, the mixed layer depth (MLD), and the concentration of bioavailable iron, which may affect nutrient cycles and the ecosystem of the Cosmonaut Sea. A systematic multi-disciplinary study called the BROKE-West survey was performed in the austral summer of 2006. In that study, interactions between nutrient cycling and circulation, light, trace elements, and plankton in the Cosmonaut Sea and adjacent seas were investigated (Westwood et al., 2010; Williams et al., 2010; Wright et al., 2010). Since then, however, few spatial and temporal studies of dissolved nutrients and their effects on primary productivity and ecosystem structures in the Cosmonaut Sea have been performed. More research into the distributions of dissolved nutrients in the Cosmonaut Sea is required to improve our understanding of marine ecosystems and changes in these ecosystems.
In this study, we present the concentrations and distributions of dissolved nutrients detailly in the Cosmonaut Sea in austral summer 2021, collected during the 37th Chinese National Antarctic Research Expedition (CHINARE). The data under high-quality control updated nutrient data set in the Southern Ocean. This study would provide an important reference for further study on nutrient dynamics and the ecosystem in the Cosmonaut Sea.
2 Materials and methods
2.1 Oceanography
Water masses and circulation are key to dissolved nutrient distributions in the Cosmonaut Sea. The CDW and three important surface/subsurface circulations (the Weddell Gyre (WG), the Southern Boundary (SB) of the Antarctic Circumpolar Current, and the Antarctic Slope Current (ASC)) affect the Cosmonaut Sea (Figure 1). CDW and Antarctic surface water above it are the main water masses in the top 250 m of the water column (Orsi et al., 1995). Strong CDW intrusion can cause local increases in dissolved nutrient concentrations (Meijers et al., 2010). The WG (the dominant circulation in the western part of 40°E in the Cousmonaut Sea) causes the seasonal mixed layer to be shallower, warmer, and fresher in the western than eastern research region (Williams et al., 2010). East of the WG, the SB extends southeastwards, reaching 65.5°S and 60°E, and is a key factor leading to high nitrate concentrations in the northeastern part of the Cosmonaut Sea (Westwood et al., 2010). The ASC, which is a robust narrow westward flowing jet, has flow rates as high as 30 cm·s−1and causes high chlorophyllconcentrations along the shore (Meijers et al., 2010).

Figure 1 Stations at which samples were collected to determine dissolved nutrient concentrations in the austral summer between 5 and 25 January 2021 as a part of the 37th CHINARE. The green triangles indicate areas with strong upwelling. The solid orange line indicates the southern boundary of the Antarctic Circumpolar Current (SB), the solid blue line indicates the Weddell Gyre (WG), and the solid purple line indicates the Antarctic Slope Current (ASC) (Westwood et al., 2010; Williams et al., 2010).
2.2 Sample collection
Hydrological parameters (potential temperature, salinity, and potential density) were determined and recorded using a pre-calibrated Sea-Bird SBE-9/11 plus CTD (conductivity- temperature-depth) system (SeaBird, USA). A total of 419 water samples, including 28 parallel samples from 33 stations on six transects (C2’, C4, C5, C5/6, C6, and C7), were collected from the Cosmonaut Sea by the R/Vbetween 5 and 25 January 2021 as part of the 37th CHINARE. The sampling depths were widely accepted standard water layer sampling depths (the surface layer (i.e., 5 m in Table 1 and Table S1), depths of 25, 50, 75, 100, 150, 200, 300, 500, 1000, 2000 and 3000 m, and the bottom layer) (Figure 1 and Table S1). Each water sample was passed through a Whatman cellulose acetate filter membrane with 0.45 μm pores (Whatman, USA). The filtrate was collected in a clean Nalgene polyethylene bottle (HDPE, Nalgene, USA) and stored at −20℃.
2.3 Experimental methods
The ammonium (NH4-N) concentrations in the samples were determined onboard the research vessel using the indophenol blue photometric method using a calibrated 7230G visible light spectrophotometer (INESA, China). The analytical procedure is described in detail in “Specifications for the oceanographic survey – Part 4: Survey of chemical parameters in sea water”(GB/T 12763.4—2007) (General Administration of Quality Supervision, Inspection and Quarantine of the People’s Republic of China and Standardization Administration of China, 2007). The nitrate (NO3-N), nitrite (NO2-N), phosphate (PO4-P), and silicate (SiO3-Si) concentrations were determined onboard the research vessel using the cadmium copper column reduction diazo method, the diazo azo method, the phosphomolybdenum blue method, and the silicon-molybdenum blue method, respectively, using an AA3 automatic nutrient analyzer (SEAL, Germany). The analytical procedures are described in the “Code of practice for marine monitoring technology Part 1: seawater” (HY/T 147.1—2013) (State Oceanic Administration, 2013). Artificial seawater with a similar salinity to the samples was used to prepare the standards and to clean the injector to prevent differences in salinity affecting the results. The concentrations of various dissolved nutrients in the seawater samples were calculated from the linear relationships between the light absorption values and nutrient concentrations for the standards. Natural seawater samples containing NO3-N, NO2-N, NH4-N, PO4-P, and SiO3-Si at concentrations of 2.25, 0.42, 1.30, 2.88, and 18.54 μmol·L−1, respectively, were determined, and the relative standard deviations (RSDs) were 2.4%, 2.6%, 1.2%, 5.2% and 6.4%, respectively. Duplicate samples were collected from one layer at each station and used as quality control samples (Table 1). The standard solutions (GBW 08617-08645) used were produced by the Marine Reference Material Center, Second Institute of Oceanography, Ministry of Natural Resources of China.
2.4 Calculating the MLD
The potential seawater density (, in kg·m−3) was calculated from the potential temperature, salinity, and pressure data collected. The MLD for the water column was calculated from the depth of the maximum water column buoyancy frequency (2, in rad2·s−2) (Carvalho et al., 2016) using Eq. (1),
whereandare gravity and water depth, respectively.
2.5 Statistical analysis
Two-tailed tests of significance were performed using SPSS 25 software (IBM, USA) to identify significant relationships between the measured parameters.
3 Results and discussion
3.1 Parallel sample analyses
The RSDs for the NO3-N, NO2-N, NH4-N, PO4-P, and SiO3-Si concentrations found in the samples from the parallel sample stations were 0.08%–3.23%, 0%–47.14%, 0%–17.31%, 0%–4.31%, and 0.01%–5.79%, respectively, and the mean concentrations were 1.01%, 9.04%, 6.45%, 0.94%, and 0.67%, respectively, as shown in Table 1. The RSDs for most of the samples were better than the acceptable thresholds for the analytical methods. Some of the RSDs, particularly for the NO2-N and NH4-N concentrations, were poor because of their low concentrations. The results for the parallel samples generally indicated that the dataset was reliable.
3.2 Horizontal dissolved nutrient distributions
The mean NO3-N, PO4-P, and SiO3-Si concentrations in the surface layer samples were 25.84±3.31, 1.66±0.27, and 41.63±6.62 μmol·L−1, respectively, which were higher than the relevant nutrient limits (15, 0.1, and 5 μmol·L−1, respectively) (Justić et al., 1995; Franck et al., 2000). The mean NO2-N and NH4-N concentrations were 0.15±0.09 and 0.49±0.22 μmol·L−1, respectively. The NO3-N, NO2-N, NH4-N, and PO4-P concentrations in surface water generally decreased from the northeast to the southwest of the SB (Figure 2, see Figure 1 for the location of the SB). The highest NO3-N, NO2-N, NH4-N, and PO4-P concentrations were 30.17 μmol·L−1(C5-06), 0.29 μmol·L−1(C4-02), 1.37 μmol·L−1(C5-03) and 1.96 μmol·L−1(C5-05 and C5-06), respectively, which were all found at northeast of the SB. The lowest NO3-N, NO2-N, NH4-N, and PO4-P concentrations were 17.11 μmol·L−1(C4-09), 0.02 μmol·L−1(C4-07, C4-09 and C4-10), 0.22 μmol·L−1(C5’-08), and 0.96 μmol·L−1(C4-10), respectively, which were located at southwest of the SB. The SiO3-Si concentrations in the surface water samples had the opposite distribution: lower in the northeast side of SB and higher in the southwest side of SB. The highest SiO3-Si concentration (54.03 μmol·L−1) was found at station C2’-13 and the lowest SiO3-Si concentration (24.63 μmol·L−1) was found at station C7-03 (Table S1).
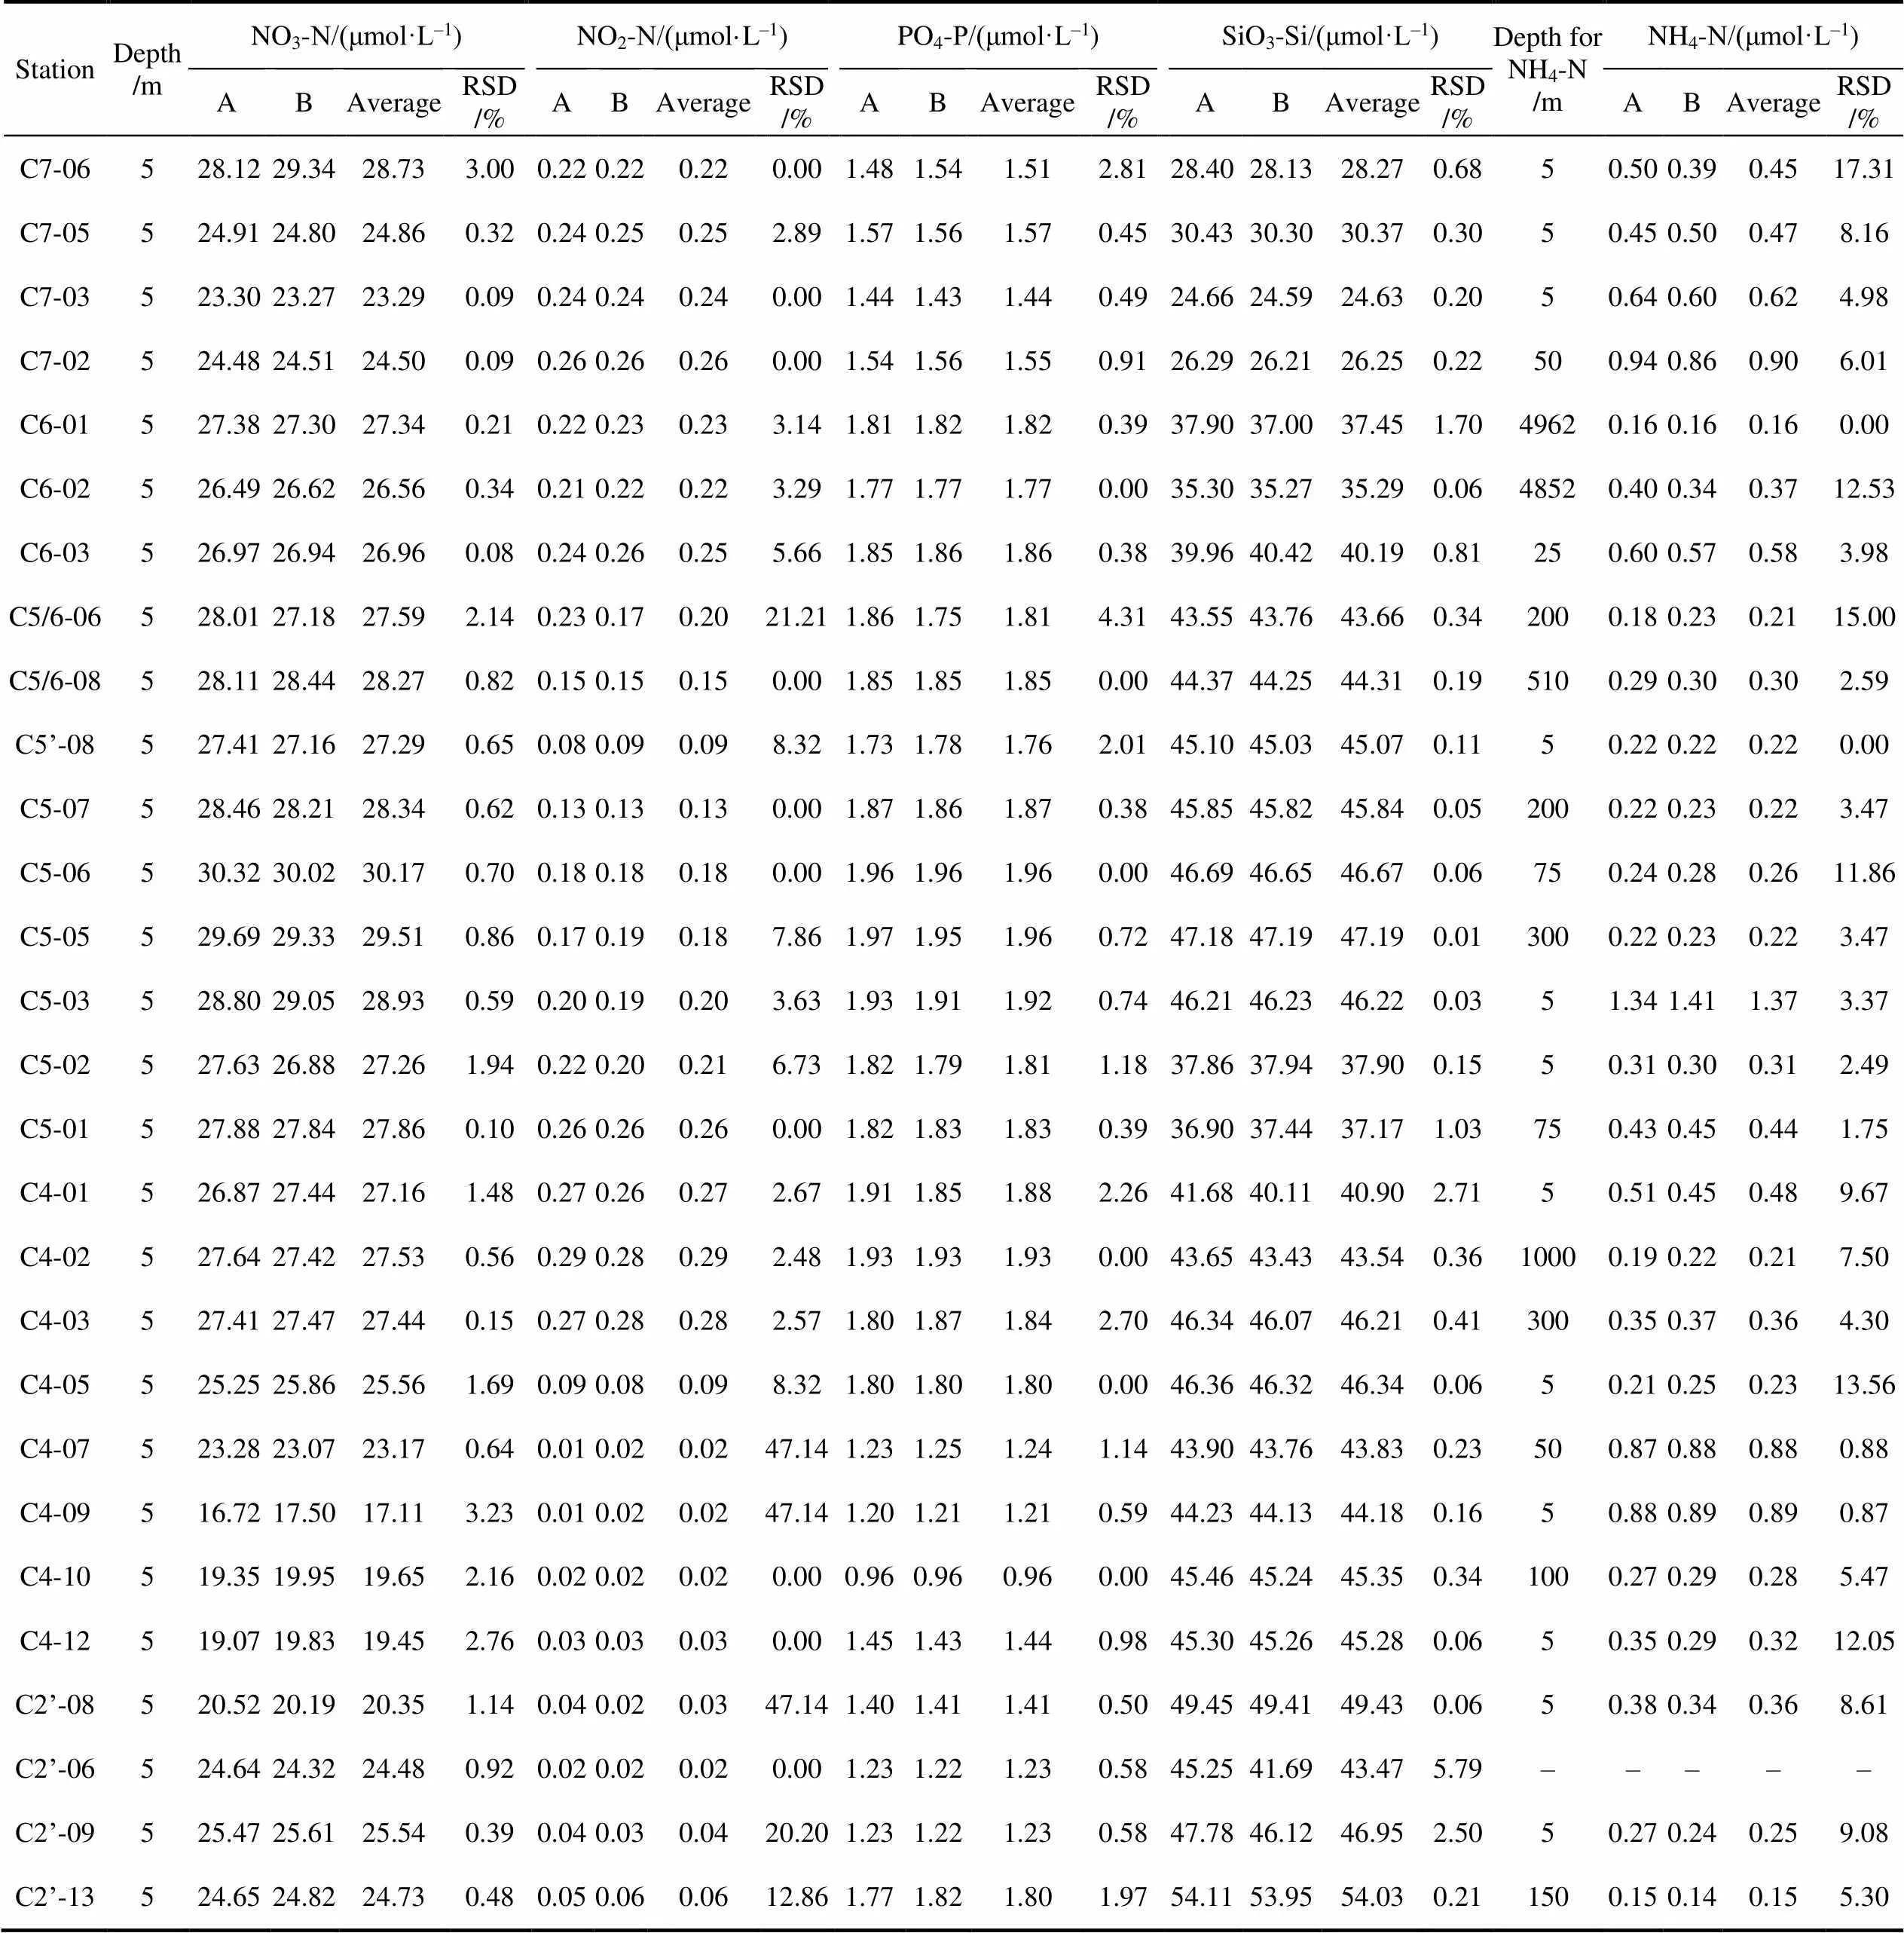
Table 1 Concentrations, mean concentrations, and relative standard deviations (RSD) of dissolved nutrients in the samples from the 28 parallel sample stations
The MLDs in the study area ranged from 14 m at station C4-09 to 85 m at station C5’-08, and the mean MLD was 37±17 m, which was similar to the MLD found in the BROKE-West survey (MLD 26±15 m,>0.05) (Figure S1). The low MLD between 30°E and 60°E may have been caused by the WG . The NO3-N, NO2-N, NH4-N, PO4-P, and SiO3-Si concentrations in the mixed layer were 26.41±4.13 (15.74–39.76), 0.15±0.09 (0–0.29), 0.51±0.22 (0.18–1.37), 1.73±0.23 (1.01–1.99), and 41.48±6.94 (22.87–55.11) μmol·L−1, respectively. Similar NO3-N and SiO3-Si concentrations (25.9±2.5 and 48.0±8.8 μmol·L−1, respectively) were found in the BROKE-West survey (Westwood et al., 2010), indicating that little interannual variation in dissolved nutrient concentrations occur in the mixed layer in the Cosmonaut Sea.
The mean NO3-N, PO4-P, and SiO3-Si concentrations in the 200 m layer (33.23±2.50, 2.30±0.13, and 69.36± 9.80 μmol·L−1, respectively) were higher than the concentrations in the surface layer, but the mean NO2-N and NH4-N concentrations (0 and 0.25±0.14 μmol·L−1, respectively) were lower than the concentrations in the surface layer. The horizontal NO3-N, PO4-P, and SiO3-Si concentration distributions in the 200 m layer and surface layer were similar, indicating that circulation strongly affects the distributions of NO3-N, PO4-P, and SiO3-Si in the euphotic zone. The NO2-N concentrations were below the detection limit, and there was no clear trend in the NH4-N concentration distribution.
The mean NO3-N, NO2-N, NH4-N, and PO4-P concentrations in the bottom water were 38.46±4.66, 0±0.01, 0.34±0.14, and 2.26±0.09 μmol·L−1, respectively, which were not significantly different from the concentrations in the 200 m layer (>0.05). The SiO3-Si concentration in the bottom water was 99.70± 14.20 μmol·L−1, which was significantly higher than the concentration in the 200 m layer (<0.01). The NO3-N concentrations in the bottom water were generally higher near the shore and lower in the open ocean, unlike the concentrations in the surface layer. Significantly lower PO4-P and SiO3-Si concentrations and higher NO2-N concentrations were found in the ice-edge region between 55°E and 60°E than elsewhere.

Figure 2 Horizontal distributions of dissolved nutrients (NO3-N, NO2-N, NH4-N, PO4-P, and SiO3-Si) in the surface layer, at the bottom of the euphotic zone (200 m layer), and in the bottom layer of the Cosmonaut Sea (units: μmol·L−1).
3.3 Vertical dissolved nutrient distributions
The vertical NO3-N and PO4-P concentration distributions were similar (Figures 3 and 6), the concentrations gradually increasing moving down from the surface layer to the 200 m layer and then remaining stable at >200 m. The NO2-N concentration decreased rapidly as depth increased and was ~0 μmol·L−1at >150 m deep (Figure 4). The maximum NH4-N concentration was generally reached at75–200 m deep, then the concentration decreased slightly as depth increased and then remained stable as the depth increased further (Figure 5). The NO3-N, NO2-N, NH4-N, and PO4-P concentrations at >200 m deep were 33.73±3.51, 0±0.01, 0.26±0.13, and 2.28±0.10 μmol·L−1, respectively. In contrast, the SiO3-Si concentration increased as depth increased and was highest in the bottom layer (Figure 7), the concentrations being 78.46±12.67 μmol·L−1at 200– 1000 m deep and 100.40±10.59 μmol·L−1at >1000 m deep. Along transects C4 and C5, the NO3-N, NH4-N, PO4-P, and SiO3-Si concentrations near the 100 m layer were all higher between 62.5°S and 64°S than further south. This may have been because large inputs of dissolved nutrients caused by CDW upwelling (Meijers et al., 2010) affected the nutrient concentration distributions.
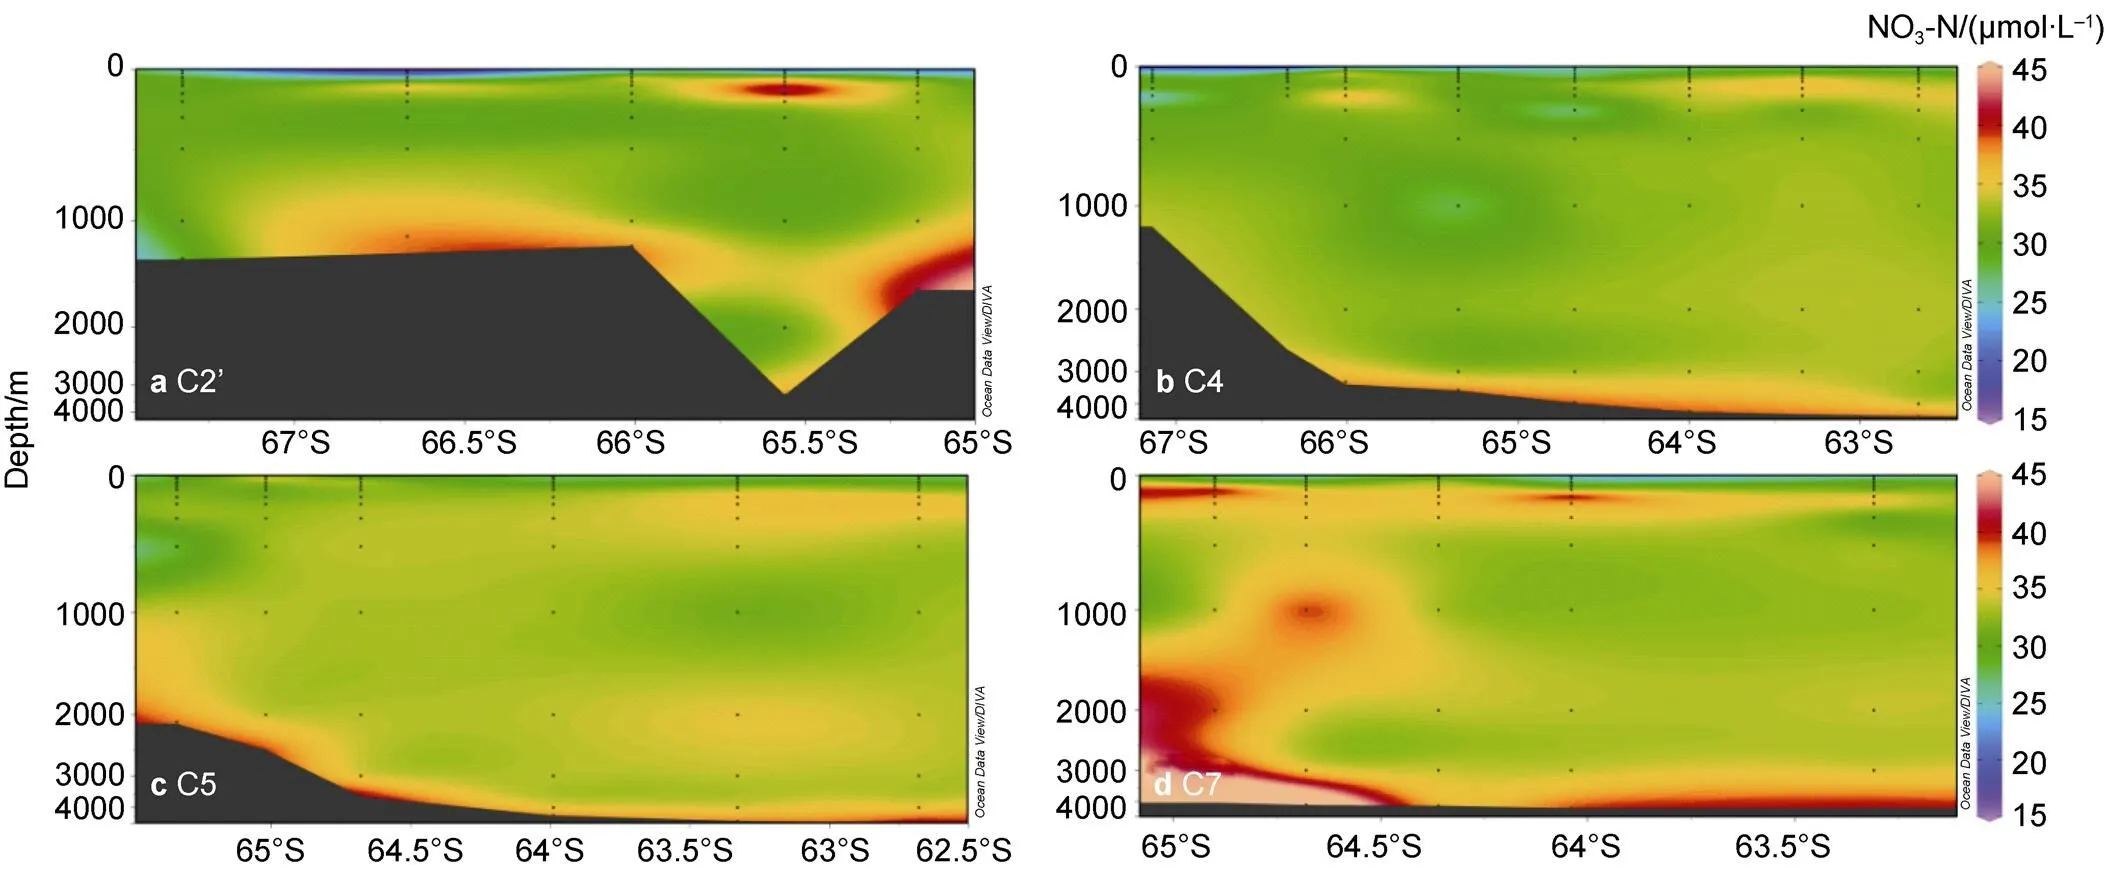
Figure 3 Vertical nitrate (NO3-N) distribution along transect C2’ (a), transect C4 (b), transect C5 (c), and transect C7 (d) in the Cosmonaut Sea.
Figure 4 Vertical nitrite (NO2-N) distribution along transect C2’ (a), transect C4 (b), transect C5 (c), and transect C7 (d) in the Cosmonaut Sea.

Figure 5 Vertical ammonium (NH4-N) distribution along transect C2’ (a), transect C4 (b), transect C5 (c), and transect C7 (d) in the Cosmonaut Sea.
Figure 6 Vertical phosphate (PO4-P) distribution along transect C2’ (a), transect C4 (b), transect C5 (c), and transect C7 (d) in the Cosmonaut Sea.
4 Summary
We investigated the spatial characteristics of dissolved nutrient concentrations in the Cosmonaut Sea during the 37th CHINARE in the austral summer of 2021. The sample analyses gave good quality data, and the RSDs for the NO3-N, NO2-N, NH4-N, PO4-P, and SiO3-Si concentrations found in duplicate samples (=2) were better than required. The horizontal NO3-N, NO2-N, NH4-N, and PO4-P concentration distributions in the mixed layer were similar, increasing gradually from southwest to northeast of the SB. The SiO3-Si concentration distribution followed the opposite trend. This indicated that circulation strongly affected the nutrient distributions in the mixed layer. The NO3-N and PO4-P concentrations gradually increased moving down from the surface to 200 m deep and then remained stable moving further down. The NO2-N concentration decreased rapidly as depth increased and was ~0 μmol·L−1at >150 m deep. The maximum NH4-N concentration was generally at 75–200 m deep. The SiO3-Si concentration increased as depth increased and reached a maximum in the bottom layer. We found that CDW upwelling locally affects the vertical distributions of dissolved nutrients. The dissolved nutrient concentrations were generally higher than the limiting concentrations throughout the study area, indicating that no macronutrient limitation occurred in the Cosmonaut Sea in the austral summer of 2021, similar to results in the BROKE-West survey. The data will be useful for reference in future studiesof nutrient dynamics and ecosystems in the Cosmonaut Sea.
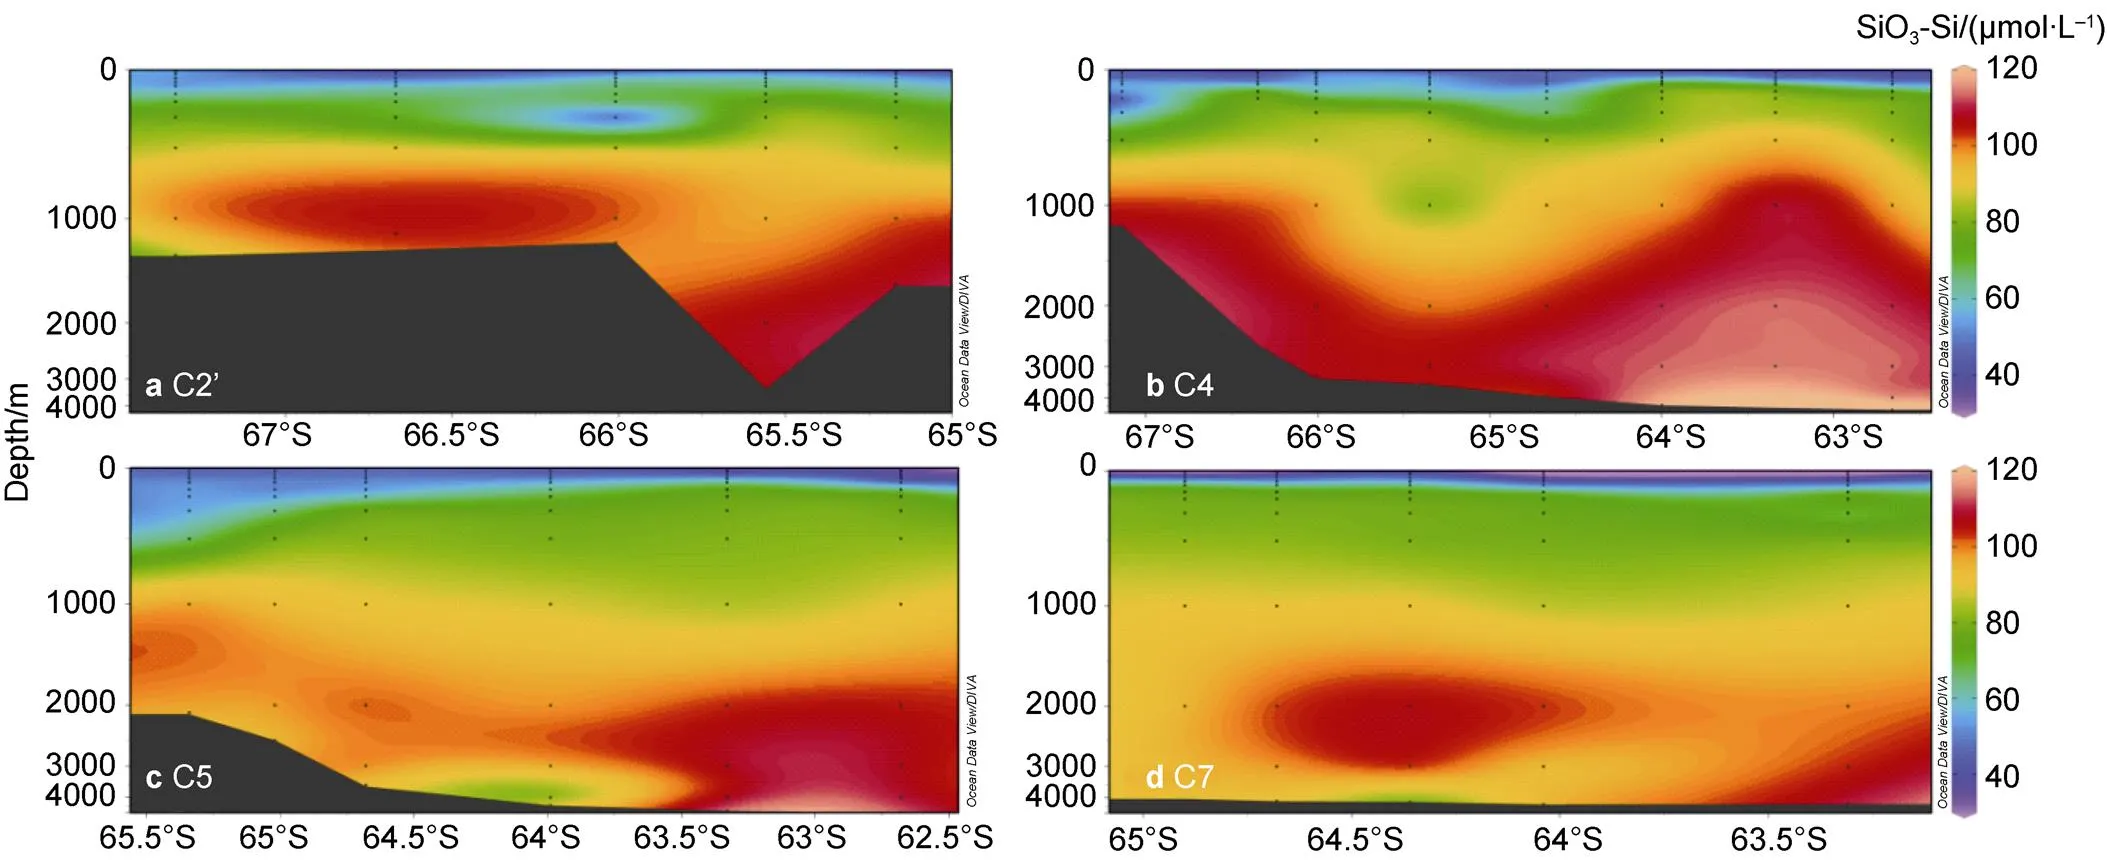
Figure 7 Vertical silicate (SiO3-Si) distribution along transect C2’ (a), transect C4 (b), transect C5 (c), and transect C7 (d) in the Cosmonaut Sea.
The authors wish to thank the 37th CHINARE team members and the crew of R/Vfor helping collect samples and Dr. Yubing Feng for helping calculate MLDs. The study was financially supported by National Polar Special Program “Impact and Response of Antarctic Seas to Climate Change” (Grant nos. IRASCC 01-01-02A, IRASCC 02-02) and by the National Natural Science Foundation of China (NSFC) (Grant no. 41976228).
Arrigo K, van Dijken G, Bushinsky S. 2008. Primary production in the Southern Ocean, 1997-2006. J Geophys Res Oceans, 113(C8): C08004, doi:10.1029/2007JC004551.
Boyd P W, Watson A J, Law C S, et al. 2000. A mesoscale phytoplankton bloom in the polar Southern Ocean stimulated by iron fertilization. Nature, 407(6805): 695-702, doi:10.1038/35037500.
Carvalho F, Kohut J, Oliver M J, et al. 2016. Mixing and phytoplankton dynamics in a submarine canyon in the West Antarctic Peninsula. J Geophys Res Oceans, 121(7): 5069-5083, doi:10.1002/2016JC01 1650.
Chen J Y, Han Z B, Hu C Y, et al. 2017. Distribution and seasonal depletion of nutrients in Prydz Bay, Antarctica. Chin J Polar Res, 29(3): 327-337, doi:10.13679/j.jdyj.2017.3.327 (in Chinese with English abstract).
Franck V M, Brzezinski M A, Coale K H, et al. 2000. Iron and silicic acid concentrations regulate Si uptake north and south of the Polar Frontal Zone in the Pacific Sector of the Southern Ocean. Deep Sea Res Part II Top Stud Oceanogr, 47(15-16): 3315-3338, doi:10.1016/S0967- 0645(00)00070-9.
Geddes J A, Moore G W K. 2007. A climatology of sea ice embayments in the Cosmonaut Sea, Antarctica. Geophys Res Lett, 34(2): L02505, doi:10.1029/2006GL027910.
General Administration of Quality Supervision, Inspection and Quarantine of the People’s Republic of China and Standardization Administration of China. 2007. Specifications for the oceanographic survey – Part 4: Survey of chemical parameters in sea water, GB/T 12763.4—2007 (in Chinese).
Justić D, Rabalais N N, Turner R E. 1995. Stoichiometric nutrient balance and origin of coastal eutrophication. Mar Pollut Bull, 30(1): 41-46, doi:10.1016/0025-326X(94)00105-I.
Meijers A J S, Klocker A, Bindoff N L, et al. 2010. The circulation and water masses of the Antarctic shelf and continental slope between 30 and 80°E. Deep Sea Res Part II Top Stud Oceanogr, 57(9-10): 723-737, doi:10.1016/j.dsr2.2009.04.019.
Millero F J. 2013. Chemical Oceanography. 4th edition. London: CRC Press.
Nicol S, Foster J. 2003. Recent trends in the fishery for Antarctic krill. Aquat Living Resour, 16(1): 42-45, doi:10.1016/S0990-7440(03) 00004-4.
Orsi A H, Whitworth T III, Nowlin W D Jr. 1995. On the meridional extent and fronts of the Antarctic Circumpolar Current. Deep Sea Res Part I Oceanogr Res Pap, 42(5): 641-673, doi:10.1016/0967-0637 (95)00021-W.
Pollard R, Tréguer P, Read J. 2006. Quantifying nutrient supply to the Southern Ocean. J Geophys Res Oceans, 111(C5): C05011, doi:10. 1029/2005JC003076.
Shepherd A, Fricker H A, Farrell S L. 2018. Trends and connections across the Antarctic cryosphere. Nature, 558(7709): 223-232, doi:10.1038/s 41586-018-0171-6.
State Oceanic Administration. 2013. Code of practice for marine monitoring technology Part 1: Seawater, HY/T 147.1—2013 (in Chinese).
Sun W P, Hu C Y, Han Z B, et al. 2012. Distribution of nutrients and chlin Prydz Bay during the austral summer of 2011. Chin J Polar Res, 24(2): 178-186, doi:10.3724/SP.J.1084.2012.00178 (in Chinese with English abstract).
Tréguer P, Nelson D M, van Bennekom A J, et al. 1995. The silica balance in the world ocean: a reestimate. Science, 268(5209): 375-379, doi:10.1126/science.268.5209.375.
Weber T S, Deutsch C. 2010. Ocean nutrient ratios governed by plankton biogeography. Nature, 467(7315): 550-554, doi:10.1038/nature09403.
Westwood K J, Griffiths B F, Meiners K M, et al. 2010. Primary productivity off the Antarctic coast from 30°-80°E; BROKE-West survey, 2006. Deep Sea Res Part II Top Stud Oceanogr, 57(9-10): 794-814, doi:10.1016/j.dsr2.2008.08.020.
Williams G D, Nicol S, Aoki S, et al. 2010. Surface oceanography of BROKE-West, along the Antarctic margin of the south-west Indian Ocean (30-80°E). Deep Sea Res Part II Top Stud Oceanogr, 57(9-10): 738-757, doi:10.1016/j.dsr2.2009.04.020.
Wright S W, van den Enden R L, Pearce I, et al. 2010. Phytoplankton community structure and stocks in the Southern Ocean (30-80°E) determined by CHEMTAX analysis of HPLC pigment signatures. Deep Sea Res Part II Top Stud Oceanogr, 57(9-10): 758-778, doi:10.1016/j.dsr2.2009.06.015.
Text S1 operational quality supervision
The whole polar field operation and sample analysis follow the operational quality supervision, including human, machine, sample, method, and environment. The “human” means all executors on sampling and analyzing of dissolved nutrients have received professional train for the projects; “machine” means all instruments for sampling and analyzing of dissolved nutrients have been verified and calibrated during the investigation, and all measuring instruments are traceable to their sources using comparison and relevant documents; “sample” means all related processes, including sampling, storage, and transportation of dissolved nutrients, are strictly carried out by relevant provisions; “method” means corresponding rules and regulations are followed during the whole process on sampling and analyzing of dissolved nutrients, including laboratory management regulations, equipment operating procedures, and investigation operation standards and norms; and “environment” means the environment for sampling, analysis and storage of dissolved nutrients are clean and in order.
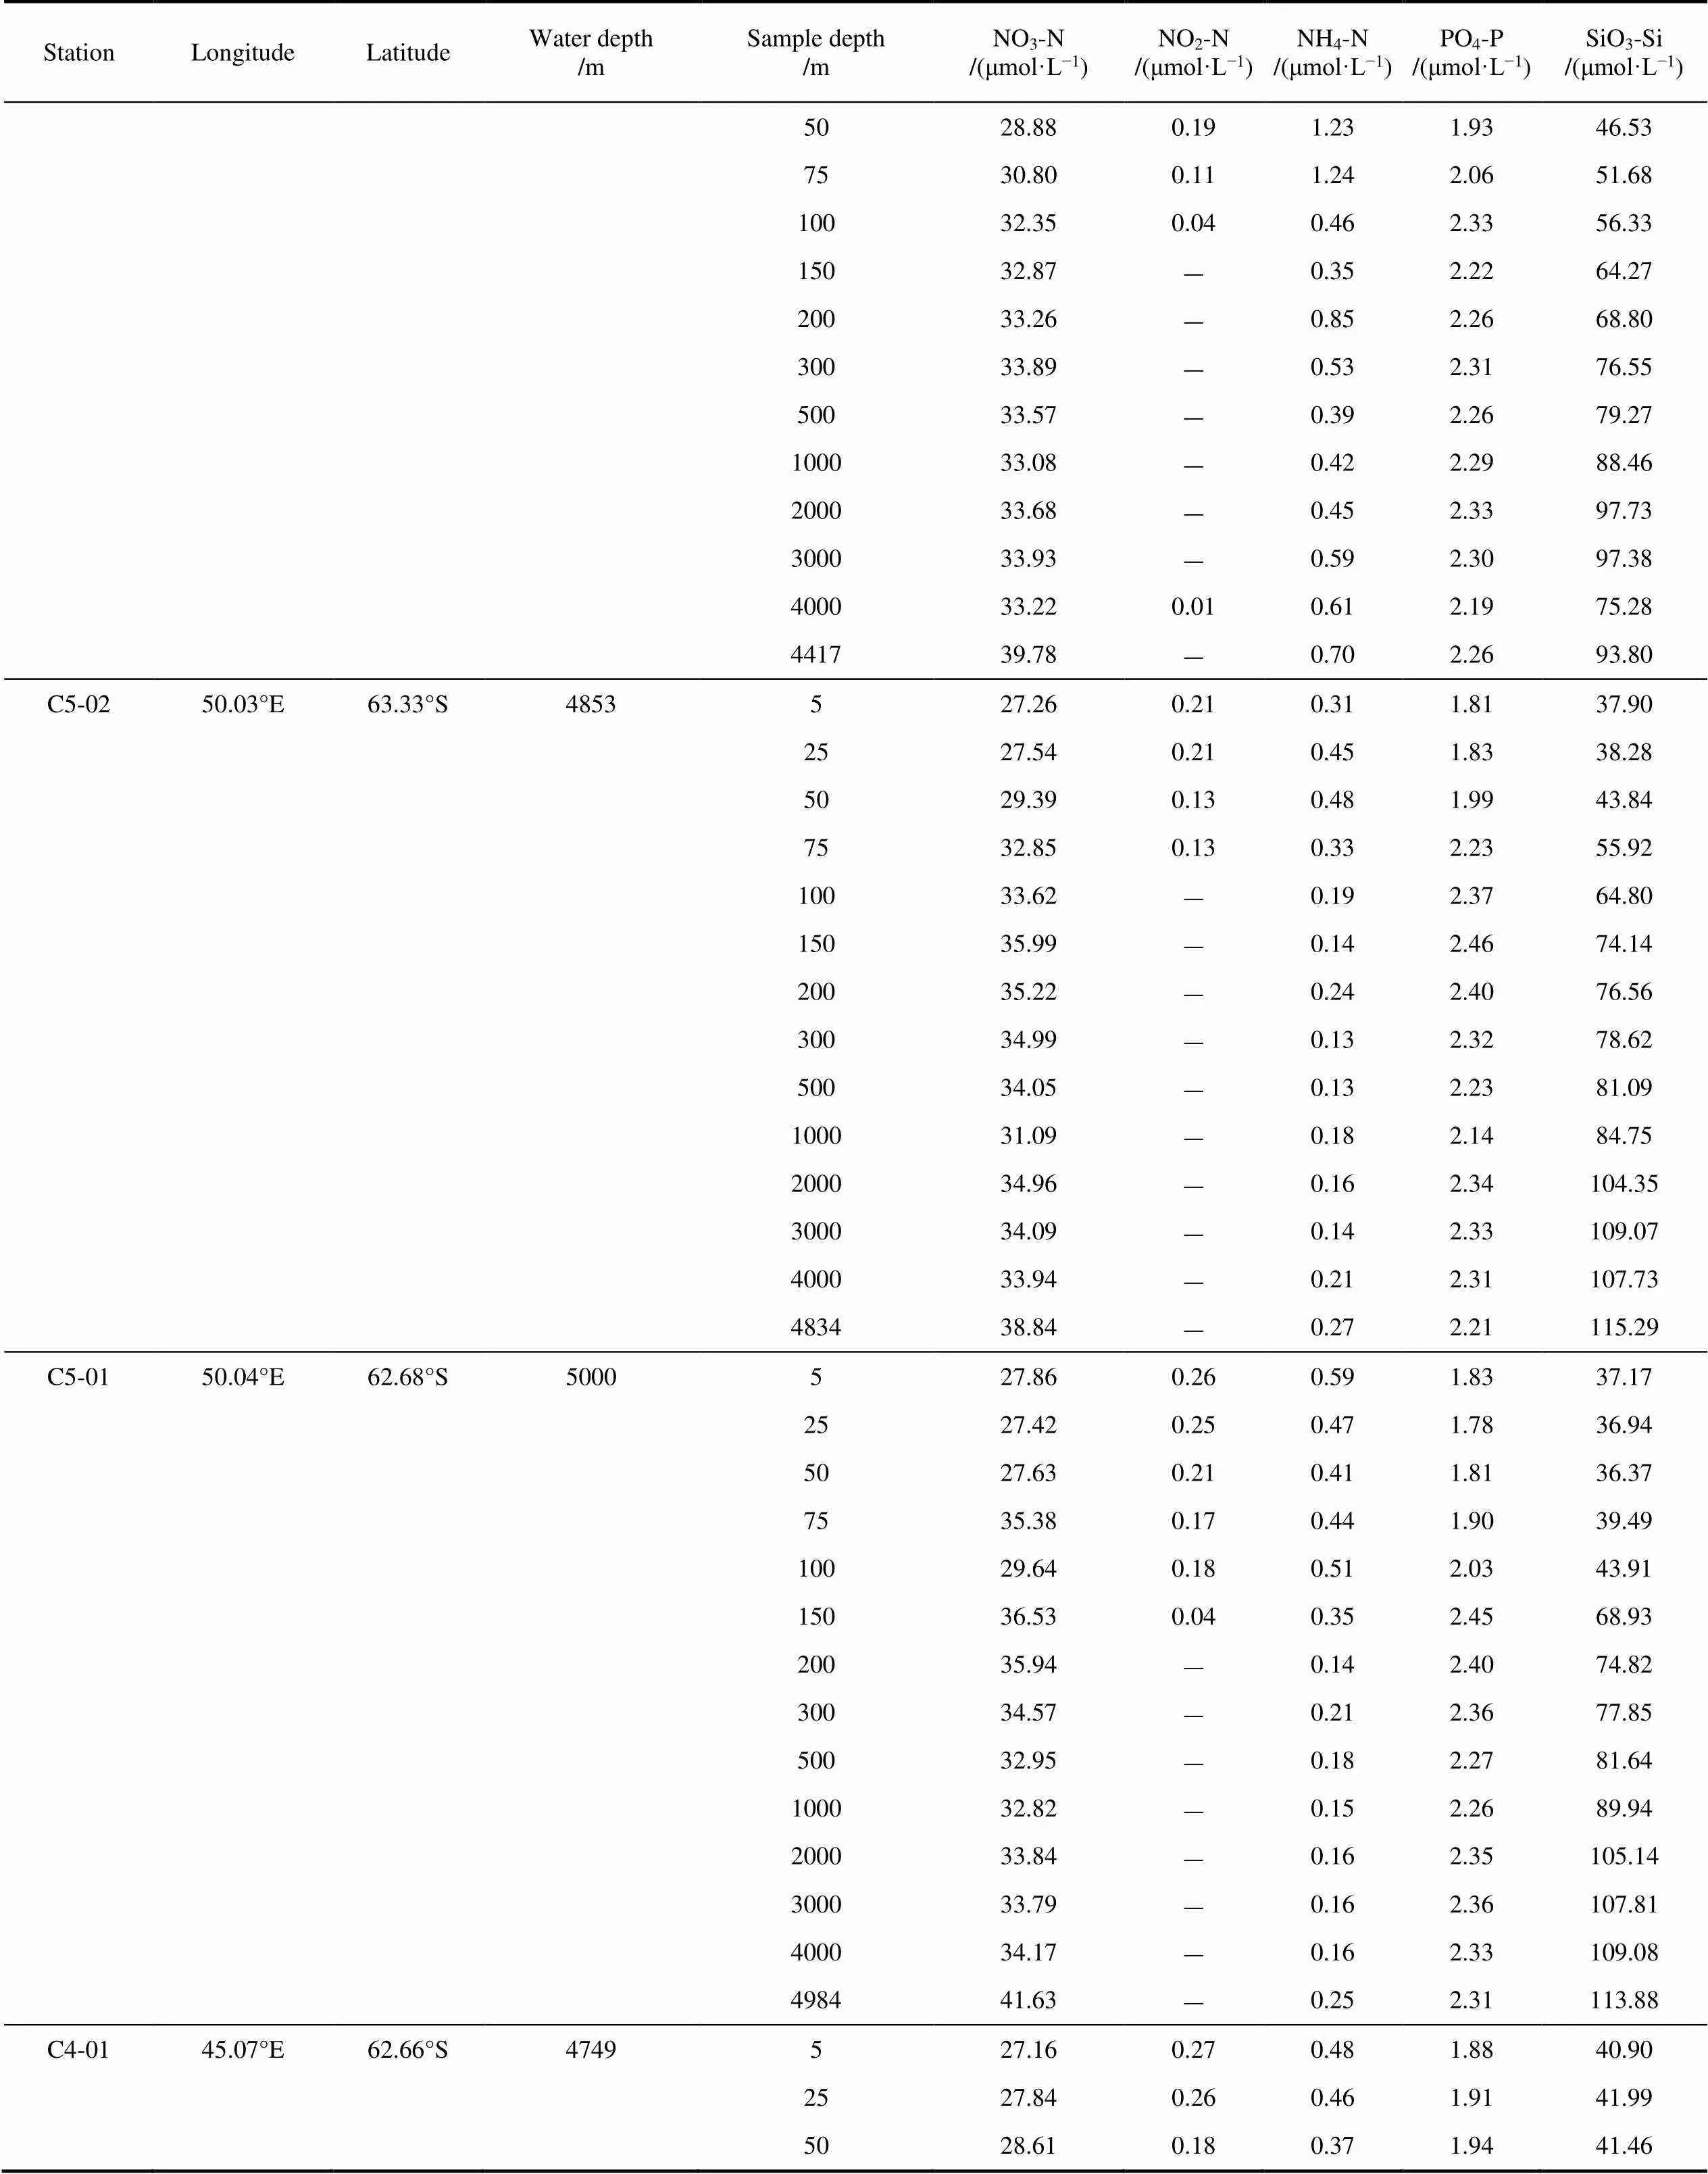
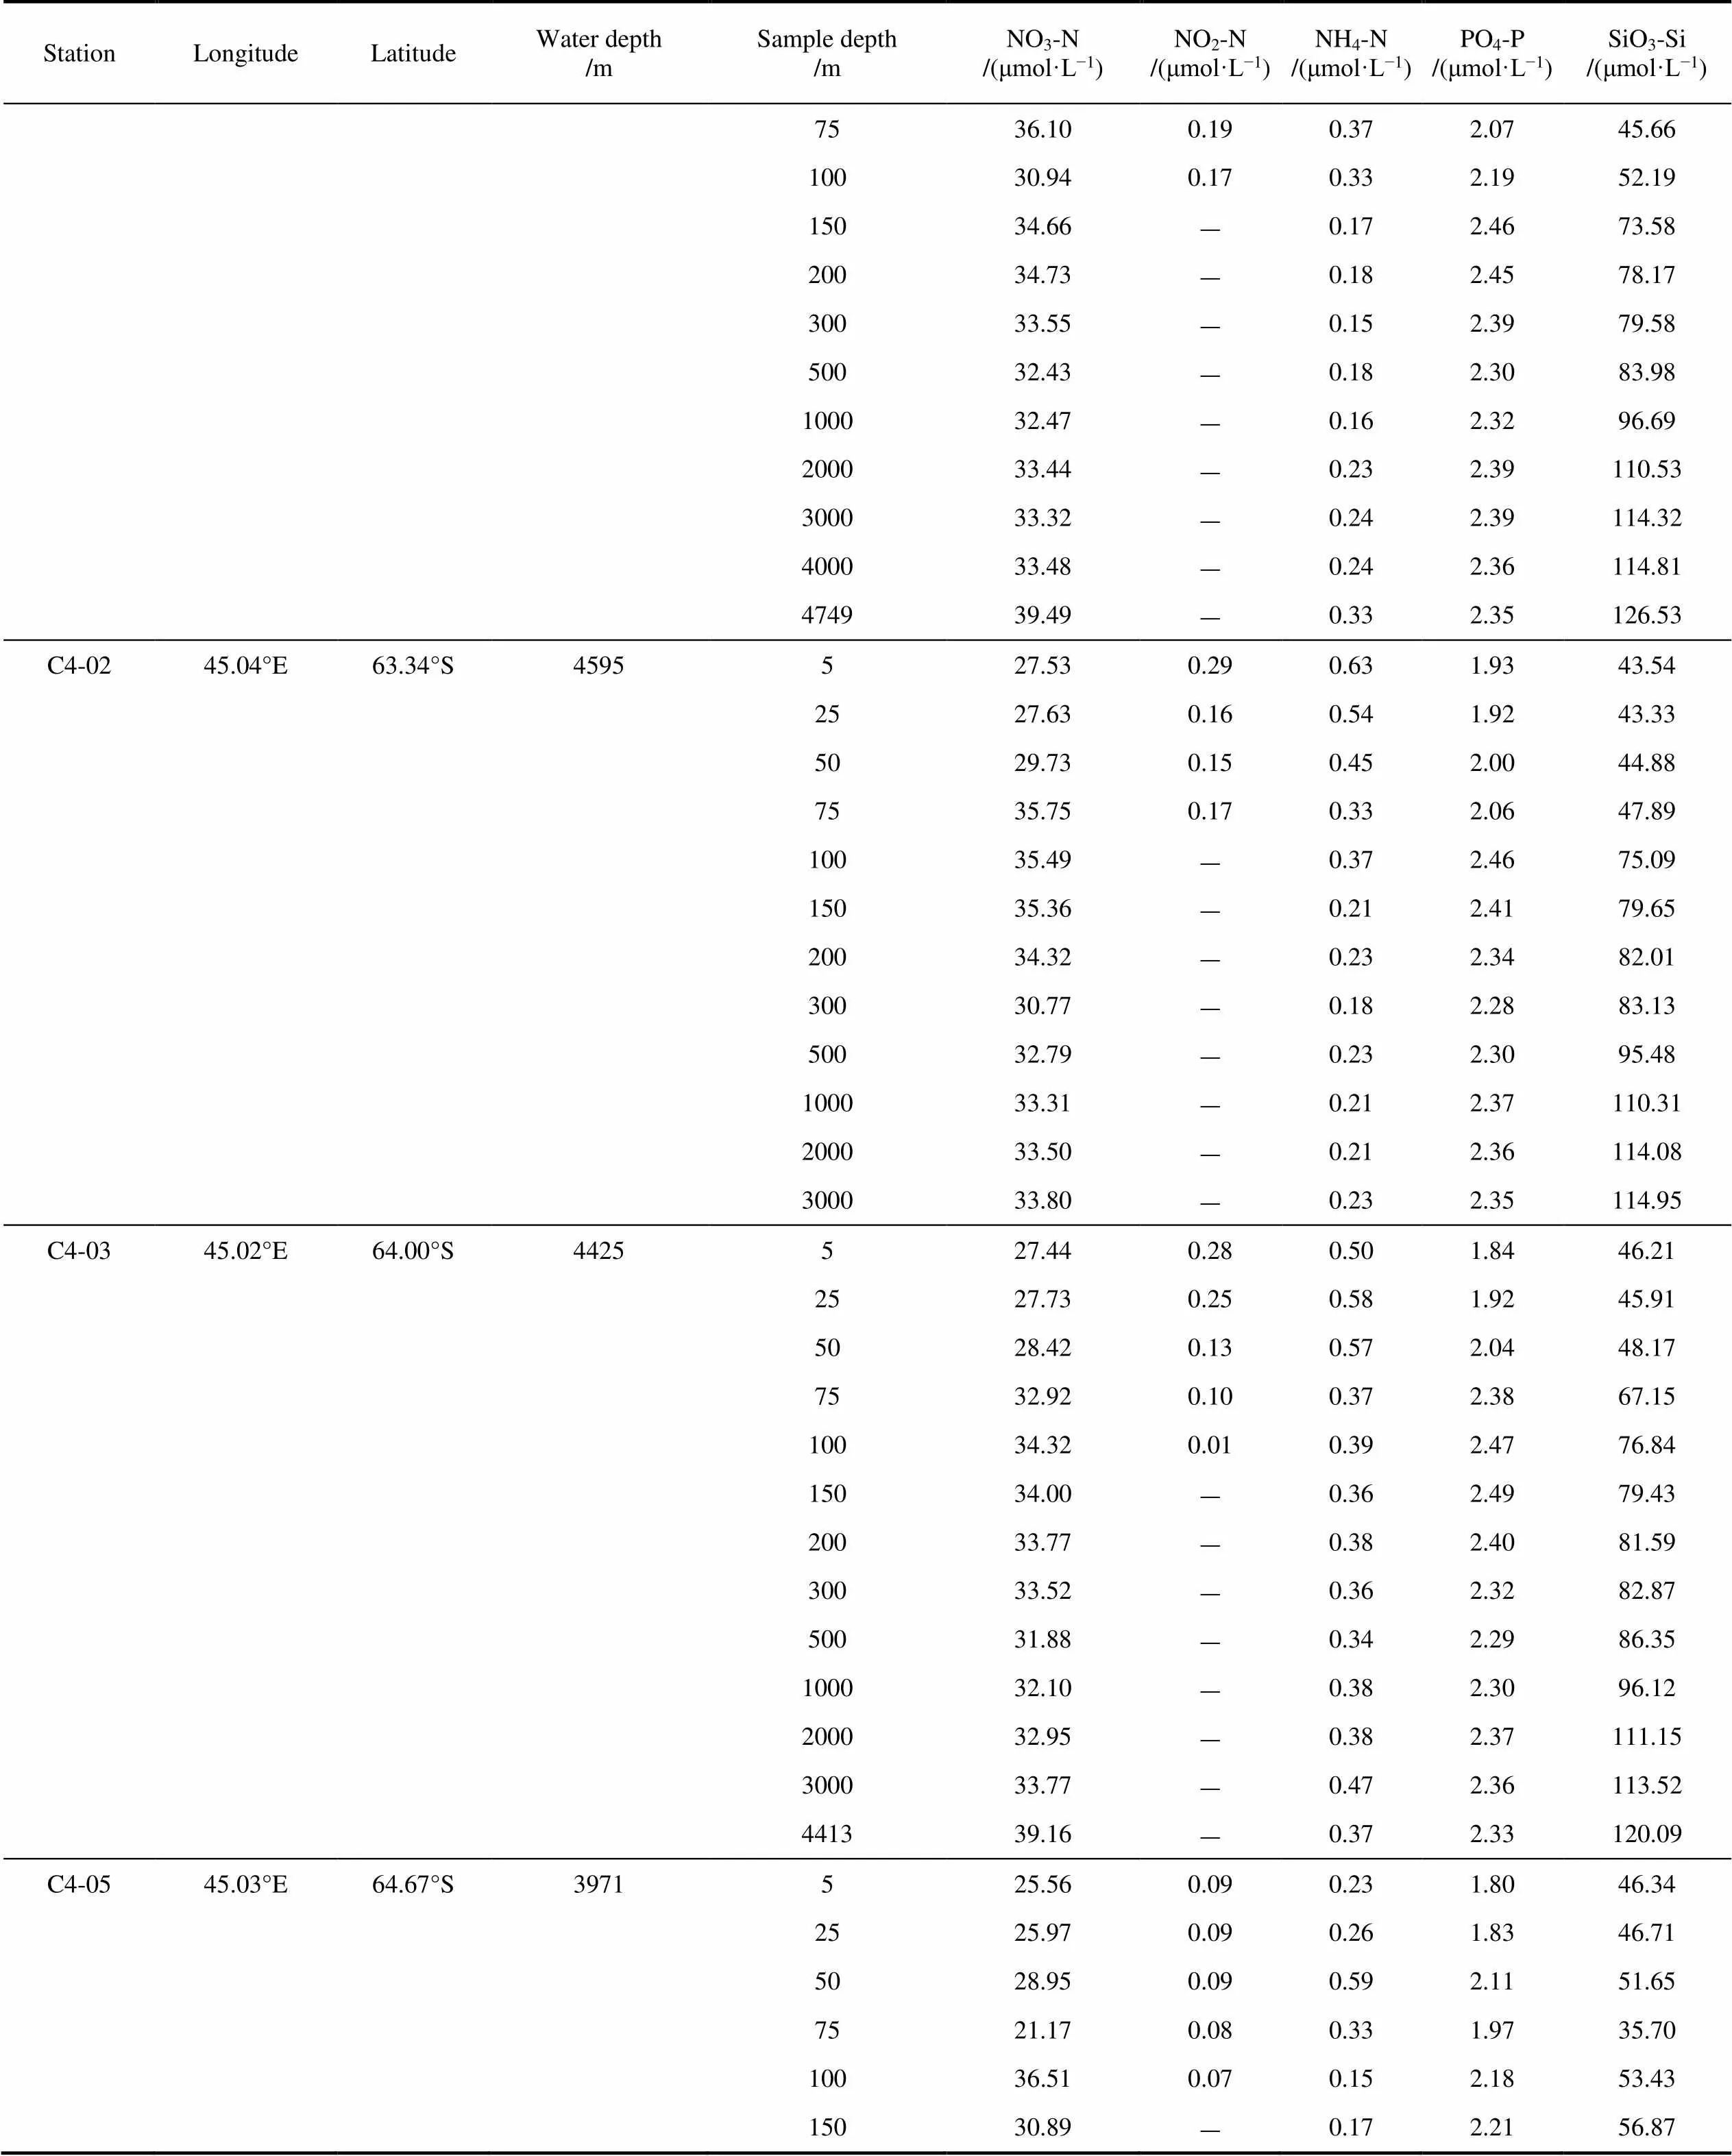
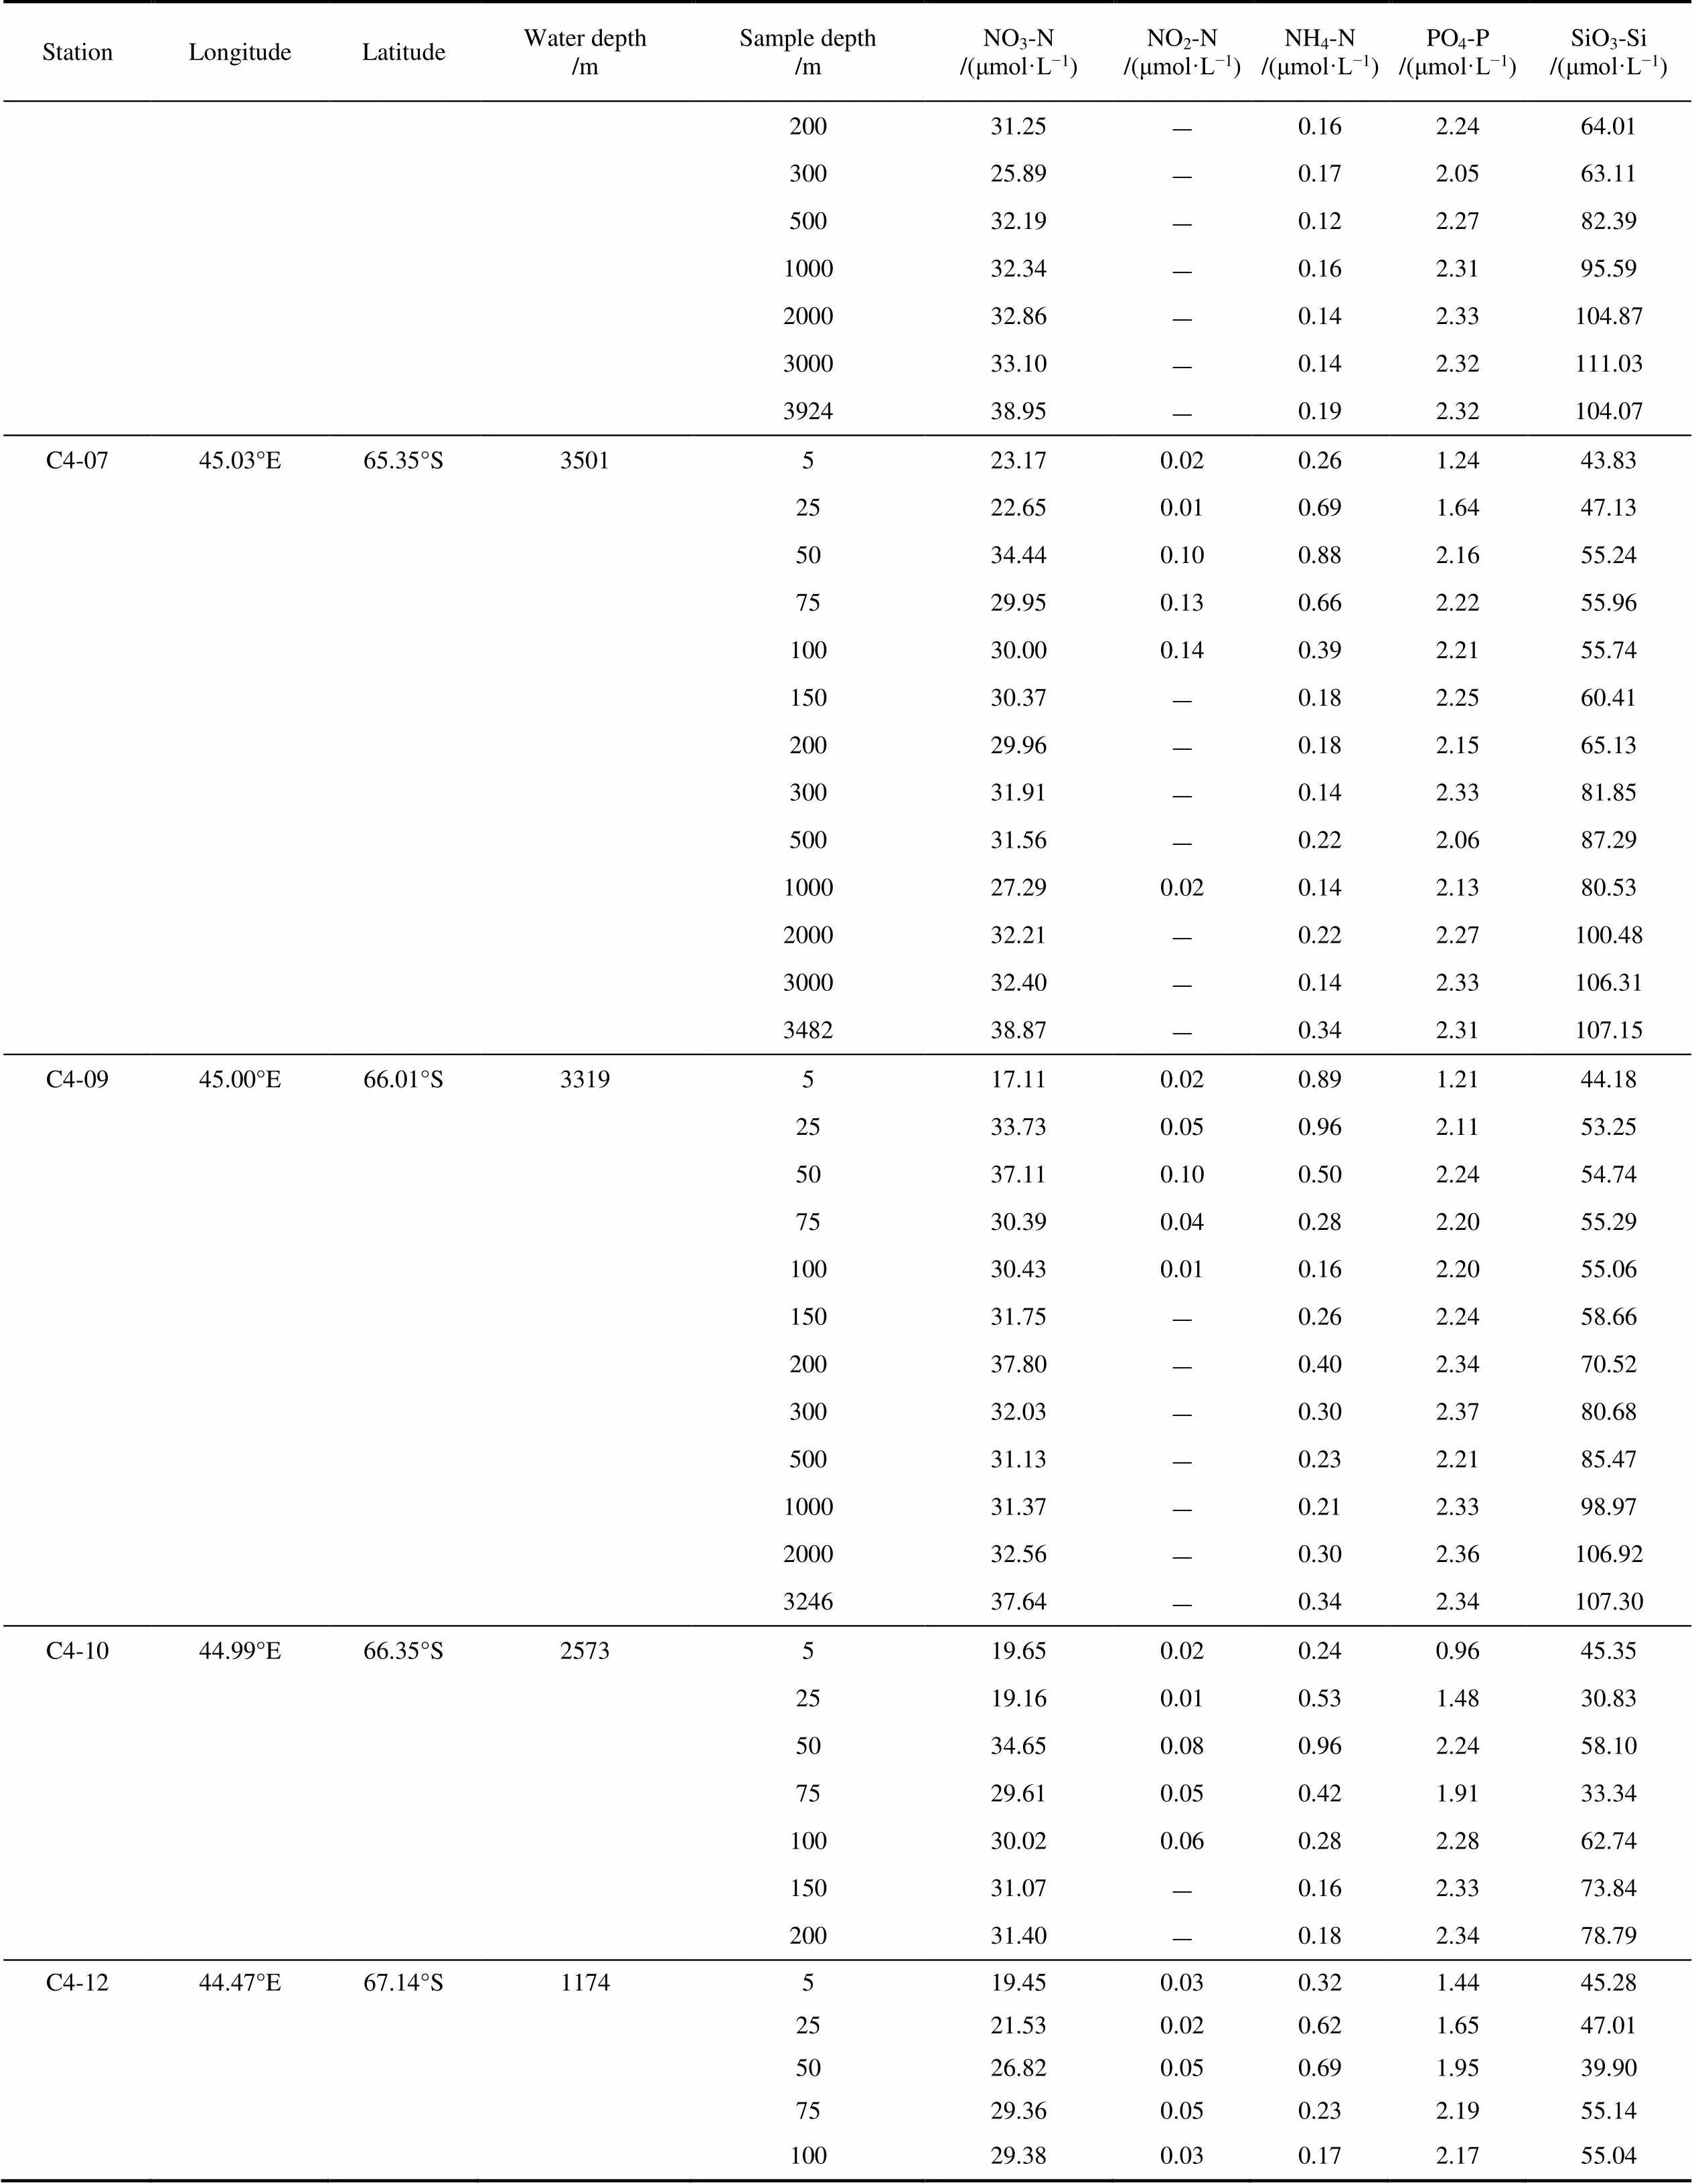
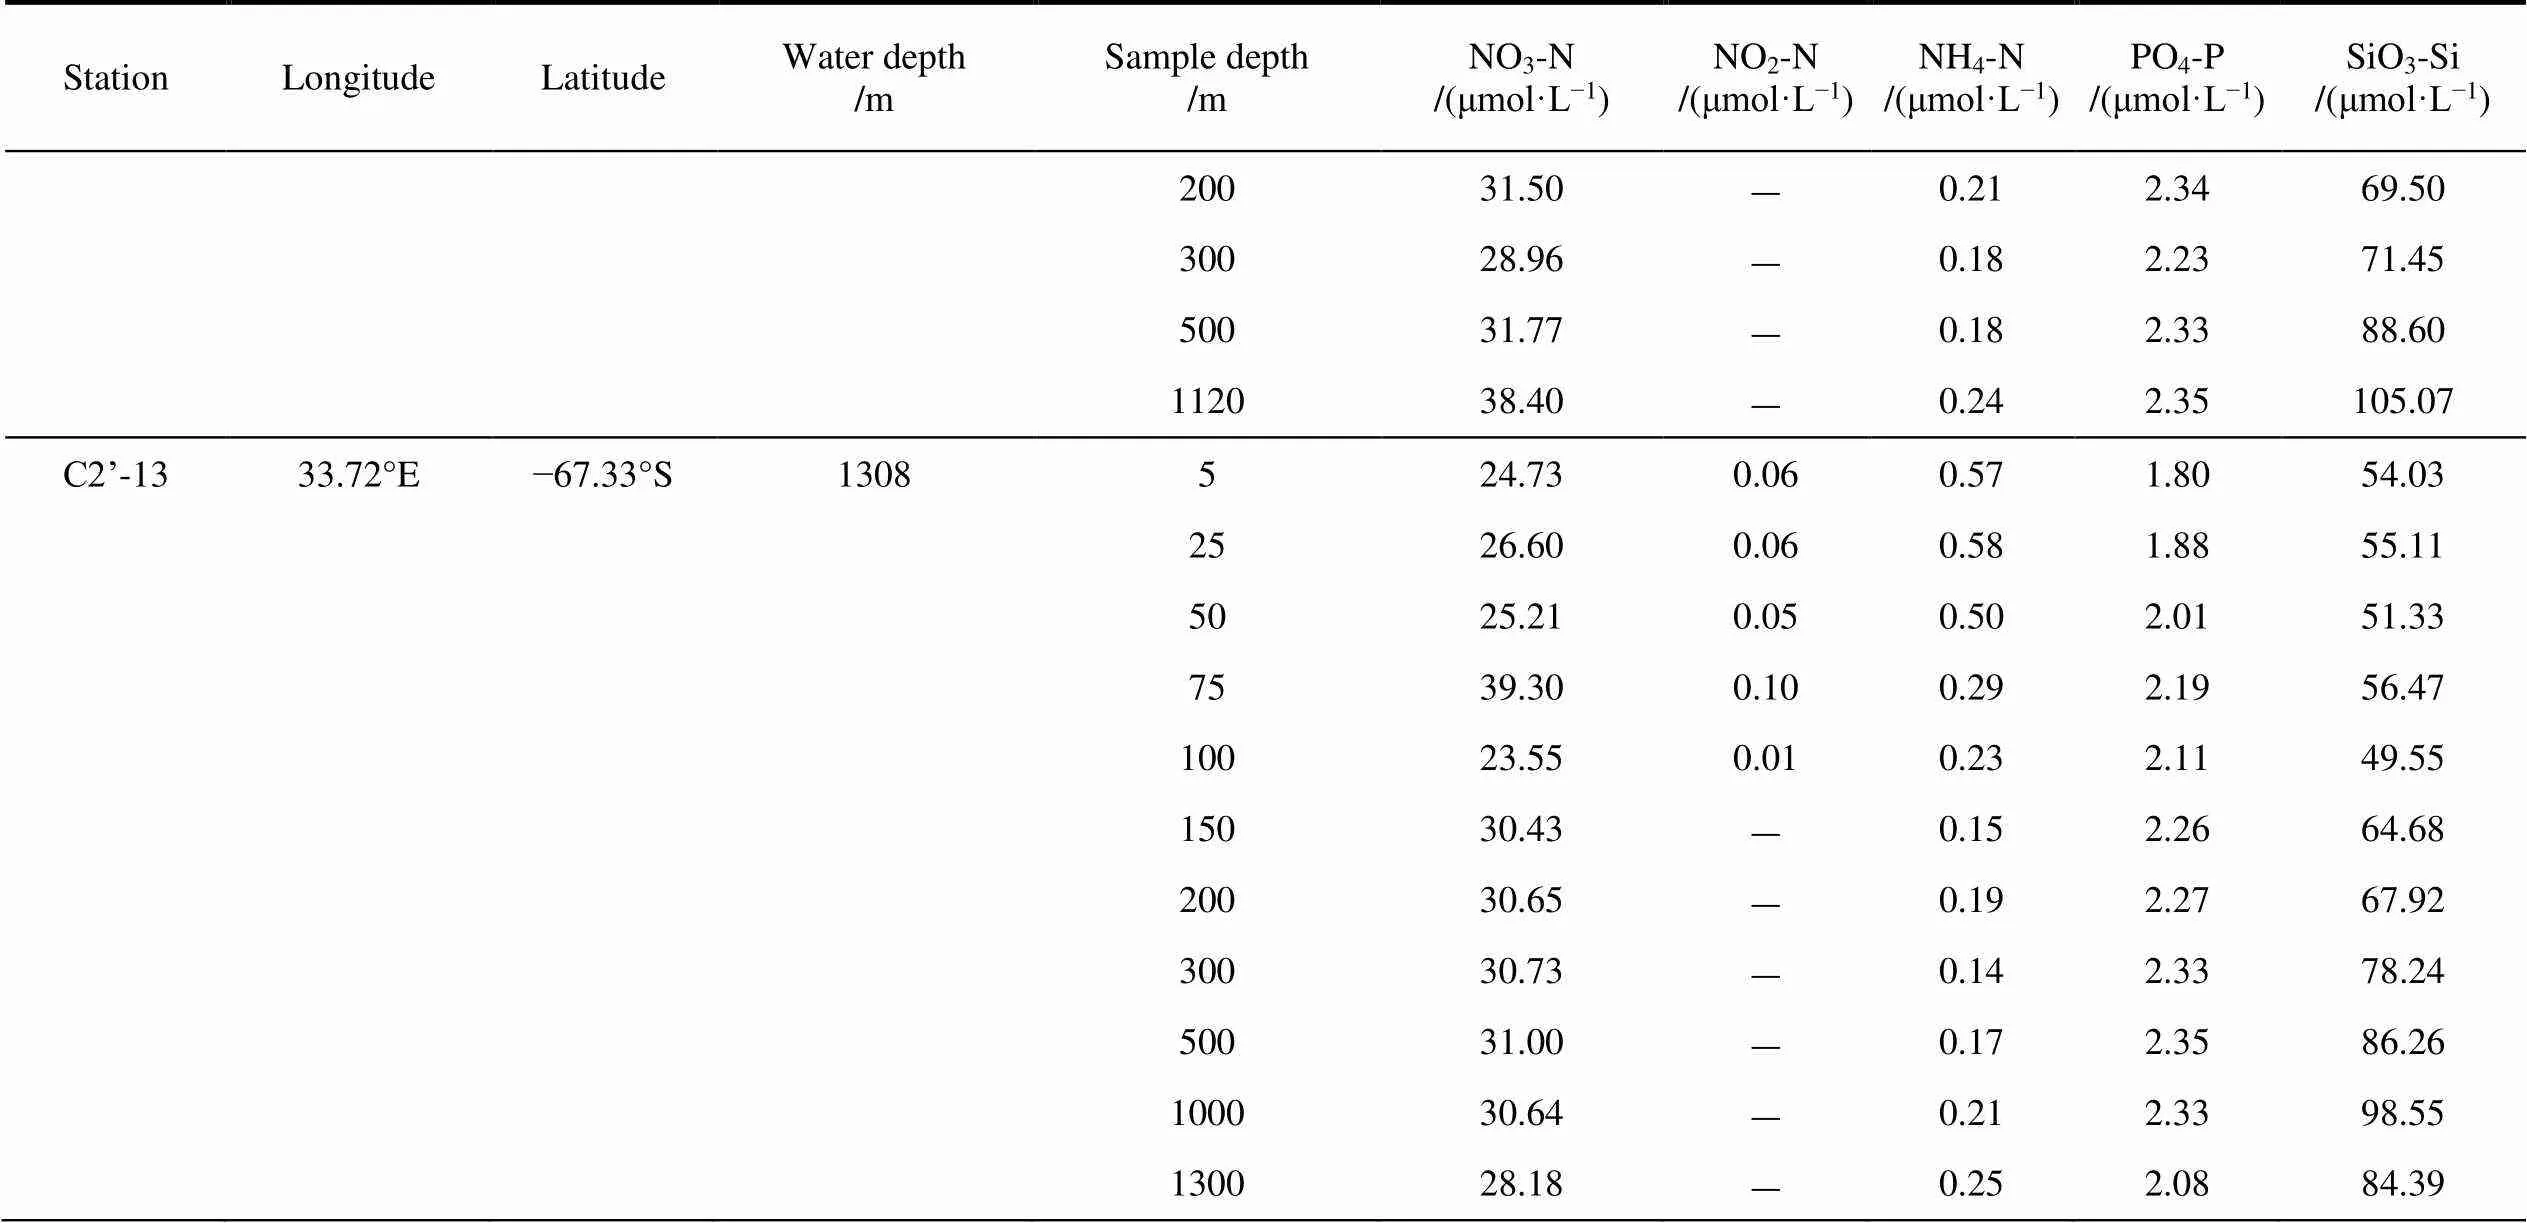
Table S1 The concentrations of dissolved nutrients (NO3-N, NO2-N, NH4-N, PO4-P and SiO3-Si) in the Cosmonaut Sea of the whole water depth
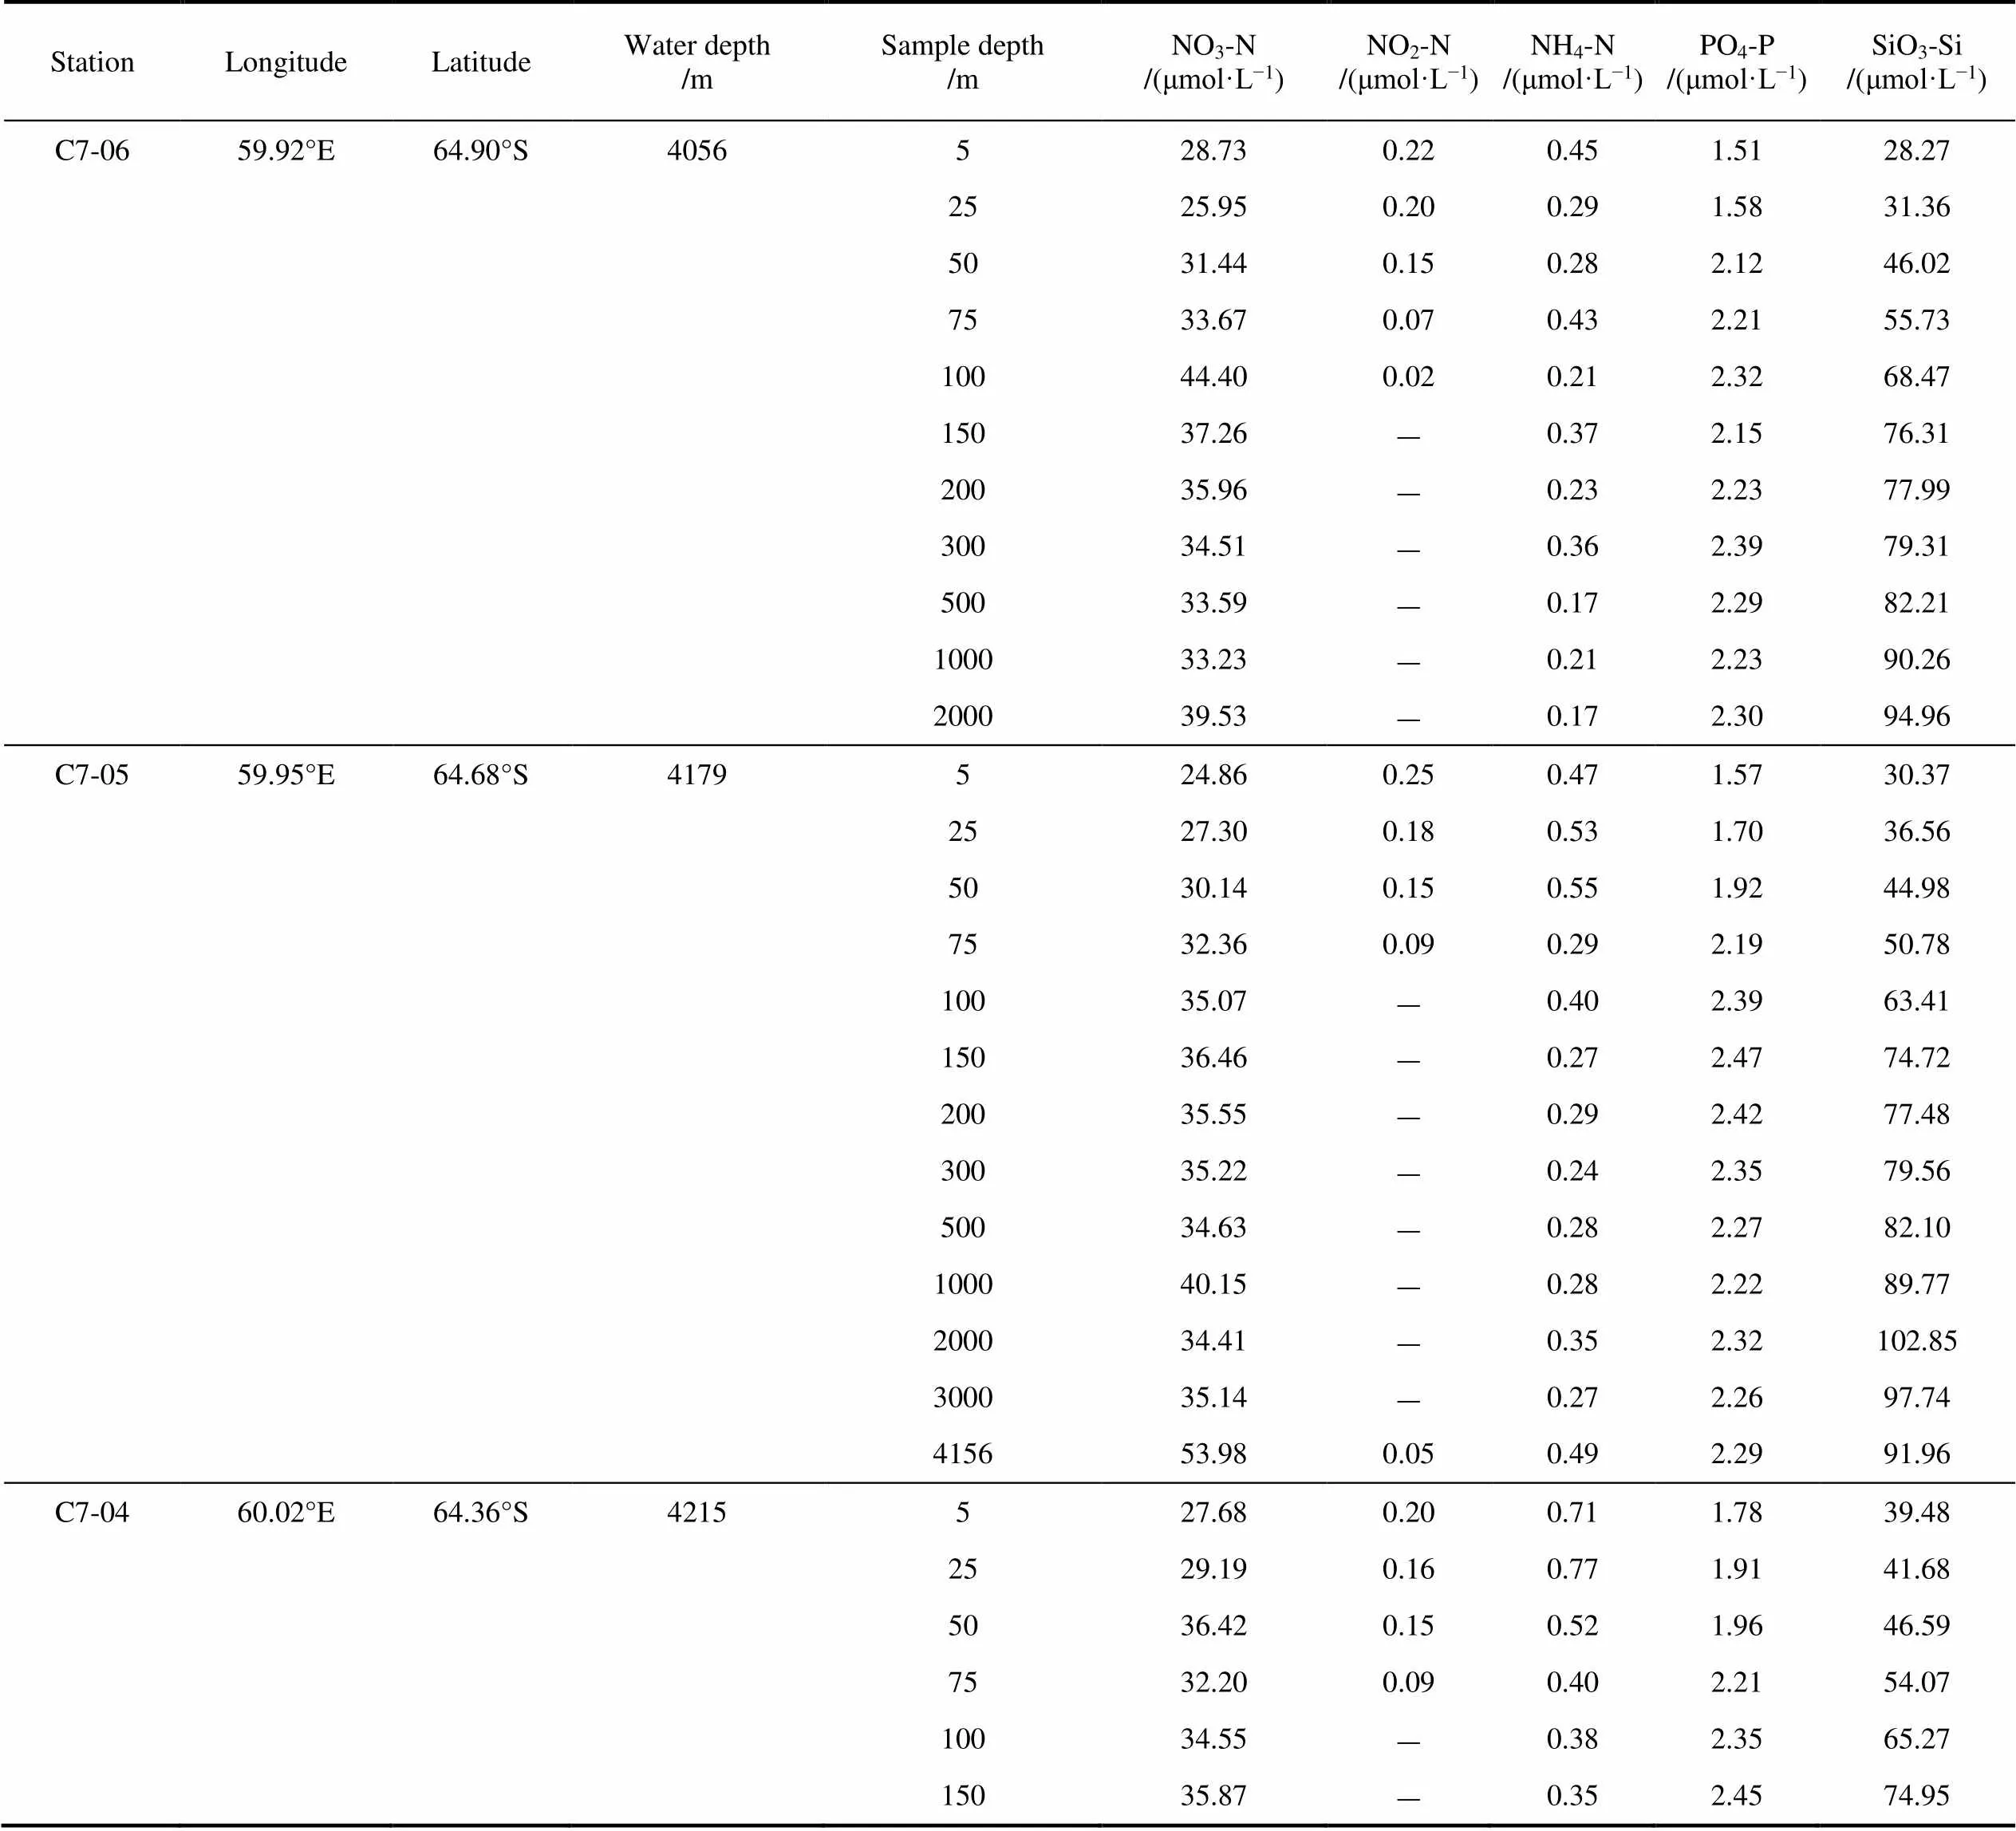
StationLongitudeLatitudeWater depth/mSample depth/mNO3-N/(μmol·L−1)NO2-N/(μmol·L−1)NH4-N/(μmol·L−1)PO4-P/(μmol·L−1)SiO3-Si/(μmol·L−1) C7-0659.92°E64.90°S4056528.730.220.451.5128.27 2525.950.200.291.5831.36 5031.440.150.282.1246.02 7533.670.070.432.2155.73 10044.400.020.212.3268.47 15037.26–0.372.1576.31 20035.96–0.232.2377.99 30034.51–0.362.3979.31 50033.59–0.172.2982.21 100033.23–0.212.2390.26 200039.53–0.172.3094.96 C7-0559.95°E64.68°S4179524.860.250.471.5730.37 2527.300.180.531.7036.56 5030.140.150.551.9244.98 7532.360.090.292.1950.78 10035.07–0.402.3963.41 15036.46–0.272.4774.72 20035.55–0.292.4277.48 30035.22–0.242.3579.56 50034.63–0.282.2782.10 100040.15–0.282.2289.77 200034.41–0.352.32102.85 300035.14–0.272.2697.74 415653.980.050.492.2991.96 C7-0460.02°E64.36°S4215527.680.200.711.7839.48 2529.190.160.771.9141.68 5036.420.150.521.9646.59 7532.200.090.402.2154.07 10034.55–0.382.3565.27 15035.87–0.352.4574.95
Continued
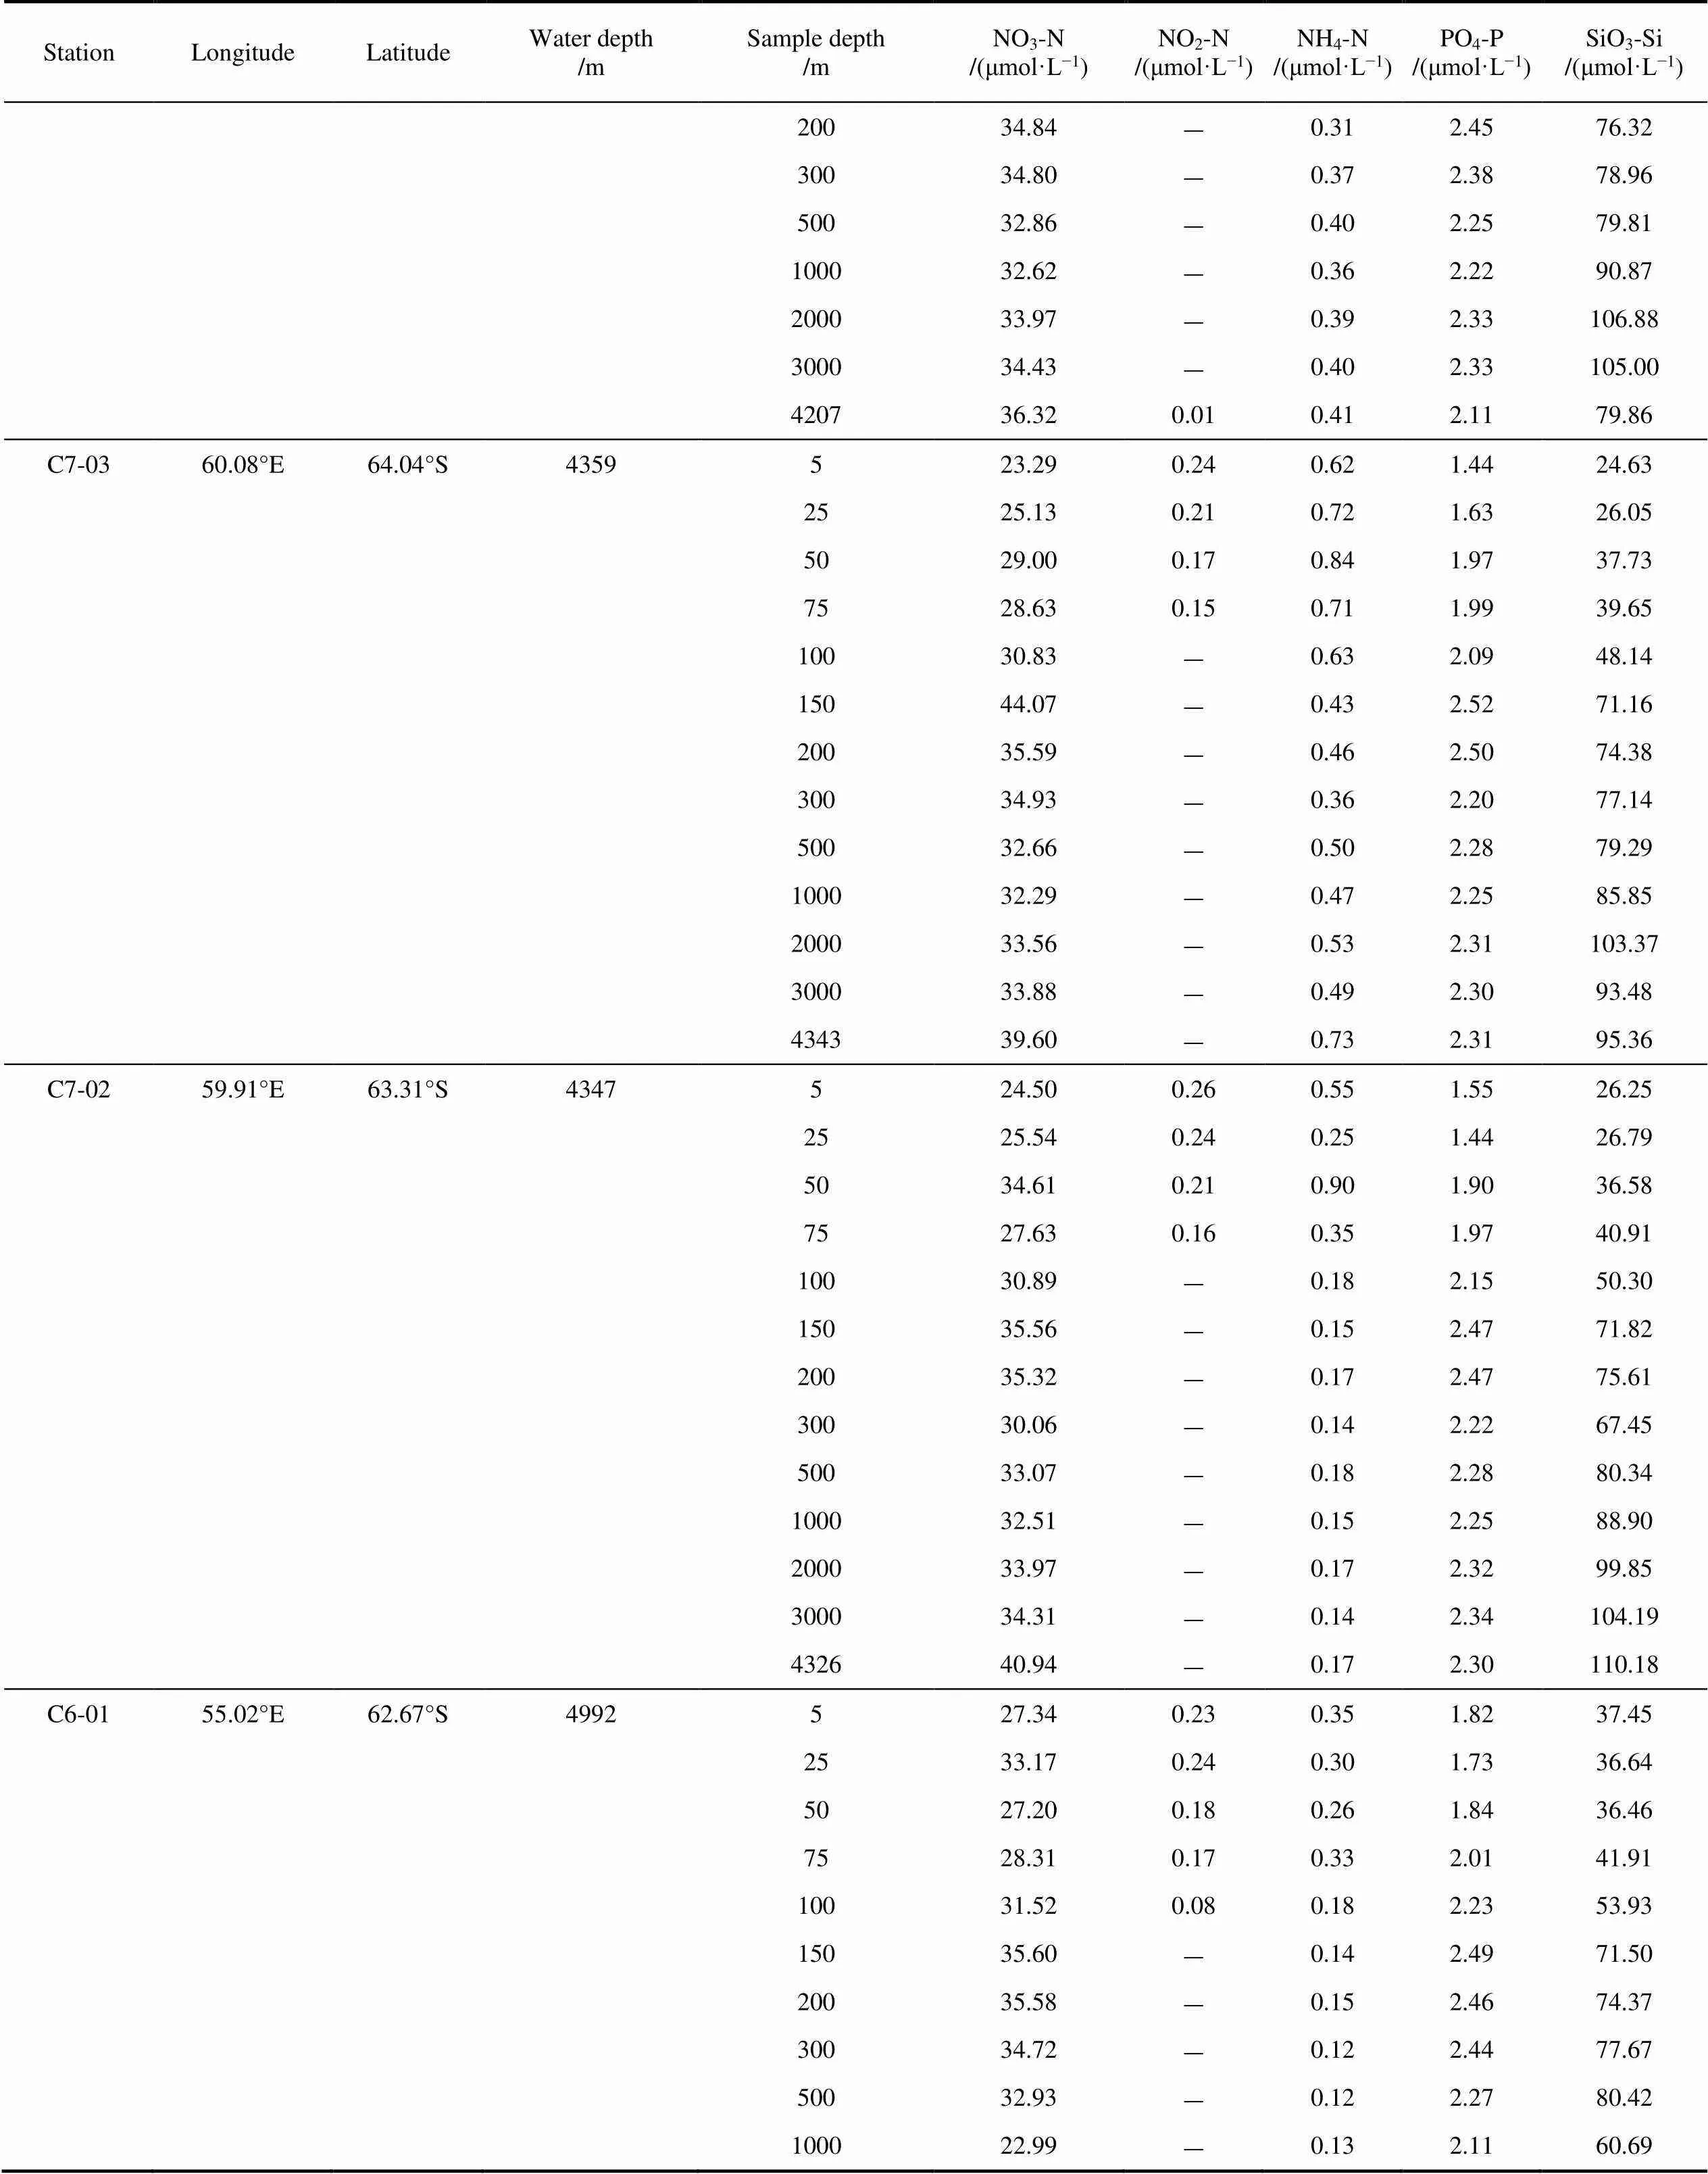
StationLongitudeLatitudeWater depth/mSample depth/mNO3-N/(μmol·L−1)NO2-N/(μmol·L−1)NH4-N/(μmol·L−1)PO4-P/(μmol·L−1)SiO3-Si/(μmol·L−1) 20034.84–0.312.4576.32 30034.80–0.372.3878.96 50032.86–0.402.2579.81 100032.62–0.362.2290.87 200033.97–0.392.33106.88 300034.43–0.402.33105.00 420736.320.010.412.1179.86 C7-0360.08°E64.04°S4359523.290.240.621.4424.63 2525.130.210.721.6326.05 5029.000.170.841.9737.73 7528.630.150.711.9939.65 10030.83–0.632.0948.14 15044.07–0.432.5271.16 20035.59–0.462.5074.38 30034.93–0.362.2077.14 50032.66–0.502.2879.29 100032.29–0.472.2585.85 200033.56–0.532.31103.37 300033.88–0.492.3093.48 434339.60–0.732.3195.36 C7-0259.91°E63.31°S4347524.500.260.551.5526.25 2525.540.240.251.4426.79 5034.610.210.901.9036.58 7527.630.160.351.9740.91 10030.89–0.182.1550.30 15035.56–0.152.4771.82 20035.32–0.172.4775.61 30030.06–0.142.2267.45 50033.07–0.182.2880.34 100032.51–0.152.2588.90 200033.97–0.172.3299.85 300034.31–0.142.34104.19 432640.94–0.172.30110.18 C6-0155.02°E62.67°S4992527.340.230.351.8237.45 2533.170.240.301.7336.64 5027.200.180.261.8436.46 7528.310.170.332.0141.91 10031.520.080.182.2353.93 15035.60–0.142.4971.50 20035.58–0.152.4674.37 30034.72–0.122.4477.67 50032.93–0.122.2780.42 100022.99–0.132.1160.69
Continued
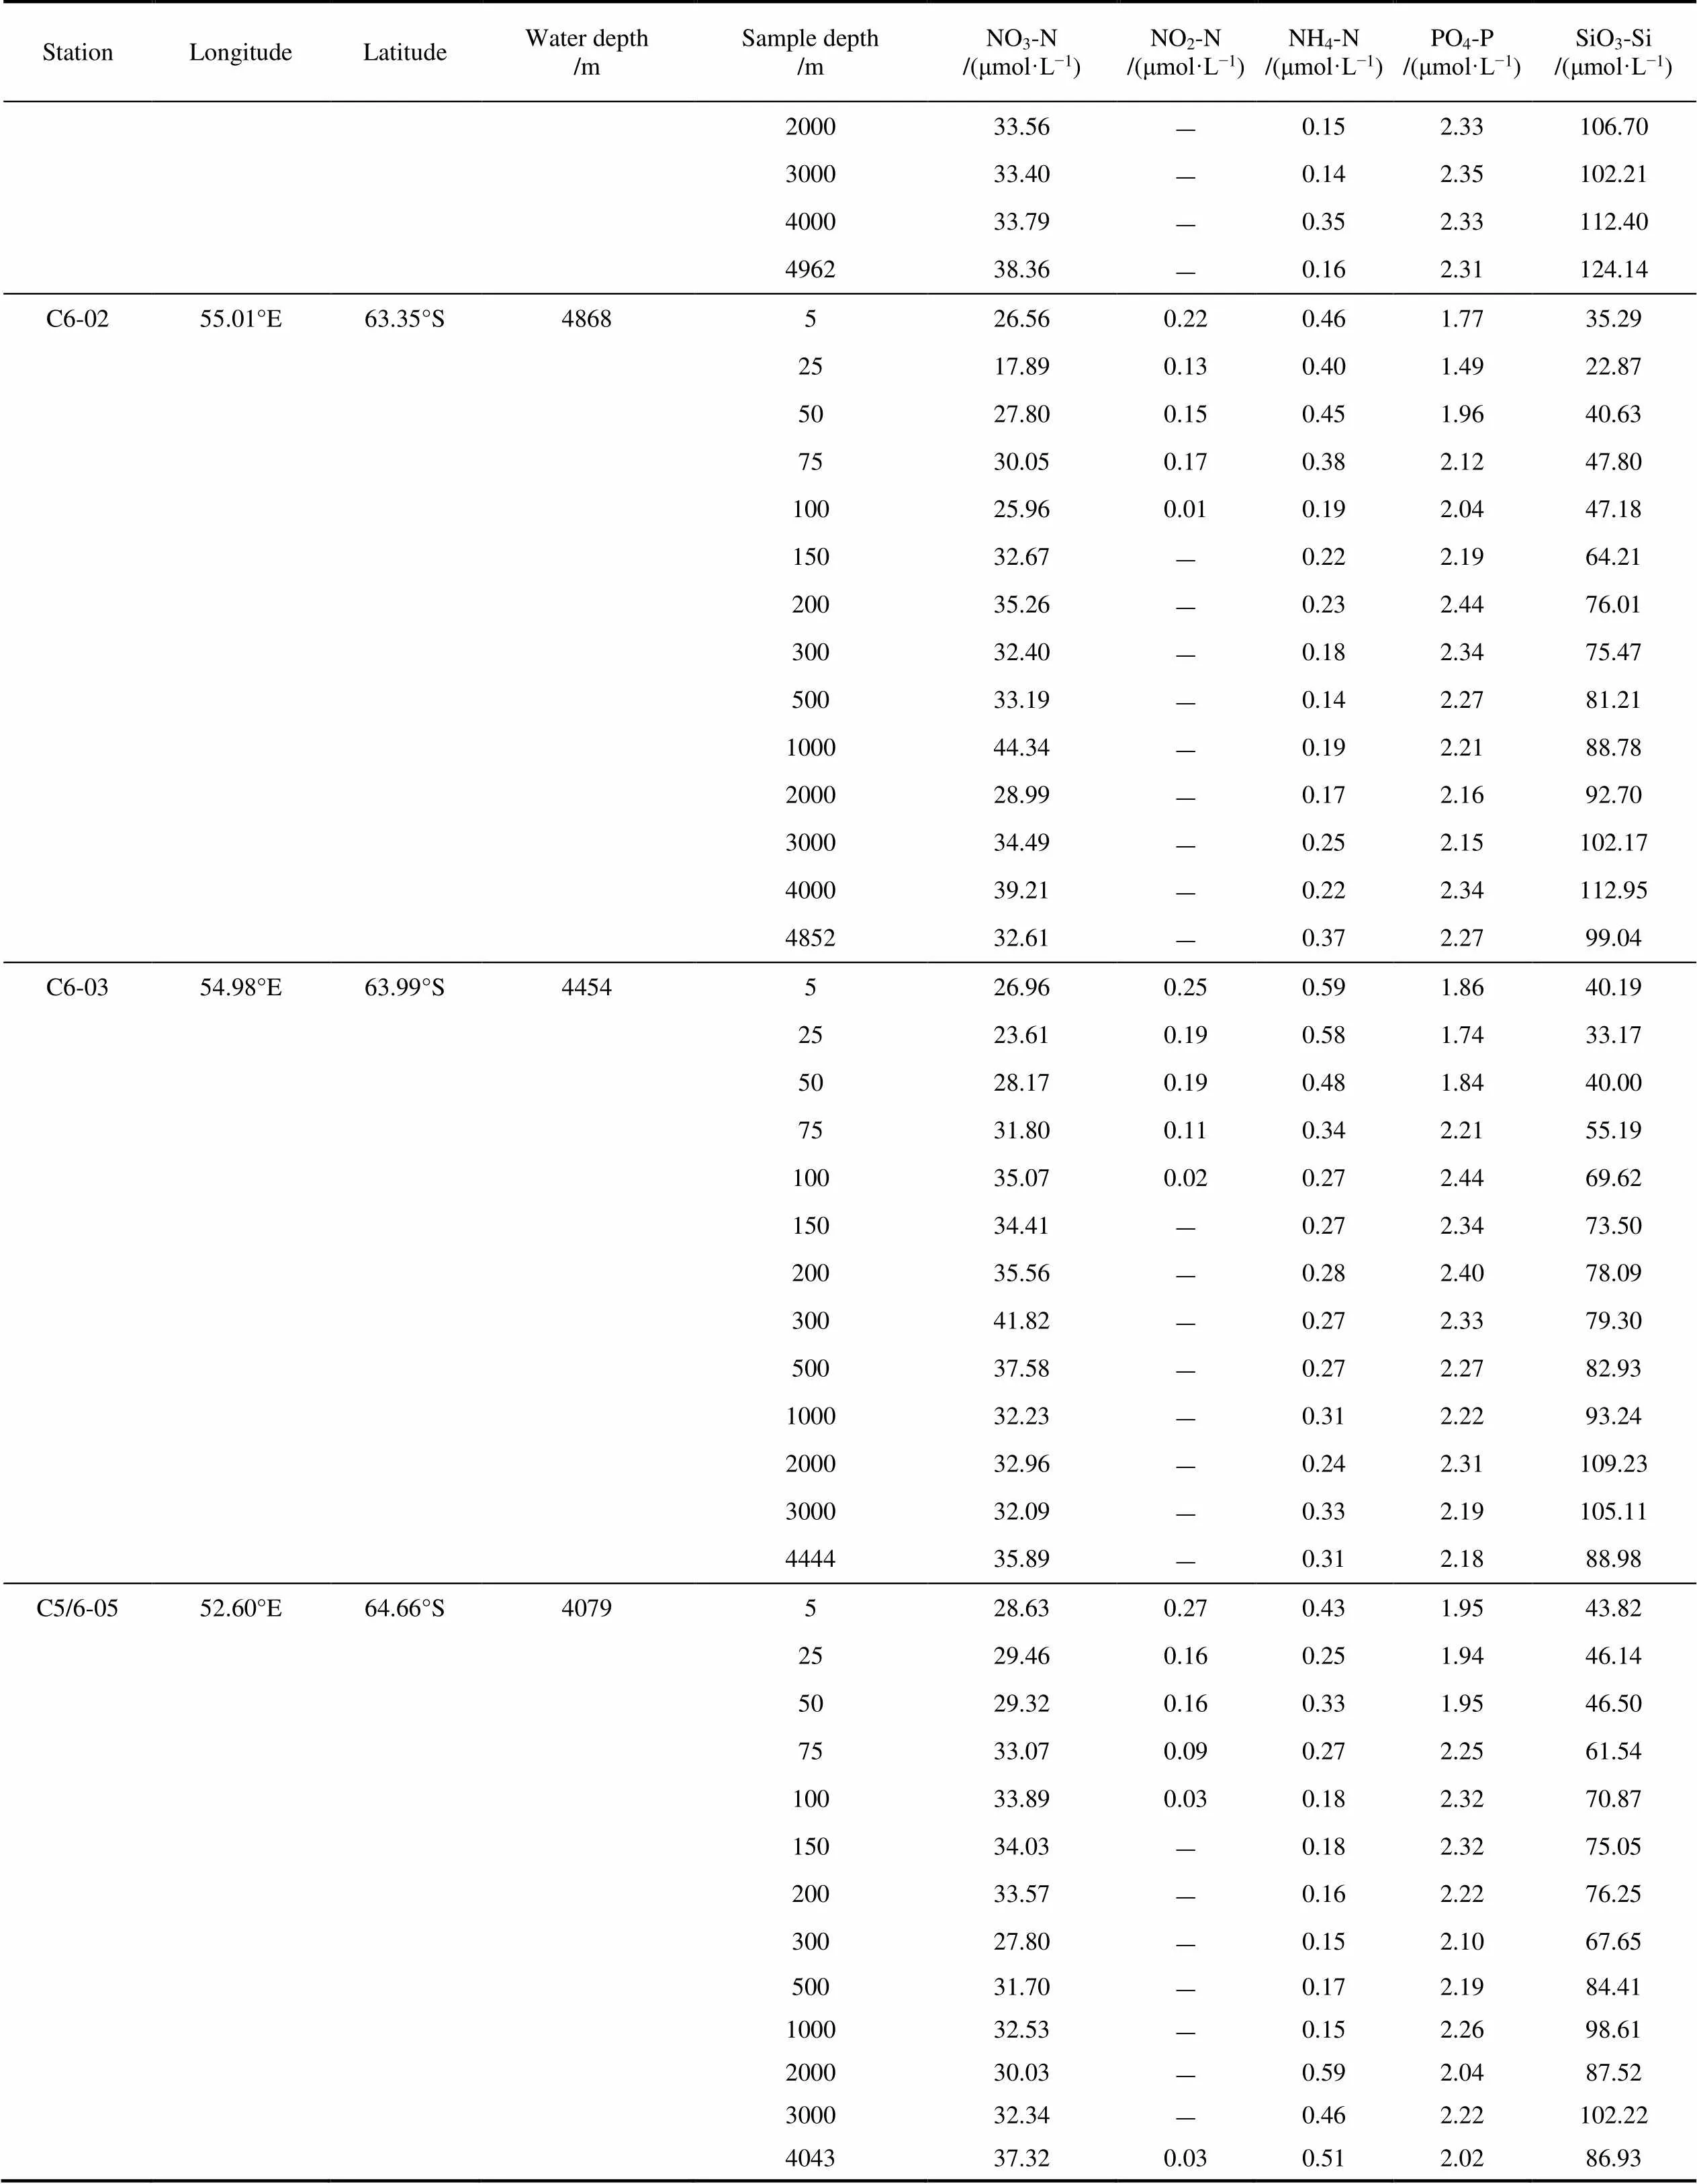
StationLongitudeLatitudeWater depth/mSample depth/mNO3-N/(μmol·L−1)NO2-N/(μmol·L−1)NH4-N/(μmol·L−1)PO4-P/(μmol·L−1)SiO3-Si/(μmol·L−1) 200033.56–0.152.33106.70 300033.40–0.142.35102.21 400033.79–0.352.33112.40 496238.36–0.162.31124.14 C6-0255.01°E63.35°S4868526.560.220.461.7735.29 2517.890.130.401.4922.87 5027.800.150.451.9640.63 7530.050.170.382.1247.80 10025.960.010.192.0447.18 15032.67–0.222.1964.21 20035.26–0.232.4476.01 30032.40–0.182.3475.47 50033.19–0.142.2781.21 100044.34–0.192.2188.78 200028.99–0.172.1692.70 300034.49–0.252.15102.17 400039.21–0.222.34112.95 485232.61–0.372.2799.04 C6-0354.98°E63.99°S4454526.960.250.591.8640.19 2523.610.190.581.7433.17 5028.170.190.481.8440.00 7531.800.110.342.2155.19 10035.070.020.272.4469.62 15034.41–0.272.3473.50 20035.56–0.282.4078.09 30041.82–0.272.3379.30 50037.58–0.272.2782.93 100032.23–0.312.2293.24 200032.96–0.242.31109.23 300032.09–0.332.19105.11 444435.89–0.312.1888.98 C5/6-0552.60°E64.66°S4079528.630.270.431.9543.82 2529.460.160.251.9446.14 5029.320.160.331.9546.50 7533.070.090.272.2561.54 10033.890.030.182.3270.87 15034.03–0.182.3275.05 20033.57–0.162.2276.25 30027.80–0.152.1067.65 50031.70–0.172.1984.41 100032.53–0.152.2698.61 200030.03–0.592.0487.52 300032.34–0.462.22102.22 404337.320.030.512.0286.93
Continued

StationLongitudeLatitudeWater depth/mSample depth/mNO3-N/(μmol·L−1)NO2-N/(μmol·L−1)NH4-N/(μmol·L−1)PO4-P/(μmol·L−1)SiO3-Si/(μmol·L−1) C5/6-0652.50°E65.03°S2999527.590.200.531.8143.66 2529.000.180.401.9144.81 5038.280.150.351.9645.74 7533.070.071.382.1655.15 10026.590.011.532.0044.55 15027.26–1.582.0850.81 20034.00–0.212.2672.98 C5/6-0752.59°E65.36°S2793528.270.180.421.8544.26 2525.640.160.411.6538.96 5029.480.120.461.9446.33 7529.550.080.412.0248.56 10032.660.050.302.1554.72 15032.52–0.192.1655.92 20033.04–0.272.1558.38 30031.25–0.212.1967.50 50033.17–0.262.2382.13 100033.00–0.222.2698.48 200033.27–0.292.25105.55 278339.38–0.362.26105.48 C5/6-0852.48°E65.64°S570528.270.150.551.8544.31 2528.310.140.491.8944.90 5028.680.050.491.9649.08 7532.050.040.402.1354.06 10032.600.020.432.1354.95 15032.55–0.332.1555.77 20030.64–0.292.1054.30 30029.36–0.232.0455.28 51042.02–0.302.2184.90 C5/6-0952.95°E65.60°S456528.180.180.531.8138.84 2524.980.110.601.7839.38 5028.810.050.401.9450.05 7527.390.060.551.9244.42 10032.200.030.872.1353.90 15033.470.021.102.0448.66 20030.81–0.182.1254.45 30030.87–0.182.1464.69 43527.22–0.232.1064.71 C5’-0851.57°E65.65°S1345527.290.090.221.7645.07 2526.880.060.181.7445.11 5028.550.060.721.9348.34 7529.200.060.771.9949.15 10037.400.060.792.0651.44 15030.790.020.632.1453.37
Continued
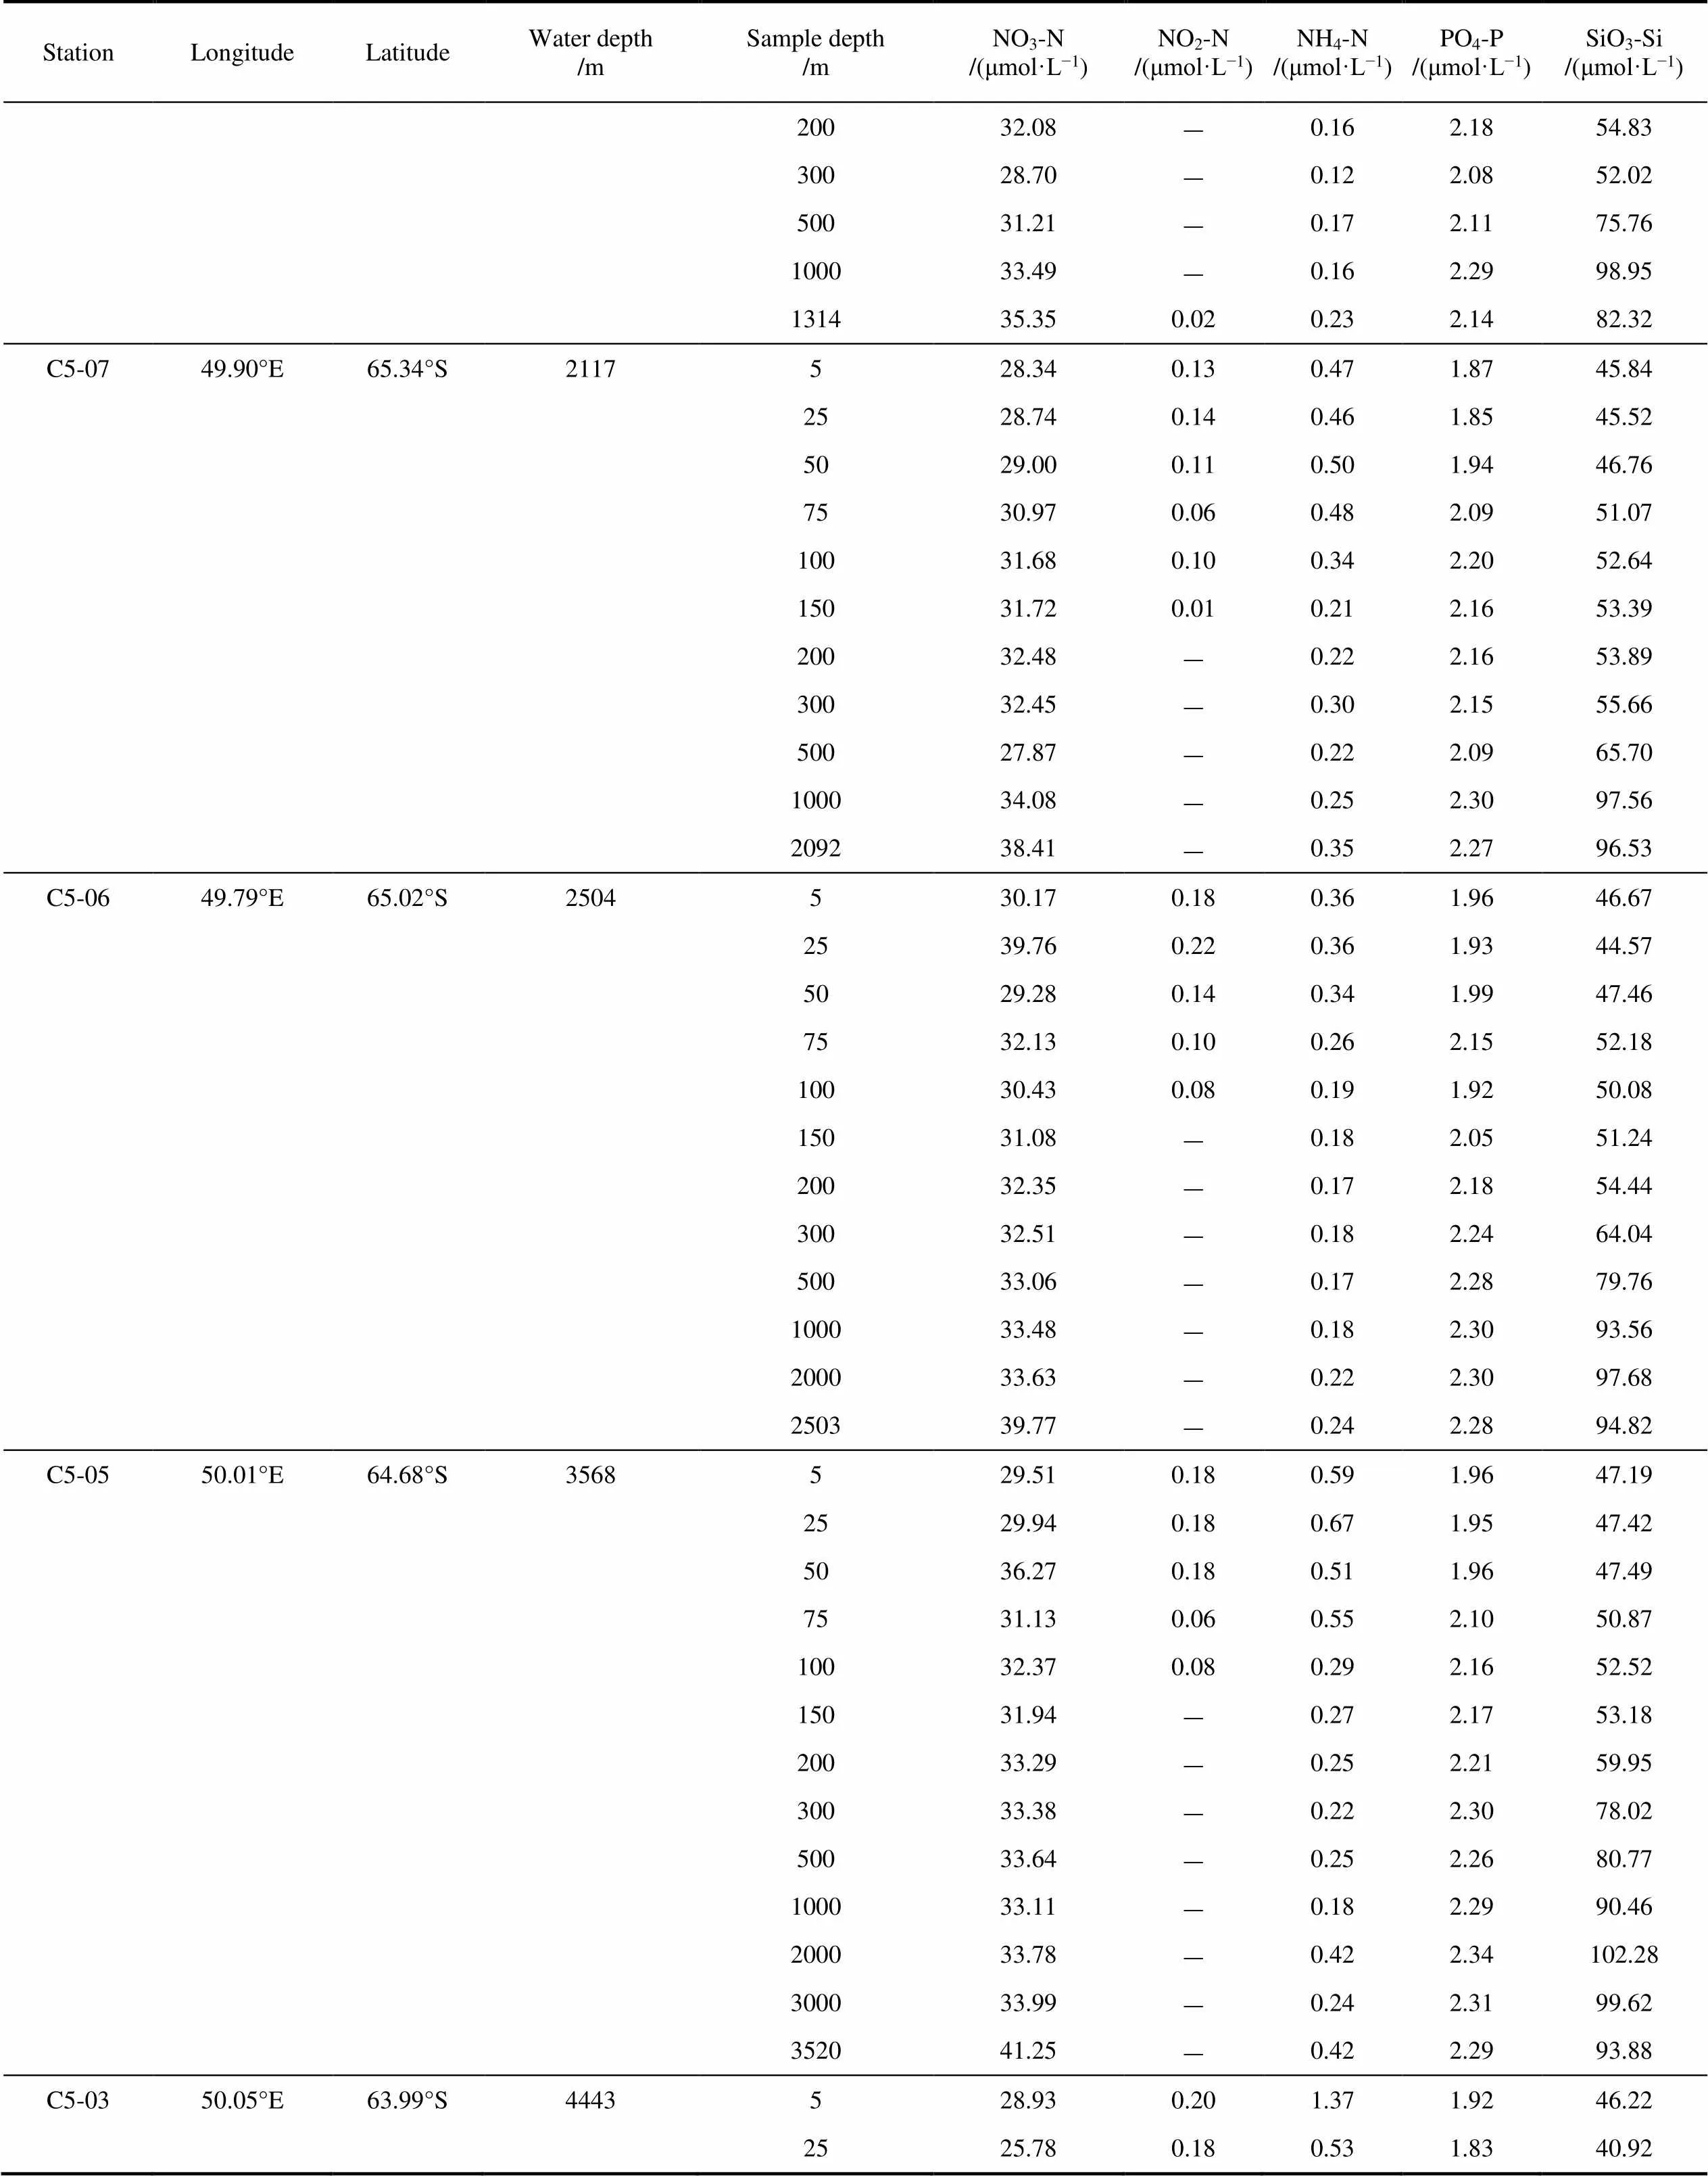
StationLongitudeLatitudeWater depth/mSample depth/mNO3-N/(μmol·L−1)NO2-N/(μmol·L−1)NH4-N/(μmol·L−1)PO4-P/(μmol·L−1)SiO3-Si/(μmol·L−1) 20032.08–0.162.1854.83 30028.70–0.122.0852.02 50031.21–0.172.1175.76 100033.49–0.162.2998.95 131435.350.020.232.1482.32 C5-0749.90°E65.34°S2117528.340.130.471.8745.84 2528.740.140.461.8545.52 5029.000.110.501.9446.76 7530.970.060.482.0951.07 10031.680.100.342.2052.64 15031.720.010.212.1653.39 20032.48–0.222.1653.89 30032.45–0.302.1555.66 50027.87–0.222.0965.70 100034.08–0.252.3097.56 209238.41–0.352.2796.53 C5-0649.79°E65.02°S2504530.170.180.361.9646.67 2539.760.220.361.9344.57 5029.280.140.341.9947.46 7532.130.100.262.1552.18 10030.430.080.191.9250.08 15031.08–0.182.0551.24 20032.35–0.172.1854.44 30032.51–0.182.2464.04 50033.06–0.172.2879.76 100033.48–0.182.3093.56 200033.63–0.222.3097.68 250339.77–0.242.2894.82 C5-0550.01°E64.68°S3568529.510.180.591.9647.19 2529.940.180.671.9547.42 5036.270.180.511.9647.49 7531.130.060.552.1050.87 10032.370.080.292.1652.52 15031.94–0.272.1753.18 20033.29–0.252.2159.95 30033.38–0.222.3078.02 50033.64–0.252.2680.77 100033.11–0.182.2990.46 200033.78–0.422.34102.28 300033.99–0.242.3199.62 352041.25–0.422.2993.88 C5-0350.05°E63.99°S4443528.930.201.371.9246.22 2525.780.180.531.8340.92
Continued
StationLongitudeLatitudeWater depth/mSample depth/mNO3-N/(μmol·L−1)NO2-N/(μmol·L−1)NH4-N/(μmol·L−1)PO4-P/(μmol·L−1)SiO3-Si/(μmol·L−1) 5028.880.191.231.9346.53 7530.800.111.242.0651.68 10032.350.040.462.3356.33 15032.87–0.352.2264.27 20033.26–0.852.2668.80 30033.89–0.532.3176.55 50033.57–0.392.2679.27 100033.08–0.422.2988.46 200033.68–0.452.3397.73 300033.93–0.592.3097.38 400033.220.010.612.1975.28 441739.78–0.702.2693.80 C5-0250.03°E63.33°S4853527.260.210.311.8137.90 2527.540.210.451.8338.28 5029.390.130.481.9943.84 7532.850.130.332.2355.92 10033.62–0.192.3764.80 15035.99–0.142.4674.14 20035.22–0.242.4076.56 30034.99–0.132.3278.62 50034.05–0.132.2381.09 100031.09–0.182.1484.75 200034.96–0.162.34104.35 300034.09–0.142.33109.07 400033.94–0.212.31107.73 483438.84–0.272.21115.29 C5-0150.04°E62.68°S5000527.860.260.591.8337.17 2527.420.250.471.7836.94 5027.630.210.411.8136.37 7535.380.170.441.9039.49 10029.640.180.512.0343.91 15036.530.040.352.4568.93 20035.94–0.142.4074.82 30034.57–0.212.3677.85 50032.95–0.182.2781.64 100032.82–0.152.2689.94 200033.84–0.162.35105.14 300033.79–0.162.36107.81 400034.17–0.162.33109.08 498441.63–0.252.31113.88 C4-0145.07°E62.66°S4749527.160.270.481.8840.90 2527.840.260.461.9141.99 5028.610.180.371.9441.46
Continued
StationLongitudeLatitudeWater depth/mSample depth/mNO3-N/(μmol·L−1)NO2-N/(μmol·L−1)NH4-N/(μmol·L−1)PO4-P/(μmol·L−1)SiO3-Si/(μmol·L−1) 7536.100.190.372.0745.66 10030.940.170.332.1952.19 15034.66–0.172.4673.58 20034.73–0.182.4578.17 30033.55–0.152.3979.58 50032.43–0.182.3083.98 100032.47–0.162.3296.69 200033.44–0.232.39110.53 300033.32–0.242.39114.32 400033.48–0.242.36114.81 474939.49–0.332.35126.53 C4-0245.04°E63.34°S4595527.530.290.631.9343.54 2527.630.160.541.9243.33 5029.730.150.452.0044.88 7535.750.170.332.0647.89 10035.49–0.372.4675.09 15035.36–0.212.4179.65 20034.32–0.232.3482.01 30030.77–0.182.2883.13 50032.79–0.232.3095.48 100033.31–0.212.37110.31 200033.50–0.212.36114.08 300033.80–0.232.35114.95 C4-0345.02°E64.00°S4425527.440.280.501.8446.21 2527.730.250.581.9245.91 5028.420.130.572.0448.17 7532.920.100.372.3867.15 10034.320.010.392.4776.84 15034.00–0.362.4979.43 20033.77–0.382.4081.59 30033.52–0.362.3282.87 50031.88–0.342.2986.35 100032.10–0.382.3096.12 200032.95–0.382.37111.15 300033.77–0.472.36113.52 441339.16–0.372.33120.09 C4-0545.03°E64.67°S3971525.560.090.231.8046.34 2525.970.090.261.8346.71 5028.950.090.592.1151.65 7521.170.080.331.9735.70 10036.510.070.152.1853.43 15030.89–0.172.2156.87
Continued
StationLongitudeLatitudeWater depth/mSample depth/mNO3-N/(μmol·L−1)NO2-N/(μmol·L−1)NH4-N/(μmol·L−1)PO4-P/(μmol·L−1)SiO3-Si/(μmol·L−1) 20031.25–0.162.2464.01 30025.89–0.172.0563.11 50032.19–0.122.2782.39 100032.34–0.162.3195.59 200032.86–0.142.33104.87 300033.10–0.142.32111.03 392438.95–0.192.32104.07 C4-0745.03°E65.35°S3501523.170.020.261.2443.83 2522.650.010.691.6447.13 5034.440.100.882.1655.24 7529.950.130.662.2255.96 10030.000.140.392.2155.74 15030.37–0.182.2560.41 20029.96–0.182.1565.13 30031.91–0.142.3381.85 50031.56–0.222.0687.29 100027.290.020.142.1380.53 200032.21–0.222.27100.48 300032.40–0.142.33106.31 348238.87–0.342.31107.15 C4-0945.00°E66.01°S3319517.110.020.891.2144.18 2533.730.050.962.1153.25 5037.110.100.502.2454.74 7530.390.040.282.2055.29 10030.430.010.162.2055.06 15031.75–0.262.2458.66 20037.80–0.402.3470.52 30032.03–0.302.3780.68 50031.13–0.232.2185.47 100031.37–0.212.3398.97 200032.56–0.302.36106.92 324637.64–0.342.34107.30 C4-1044.99°E66.35°S2573519.650.020.240.9645.35 2519.160.010.531.4830.83 5034.650.080.962.2458.10 7529.610.050.421.9133.34 10030.020.060.282.2862.74 15031.07–0.162.3373.84 20031.40–0.182.3478.79 C4-1244.47°E67.14°S1174519.450.030.321.4445.28 2521.530.020.621.6547.01 5026.820.050.691.9539.90 7529.360.050.232.1955.14 10029.380.030.172.1755.04
Continued

StationLongitudeLatitudeWater depth/mSample depth/mNO3-N/(μmol·L−1)NO2-N/(μmol·L−1)NH4-N/(μmol·L−1)PO4-P/(μmol·L−1)SiO3-Si/(μmol·L−1) 15029.92–0.212.1854.55 20024.56–0.181.9244.45 30029.74–0.132.2356.17 50030.83–0.162.2677.16 C2’-0634.01°E65.17°S1588524.480.020.331.2343.47 2519.68–0.431.4247.57 5029.520.021.172.1856.97 7535.000.070.402.2357.70 10031.830.060.232.3061.13 15032.31–0.152.4267.49 20032.69–0.112.3769.85 30032.81–0.122.2479.59 50032.49–0.122.3583.98 100033.37–0.272.40101.65 157841.830.010.252.40108.27 C2’-0833.98°E65.56°S3276520.350.030.361.4149.43 2522.460.010.751.6250.86 5038.020.031.542.3562.14 7533.120.060.392.3464.74 10041.360.080.652.3264.52 15043.370.020.292.3468.01 20032.08–0.512.3876.39 30031.15–0.352.3482.14 50030.53–0.352.3188.27 100030.06–0.242.1996.52 200030.94–0.292.37107.87 326437.53–0.452.36107.01 C2’-0933.72°E66.01°S1194525.540.040.251.2346.95 2521.490.020.481.4949.37 5041.730.061.472.2560.30 7530.930.050.742.2863.94 10031.520.040.222.3065.11 15031.82–0.212.3465.63 20031.58–0.182.3070.68 30029.44–0.071.9444.85 50032.23–0.122.3287.13 100032.80–0.152.37102.04 119438.22–0.262.2199.68 C2’-1133.71°E66.67°S1256518.150.020.411.3246.97 2515.7400.751.4937.71 5025.250.040.992.1251.00 7529.100.040.372.1651.55 10038.690.070.292.2862.04 15031.46–0.222.3064.34
Continued
StationLongitudeLatitudeWater depth/mSample depth/mNO3-N/(μmol·L−1)NO2-N/(μmol·L−1)NH4-N/(μmol·L−1)PO4-P/(μmol·L−1)SiO3-Si/(μmol·L−1) 20031.50–0.212.3469.50 30028.96–0.182.2371.45 50031.77–0.182.3388.60 112038.40–0.242.35105.07 C2’-1333.72°E−67.33°S1308524.730.060.571.8054.03 2526.600.060.581.8855.11 5025.210.050.502.0151.33 7539.300.100.292.1956.47 10023.550.010.232.1149.55 15030.43–0.152.2664.68 20030.65–0.192.2767.92 30030.73–0.142.3378.24 50031.00–0.172.3586.26 100030.64–0.212.3398.55 130028.18–0.252.0884.39
Note: “–” means below the detection limit. Parallel samples (see Table 1 for detailed information) were presented with mean values.

Figure S1 The horizontal distribution of the mixed layer depth (MLD)in the Cosmonaut Sea from this study (a) and BROKE-West survey (b, 22 stations between 30°E and 60°E were selected) (Westwood et al., 2010).
Figure S2 The concentrations of nitrate (NO3-N) in the Cosmonaut Sea of the whole water depth.

Figure S3 The concentrations of nitrite (NO2-N) in the Cosmonaut Sea above 200 m (the concentrations of NO2-N below 200 m were lower than the detection limits and therefore were not shown here) and the bottom layer.
Figure S4 The concentrations of ammonium (NH4-N)in the Cosmonaut Sea of the whole water depth.

Figure S5 The concentrations of phosphate (PO4-P) in the Cosmonaut Sea of the whole water depth.
Figure S6 The concentrations of silicate (SiO3-Si) in the Cosmonaut Sea of the whole water depth.
10.13679/j.advps.2022.0099
11 March 2022;
13 September 2022;
30 September 2022
: Huang W H, Yang X F, Zhao J, et al. Dissolved nutrient distributions in the Antarctic Cosmonaut Sea in austral summer 2021. Adv Polar Sci, 2022(3): 267-290,doi:10.13679/j.advps.2022.0099
, ORCID: 0000-0001-6592-3365, E-mail: jzhao@sio.org.cn
 Advances in Polar Science2022年3期
- Advances in Polar Science的其它文章
- Concentration maxima of methane in the bottom waters over the Chukchi Sea shelf: implication of its biogenic source
- Evaluation of Arctic sea ice simulation of CMIP6 models from China
- Meteorological and sea ice anomalies in the western Arctic Ocean during the 2018–2019 ice season: a Lagrangian study
- Population size and distribution of seabirds in the Cosmonaut Sea, Southern Ocean
- Variability of size-fractionated chlorophyll a in the high-latitude Arctic Ocean in summer 2020
- Spatial variability of δ18O and δ2H in North Pacific and Arctic Oceans surface seawater