Prediction of the global potential geographical distribution of Hylurgus ligniperda using a maximum entropy model
Zhuojin Wu, Tai Gao, Youqing Luo, Juan Shi,*
a Beijing Key Laboratory for Forest Pest Control, Beijing Forestry University, Beijing, 100083, China
b Sino-France Joint Laboratory for Invasive Forest Pests in Eurasia, Beijing Forestry University, Beijing, 100083, China
c State Key Laboratory of Rice Biology, Institute of Insect Sciences, Zhejiang University, Hangzhou, 310058, China
Keywords:Climate change Hylurgus ligniperda Invasive pest Maximum entropy model Potential geographical distribution
ABSTRACT
1. Introduction
Hylurgus ligniperda(Fabricius)(Coleoptera:Curculionidae)is a wood boring insect that poses a serious threat to the world's hardwood trees.Host species documented to date include Pinus sylvestris L.,P.brutia Ten.,P.halepensis Mill.,P.nigra J.F.Arnold,P.thunbergii Parlatore,P.densiflora Sieb. et Zucc., P. elliottii Engelmann, P. radiata D. Don, P. montezumae Lamb.,P.pinea L.and several other pines,as well as some species of Abies,Larix, Picea, and Pseudotsuga (Reay and Walsh, 2001; Jankowiak and Bilan,2013;Pranamornkith et al.,2014;El Khoury et al.,2019).Adults of H.ligniperda need to bore into new pine branches to reach sexual maturity.Adults and larvae mainly harm the base and roots of fresh fallen and withered trees, especially under the ground-facing bark on fallen trees(Reay and Walsh,2002;Pranamornkith et al.,2014).Host trees can also be infested by pathogenic fungi carried by H. ligniperda, such as Ophiostoma piceae (Münch) Sydow & P. Sydow, O. bicolor RW Davidson & DE Wells, O. ips (Rumbold) Nannfeldt, and O. canum (Münch) Sydow & P.Sydow(Tribe,1992; Kim et al.,2011; Davydenko et al., 2014).
H.ligniperda is native to the Mediterranean region of southern Europe,central Europe, the east coast of the Atlantic Ocean, and nearby islands(Tribe, 1991). In its native range, adults of H. ligniperda are active throughout the year and are highly tolerant of various environmental conditions. H. ligniperda has spread to the United States, New Zealand,Australia, Japan, South Korea, Lebanon, Chile, China, and other countries (Reay and Walsh,2002;Lin et al.,2021;Ren et al.,2021).
Ecological niche modeling has been widely used in recent years to predict the potential geographical distribution of species (Peterson,2011).Ecological niche modeling is based on niche theory and involves the use of algorithms, along with species occurrence data and environmental variables,to determine the environmental conditions required for species survival(Gebrewahid et al.,2020).The results are then projected to different times and spaces to predict the potential distribution of a species(Venette et al.,2010).Predictions of the potential distribution are often accurate when maximum entropy models are used,even there are a few occurrence points or training data (Elith et al., 2006; Phillips et al.,2006). Consequently, maximum entropy models have been widely used to predict the potential distribution of plants, animals, bacteria, and fungi;they are especially suitable for predicting the potential distribution of invasive organisms (Wang et al., 2018; Rochlin, 2019; Zhao and Shi,2019; Tiffin et al., 2019; Raffini et al., 2020; Kariyawasam et al., 2021;Ouyang et al.,2021).
Song et al.(2018)predicted the distribution of H.ligniperda in China using a maximum entropy model. Their model predicted that the environment of Shandong Province would be unsuitable for H.ligniperda,but this is inconsistent with the observed distribution of H. ligniperda in China. Here, we used a maximum entropy model to predict the global potential distribution of H. ligniperda under near current and future climate scenarios and identified environmental variables with strong effects on the distribution of H. ligniperda. The results of this study provide key theoretical insights that could aid the monitoring, early warning, and development of strategies to prevent H.ligniperda infestations.
2. Material and methods
2.1. Data collection
2.1.1. Occurrence points
Occurrence data for H.ligniperda were obtained from several sources:(1) the Global Biodiversity Information Facility (GBIF) website(http://www.gbif.org/); (2) published studies (Wood and Bright, 1992;Reay and Walsh, 2002; Petrice et al., 2004; Park et al., 2017; Lin et al.,2021); and (3) field surveys conducted at and near the site where H. ligniperda was first recorded in Shandong Province. A total of 1,217 occurrence points in Asia, Europe, Africa, Oceania, and North America were obtained.
2.1.2. Environmental variables
The environmental variables used in this study were obtained from the WorldClim v2.1 dataset(http://www.worldclim.org/), including 19 bioclimatic variables,monthly average maximum temperature,monthly average minimum temperature, and monthly total precipitation (Appendix: Table S1). Future climate data were based on environmental variables for the periods 2021–2040, 2041–2060, 2061–2080, and 2081–2100 under four climate scenarios: ssp126, ssp245, ssp370, and ssp585. BCC-CSM2-MR was the global climate model used.
2.2. Data processing
2.2.1. Selection of occurrence points
Buffer analysis was conducted to filter the occurrence points and minimize the effect of spatial correlation and over-fitting of the data and enhance the transferability of the model. The spatial resolution of the environmental variables used in this study was 2.5 arc-minutes,and the coverage area was approximately 21.0 km2; thus, the buffer radius was set to 2.5 km(Guevara et al.,2018).
2.2.2. Selection of environmental variables
The environmental variables were filtered to reduce the amount of redundant information and increase the prediction accuracy of the maximum entropy model.We used jackknife analysis in MaxEnt software to determine the percent contribution of each environmental variable;ArcMap to extract the climate information of the environmental variables at all occurrence points; and Pearson's correlation analyses in SPSS to calculate the correlation coefficients between environmental variables.When the absolute value of the correlation coefficient of two environmental variables (|R|) was greater than 0.8, the one with a larger contribution rate was retained.
2.3. Optimize the maximum entropy model
In MaxEnt software, response curves were created, and jackknife analysis was conducted to measure variable importance; the cloglog output mode was used, and the output file was in *.asc format (Phillips et al., 2017). When predicting the potential global geographical distribution under future climate conditions, the file names of the future climate variables were set to correspond to the near current climate variables and were loaded into“Projection layers directory/file”.
The following parameters were also used in this model.In each run,a different random seed was used. The random test percentage was set to 25%, which means that 75% of the occurrence points were randomly used as the training set and 25%were used as the test set.ArcMap,DIVAGIS,and R software were used to calculate the regularization multiplier(RM). The R packages ENMeval, dismo, dotCall64, fields, grid, knitr,maps, maptools, raster, rgeos, sp, spam, and spThin were used to calculate the RM and feature classes(FCs).The RM included values of 0.5,1.0,1.5,2.0,2.5,3.0,3.5,and 4.0.The FCs included linear(L),quadratic(Q),hinge (H), product (P), and threshold (T). The ENMeval package was used to calculate the corrected Akaike information criterion correction value(AICc value)under different parameters.The AICc value was used to estimate the complexity of the maximum entropy model,and the RM and FCs corresponding to the smallest AICc value were considered optimal.We tested eight different FC combinations,including L,LQ,LQP,QHP, LQH, LQHP, QHPT, and LQHPT. The checkerboard2 method was used to calculate the AICc value (Merow et al., 2013; Morales et al.,2017).The model was run 20 times under the same setting to reduce the randomness of the predicted results,and the final result was the average of 20 repetitions.
2.4. Classification of the potential geographical distribution
The lowest presence threshold (LPT) was used to classify suitable areas(Pearson et al.,2006).The prediction results were divided into four types:unsuitable area(0–LPT),low suitable area(LPT–0.4),moderately suitable area(0.4–0.6),and highly suitable area(0.6–1.0).The*.asc file generated from 20 repetitions of the model was converted to a raster using ArcMap, and the suitable areas were classified according to the aforementioned criteria.
2.5. Assessing the accuracy of the maximum entropy model
The AUC value is widely used to evaluate the prediction accuracy of maximum entropy models(Swets,1988;Lobo et al.,2008;Peterson et al.,2008). The AUC value generally ranges from 0.5 to 1. When the AUC value is 0.5–0.6, 0.6–0.7, 0.7–0.8, 0.8–0.9, and 0.9–1.0, the model is considered to have no predictive ability,poor predictive ability,general predictive ability, moderate predictive ability, and high predictive ability, respectively. Larger AUC values indicate higher credibility of the model. The AUC value of the partial-area ROC (P-ROC AUC) was also used to estimate the accuracy of the maximum entropy model.We used Niche Analyst software to calculate the AUC ratio with an error rate of 5%(E=5%):AUC ratio=AUCE/AUC0.5.When the AUC ratio is greater than 1,the model has a high degree of credibility(Qiao et al.,2016).In addition,we used the minimum training presence omission rate(ORmtp)and 10 percentile training presence omission rates(OR10),with expected values of 0 and 0.1, respectively, to verify whether the model was overfitting.The model has high predictive ability when the AUC value of the model is high and the omission rate is close to the expected value(Pearson et al.,2006;Phillips et al.,2006;Shcheglovitova and Anderson,2013).
3. Results
3.1. Main parameters of the maximum entropy model
Buffer analysis was conducted on 1,217 occurrence records of H. ligniperda, and a total of 358 occurrence records from Europe, Asia,Oceania,and North America were screened.The environmental variables were selected through the jackknife analysis and Pearson's correlation analysis,and the results are shown in Table 1.The FC combination used was QHPT,and the RM was 1.5(Fig.1).
3.2. Prediction accuracy of the maximum entropy model
The AUC value,AUC ratio,ORmtp,and OR10 were used to evaluate the accuracy of the prediction results. Under the 17 sets of climate conditions,the AUC and the AUC ratio values were greater than 0.9 and 1.0,respectively,and ORmtp and OR10 were close to their expected values of 0 and 0.1,respectively(Table 2).Under near current climate conditions,there was only a small deviation between the mean omission curve of the test data and the predicted omission curve(Appendix:Fig.S1).The above results indicated that the maximum entropy model used in this study had high predictive accuracy.
3.3. Prediction of the potential geographical distribution of H. ligniperda under different climate conditions
3.3.1. Potential geographical distribution of H.ligniperda under near current climate conditions
Under near current climate conditions, the potential geographical distribution of H. ligniperda included the northern and southern hemispheres.According to the minimum training presence threshold rule,the suitable area of H.ligniperda had an LPT of 0.0067 and was divided into four levels of suitable areas: unsuitable area, low suitable area, moderately suitable area,and highly suitable area(Fig.2b).Under near current climate conditions, the suitable areas for H. ligniperda were 20°–70°N,20°–55°S.Highly suitable areas were mainly located in western Europe and the Mediterranean coast,and a small portion of highly suitable area occurred in the eastern and western parts of Asia,southeastern Oceania,and the western coastal areas of South America. Highly suitable areas were mainly observed in Europe which was 9°W–41°E, 38°–54°N; in Asia,they were distributed within 105°–141°E,22°–35°N and 48°–53°E, 35°–37°N dispersedly; in North America, they were 118°–125°W,46°–50°N; in South America, they were 71°–73°W, 41°–54°S and 69°–79°W,8°N–8°S;in Oceania,they were 188°–218°E,30°–46°S.In Europe,highly suitable areas mainly occurred in areas of Ireland,France,Italy, Montenegro, Albania, Kosovo, Greece, parts of the United Kingdom, Portugal, Spain, Belgium, the Netherlands, Luxembourg, Germany,Croatia,Bosnia and Herzegovina,North Macedonia,Bulgaria,and Turkey. In Asia, highly suitable areas were scattered in Georgia,Azerbaijan, Iran, China, and Japan. In Oceania, these areas mainly occurred in southeastern Australia, New Zealand, and Papua New Guinea.In North and South America,highly suitable areas were scattered in the United States,Argentina,Venezuela,Colombia,Ecuador,Peru,and Chile. Moderately suitable areas mainly occurred near highly suitable areas,especially in western Europe.Low suitable areas were distributedin large areas in Europe,the western and eastern coasts of Asia,the midlatitude coastal areas of North and South America,and small portions of southeastern Oceania,northern,central and southern Africa.

Table 1 Environmental variables used to predict the potential geographical distribution of H. ligniperda.

Fig. 1. The regularization multiplier and feature classes of H. ligniperda in the maximum entropy model.
Under near current climate conditions,the total unsuitable area,low suitable area, moderately suitable area, and highly suitable area for H.ligniperda covered 10.77×10⁷km2,2.54×107km2,0.18×107km2,and 0.14×10⁷km2,accounting for 79.05%,18.64%,1.32%,and 0.99%of the total land area excluding Antarctica,respectively(Figs.2b and 3).Among the 358 occurrence records, 69.83% (250) were distributed in highly suitable areas, 17.88% (64) were distributed in moderately suitable areas, 12.29% (44) were distributed in low suitable areas (Fig. 2),and no occurrence records were observed in the unsuitable area.
3.3.2. Potential geographical distribution of H. ligniperda under future climate conditions
Under future climate conditions (i.e., in 2021–2040, 2041–2060,2061–2080, and 2081–2100) and four CMIP6 climate scenarios including ssp126, ssp245, ssp370, and ssp585, the area of the global potential geographical distribution of H. ligniperda was predicted to increase.Some of the areas unsuitable for H.ligniperda under near current climate conditions will become suitable for H. ligniperda in the future because of climate change, and this will facilitate the successful colonization of H.ligniperda to these areas(Figs. 3–5).
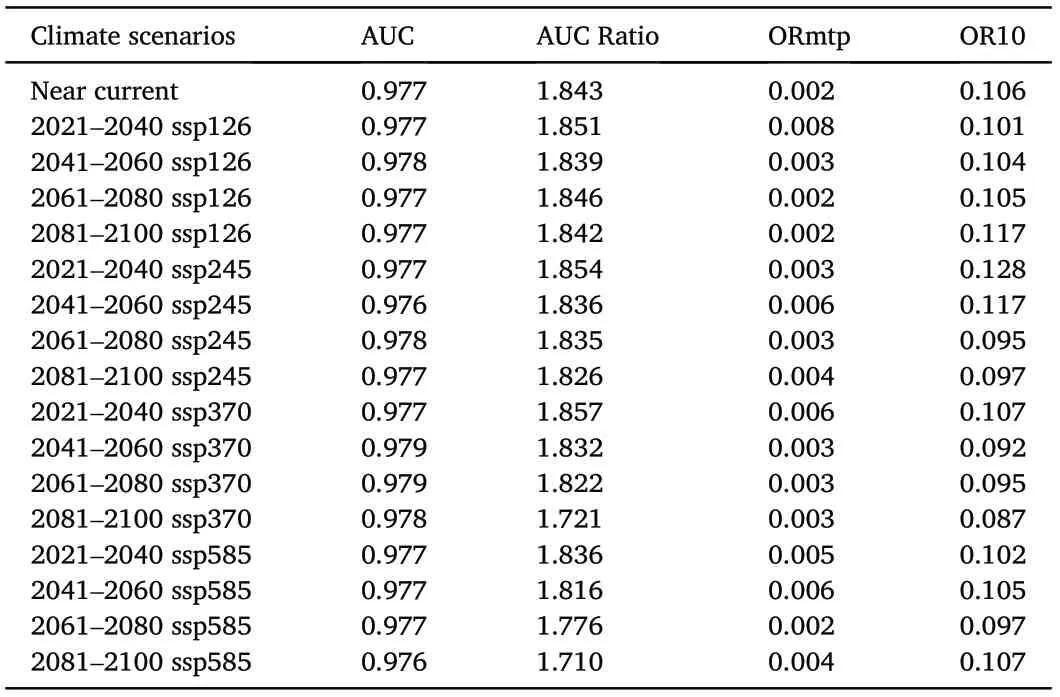
Table 2 Predictive accuracy of the maximum entropy model estimated by the AUC,ORmtp, OR10, and AUC ratio.
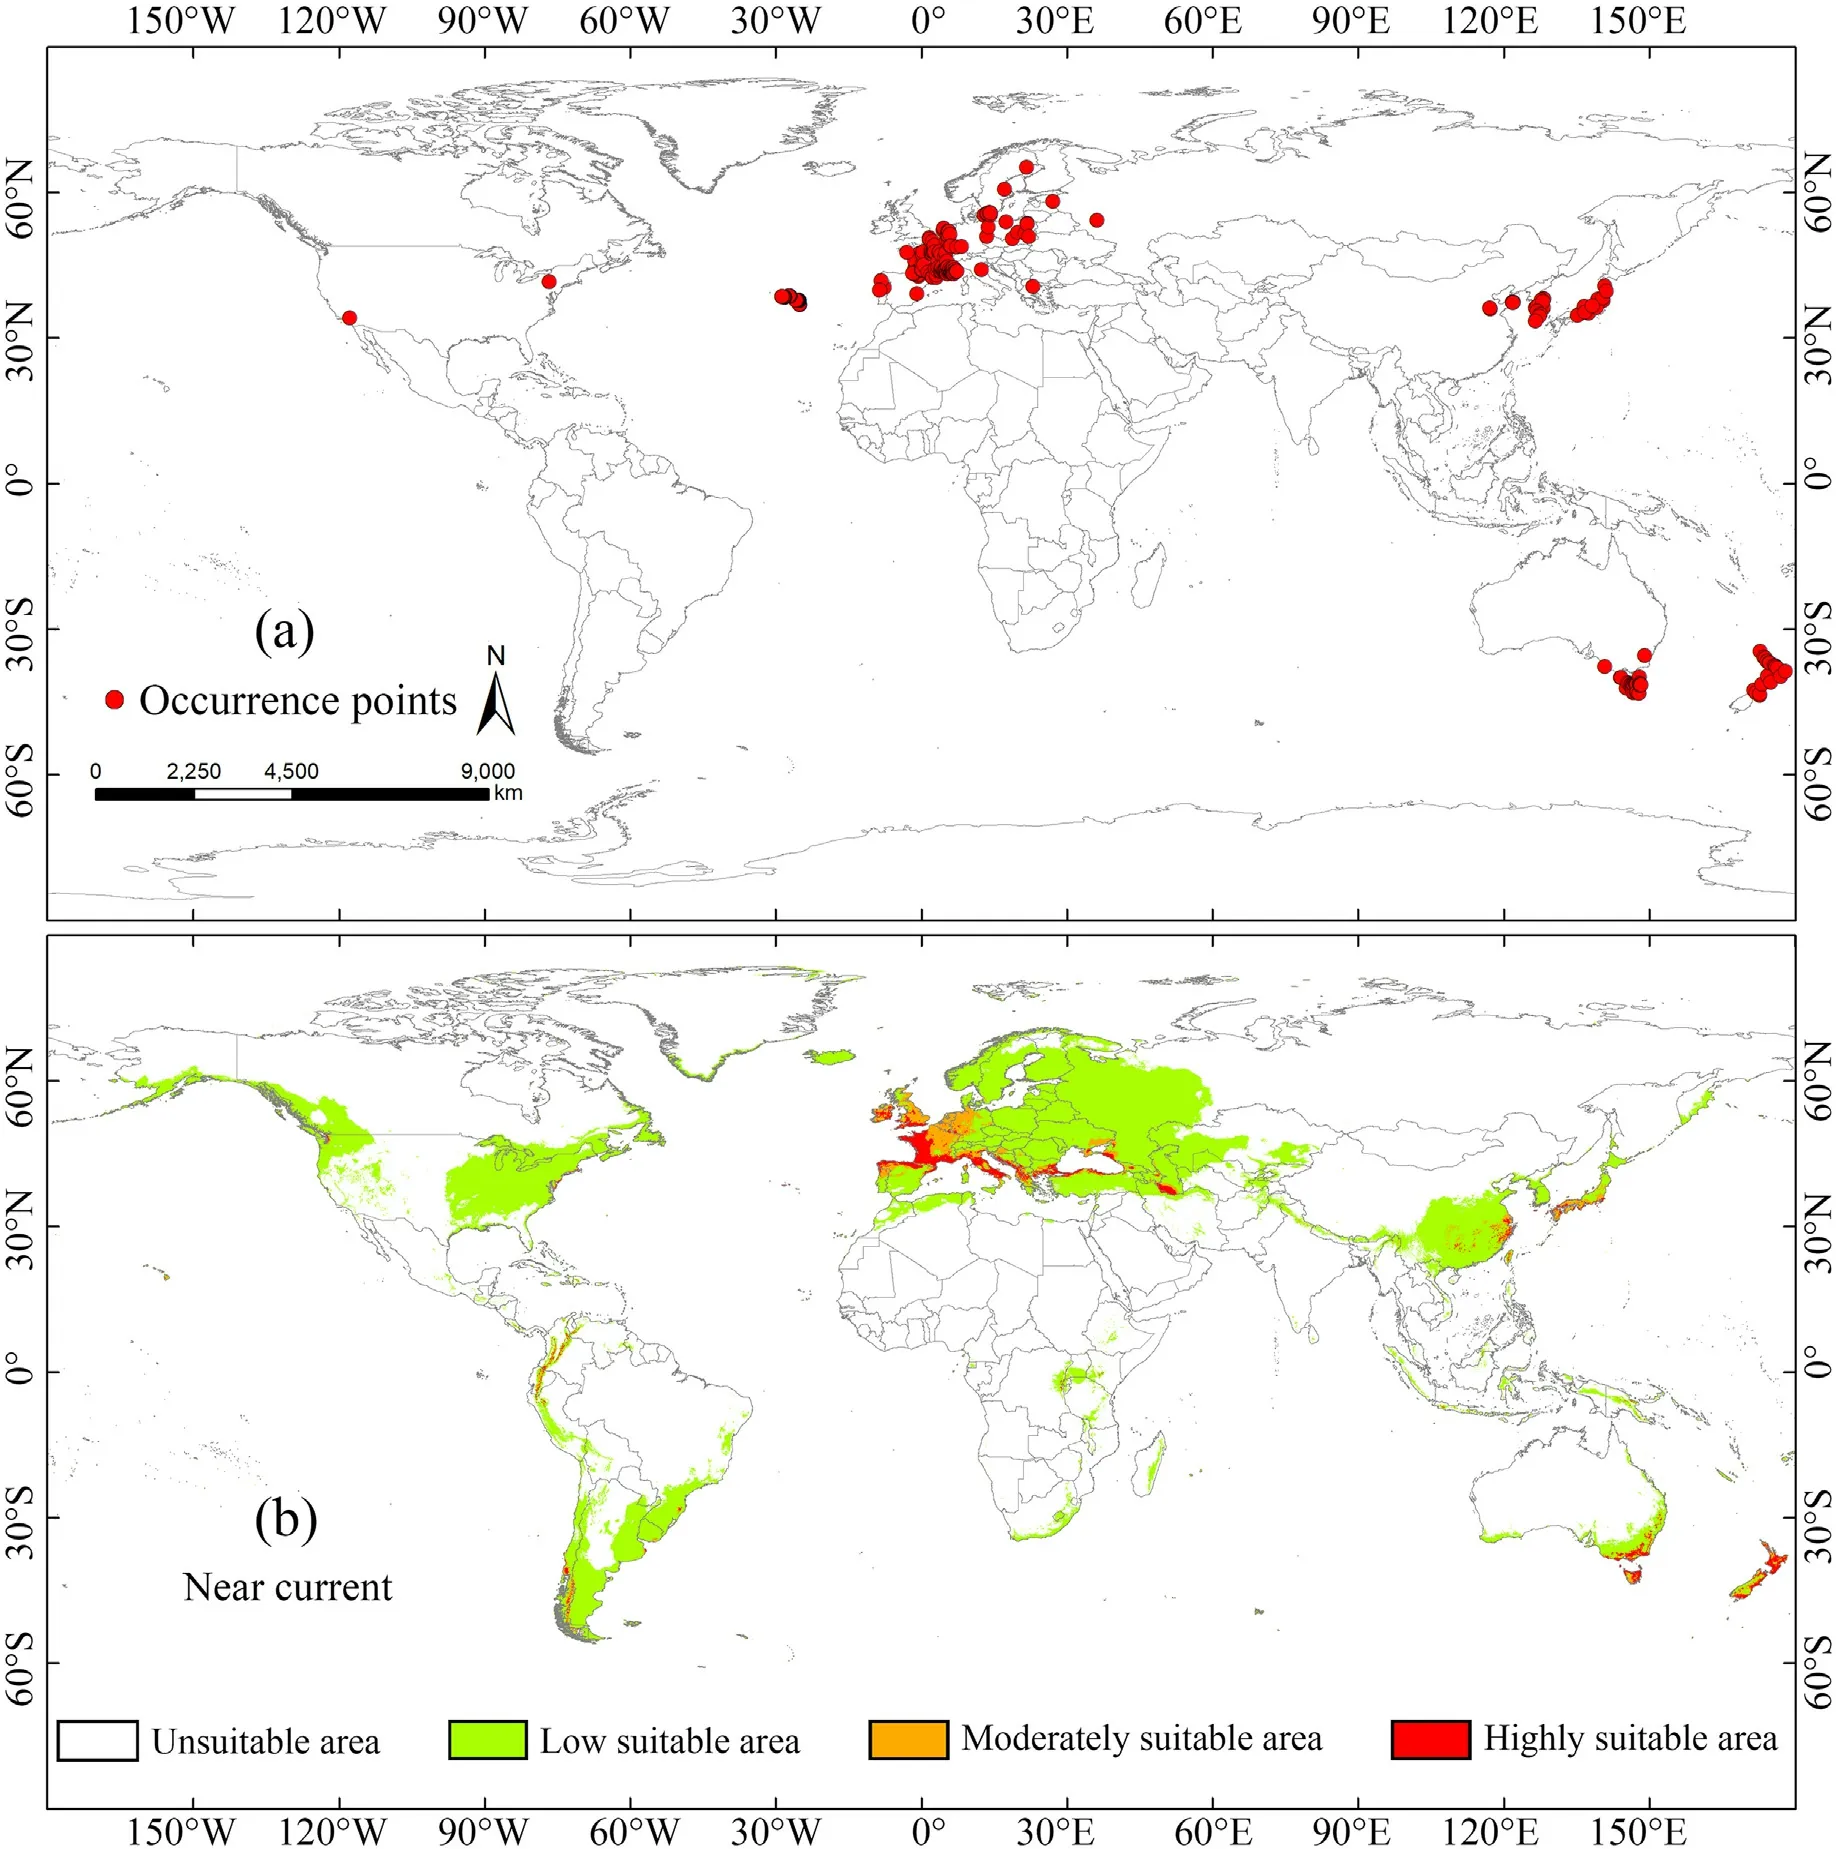
Fig. 2. (a) Occurrence records and global distribution of H. ligniperda; (b) The predicted potential geographical distribution under near current climate condition.H. ligniperda has the potential to occupy over 20.95% of the world's land area excluding Antarctica.
Under future climate conditions,the increase in highly suitable areas was most pronounced, followed by the increase in moderately suitable areas and low suitable areas. The total amount of unsuitable area changed little under future climate conditions compared with near current climate conditions and slightly decreased over time.The maximum predicted highly suitable area (0.27 × 10⁷km2) was observed for 2081–2100 ssp585, which accounted for 1.98% of the total land area excluding Antarctica and corresponded to an increase of 99.09%compared with near current climate conditions.The minimum predicted highly suitable area (0.16 × 10⁷km2) was observed for 2021–2040 ssp126, which accounted for 1.18% of the total land area and corresponded to an increase of 19.15% compared with near current climate conditions. The maximum predicted moderately suitable area (0.43 ×10⁷km2) was observed for 2081–2100 ssp585, which accounted for 3.19%of the total land area and corresponded to an increase of 141.43%compared with near current climate conditions.The minimum predicted moderately suitable area(0.19×10⁷km2)was observed for 2021–2040 ssp245, which accounted for 1.37% of the total land area and corresponded to an increase of 4.08% compared with near current climate conditions.The maximum predicted low suitable area(3.18×10⁷km2)was observed for 2081–2100 ssp370,which accounted for 23.36%of the total land area and corresponded to an increase of 25.35% compared with near current climate conditions. The minimum predicted low suitable area(2.60×10⁷km2)was observed for 2081–2100 ssp126,which accounted for 19.10% of the total land area and corresponded to an increase of 2.5% compared with near current climate conditions. The maximum predicted unsuitable area(10.64×10⁷km2)was observed for 2021–2040 ssp126, which accounted for 78.13% of the total land area and corresponded to a decrease of 1.17% compared with near current climate conditions.The minimum predicted unsuitable area(9.76×10⁷km2)was observed for 2081–2100 ssp585,which accounted for 71.65%of the total land area and corresponded to a decrease of 9.36%compared with near current climate conditions(Figs. 3 and 5).
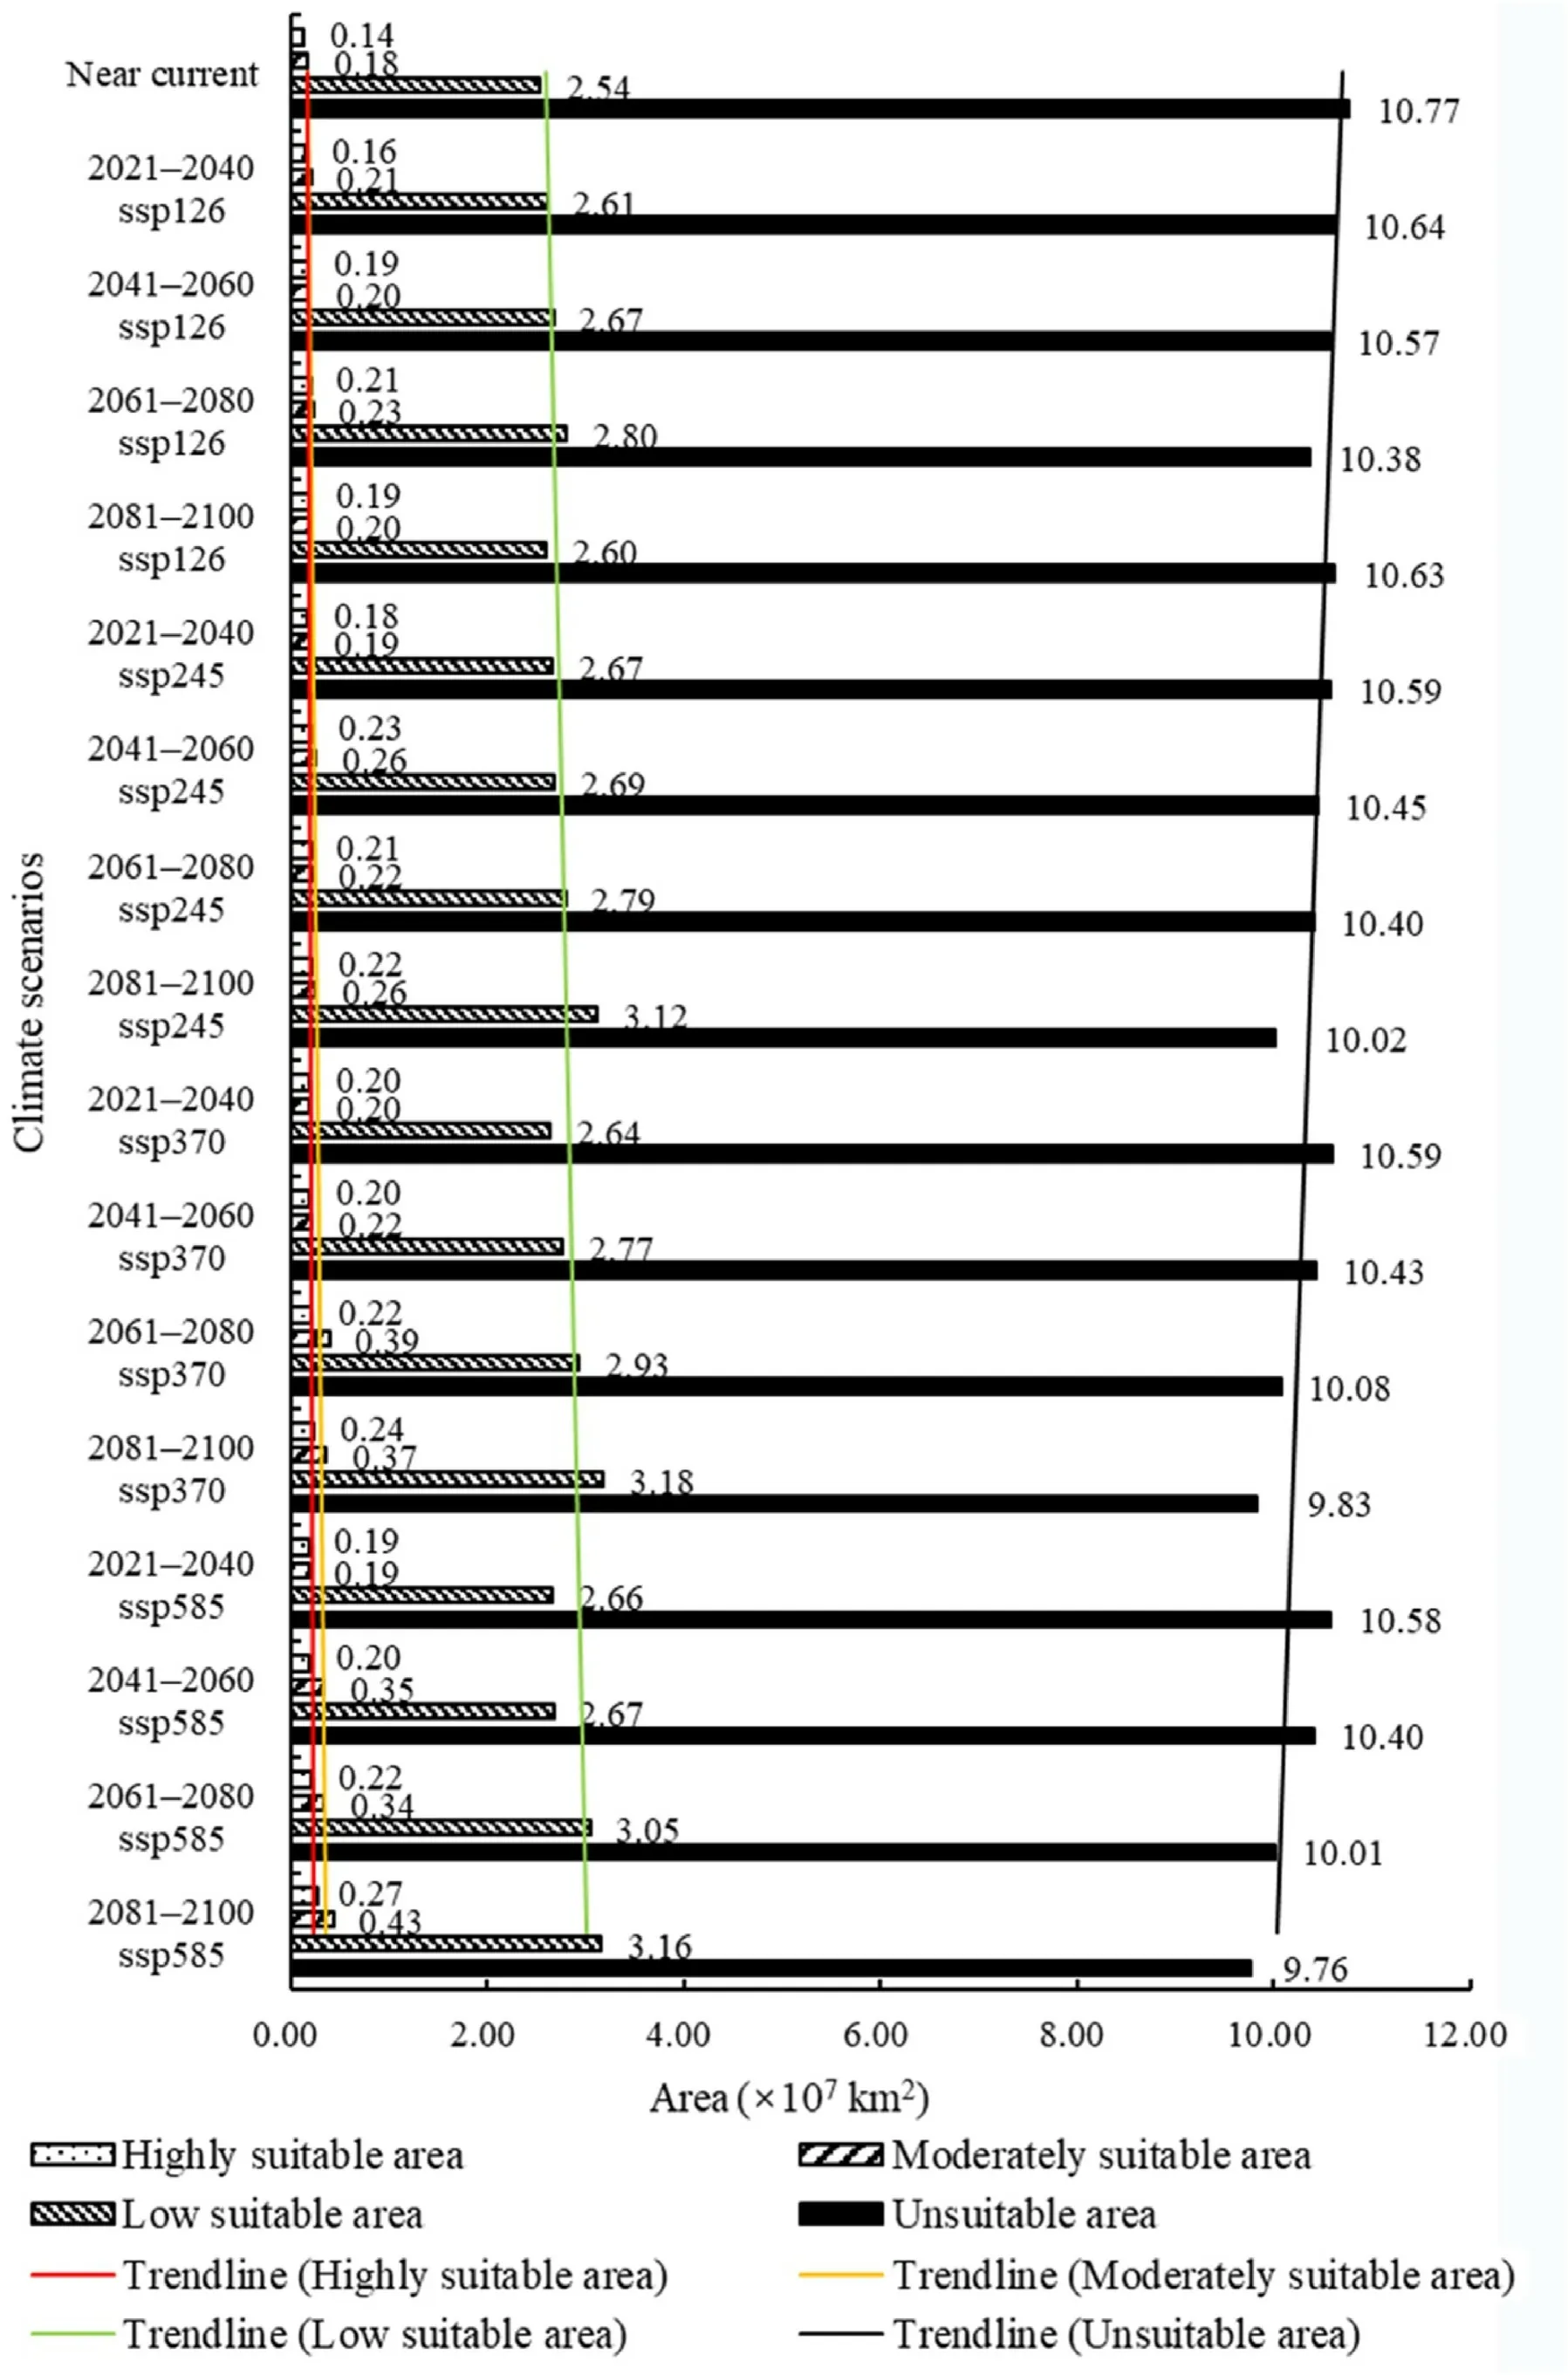
Fig. 3. Areas of the global potential geographical distribution of H. ligniperda under near current and future climate conditions.

Fig.4. Global potential geographical distribution of H.ligniperda under future climate conditions during the 21st century under four CMIP6 climate scenarios and four climate scenarios: (a) ssp126, (b) ssp245, (c) ssp370 and (d) ssp585.
The suitability category of the occurrence points of H.ligniperda was predicted to change under future climate conditions compared with near current climate conditions. In highly suitable areas, the distribution of occurrence points showed no obvious regularity; increases were mostly observed under 2041–2060 ssp126 and 2021–2040 ssp370(9.20%),and the most pronounced decrease was observed under 2081–2100 ssp585(57.20%)(Fig.6).The occurrence points in the moderately suitable area decreased the most under 2021–2040 ssp245(51.56%)and increased the most under 2081–2100 ssp585 (42.19%) (Fig. 6). The distribution probability of occurrence points in the low suitable area increased; the most pronounced increase (268.18%) was observed under 2081–2100 ssp370, and the smallest increase (11.36%) was observed under 2021–2040 ssp370(Fig.6).
3.4. Relationship between the distribution of H. ligniperda and environmental variables
The jackknife method was used to analyze the environmental variables with the greatest effect on the distribution of H. ligniperda (Appendix: Fig. S2). Longer blue bands indicate stronger effects of environmental variables on the distribution of H. ligniperda, whereas shorter green bands indicate that variables provide more unique information compared with other variables (Appendix: Fig. S2). The environmental variables with the greatest effect on the distribution of H. ligniperda included monthly average maximum temperature in April(tmax4), precipitation of driest quarter (bio17), and monthly average minimum temperature in December(tmin12);the effect of the latter two variables on the distribution of H.ligniperda was similar.Monthly average maximum temperature in April (tmax4) was the variable that provided the most unique information on the distribution of H.ligniperda.
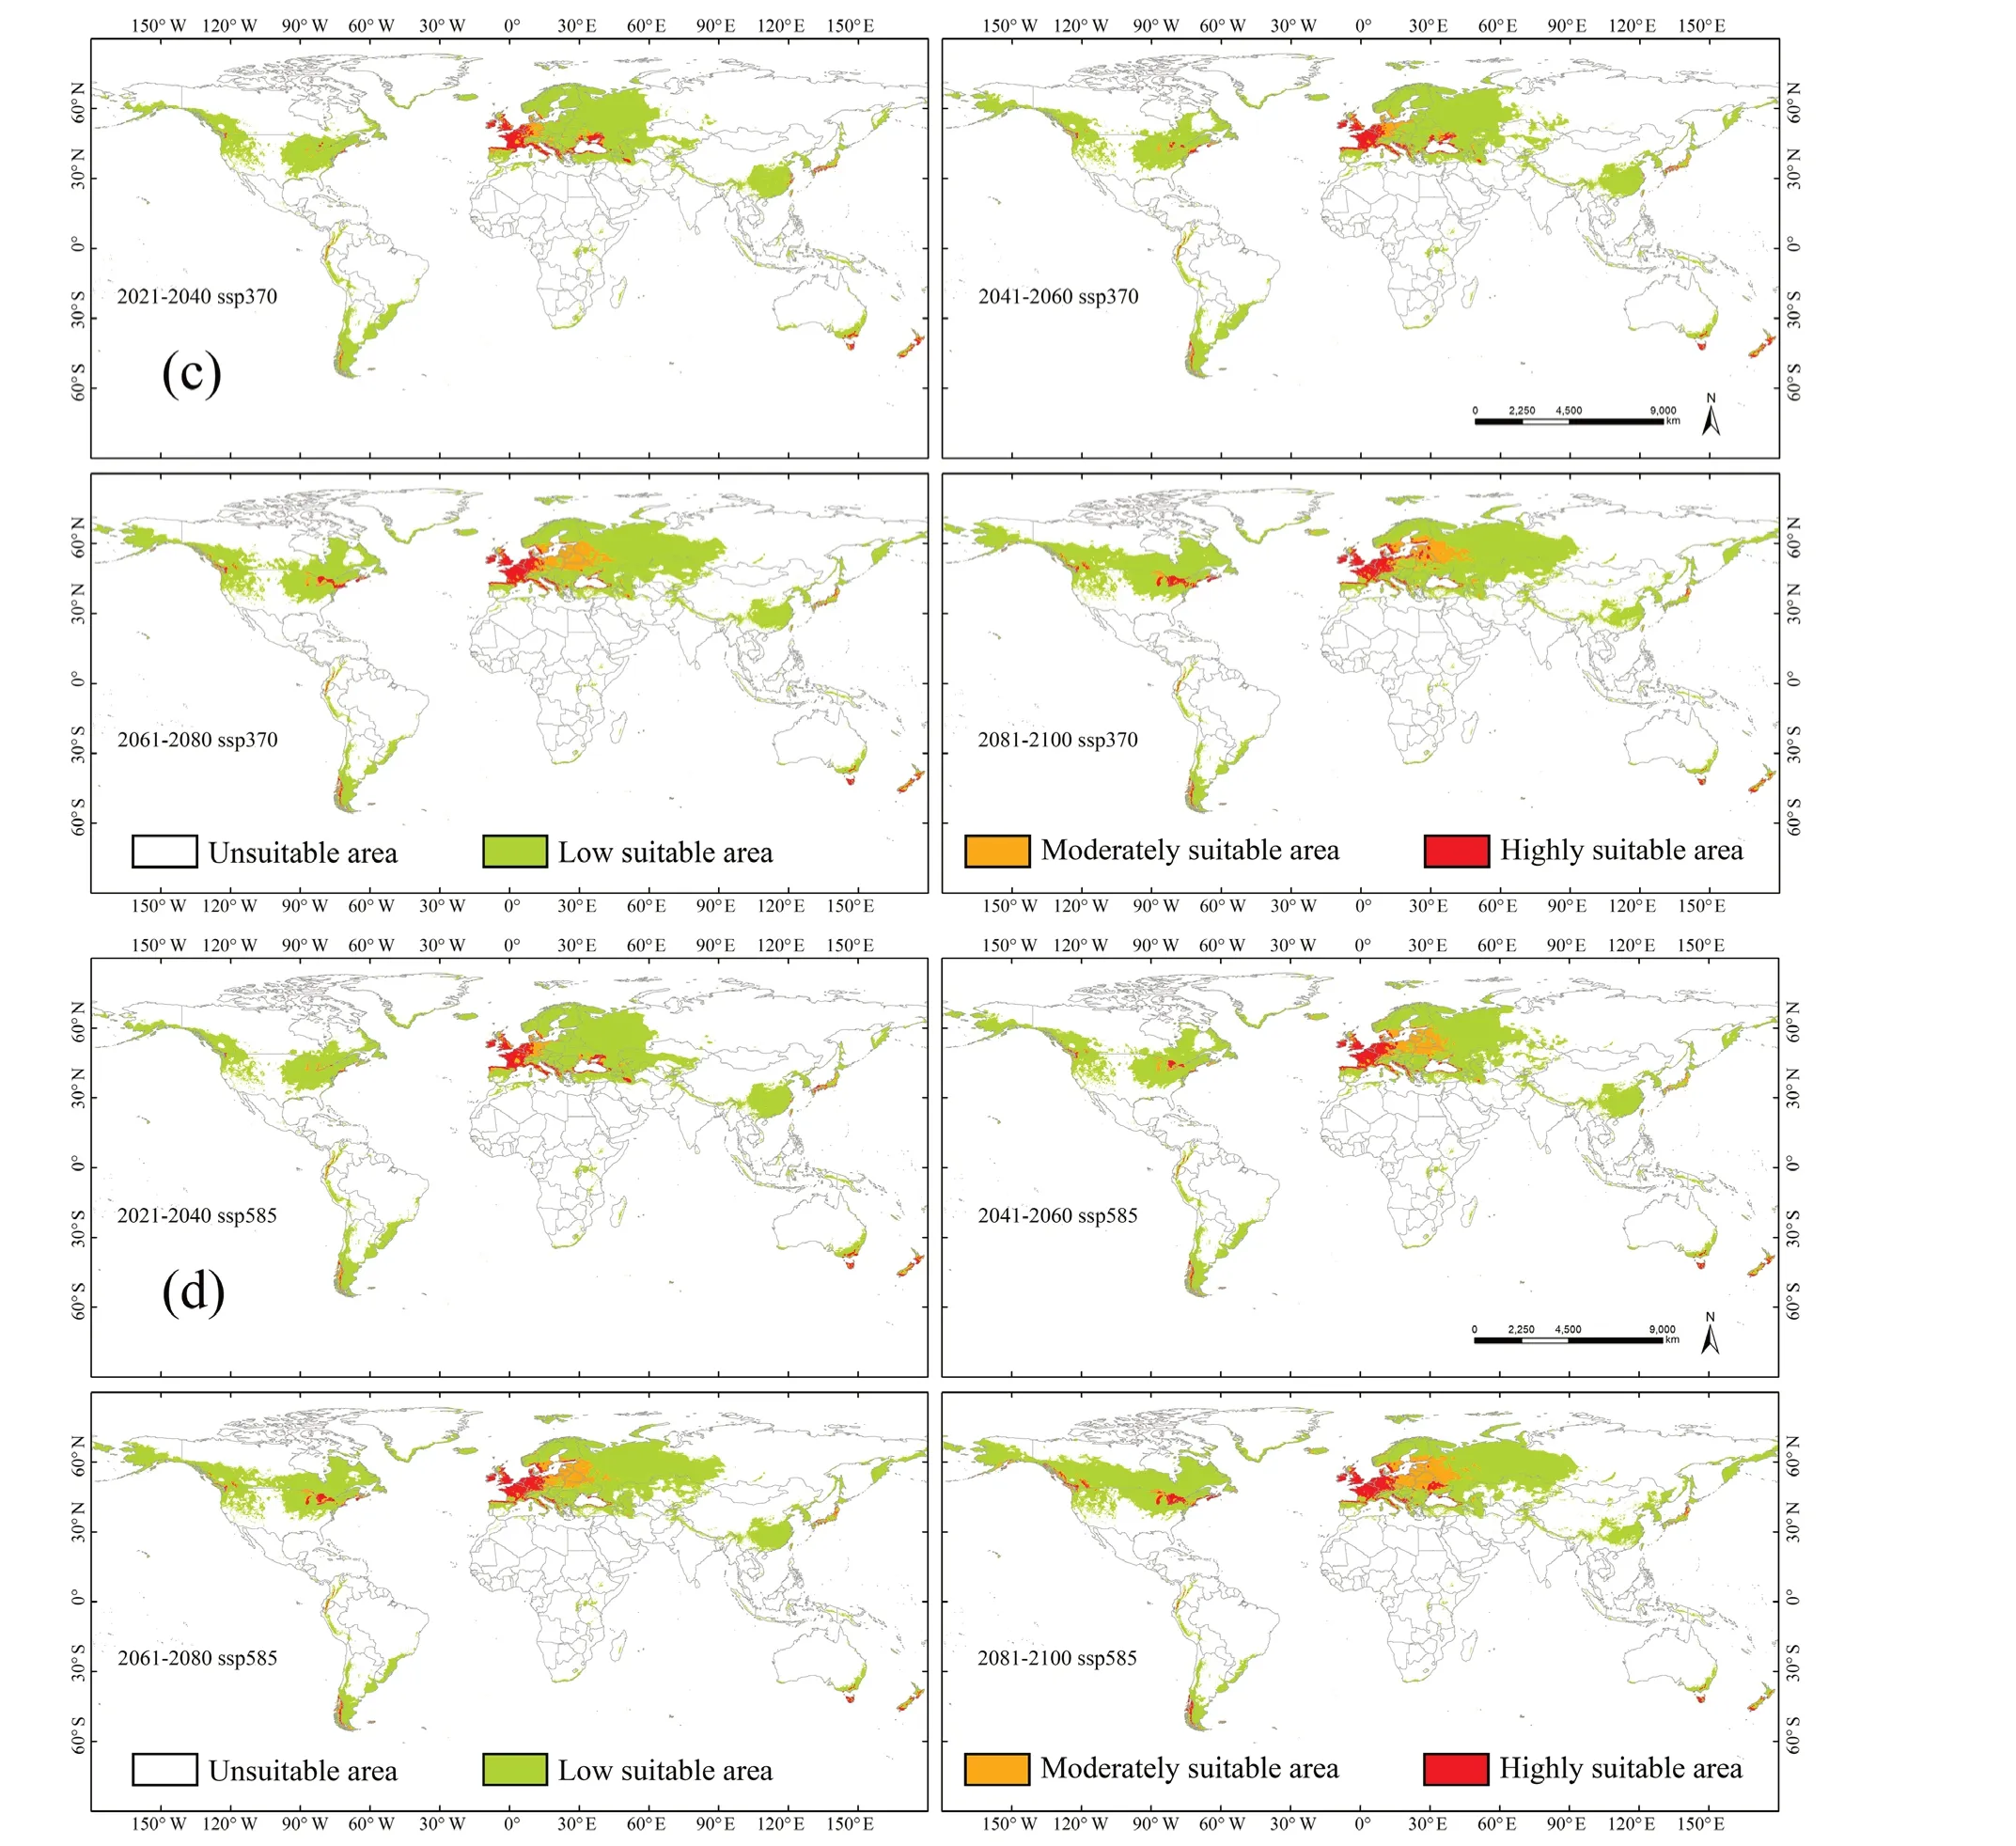
Fig. 4. (continued).
The response curves between environmental variables and distribution probability derived from the maximum entropy model reflect the range of environmental variables under different thresholds (Appendix:Fig.S3).In this study,the LPT was used to classify the range of potentially suitable areas of H.ligniperda.The suitable temperature range for tmax4 was -1-26°C, and the most suitable value was 17°C. The suitable temperature range for the highly suitable area was 14–19°C. When tmax4 was between -1°C and 17°C, the probability of occurrence increased as the temperature increased;when tmax4 was between 17°C and 26°C, the probability of occurrence decreased as the temperature increased(Appendix:Fig.S3a).The suitable precipitation range of bio17 was 20–783 mm,and the most suitable value was 163 mm.The suitable precipitation range for highly suitable areas was 119–248 mm. When bio17 ranged from 20 to 163 mm,the probability of occurrence increased as the amount of precipitation increased;when bio17 ranged from 163 to 783 mm, the probability of occurrence decreased as the amount of precipitation increased (Appendix: Fig. S3b). H. ligniperda can occur when tmin12 is between-16°C and 19°C.The suitable temperature range for the highly suitable area was-1-7°C,and the most suitable value was 2°C.When tmin12 was-16-2°C,the probability of occurrence increased as the temperature increased; when the temperature was 2–8°C, the probability of occurrence decreased as the temperature increased; and when the temperature was 8–12°C, the probability of occurrence increased as the temperature increased; and when the temperature was above 12°C,the probability of occurrence decreased as the temperature increased(Appendix:Fig.S3c).The suitable precipitation range of bio19 was 20–1,1,334411 mm,and the most suitable value was 280 mm.The suitable precipitation range for the highly suitable areas was 172–457 mm.When bio19 was 20–280 mm, the probability of occurrence increased as the amount of precipitation increased;when bio19 was 280–1,341 mm,the probability of occurrence decreased as the amount of precipitation increased(Appendix:Fig.S3d).The suitable temperature range for bio9 was -15-28°C, and the most suitable value was 19°C. The suitable temperature range for the highly suitable area was 5–21°C.When bio9 was -15-6°C, the probability of occurrence increased as the temperature increased; when bio9 was 6–14°C, the probability of occurrence remained unchanged as the temperature increased; when bio9 was 14–19°C, the probability of occurrence increased as the temperature increased; and when bio9 was 19–28°C, the probability of occurrence decreased as the temperature increased (Appendix: Fig. S3e). The suitable temperature range for bio2 was-1-14°C.The suitable temperature range for the highly suitable areas was 3–6°C and 8–11°C;the maximum occurrence probability occurred at 10°C,and the occurrence probability reached a maximum at 5°C.When the temperature of bio2 was-1-5°C,the probability of occurrence increased as the temperature increased;when bio2 was 5–7°C, the probability of occurrence decreased as the temperature increased; when bio2 was 7–10°C, the probability of occurrence increased as the temperature increased; and when bio2 was 10–14°C, the probability of occurrence decreased as the temperature increased(Appendix: Fig.S3f).

Fig. 5. The rate of change of the predicted potential geographical distribution of H. ligniperda under future climate conditions during various periods of the 21st century under four CMIP6 climate scenarios, (a) ssp126, (b) ssp245, (c) ssp370, and (d) ssp585, compared with the potential geographical distribution under near current climate conditions.
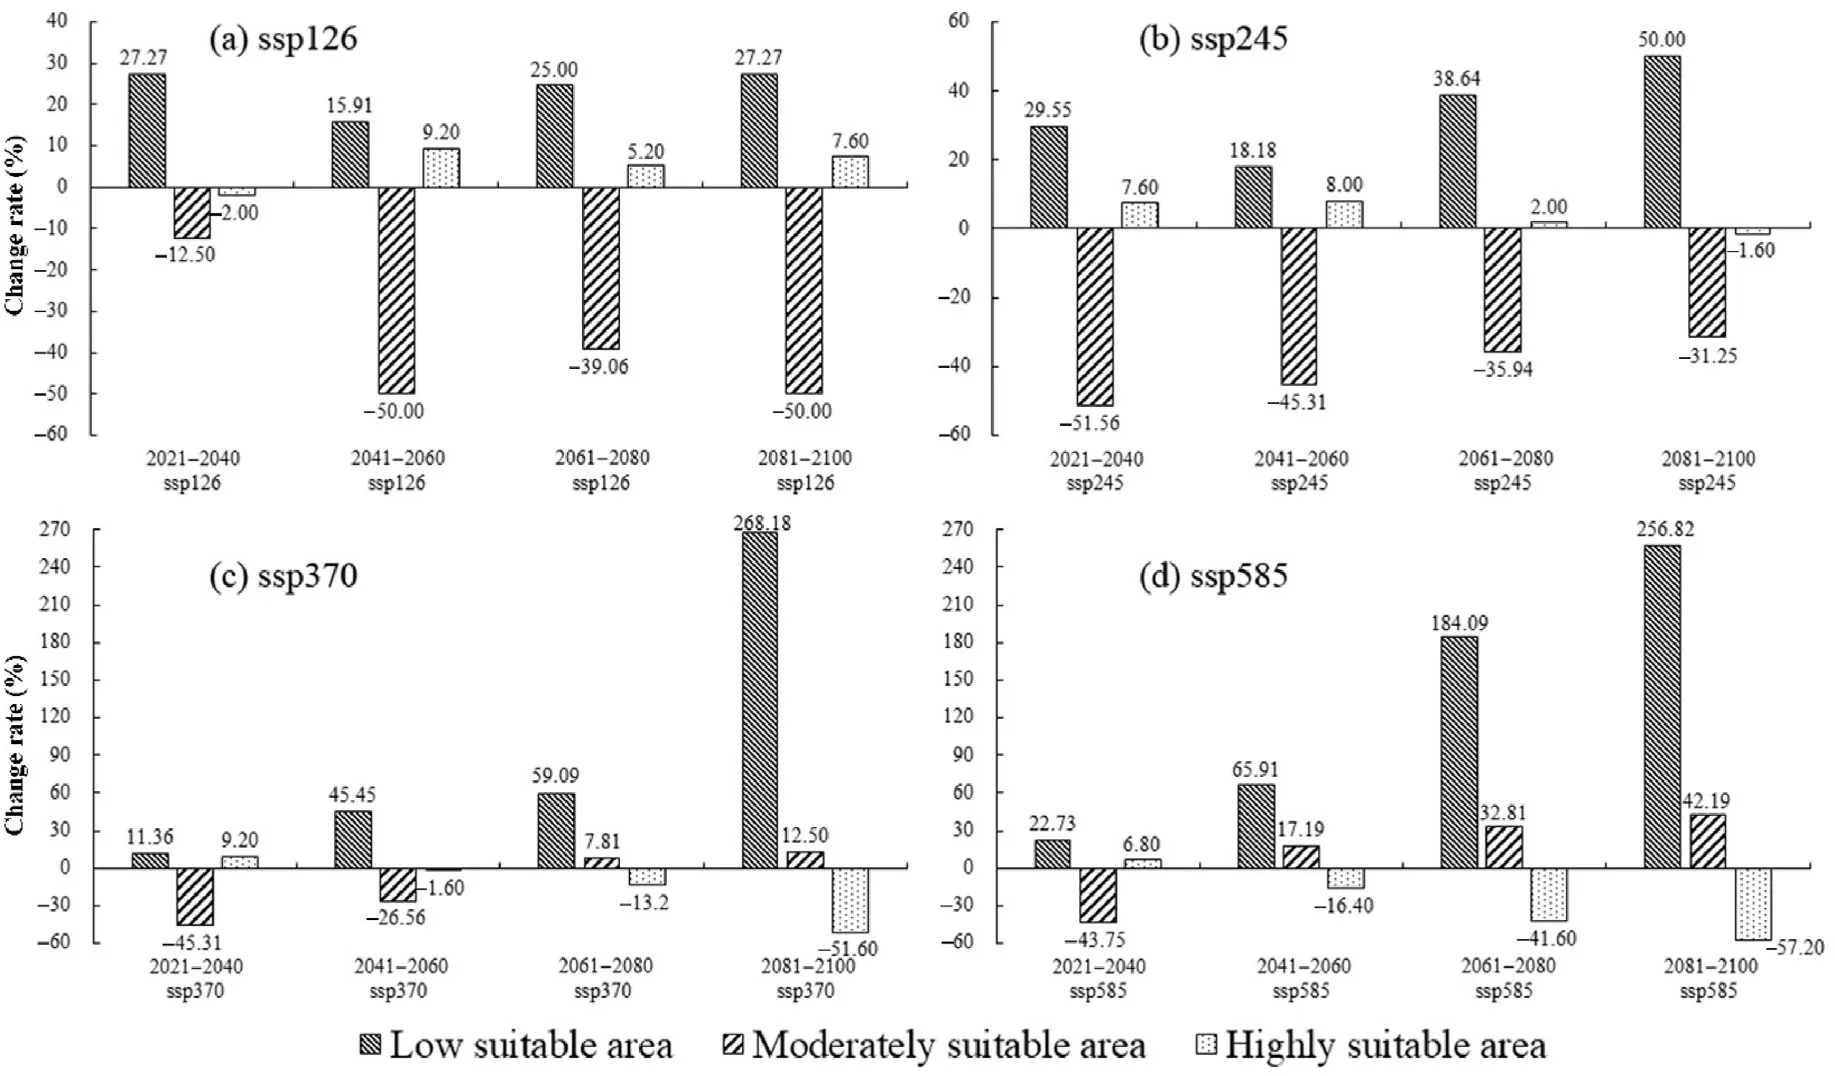
Fig.6. The rate of change in the global potential geographical distribution of H.ligniperda under future climate conditions during various periods in the 21st century under four CMIP6 climate scenarios, (a) ssp126, (b) ssp245, (c) ssp370, and (d) ssp585, compared with the number of occurrence points under near current climate conditions.
4. Discussion
We found that the areas surrounding the Mediterranean region, the eastern coastal areas of Asia, and the southeastern part of Oceania are highly suitable for H. ligniperda. The suitable area for H. ligniperda is predicted to increase in the future based on future climate conditions.H.ligniperda is a secondary pest in its native range,and it mainly damages ailing, fallen, or dead trees. When environmental conditions are favorable,H.ligniperda can heavily damage healthy wood(Tribe,1991,1992).H.ligniperda is also a vector of pathogenic fungi and thus poses a serious threat to the health of trees.Given that H.ligniperda is a wood borer that mainly infests Pinus spp.,it can be easily spread through the trade of pine logs and pine products. H. ligniperda has also been introduced to many countries.The degree of harm that H.ligniperda can cause might increase given the combined effects of multiple factors.
4.1. Relationship between environmental variables and the potential distribution of H. ligniperda
Environmental factors can affect the suitability of local habitat for a species. We found that the distribution of H. ligniperda was mainly affected by the monthly average maximum temperature in April(tmax4),which not only affects the distribution of H.ligniperda but also provides useful information for predicting its potential geographical distribution.The next most important factors were bio17, tmin12, and bio19. These findings indicate that the survival of H. ligniperda is greatly affected by temperature and precipitation.
We found that the distribution of H. ligniperda under near current climate conditions is mainly affected by temperature in spring,precipitation in summer,and temperature and precipitation in winter.Temperature plays an important role in the survival of insects. The temperature in winter and spring can affect the overwintering of H.ligniperda,and this is a key factor affecting the survival and occurrence of the next generation of beetles. The final instar larvae, pupae, and adults of H. ligniperda can survive the winter. The abundance of H. ligniperda peaks in the spring(Pawson et al., 2021). At this time, recently overwintered H. ligniperda individuals begin to move and are in a relatively fragile state;unsuitable environments can thus lead to the death of H.ligniperda.Larvae develop in spring and summer;this period also coincides with the emergence of new adults and the mating period. This is thus another peak period of H. ligniperda activity. At this time, temperature and precipitation have a substantial effect on the life activities of H. ligniperda. In sum, excessive precipitation in winter and low temperature in spring can have a strong negative effect on the survival of H.ligniperda.
H. ligniperda is highly adaptable. After invading areas outside of its native range,its adaptability to temperature has changed.This change is reflected in the predicted results in this study and can be observed from the data for tmin12 and bio2.Two peaks were observed in the response curves for these variables. H. ligniperda has higher tolerance of various climatic conditions compared with other Tomicini species.This is one of the reasons why it has been able to spread widely and colonize different regions.
4.2. The main factors affecting the prediction accuracy of the maximum entropy model
A maximum entropy model was used to predict the global potential distribution of H. ligniperda. The model had a high AUC value, and the ORmtp and OR10 values were close to expected values (Table 2). The mean omission curve for the test data was relatively similar to the predicted omission curve.These findings all indicate that the accuracy of the prediction results of the model was high.
Although opinions differ regarding the robustness of using the AUC value for verifying prediction accuracy,the AUC value and the AUC ratio in this research were both consistent in indicating that the prediction results were accurate(Ali et al.,2021).We used near current and future climate data from the updated WorldClim database. The new database has updated basic climate data; thus, these data are more accurate compared with older versions of the database. The completeness of the occurrence data and the accuracy of the climate data greatly affect the prediction results of the model,which can be observed by comparing our results with the results of Song et al. (2018), which were based on data from the WorldClim v1.4 database. However, the near current climate data provided by the database still have a gap of more than 20 years from the current time; the inability to obtain the latest climate data has become one of the major setbacks of accurately predicting suitable areas for species.
4.3. Potential distribution of H. ligniperda and suggestions for pest management under future climate conditions
Under future climate conditions, the potential distribution of H.ligniperda was predicted to increase.Among the four climate scenarios,the highly suitable area under the 2081–2100 ssp585 scenario increased the fastest,reaching 0.27×10⁷km2(an increase of 99.09%);the highly suitable area under the 2021–2040 ssp126 scenario increased slowly from 0.14 × 10⁷km2to 0.16 × 10⁷km2(an increase of 19.15%). The growth rate of the moderately suitable area varied greatly among the different scenarios; it increased by 141.43% and 4.08% under the 2081–2100 ssp585 and 2021–2040 ssp245 scenarios, respectively. Differences in the change in low suitable area under each scenario were relatively small; an increase of 25.35% was observed under the 2081–2100 ssp370 scenario, and an increase of 2.50% was observed under the 2081–2100 ssp126 scenario.These changes are closely related to variation in precipitation and temperature patterns during these periods(Bosso et al.,2017).
We also analyzed the robustness of different climate scenarios by characterizing changes in the probability of the occurrence points under near current climate conditions. In the 2081–2100 ssp585 (highly suitable area) and 2021–2040 ssp245 (moderately suitable area) scenarios,the number of occurrence points were greatly reduced and were 57.20%and 51.56%,respectively.In the 2021–2040 ssp370,2041–2060 ssp126(highly suitable area),and 2081–2100 ssp585(moderately suitable area)scenarios,the number of occurrence points increased greatly and reached 9.20% and 42.19%. The maximum and minimum increase in the low suitable area was observed in the ssp370 scenario for the 2081–2100 and 2021–2040 periods, reaching 268.18% and 11.36%, respectively.Although the various periods in the 21st century were relatively short,the predicted changes in the potential geographical distribution under some climate scenarios were large. That was not normal. In sum, the predicted potential geographical distribution under the ssp245 scenario may be the most realistic.
The most pronounced changes in the potential distribution under future climate conditions were observed in Europe, western Asia, and North America. Suitable area was predicted to increase in Europe and western Asia and gradually move northward. Low and highly suitable areas were both predicted to increase in North America.Continuous low suitable areas are expected to occur in central North America in 2081–2100,albeit most of the area in North America during this period is predicted to be of unsuitability. The continual increase in global trade activities will facilitate the biological invasion of H.ligniperda.For areas that will become suitable for the survival of H. ligniperda under future climate scenarios, quarantine measures for H. ligniperda should be implemented to prevent its spread.
5. Conclusions
Invasive organisms pose major threats to ecosystems and biodiversity.We used a maximum entropy model to predict the global potential geographical distribution of H.ligniperda.By combining near current and future climate scenarios, we identified several important environmental variables that affect the potential distribution of H. ligniperda. Under future climatic conditions, the total area of the potential distribution of H. ligniperda will increase, and the suitable areas of the mid-latitude regions of Europe, western Asia, and North America will change significantly.This study provides new insights that could aid the formulation of management and control measures for H.ligniperda.
Ethics approval and consent to participate
Not applicable.
Consent for publication
Not applicable.
Availability of data and material
The datasets generated and analyzed during the current study are available from the corresponding author on reasonable request.
Competing interests
The authors have no relevant financial or non-financial interests to disclose.
Funding
This research was funded by National Key R&D Program of China(No. 2021YFC2600400), National Natural Science Foundation of China(No. 32171794), and Forestry Science and Technology Innovation Special of Jiangxi Forestry Department(No.201912).
Authors’contributions
ZW and JS conceived the idea, ZW and TG built the models, YL collected data, ZW wrote the manuscript. All authors have read and agreed to the published version of the manuscript.
Appendix A. Supplementary data
Supplementary data to this article can be found online at https://do i.org/10.1016/j.fecs.2022.100042.
- Forest Ecosystems的其它文章
- Trade-offs among fine-root phosphorus-acquisition strategies of 15 tropical woody species
- Structure complexity is the primary driver of functional diversity in the temperate forests of northeastern China
- The 2/3 scaling of twig nitrogen to phosphorus in woody plants
- Monitoring the abundance of saproxylic red-listed species in a managed beech forest by landsat temporal metrics
- Evaluating and quantifying the effect of various spruce budworm intervention strategies on forest carbon dynamics in Atlantic Canada
- Consistent response of nematode communities to management of coniferous plantations

