
Polyetherimide functionalized carbon dots with enhanced red emission in aqueous solution for bioimaging
2022-09-16 05:25LimingWngBingzheWngEnshnLiuYunyngZhoBingchenHeChunfeiWngGuichunXingZikngTngYinningZhouSongnnQu
Chinese Chemical Letters 2022年8期
Liming Wng, Bingzhe Wng, Enshn Liu, Yunyng Zho, Bingchen He,Chunfei Wng, Guichun Xing, Zikng Tng, Yinning Zhou,∗, Songnn Qu,∗
a Institute of Applied Physics and Materials Engineering, University of Macau, Macau SAR, China
b Cancer Centre and Centre of Reproduction, Development and Aging, Faculty of Health Sciences, University of Macau, Macau SAR, China
ABSTRACT Red emissive carbon dots (CDs) are highly desired for biological applications.However, serious luminescence quenching of red emissive CDs in aqueous solution greatly hinders their application in high performance biological imaging.Herein, we reported a facile strategy to realize enhanced red emission of CDs in aqueous solution by surface modification with polyetherimide (PEI) via microwave heating method.High photoluminescence quantum yield (PLQY) of 25% was realized from the PEI functionalized CDs (CDs@PEI) in aqueous solution.The proposed PEI functionalization strategy not only protects the red emission against water molecules quenching, but also reverses the surface charges from negativity to positivity to promote cellular uptake of CDs, leading to clear cell imaging in red fluorescence region.More important, CDs@PEI exhibits much better photostability than commercial red emissive dye(MitoTracker red) in cell fluorescent imaging.Potential application of CDs@PEI on fast staining of cells for clonogenic assay has also been demonstrated.
Keywords:Carbon dots (CDs)Biological imaging Red emission Surface passivation Microwave heating
As an emerging luminescent nano-material, carbon dots (CDs)exhibit many attractive properties, such as low toxicity, good biocompatibility, tunable fluorescence emissions and excellent photochemical stability, which endow them with distinct advantages for biological applications [1–7].Great efforts have been conducted to develop red or near-infrared (NIR) emissive CDs [8–10].Many strategies, such as energy level alignment, heteroatom doping and surface electron group passivation, are developed to regulate the optical bandgap of CDs toward red or NIR emissions [11–13].For example, Liu’s group introduced o-phenylenediamine as precursor to reduce the energy gap by generating large sp2domains and prepared red emissive CDs with photoluminescence quantum yield(PLQY) of 31.54% in ethanol [14].Wei and co-workers prepared red emissive Zn/ZnO decorated CDs with PLQY of 40.3% in ethanol [15].Jiaet al.synthesized red emissive electron-donating group passivated CDs with the PLQY up to 86.0% in ethanol [16].To the best of our knowledge, nearly all reported red/NIR emissive CDs with high PLQY are realized in non-aqueous solutions, which are against for high performance bioimaging application.
In order to overcome luminescence quenching in aqueous solution, several methods were exploitedviasurface modification to prevent water molecules from interacting with CDs [17,18].For example, Donget al.[19] prepared carboxyl-rich blue emissive CDs.After modifying with ethylenediamine (EDA), their PLQY can be improved from 1.3% to 3.0% in aqueous solution.However, there are scarce reports on CDs that significantly enhance the red emission in aqueous solution by modifying their surface.Therefore, it is still a challenge to develop efficient red emissive CDs in water with good cellular uptake for improved bioimaging[2,20,21].
Polyethylene imine (PEI) is a cationic macromolecule and has a polyamine structure, which is more conducive to interacting with negatively charged proteins in the cell membrane [22–24].In our previous work, green emissive CDs with self-quenching-resistant were synthesized from citric acid and branched PEI with PLQY of 26% in solid state [25].Herein, we developed a facile microwave heating method to modify red emissive CDs with PEI through dehydration process between carboxyl groups on CDs and amino groups in PEI to effectively prevent water induced red emission quenching.High PLQY up to 25% in red fluorescence region was realized from the PEI functionalized CDs (CDs@PEI) in aqueous solution.In the meantime, the surface charges were changed from negativity for pure CDs to positivity for CDs@PEI, which significantly improved the cellular uptake for improved bio-imaging.More important, the CDs@PEI exhibit much better photostability than commercial red emissive dye (MitoTracker red) in cell fluorescent imaging.
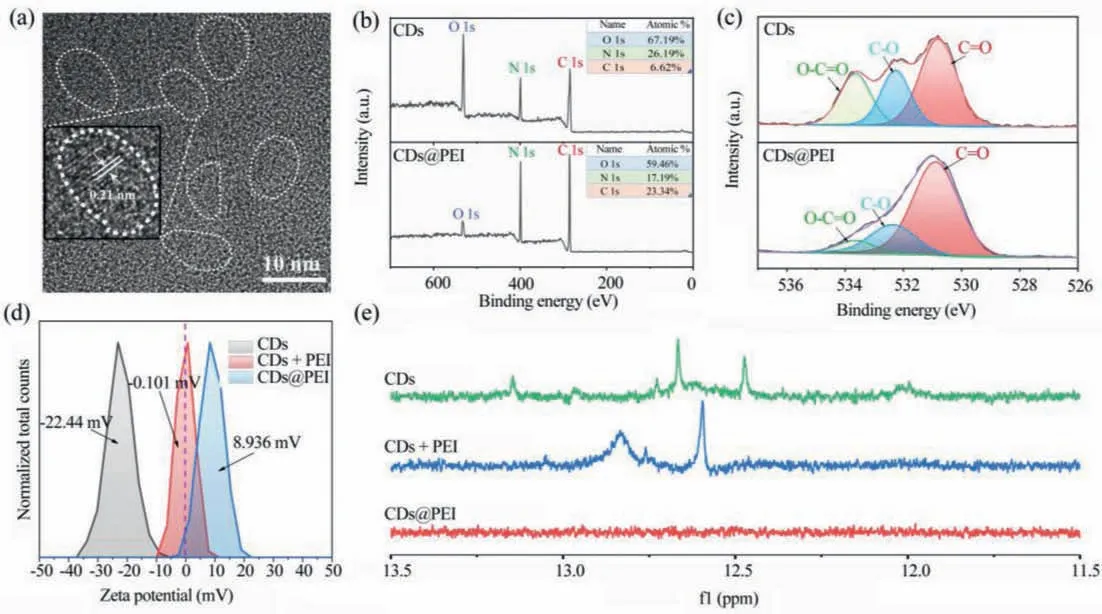
Fig.1.Material characterization.(a) High-resolution TEM image of CDs@PEI, the white dotted lines show the profiles of each CDs; (b) XPS analysis of CDs and CDs@PEI; (c)High-resolution O 1s XPS spectra of CDs and CDs@PEI; (d) Zeta potential spectra of CDs, CDs@PEI and CDs+PEI in aquesou solutions; (e) 1H NMR spectra of CDs, CDs@PEI and CDs+PEI in DMSO–d6 with the same CDs concentration.
The CDs were synthesized using citric acid and urea under solvothermal conditions inN,N-dimethylformamide (DMF) according to our previous work [26].CDs@PEI was prepared by adding 4 mL PEI in 8 mL CDs DMF solution at a concentration of 0.5 g/mL,after 700 W microwave-heating for 5 min at 40°C.The sample was further dialyzed with 1500–3000d dialysis tube to remove residual PEI molecules.The X-ray powder diffraction pattern of CDs was shown in Fig.S1 (Supporting information), the peak at 26.4° corresponds to crystalline graphitic cores, indicating the successful synthesis of CDs [27].The morphologies of CDs@PEI were characterized by transmission electron microscopy (TEM) shown in Fig.1a.High-resolution TEM image showed CDs with clear 0.21 nm lattice fringes, which was close consistent with the (100) plane of graphite [28].X-ray photoelectron spectroscopy (XPS) and nuclear magnetic resonance (NMR) were performed to study the chemical structural evolutions from CDs to CDs@PEI.XPS (Fig.1b) analysis of CDs and CDs@PEI reveal the presence of C, O, N.The O content in CDs@PEI was significantly decreased.The high-resolution O 1s XPS spectra (shown in Fig.1c) confirmed the existence of C=O (530.7 eV), C-O (532.2 eV), O-C=O (533.6 eV) for O 1s in CDs and CDs@PEI [29–32].By comparison, O-C=O signal of CDs@PEI was much weaker than that of CDs.Considering PEI molecules do not contain oxygen, it can be inferred the decreased O-C=O signal in O 1s XPS spectra of CDs@PEI is attributed to the dehydration process between carboxyl groups on CDs and amino groups in PEI.The ratio of C–N bonds for CDs@PEI in C 1s spectra increased, (Fig.S2 in Supporting information) further verifying the combination of the carboxyl group and amino group.Thus, PEI molecules were covalently modified on the surface of CDs after microwave heating treatment.Zeta potential analysis (Fig.1d) further demonstrated the surface PEI modification by the reversed surface charges from negativity for CDs to positivity for CDs@PEI.It should be noted mixing CDs with PEI molecules cannot reverse the surface charges of CDs in large extent.In the1H NMR spectra of CDs and a mixture of CDs and PEI (CDs+PEI) in DMSO–d6, proton signals from carboxyl groups could be detected from 13.5 ppm to 12.0 ppm.For CDs@PEI, the proton signals in 13.5–12.0 ppm were vanished, indicating nearly all the carboxyl groups on CDs reacted with amino groups in PEI through microwave induced dehydration process, which agree with the XPS results.
The absorption spectra of CDs, mixed CDs and PEI (CDs+PEI)and CDs@PEI aqueous solutions were shown in Fig.2a.CDs aqueous solution appeared a light grayish color with a maximum absorption band at 580 nm, a shoulder band at 530 nm, and an absorption tail up to near infrared region.After mixing or modifying with PEI, the color of CDs+PEI and CDs@PEI aqueous solutions exhibit bright red color with decreased absorption tail in long wavelength region, as shown in Fig.2a.In contrast to pure CDs, and CDs+PEI aqueous solutions, the shoulder band at 530 nm was obviously enhanced in the CDs@PEI aqueous solution, which can be due to the weakened electron drawing groups on CDs@PEI caused by the dehydration reaction between amino groups in PEI and carboxyl groups in CDs.It is interesting to find the emissions from CDs in water can be significantly enhanced after modification with PEI.As shown in Fig.2b, upon 450 nm laser excitation, the CDs presented a green luminescence center at 540 nm in aqueous solution,which can be enhanced by mixing with PEI.In contrast, CDs@PEI aqueous solution exhibited further enhanced green emission with significant emerging red emission band centered at 600 nm, indicating modification with PEI not only protect energy quenching by water molecules, but also facilitate energy transfer from the green emission center to the red emission center.Under 550 nm laser excitation (shown in Fig.2c), the red emission from CDs@PEI was 15-fold enhancement compared to the pure CDs aqueous solution.The EX-EM spectra (Figs.2d–f) of CDs, CDs+PEI, CDs@PEI and PEI (Fig.S3 in Supporting information) aqueous solutions can well exhibit the contribution of PEI modification to the enhanced red emission.The CDs aqueous solution exhibit a dominant green emission center at 540 nm and a weak red emission center at 600 nm.After modifying with PEI, the red emission center was significantly enhanced and became dominant.Under the 550 nm excitation, the photoluminescence quantum yield (PLQY) was greatly enhanced from 2% in CDs aqueous solution to 25% in CDs@PEI aqueous solution.
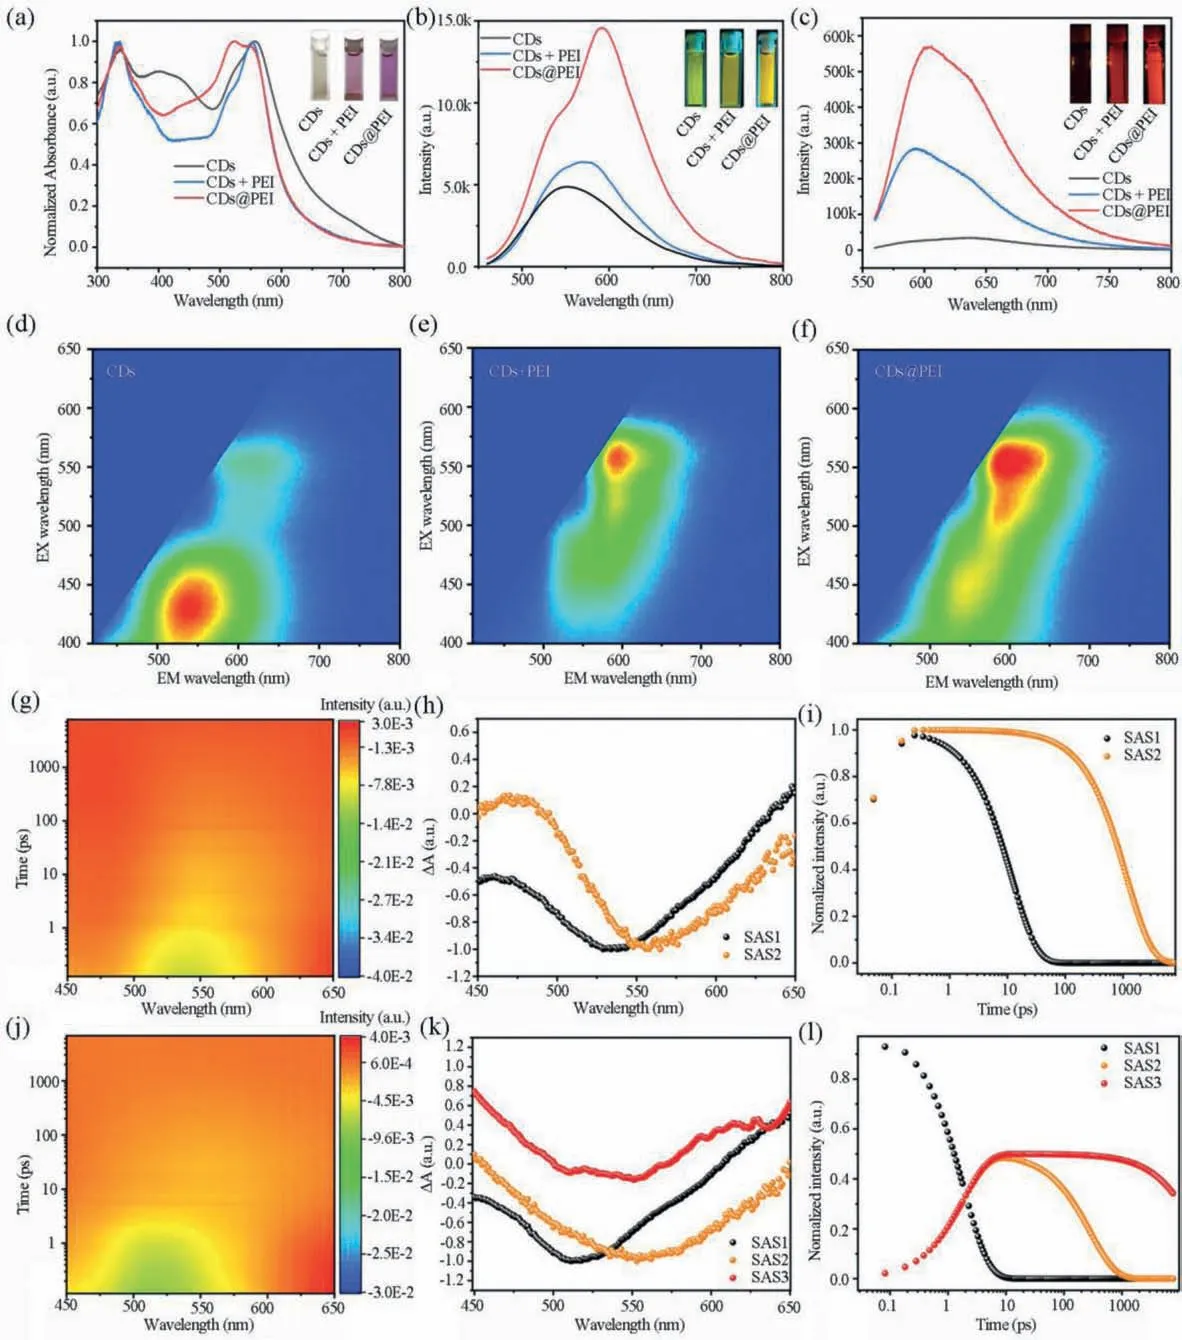
Fig.2.Optical properties analysis.(a) UV–vis absorption spectra of CDs, CDs+PEI and CDs@PEI aqueous solutions (inset: photographs of CDs, CDs+PEI and CDs@PEI aqueous solutions under daylight); PL spectra of CDs, CDs@PEI and CDs+PEI dilute aqueous solutions under excitation at 450 nm (b) and 550 nm (c), respectively.The insets show the fluorescence images of CDs, CDs+PEI and CDs@PEI aqueous solutions under 450 nm and 550 nm excitation; Excitation (EX)-emission (EM) mapping images of CDs (d),CDs+PEI (e) and CDs@PEI (f) dilute aqueous solutions; 3D mapping images of (g) CDs and (j) CDs@PEI in aqueous solutions; Deconvoluted species associated TA spectra of(h) CDs and (k) CDs@PEI in aqueous solutions; Population dynamics of (i) CDs and (l) CDs@PEI in aqueous solutions.
To further study the luminescence mechanism of CDs and CDs@PEI in aqueous solutions, transient absorption spectroscopy measurements under 380 nm excitation were conducted.As shown in Figs.2g and j, the 3D mapping images of CDs and CDs@PEI aqueous solutions, either the features or the kinetic demonstrate a huge difference after PEI coating.To have a close look, global and target analysis have been performed and their species associate spectra (SAS) are shown in Figs.2h and k [33].For CDs, a two species model has been used, demonstrating a parallel decay process with their ground states recovery of their characteristic transient features centered around 530 nm and 550 nm in dozens of picoseconds and a nanosecond, separately (Figs.2i and l).We propose the specie centered around 530 nm to the core state (CS,SAS1) and the specie centered around 550 nm to the surface state(SS, SAS2).For CDs@PEI, the PEI modification of the CDs surface prevent the core from water molecules and decrease the surface electron withdrawing groups, thus, on one hand, making the absorption minima of the CS shift to 520 nm and strengthens the energy transfer pathway from CS to the SS, while, on the other hand, elongating the lifetime of either the CS or the SS to 22 ns as shown in the time profile of remaining feature-mixed species associate Fig.2l.
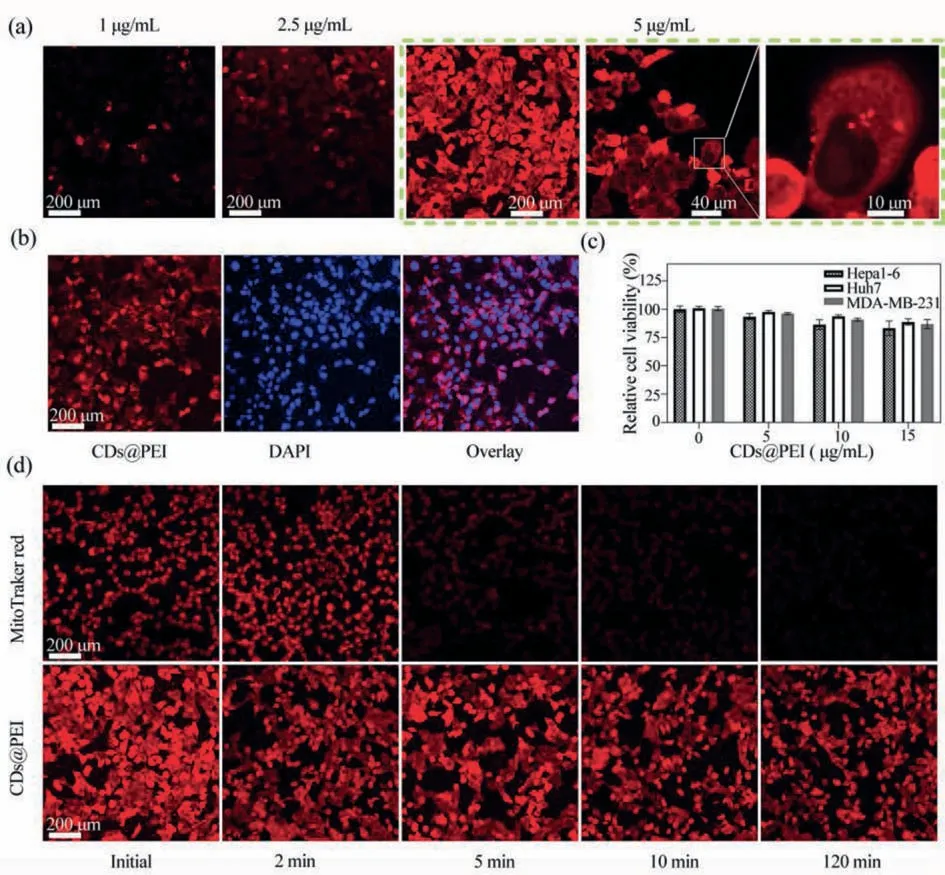
Fig.3.Fluorescence confocal microscope images of stained Hepa1–6 cells upon laser irradiation (543 nm).(a) Fluorescence images of Hepa1–6 cells incubated with various concentrations of CDs@PEI (1, 2.5, 5 μg/mL) for 1.5 h; (b) Colocalization of CDs@PEI (5 μg/mL) with DAPI on Hepa1–6 cells.(c) MTT assay of Hepa1–6, Huh7, MDA-MB-231 cells relative viability after 12 h with different concentrations of CDs@PEI.(d) Fluorescent stability of CDs@PEI (5 μg/mL) and Mito Tracker red comparison for 2, 5, 10 and 120 min continuous laser irradiation (532 nm).
A possible luminescence mechanism for CDs and CDs@PEI in aqueous solutions was illustrated in Scheme 1.In aqueous environment, strong interactions of pure CDs with water molecules significantly quench the fluorescence from the core state and surface state.After microwave heating induce PEI modification, the surface of CDs was functionalized by PEI molecules, which effectively prevent the interactions of CDs with water molecules, leading to strengthened energy transfer from core state to surface state and enhanced red emission in aqueous solution.
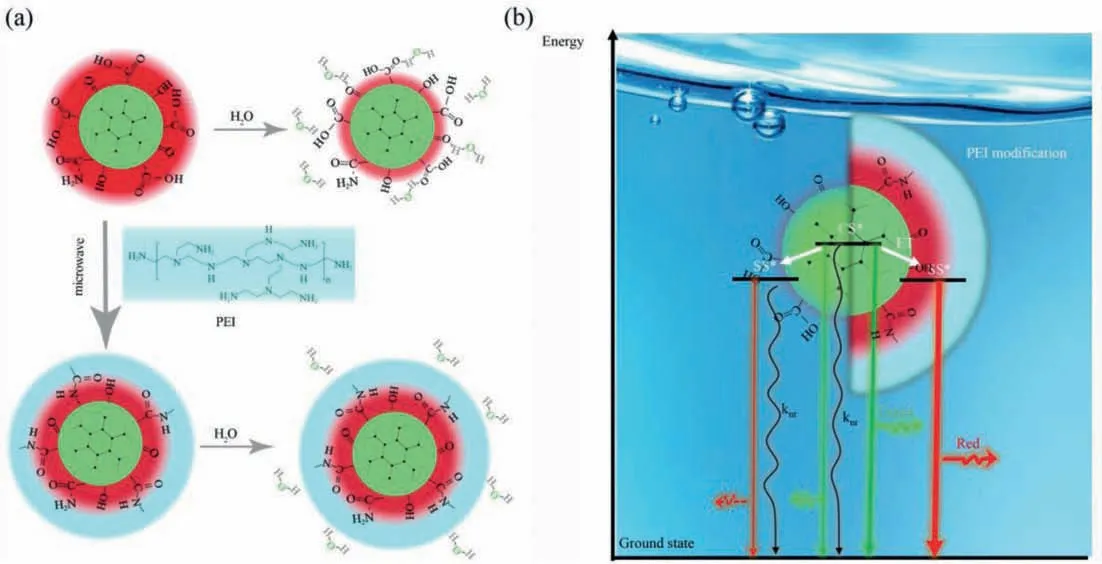
Scheme 1.(a) Illustration of the chemical environment of CDs and CDs@PEI in aqueous solutions.(b) Proposed energy diagrams of the CDs (left) and CDs@PEI (right).‘SS’and‘CS’are energy states corresponding to the surface state and carbon core absorption bands, respectively.‘knr’designate nonradiative dissipation of energy.
To study the performance of these CDs-based cell imaging,Hepa1–6 cells were incubated with CDs@PEI and CDs at a concentration of 5 μg/mL for cell imaging test.As shown in Fig.S4(Supporting information), no obvious fluorescence signals were observed in cells incubated with CDs for 1.5 h.In contrast, for the cells incubated with CDs@PEI for 1.5 h, clear red fluorescence images were presented and demonstrated the great potential in bioimaging within aqueous solution.To explore the optimized cell imaging conditions, the Hepa1–6 cells were incubated with various concentrations of CDs@PEI (1, 2.5, 5 μg/mL) for 1.5 h, and the status of cells was observed through a fluorescence confocal microscope (Fig.3).From Fig.3a, we could find that the fluorescence intensity in the cells gradually increased along with the concentration enhancement.It was observed that CDs@PEI were mainly distributed in the cytoplasm using a higher magnification lens (100×),and no obvious signals were found in the nucleus, which can be further demonstrated by colocalization tests with the nuclear dye(DAPI).As shown in Fig.3b, it could be seen that CDs@PEI mainly distributed around the nucleus after the materials entered the cell membrane.As the specialized nuclear dyes, DAPI was well adopted due to its bright intensity and specificity.Through the comparison, perfect marker efficiency has also been demonstrated with CDs@PEI.
To achieve the potential applications of CDs@PEI in biomedicalrelated fields, we continued to test their cellular cytotoxicity.The cellular cytotoxicity of CDs, CDs+PEI and CDs@PEI can be found in Fig.S5 (Supporting information), and CDs@PEI in mouse liver cancer cells (Hepa1–6), human liver tumor cells (Huh7) and human breast cancer cells (MDA-MB-231) were investigated using MTT analysis.Different concentrations of CDs@PEI were incubated with Hepa1–6, Huh7 and MDA-MB-231 cells.After 12 h, the survival rates of these cells were measured respectively.As shown in Fig.3c, it was found that when the concentration of CDs@PEI reached 5 μg/mL, all the cell viabilities were as high as 96%.Even for the concentration of 15 μg/mL, those cells’average survival rates could still achieve ∼90%, indicating low cytotoxicity of CDs@PEI below 15 μg/mL.
The fluorescence stability is a crucial indicator for the performance of one fluorescent probe.As shown in Fig.S6 (Supporting information), CDs, CDs+PEI and CDs@PEI had superior photostability.The photostability of CDs@PEI was further tested in comparison with a commercial red fluorescent dye (MitoTracker red).CDs@PEI and MitoTracker labeled cells were arranged to go through continuous irradiation under a laser of 532 nm for 120 min, whose fluorescence intensities were recorded within various time durations, as shown in Fig.3d.After 5 min laser scanning, the red fluorescence intensity of the MitoTracker red-labeled cells was greatly weakened.Increasing laser scanning time longer than 10 min, the fluorescence intensity of MitoTracker red-labeled cells nearly fully vanished.In contrast, even after 120 min continuous laser irradiation, there was no significant change in the fluorescence intensity of CDs@PEI labeled cells, indicating much better photostability than commercial organic dye.These results demonstrate that CDs@PEI has great potential as high-performance red fluorescent marker for cell imaging.
To boost the biomedical applications of CDs@PEI, we took their ability of fast cell staining within 5 min for clonogenic essay study.Different densities (0.2×10⁵, 0.4×10⁵, 0.6×10⁵, 1×10⁵, 1.8×105,2×105cells) of Hepa1–6 cells were adopted to simulate various clone formation states.With laser excitation at 550 nm, clear and bright fluorescence images could be obtained even with cell concentration as low as 10%, and the colony distribution of cells could be easily distinguished from Fig.S7 (Supporting information).These results were consistent with crystal violet staining which was one commercial dye used for clonogenic assay.Through the above analysis, the excellent fluorescence performance of CDs@PEI in aqueous solution would achieve broad application prospects for revealing different levels of colony formation.
In summary, we demonstrated an effective method of microwave heating assisted surface modification of CDs with PEI to prevent their red emission quenching in aqueous solution.The PEI modified CDs (CDs@PEI) exhibit high PLQY of 25% in aqueous solution.The proposed PEI functionalization strategy not only protects the red emission against water molecules quenching, but also reverses the surface charges from negativity to positivity to promote cellular uptake of CDs, leading to fast, clear, photostable cell imaging in red fluorescence region.Potential application of CDs@PEI on fast staining of cells for clonogenic assay has been well demonstrated.We prospect the PEI surface modification strategy may be suitable for other long wavelength emissive CDs CDs@PEI, which can promote their wide applications in bioimaging and biomedicalrelated fields.
Declaration of competing interest
The authors declare no competing financial interest.
Acknowledgments
This work was supported by the National Natural Science Foundation of China (No.61922091), the Science and Technology Development Fund of Macau SAR (Nos.0040/2019/A1,0073/2019/AMJ, 0128/2020/A3 and 0131/2020/A3), University of Macau (Nos.SRG2019–00163-IAPME, MYRG2019–00103-IAPME).
Supplementary materials
Supplementary material associated with this article can be found, in the online version, at doi:10.1016/j.cclet.2022.01.042.
 Chinese Chemical Letters2022年8期
- Chinese Chemical Letters的其它文章
- Adsorptive removal of PPCPs from aqueous solution using carbon-based composites: A review
- A review on hollow fiber membrane module towards high separation efficiency: Process modeling in fouling perspective
- Recent advances in DNA glycosylase assays
- Chiral pillar[n]arenes: Conformation inversion, material preparation and applications
- Recent progress in carbon-based materials boosting electrochemical water splitting
- Working principle and application of photocatalytic optical fibers for the degradation and conversion of gaseous pollutants