
Magnetic Ti3C2Tx/Fe3O4/Ag substrate for rapid quantification of trace sulfonamides in aquatic products by surface enhanced Raman spectroscopy
2022-09-16 05:24ZhongningYuLuHuangZhuominZhangGongkeLi
Chinese Chemical Letters 2022年8期
Zhongning Yu, Lu Huang, Zhuomin Zhang, Gongke Li
School of Chemistry, Sun Yat-sen University, Guangzhou 510275, China
ABSTRACT Surface-enhanced Raman scattering (SERS) spectroscopy has been employed as a rapid analysis technology for food security inspection recently.Nowadays, it is still a great challenge to rapidly quantify multiple trace antibiotics potentially abused in aquaculture industry.In this work, a magnetic Ti3C2Tx/Fe3O4/Ag substrate was prepared for the development of a reliable rapid SERS quantification method for multiple trace sulfonamides in aquatic products.This magnetic substrate had good uniformity, reproducibility,stability and SERS activity.Moreover, this substrate could integrate the magnetic separation-enrichment and matrix clean-up without cross contamination, which endowed it with good selectivity and antiinterference capability during real sample analysis.The electromagnetic enhancement and chemical enhancement mechanism of this magnetic substrate were studied in detail to reveal its good separationenrichment performance and SERS activity.Finally, a rapid SERS quantification method was established and practically applied for trace phthalic sulfathiazole (PST) and silver sulfadiazine (SSD) in aquatic products by using Ti3C2Tx/Fe3O4/Ag magnetic substrates.Trace PST and SSD could be actually detected and quantified as 55.9 μg/kg and 64.0 μg/kg in aquatic products, respectively.Good recoveries of 83.9%–116%with relative standard deviations (RSDs) of 0.5%–3.2% for PST and 80.2%–102% with RSDs of 1.3%–5.8% for SSD were obtained.This work proposed an efficient and reliable method for rapid quantification of trace multiple sulfonamides in complex aquatic samples during food security inspection.
Keywords:Magnetic substrate Ti3C2Tx/Fe3O4/Ag Rapid SERS quantification Trace sulfonamides Aquatic samples
It is of great significance to develop rapid and accurate quantification technologies for monitoring antibiotic abuse during food security inspection.Sulfonamides (SAs) as a kind of synthetic antibiotics have stablep-aminobenzene sulfonamide structure and high antibacterial activity to a wide range of bacteria [1,2].With the expanding aquaculture industry in recent years, the abuse and illegal use of multiple antibiotics for aquaculture disease control has become increasingly serious.It may cause bad effect to human healthviafood chain accumulation effect, including potential carcinogenic and mutagenic risks [3,4].Moreover, long-term exposure to these antibiotics can cause increasing drug resistance of microbial strains[5].Thus, high requirements are put forward in the strictly limited use of SAs in aquaculture.Actually, the department of agriculture of China limits the dosage of SAs in animal derived food within 100μg/kg [6] as same as the European Union standard [7].Due to the strict limit standards of trace SAs in aquatic products, it is essential to establish a simple, low-cost, sensitive and accurate method for rapid quantification of trace multiple SAs in aquatic products to curb the abuse of SAs and improve the efficiency of food security supervision.
At present, commonly used methods have been applied for SAs analysis in aquatic products mainly including high performance liquid chromatography (HPLC) [8–10], microbial detection[11–13] and immunoassay [14–16].HPLC method has the advantages of sensitivity and accuracy, but it is not suitable for onsite rapid detection because of its complex pretreatment, expensive instrument and large solvent consumption [8].Microbiological method is available for high-throughput screening of samples with easy operation and low cost, but its sensitivity and specificity is not very high with the long time-consumption [17].Despite the characteristics of strong specificity and simple pretreatment, immunoassay is easy to be interfered by the external environment and internal cross reaction, resulting in a potentially high false positive rate [15].Compared with the above technologies,surface-enhanced Raman spectroscopy (SERS) technology not only provides abundant molecule fingerprints information of targets but also takes the advantages of high sensitivity, portable instrument,less interference by water and fluorescence [18,19], which makes it suitable for rapid quantification of trace SAs.However, the matrix interference of protein, fat, amino acid and sugar in aquatic products becomes a serious obstacle to achieve rapid and effective SERS quantification [20,21].Therefore, it is necessary to develop the effi-cient sample pretreatment technology adaptable for the rapid SERS quantification with high selectivity and good accuracy in aquaculture.
Among the conventional sample pretreatment techniques, the traditional liquid-liquid extraction [22] and QuEChERS (quick, easy,cheap, effective, rugged, safe) [23] methods are easy to be operated and widely used, but they are usually time-consuming with weak enrichment capability.Solid-phase extraction (SPE) has high enrichment factors, but cumbersome operation makes it unsuitable for rapid analysis [24].Magnetic solid phase extraction (MSPE) is a new dispersive SPE technology using specific materials, as adsorbents are usually integrated with magnetic isolation [25].With the advantages of efficient adsorption and quick clean-up process,MSPE can greatly improve the extraction efficiency, reduce the matrix interference and avoid the cross contamination [26,27], which would be an efficient, rapid and SERS-adaptable sample pretreatment technology for aquatic products.Therefore, it is of great significance to combine SERS and MSPE to prepare magnetic SERS substrate, so as to reduce the matrix interference, avoid cross contamination, improve enrichment efficiency and the SERS response.At present, the preparation of magnetic SERS substrates was focused on the core-shell structure composite synthesized by the noble metal nanoparticles modified on the surface of bigger Fe3O4spheres [28] which would easily cause the heterogeneous distribution and low SERS enhancement.Thus, some nanomaterials with large specific surface area have been reported to prepare magnetic substrates, including graphene [29,30], metal organic frameworks[31], halloysite nanotubes [32], molecularly imprinted polymers[33],etc.However, the current magnetic substrates are still difficult to meet the requirements of both efficient separation-enrichment and highly accurate SERS quantification.
Ti3C2Tx, as a two-dimensional lamellar MXene material, has attracted the attention of researchers due to its unique and excellent properties [34–36].Primarily, it has a large specific surface area and rich surface functional groups for easy modification, as well as high adsorption capacity and fast adsorption equilibrium for aromatic compounds through electrostatic orπ-πstacking interaction [37].Secondly, Ti3C2Txcan produce significant chemical enhancement through energy and charge transfer with the adsorbed target molecules [38,39].Furthermore, Ti3C2Txcomplex with metal nanolayered structure is formed by modifying noble metal nanoparticles (Au, Ag,etc.) on the surface, which can effectively improve the electromagnetic field distribution with significant electromagnetic enhancement and higher SERS sensitivity[40].Therefore, it is highly expected to develop a magnetic SERS substrate with good separation and enrichment performance and high SERS activity by coupling Ti3C2Txwith magnetic nanoparticles and noble metal nanoparticles.So far, there are few reports about the rapid SERS quantification based on Ti3C2Txmagnetic SERS substrate, especially the analysis of SAs in aquatic products.
In this study, we prepared a magnetic Ti3C2Tx/Fe3O4/Ag substrate by solvothermal method and self-assembly method.Several crucial preparation conditions were optimized to achieve good SERS performance of the proposed magnetic substrate.The electromagnetic enhancement (EM) and chemical enhancement (CM)mechanism of this magnetic substrate was systematically studied to reveal its good separation-enrichment property and SERS activity.A rapid, sensitive and accurate analytical method was established and practically applied for SERS quantification of multiple SAs including phthalic sulfathiazole (PST) and silver sulfadiazine(SSD) in aquatic products by using magnetic Ti3C2Tx/Fe3O4/Ag substrates.The detailed experimental information was shown in S1 in Supporting information.
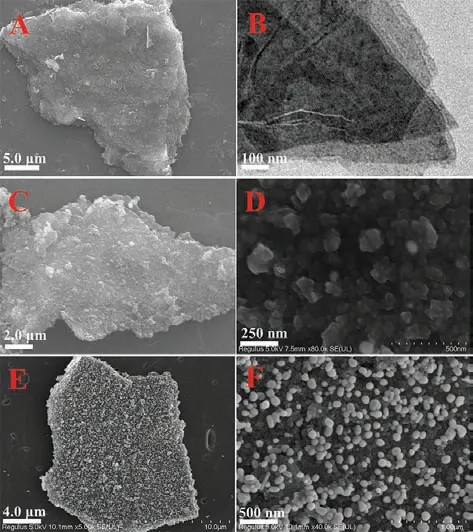
Fig.1.Thermal field emission SEM (A, 8000×) and 120 kV TEM (B, 11,000×) of Ti3C2Tx; thermal field emission SEM (C, 16,000×) and cold field emission SEM(D, 80,000×) of Ti3C2Tx/Fe3O4; cold field emission SEM (E, 5000×; F, 40,000×) of Ti3C2Tx/Fe3O4/Ag.
The preparation process of magnetic Ti3C2Tx/Fe3O4/Ag substrate by a modified one-pot solvothermal method and self-assembly method [41,42] was shown in Fig.S1 (Supporting information).Firstly, Fe3+was adsorbed on the surface of Ti3C2Txby electrostatic interaction, and then Fe3O4particles werein-situgrown by solvothermal method in the presence of sodium acetate and PEG-400 in glycol.Thein-situgrowth of Fe3O4particles which were embedded on the surface of lamellar Ti3C2Tx/Fe3O4provided a more stable structure, compared with post-modification synthesis method [43].Then, the surface charge of Ti3C2Tx/Fe3O4was modified to positive charge by the addition of cationic surfactant of PDDA.After that, the self-assembly of AgNPs on the surface of Ti3C2Tx/Fe3O4was induced by electrostatic interaction to prepare magnetic Ti3C2Tx/Fe3O4/Ag substrate.After the testing solution was mixed with this magnetic substrate, the target compounds could be quickly separated, enriched andin-situdetected by SERS after magnetic separation.Crucial preparation conditions of magnetic Ti3C2Tx/Fe3O4substrates were optimized in detail, including the amount of FeCl3·6H2O, the reaction temperature, the amount of PDDA and the amount of sodium citrate.The specific details were shown in Figs.S2–S5 (S2 section in Supporting information).Finally, 320.0 mg of FeCl3·6H2O, 175.0 °C of reaction temperature, 0.75% PDDA and 2.0 mL of 1.0% sodium citrate were selected as the optimal preparation conditions.
After the optimization of preparation conditions, a series of characterizations were conducted to investigate the property and performance of magnetic Ti3C2Tx/Fe3O4/Ag substrate (S3 section in Supporting information).Firstly, the morphology of this magnetic substrate was recorded by a 120 kV TEM, thermal field emission SEM and cold field emission SEM, respectively.As showed in Figs.1A and B, Ti3C2Txwith smooth surface exhibited specific two-dimensional lamellar structure and a diameter of about 10μm with the layer number of about 3–5.Figs.1C and D showed that Ti3C2Tx/Fe3O4maintained a two-dimensional structure alone with Fe3O4clusters uniformly distributing on the surface.The clusters were composed of multiple Fe3O4nanoparticles with the average size of 50 nm.By comparing the images before and after the introduction of Fe3O4, it was found that the original structure of the Ti3C2Txwas not destroyed by doping Fe3O4.Finally, the spherical AgNPs with the size of 80–100 nm were arranged evenly on the surface of Ti3C2Tx/Fe3O4to form Ti3C2Tx/Fe3O4/Ag magnetic substrate (Figs.1E and F), ensuring the formation of rich "hot spots".The distribution of each component of Ti3C2Tx/Fe3O4/Ag magnetic substrate was characterized intuitively by EDS mapping analysis(Fig.S6 in Supporting information), and the corresponding element contents were listed in Table S1 (Supporting information).The result indicated that elements of Ti (13.69 wt%), C (12.80 wt%), Fe(12.80 wt%), O (20.57 wt%) and Ag (38.85 wt%) were evenly distributed on the surface of this magnetic substrate, indicating the uniformity of each component of the substrate.
Zeta potential analyzer was used to characterize the potential change of Ti3C2Tx/Fe3O4/Ag during the preparation process, as shown in Fig.S7 (Supporting information).Originally, the potential of Ti3C2Tx/Fe3O4was −12.1 mV, which was changed to a positive potential of 59.3 mV modified by cationic polyelectrolyte of PDDA.Then, the negatively charged AgNPs were modified on the surface of Ti3C2Tx/Fe3O4by electrostatic adsorption, leading the potential down to 32.2 mV, which verified the preparation process of the substrate.
The crystal structures of Ti3C2Tx, Ti3C2Tx/Fe3O4and Ti3C2Tx/Fe3O4/Ag were characterized by XRD in Fig.S8 (Supporting information), showing the good crystallinity.The diffraction peaks at 32.8°, 40.6° and 49.1° were in good accord with the reflections from (101), (104) and (107) crystal planes of Ti3C2Tx[44].Compared to PDF #79-0419, the diffraction peaks at 30.1°, 35.5°, 43.1°,53.6°, 57.0° and 62.6° were attributed to the (220), (311), (400),(422), (511) and (440) planes of Fe3O4nanocrystals, respectively.In addition, the peaks at 38.1°, 44.3°, 64.4°, 77.4° and 81.5° were corresponded to the (111), (200), (220), (311) and (222) crystal planes of Ag nanocrystals of PDF #04-0783.The above results indicated that Ti3C2Tx/Fe3O4/Ag was successfully synthesized and was consistent with the crystal structure of each composite.
The relevant elements and chemical bonds of Ti3C2Txand Ti3C2Tx/Fe3O4/Ag were characterized by XPS spectra.As shown in Fig.S9 (Supporting information), Ti3C2Txmainly consisted of Ti 2p, C 1s, O 1s and F 1s, in which O 1s and F 1s originated from active groups of −F, −OH and =O on the surface of Ti3C2Txnanosheet.Compared with Ti3C2Tx, the elements of Fe 2p and Ag 3d found in Ti3C2Tx/Fe3O4/Ag were derived from Fe3O4and Ag-NPs, respectively, which suggested the successful preparation of Ti3C2Tx/Fe3O4/Ag.
The potential functional groups of Ti3C2Tx/Fe3O4/Ag magnetic substrate were characterized by FTIR spectrum.As shown in Fig.S10 (Supporting information), the adsorption peaks at 3360,2913, 1633, 1055 and 613 cm−1were presented on Ti3C2Tx,Ti3C2Tx/Fe3O4and Ti3C2Tx/Fe3O4/Ag, which were attributed to−OH, =C−H, C=O, C−O and Ti−O bonds, respectively.Distinctly,Ti3C2Tx/Fe3O4and Ti3C2Tx/Fe3O4/Ag were almost identical to that of Ti3C2Tx, indicating the structural retention of Ti3C2Txafter the post-treatment during the preparation of magnetic substrate[45,46].
In addition, the magnetic property of Ti3C2Tx/Fe3O4and Ti3C2Tx/Fe3O4/Ag were characterized by a magnetic hysteresis loop measurement at room temperature.As shown in Fig.S11 (Supporting information), the saturation magnetization of Ti3C2Tx/Fe3O4and Ti3C2Tx/Fe3O4/Ag were 16.56 and 13.52 emu/g, respectively.The results suggested that Ti3C2Tx/Fe3O4had a strong magnetism performance.After doping AgNPs on the surface, the saturation magnetization of Ti3C2Tx/Fe3O4/Ag had a slight decrease, but it could still meet the requirement for consequent analysis.
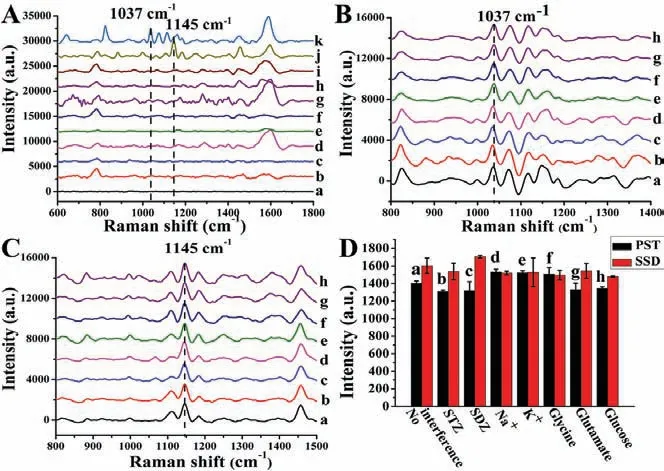
Fig.2.(A) Evaluation of the selectivity of Ti3C2Tx/Fe3O4/Ag magnetic substrates to different antibiotics including blank (a), STZ (b), SDZ (c), SAA (d), SMZ (e), SMX(f), MF (g), SMD (h), SFX (i), SSD (j) and PST (k), respectively.Evaluation of the anti-interference capability of Ti3C2Tx/Fe3O4/Ag magnetic substrates for the detection of 500.0μg/L PST (B) and SSD (C) and the corresponding response histograms(D).The selected interferers included no interferer (a), STZ (b), SDZ (c), Na+ (d), K+(e), glycine (f), glutamate (g) and glucose (h), respectively.
Uniformity and reproducibility are the key factors to study the performance of substrate, which would directly affect the precision and accuracy during SERS quantification.In order to investigate the uniformity and reproducibility of magnetic Ti3C2Tx/Fe3O4/Ag substrate, two concentrations of 1.0 and 1.5 mg/L PST solutions were used as SERS reporters to mix with this magnetic substrate prepared in one batch and different batches for 5 min (v:v, 3:1), respectively.After magnetic separation, the mixture was dropped on the silicon wafer for SERS detection followed by calculating one-batch and batch-to-batch relative standard deviation (RSD).As shown in Figs.S12A and B (Supporting information), the onebatch and batch-to-batch RSD of corresponding SERS response at 1037 cm−1was 4.4% (n= 11) and 7.3% (n= 7), respectively.The results suggested that Ti3C2Tx/Fe3O4/Ag magnetic substrate had good uniformity and reproducibility, which would benefit the improvement of analytical precision and accuracy.In order to investigate the stability of this magnetic substrate, 0.8 mg/L of PST solution was used as SERS reporter to mix with the magnetic substrate which had been stored for 1, 7, 14, 21, 28 and 42 days, respectively for the consequent SERS detection.It was seen from Fig.S13 (Supporting information) that the SERS intensity at 1037 cm−1had very minor fluctuation with RSD less than 6.2%(n=3) during a 42-day testing period.The results showed that Ti3C2Tx/Fe3O4/Ag magnetic substrate had good long-term stability.In addition, the enhancement factor (EF) values of this magnetic substrate to PST and SSD were evaluated and calculated to be 1.4× 10⁶and 5.5× 10⁶, respectively (Fig.S14 in Supporting information).The detailed information was shown in S4 section in Supporting information.The results suggested the great Raman enhancement effect of this magnetic substrate to PST and SSD.
The selectivity and anti-interference capability of the proposed magnetic substrate would decide its practicability for rapid SERS quantification of trace PST and SSD in real aquatic samples.Thus,we evaluated the selectivity and anti-interference capability of Ti3C2Tx/Fe3O4/Ag magnetic substrate in detail.The SERS spectra of commonly used SAs with similar structures including PST, SSD, sulfathiazole (STZ), sulfadiazine (SDZ), sulfacetamide (SAA), sulfamethazine (SMZ), sulfamethoxazole (SMX), mafenide (MF), sulfamidine(SMD) and sulfisoxazole (SFX) were recorded by use of this magnetic substrate, as shown in Fig.2A.It could be seen that magnetic substrate had good SERS response for PST and SSD, presenting more refined fingerprint features and multiple peaks could be used for quantification without matrix interference.
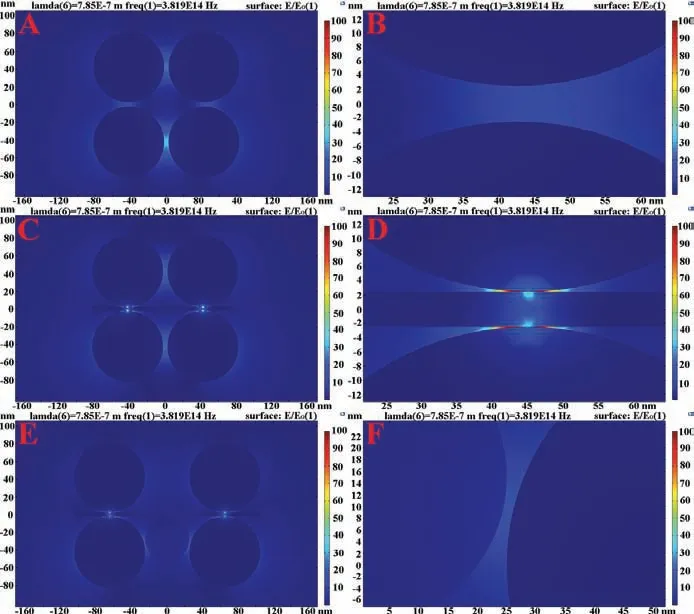
Fig 3.COMSOL simulation results of electromagnetic enhancement effect.Simulation diagram (A) and partial enlarged diagram (B) of AgNPs electromagnetic distribution.Simulation diagram (C) and partial enlarged diagram (D) of AgNPs electromagnetic distribution in the presence of Ti3C2Tx.Simulation diagram (E) and partial enlarged diagram (F) of AgNPs electromagnetic enhancement in the presence of Ti3C2Tx and Fe3O4.
The matrix of actual samples is usually complex accompanied with obvious matrix interference.In order to evaluate the effect of possible co-existing interference, typical substances that might coexist in aquatic samples such as antibiotics (STZ, SDZ), ions (Na+,K+) and nutrients (glycine, glutamate, glucose) were selected for the study of the anti-interference capability of this magnetic substrate.During the evaluation, 10 folds of the concentrations of STZ and SDZ as well as 600 folds of the concentrations of Na+, K+,glycine, glutamate and glucose were added to 500.0 μg/L PST and SSD solutions, respectively followed by SERS detection using this magnetic substrate.It was seen from Figs.2B and C that the characteristic SERS response of PST and SSD was not interfered by the existing interferences and remained stable.Meanwhile, the corresponding SERS response histograms were shown in Fig.2D.It could be seen that the fluctuation of SERS intensity of PST at 1037 cm−1was in range of −6.7%−9.0%, while the fluctuation of SERS intensity of SSD at 1145 cm−1was in range of −7.7%–6.4%.The minor fluctuation suggested that these potential matrix substances had little interference on SERS detection of PST and SSD.The results above indicated that magnetic Ti3C2Tx/Fe3O4/Ag substrate possessed good selectivity and anti-interference capability for SERS quantification of trace PST and SSD in aquatic products.
In this work, we attempted to theoretically study the EM and CM mechanism of this magnetic substrate which contributed to its good sensitivity and selectivity during real sample analysis.Firstly, the EM mechanism was evaluated by the local electromagnetic distribution effect of AgNPs, Ti3C2Tx/Ag and Ti3C2Tx/Fe3O4/Ag simulated by COMSOL, namely the distribution of "hot spots", as shown in Fig.3.Through the simulation comparison of AgNPs and Ti3C2Tx/Ag, it could be seen that in the presence of Ti3C2Txthe electromagnetic field of AgNPs was enhanced along the edge of Ti3C2Txdue to the confinement effect of Ti3C2Tx, which significantly improved the EM effect of the substrate, increased the density of "hot spots" and resulted in the good SERS analytical sensitivity.In addition, through the simulation comparison of Ti3C2Tx/Ag and Ti3C2Tx/Fe3O4/Ag, it could be found that the presence of Fe3O4also promoted the EM effect of AgNPs due to its confinement effect.
Secondly, in order to evaluate the CM mechanism of the substrate, ten SAs antibiotics including PST, SSD, STZ, SDZ, SAA, SMZ,SMX, MF, SMD and SFX were chosen to explore the mechanism of substrate selectivity for PST and SSD.Materials Studio software was utilized to simulate the interaction models of ten SAs molecules with Ti3C2Txmonolayer under optimal configurations,as shown in Fig.S15 (S5 section in Supporting information).It could be seen that the structure unit of Ti3C2Txwas due to three layers of Ti atomics interlaced with two layers of C atomics to be a TiC6octahedral structure with shared edges [47].The different energy value between the total energy of SAs-Ti3C2Txcomplex and the sum of total energy of its components was defined as binding energy (ΔEint) in this study.AndΔEintbetween different SAs and Ti3C2Txand energy difference of SAs combined with Ti3C2Txwere calculated.This energy difference represented the energy difference between the lowest unoccupied molecular orbital (LUMO)and the highest occupied molecular orbital (HOMO) of SAs combined with Ti3C2Tx.In this work, the adsorption trend between target molecule and Ti3C2Txcould be evaluated by use ofΔEint[48].The higherΔEintof target molecule meant its adsorption on the surface of nanomaterials more easily [44].The value of energy difference was a parameter to evaluate the difficulty of energy level transition of target molecules excited by laser [49].Target molecule with the relatively low energy difference tended to occupy energy level transition excited by laser easily.As shown in Table S2(S5 in Supporting information),ΔEintof PST (−2.18 eV) and SSD(−3.00 eV) were significantly higher than the other eight SAs antibiotics.The energy difference of PST (3.137 eV) and SSD (2.358 eV)was significantly smaller than the other seven SAs molecules except SFX.Although the energy difference of SFX (2.696 eV) was slightly lower than that of PST, itsΔEint(−0.43 eV) was much lower than that of PST and SSD, which would make it difficult to be adsorbed on Ti3C2Txand significantly affect its subsequent energy level transition.The results showed that PST and SSD could be adsorbed on the surface of Ti3C2Txmore easily than the other eight SAs antibiotics, and energy level transition of target adsorbed on Ti3C2Txwould occur easily.All the simulation results suggested the significant CM effect of this magnetic substrate to PST and SSD,which would endow this substrate with good selectivity for PST and SSD during real sample analysis.
Firstly, the unique fingerprint characteristic of SERS peaks for PST and SSD molecule by use of magnetic Ti3C2Tx/Fe3O4/Ag substrate were recorded in Figs.S16A and B (Supporting information)for quantification, respectively.Tables S3 and S4 (Supporting information) interpreted typical SERS peaks for identification of PST and SSD which were corresponded to Figs.S16A and B.The detailed identification information was summarized in S6 in Supporting information.Among them, the peak of PST at 1037 cm−1and peak of SSD at 1145 cm−1with little interference and relatively strong SERS intensity were selected for the consequent SERS quantification.
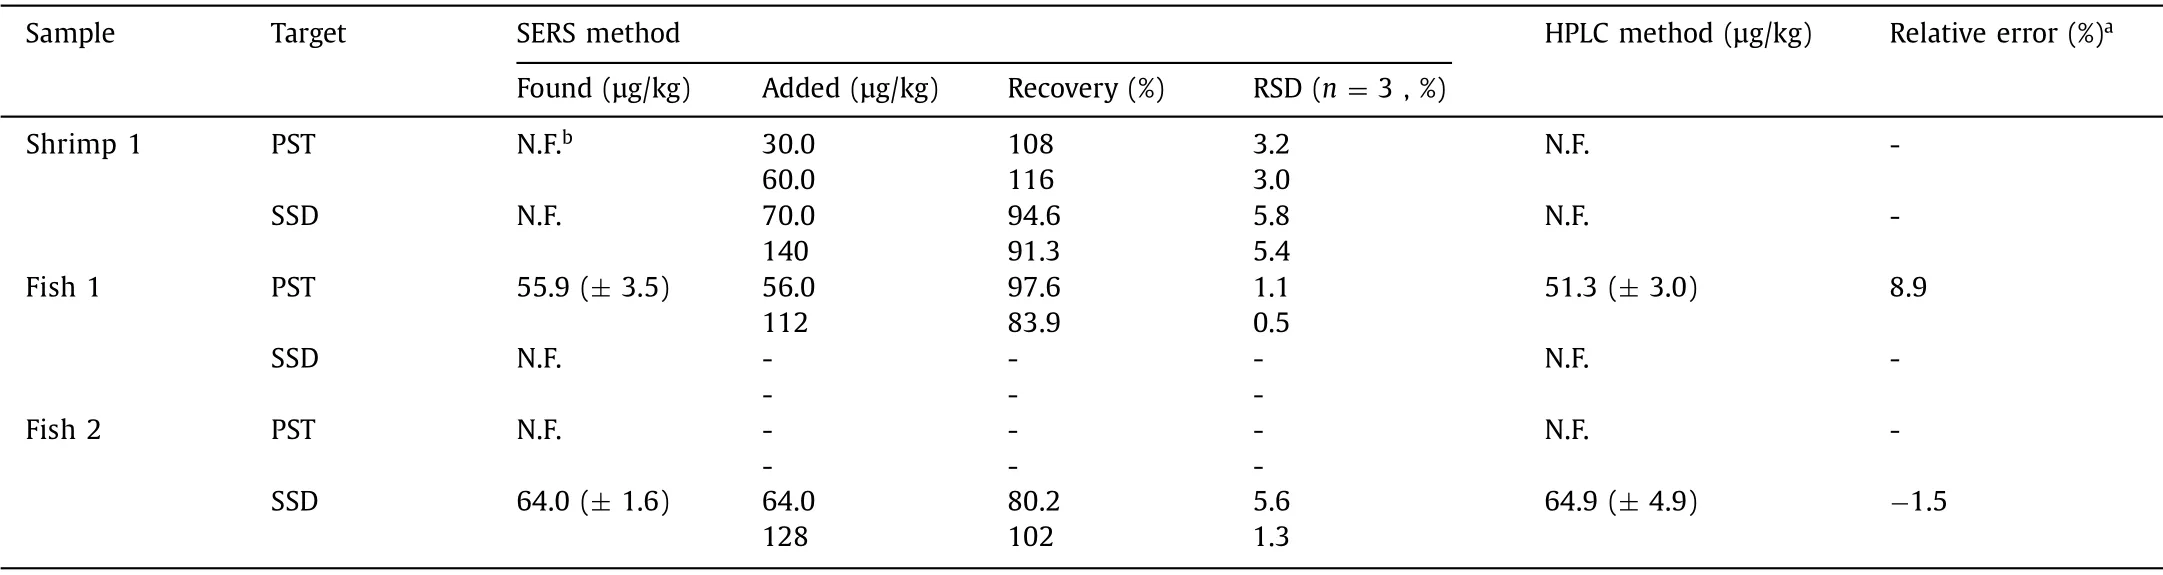
Table 1 Rapid SERS quantification of trace PST and SSD in real aquatic samples.
Then, in order to obtain excellent SERS performance, before the development of quantification method some crucial sample pretreatment conditions including extraction solvent, ultrasonic time and resoluble solvent were optimized in detail, and the optimized conditions were as follows: 5% ammoniated methanol as extraction solvent, 10 min as ultrasonic time and the mixed ammoniamethanol-water solution (ammonia:methanol:water = 5:15:80,v:v:v) as the resoluble solvent.Meanwhile, the SERS analysis conditions were optimized as follows: 3 s of integration time,785 nm of laser wavelength, 48 mW of laser intensity and 2.0 mL of sample volume.Under the optimized experimental conditions,a rapid, sensitive and accurate quantification method for trace PST and SSD in acquatic samples was established by SERS usingTi3C2Tx/Fe3O4/Ag magnetic substrate.An external standard calibration method was utilized for the quantification analysis which was widely suitable for rapid analysis of high number of samples during food security inspection.As shown in Fig.S17 (Supporting information), the linear range for PST at 1037 cm−1was 60.0–1500.0 μg/L with a satisfied correlation coefficient (R2) of 0.9940 and LOD of 26.8 μg/L (S/N = 3).And the linear range for SSD at 1145 cm−1was 40.0–1200.0 μg/L withR2of 0.9916 and LOD of 16.9 μg/L (S/N=3).
Finally, the established SERS method was successfully applied for the rapid quantification of PST and SSD in different aquatic samples including fish and shrimp.It could be seen from Table 1 that PST was actually detected and quantified to be 55.9(± 3.5) μg/kg in fish sample 1, and SSD was also detected and quantified to be 64.0 (± 1.6) μg/kg in fish sample 2.Besides,no PST or SSD was found in shrimp sample 1.The reliability of this method was verified by the spiked experiments.And the recoveries of various aquatic products were measured to be in the range of 83.9%−116% with RSDs of 0.5%−3.2% (n=3) for PST and 80.2%−102% with RSDs of 1.3%−5.8% (n=3) for PST, respectively.For comparison, the quantification results by the proposed SERS method were compared with those by HPLC method.The relative errors between SERS and HPLC methods were in range of−1.5%~8.9%, which further verified the accuracy of the proposed SERS method.The results showed that this SERS method was reliable and accurate for the rapid quantification of trace PST and SSD in aquaculture field.
In summary, a magnetic Ti3C2Tx/Fe3O4/Ag SERS substrate was prepared by solvothermal method and self-assembly method.A series of characterizations showed that this substrate had good uniformity, reproducibility, stability and SERS activity with excellent magnetic separation-enrichment performance.Besides, the substrate showed good selectivity and anti-interference capability for the SERS quantification of PST and SSD due to its combination of strong EM and CM effect which was studied by the systematic simulation calculation.Under the optimized experimental conditions, a rapid SERS quantification of two sulfonamides antibiotics (PST and SSD) in aquatic products was established.The linear range of PST was achieved in the range of 60.0–1500.0 μg/L with a LOD of 26.8 μg/L.The linear range of SSD was achieved in the range of 40.0–1200.0 μg/L with a LOD of 16.9 μg/L.PST and SSD could be actually found and quantified to be 55.9 and 64.0 μg/kg in real aquatic samples by use of this proposed method.The recoveries were in the range of 83.9%−116% with RSDs of 0.5%−3.2%(n=3) for PST and 80.2%−102% with RSDs of 1.3%−5.8% (n=3) for PST, respectively.The results showed that the proposed method was rapid, accurate and reliable, which was suitable for the rapid quantification of trace multiple sulfanilamide antibiotics in aquatic products.
Declaration of competing interest
The authors declare that they have no known competing financial interests or personal relationships that could have appeared to influence the work reported in this paper.
Acknowledgments
The work was financially supported by the National Natural Science Foundation of China (Nos.22074161 and 21976213),Guangdong Basic and Applied Basic Research Foundation (No.2019A1515010107), the Science and Technology Planning Project of Guangzhou City (No.202102080167), the Research and Development Plan for Key Areas of Food Safety in Guangdong Province of China (No.2019B020211001), the National Key Research and Development Program of China (No.2019YFC1606101), and the State Key Program of National Natural Science of China (No.22134007),respectively.
Supplementary materials
Supplementary material associated with this article can be found, in the online version, at doi:10.1016/j.cclet.2021.10.045.
 Chinese Chemical Letters2022年8期
- Chinese Chemical Letters的其它文章
- Adsorptive removal of PPCPs from aqueous solution using carbon-based composites: A review
- A review on hollow fiber membrane module towards high separation efficiency: Process modeling in fouling perspective
- Recent advances in DNA glycosylase assays
- Chiral pillar[n]arenes: Conformation inversion, material preparation and applications
- Recent progress in carbon-based materials boosting electrochemical water splitting
- Working principle and application of photocatalytic optical fibers for the degradation and conversion of gaseous pollutants