
A primer-initiated strand displacement amplification strategy for sensitive detection of 5-Hydroxymethylcytosine in genomic DNA
2022-09-16 05:24YundLiYnfeiZhngZhenningYuYuzhiXuSiYngLiuZongDiXioyongZou
Chinese Chemical Letters 2022年8期
Yund Li, Ynfei Zhng, Zhenning Yu, Yuzhi Xu, Si-Yng Liu, Zong Di,∗,Xioyong Zou
a School of Chemistry, Sun Yat-sen University, Guangzhou 510275, China
b Key Laboratory of Sensing Technology and Biomedical Instrument of Guangdong Province, School of Biomedical Engineering, Sun Yat-sen University,Shenzhen 518107, China
c Scientific Research Center, The Seventh Affiliated Hospital, Sun Yat-sen University, Shenzhen 518107, China
ABSTRACT 5-Hydroxymethylcytosine (5hmC), an intermediate product of DNA demethylation, is important for the regulation of gene expression during development and even tumorigenesis.The challenges associated with determination of 5hmC level include its extremely low abundance and high structural similarity with other cytosine derivatives, which resulted in sophisticated treatment with large amount of sample input.Herein, we developed a primer-initiated strand displacement amplification (PISDA) strategy to quantify the global 5hmC in genomic DNA from mammalian tissues with high sensitivity/selectivity, low input and simple operation.This sensitive fluorescence method is based on 5hmC-specific glucosylation,primer ligation and DNA amplification.After the primer was labeled on 5hmC site, DNA polymerase and nicking enzyme will repeatedly act on each primer, causing a significant increase of fluorescence signal to magnify the minor difference of 5hmC content from other cytosine derivatives.This method enables highly sensitive analysis of 5hmC with a detection limit of 0.003% in DNA (13.6 fmol, S/N=3) from sample input of only 150 ng, which takes less than 15 min for determination.Further determination of 5hmC in different tissues not only confirms the widespread presence of 5hmC but also indicates its significant variation in different tissues and ages.Importantly, this PISDA strategy exhibits distinct advantages of bisulfite-free treatment, mild conditions and simple operation without the involvement of either expensive equipment or large amount of DNA sample.This method can be easily performed in almost all research and medical laboratories, and would provide a promising prospect to detect global 5hmC in mammalian tissues.
Keywords:5-Hydroxymethylcytosine DNA demethylation Fluorescence detection Strand displacement amplification Enzymatic labeling
5-Hydroxymethylcytosine (5hmC), an oxidation intermediate in the 5mC demethylation process mediated by 10,11 translocation(TET) dioxygenases [1–3], is an important epigenetic modification that plays significant roles in a variety of biological processes, for example, gene expression regulation, cellular processes, tissue differentiation and carcinogenesis [4–7].The 5hmC is distributed variously across different cell and tissue types at genome level, and especially enriches in the brain, but presents at low levels in lungs,spleen and a broad range of cancers [8].Accurate quantification of 5hmC levels in genome is of great significance for the diagnosis of diseases and the study of demethylation process, which is still restricted by the extremely low abundance of 5hmC and high structural similarity with other cytosine derivatives.
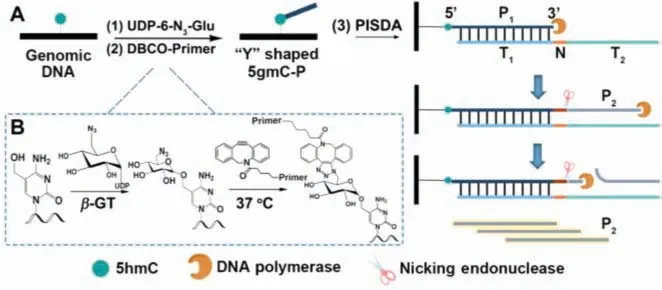
Fig.1.(A) Schematic illustration of PISDA strategy.(B) Mechanism of the glycosylation and click reaction for 5hmC in genomic DNA.
In the past few decades, many methods have been developed for 5hmC detection.Among them, bisulfite-based sequencing technology is the commonly used method.Although 5hmC can be mapped and quantified, the method requires relatively high sequencing cost, and the harsh bisulfite treatment will cause severe DNA degradation [9,10].Immunoassay method is simpler to operate, but it is limited by the possible CpG-density-related bias of antibodies [11,12].Liquid chromatography coupled with mass spectrometry (LC-MS/MS) is the gold standard method for detecting 5hmC in genomic DNA [13].However, a relatively large amount of DNA samples (usually>1 μg) that should be completely digested into nucleosides are required to quantify the low content of 5hmC.Moreover, complicated and expensive MS equipment is needed in this method, which limits its wide application.It has been found that various modification of 5hmC can significantly improve the detection sensitivity and makes it possible to determine 5hmC in genomic DNA using various methods, such as electrochemical and fluorescence methods [14–16].Electrochemical methods possess high sensitivity by introducing electroactive molecules on 5hmC, but most of these methods suffer from complex electrode modification processes and cumbersome operations[17,18].The fluorescence method is extremely simple to operate and very cost-effective for the detection of most biochemical targets [19,20], but the sensitivity is restricted by the fluorescence molecules that require fussy molecule design to obtain an acceptable fluorescence signal.Polymerase chain reaction (PCR) [21] and other amplification methods [22] are often used to increase the sensitivity of fluorescence method, however, it is only applicable for locus-specific and fragment-specific detection of 5hmC [23].Therefore, fluorescence method with good sensitivity and accessibility for the detection of global 5hmC in genomic DNA is highly desirable.
Herein, we propose a primer-initiated strand displacement amplification (PISDA) strategy for global determination of 5hmC with high sensitivity, low input and simple operation.As shown in Fig.1, after genomic DNA is extracted from different tissues and sheared into small fragments, three steps are involved in 5hmC determination from genomic DNA: (1) Glucosylation of 5hmC through T4 Phageβ-glucosyltransferase (T4-βGT) and uridine diphosphate-6-azido-6-deoxy-D-glucose (UDP-6-N3-Glu) into N3-glucosyl-modified 5hmC (N3-5gmC) [24].The highly specific and efficient enzymatic labeling process makes only 5hmC labeled with azide group, instead of other cytosine derivatives such as 5mC, 5-formylcytosine (5fC), and 5-carboxylcytosine (5caC).(2)Copper-free click reaction [25,26] between N3and 5gmC and dibenzocyclooctyne labeled primer (DBCO-Primer) to form a “Y”shaped, primer-labeled 5gmC (5gmC-P).The molecular mechanism is shown in Fig.1B.In detail, after the hydroxyl group of 5hmC is glucosylated by T4-βGT to form N3–5gmC, the azide group will undergo a cycloaddition reaction with alkynyl group of DBCO-Primer to form 5gmC-P.(3) PISDA initiated by the labeled primer at 5hmC locus.After the separation from the unlabeled DBCO-Primer,5gmC-P is submitted to the PISDA system with addition of a DNA template for the amplification detection of 5hmC [27].As shown in Fig.1A, the designed DNA template is comprised of a 3´primerspecific hybridization sequence T1, a recognition sequence N (5′-GAGAC-3′) for Nt.BsmAI nicking endonuclease, and an extension sequence T2to conduct the polymerization process.Once the DNA template hybridizes to the 3′ end of primer (P1), the exonucleasedeficient (exo-) Klenow fragment (KF) polymerase extends P1from its 3′ end, generating a double-stranded DNA (dsDNA) that contains a complete recognition sequence of Nt.BsmAI.Thus the primer side is cleaved by Nt.BsmAI at the next base downstream of the recognition site in the extended dsDNA [28], which is then replaced to generate P2by the strand-displacement activity of KF polymerase.With enough enzymes and deoxynucleotide triphosphates (dNTPs), the PISDA reactions can be consecutively repeated for every primer labeled at one 5hmC site, producing numerous P2within minutes.With this linear amplification strategy, the amount of produced P2is related to the 5hmC level, which can be determined according to the amplified fluorescence signal of SYBR Green II after combination with P2.The PISDA method can realize global level 5hmC determination in different tissues within 15 min, as well as reduce sample input and avoid the sophisticated instruments.
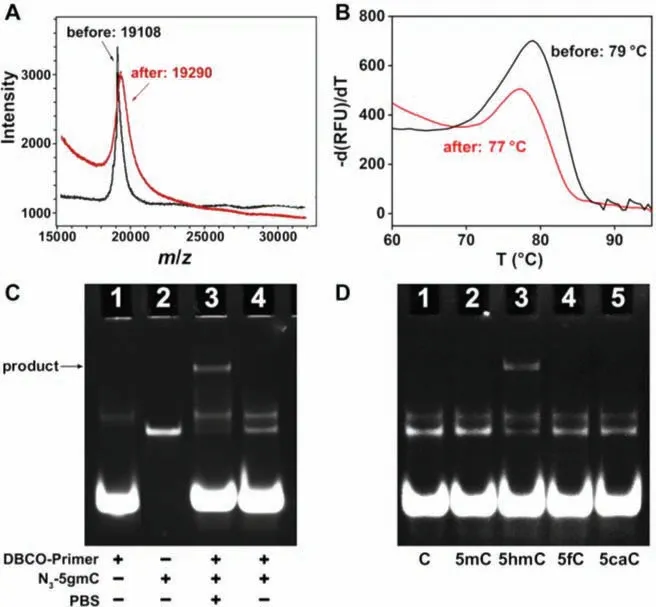
Fig.2.(A) MALDI-TOF MS characterization of 5hmC-containing model DNA before (black line) and after (red line) glucosylation treatment.(B) Melting curves for double-stranded 5hmC-containing model DNA before (black line) and after (red line) glucosylation treatment.(C) PAGE analysis of DBCO-Primer (lane 1), N3-5gmC(lane 2), N3-5gmC+DBCO-Primer+pH 7.4 PBS (lane 3), and N3-5gmC+DBCOPrimer+pH 8.0 TE buffer (lane 4).(D) Selectivity of the labeling process with model DNA containing different cytosines: C (lane 1), 5mC (lane 2), 5hmC (lane 3), 5fC(lane 4), and 5caC (lane 5).
The idea of the proposed PISDA strategy relies on the successful labeling of primer on 5hmC to trigger the amplification reaction.We used a 62-nt model DNA bearing one 5hmC site to verify the labeling feasibility, of which the sequence is listed in Table S1 (Supporting information).After the first glucosylation step, the generation of N3–5gmC was evidenced by the matrixassisted lasers desorption/ionization time-of-flight mass spectrometry (MALDI-TOF MS).As shown in Fig.2A, the main MALDI-TOF MS signal of N3–5gmC-containing model DNA was found at massto-charge ratio (m/z) of 19,290 (calculated 19,281), which evidently differed from 5hmC-containing model DNA (m/z19,108, calculated 19,093).With sufficient amount of T4-βGT and UDP-6-N3-Glu, the glucosylation efficiency of 5hmC was increased with the increasing reaction time from 2 h to 24 h (Fig.S1 in Supporting information).Furthermore, the melting temperature (Tm) of the double-stranded 5hmC-containing model DNA was reduced by 2 °C after glucosylation treatment (Fig.2B).
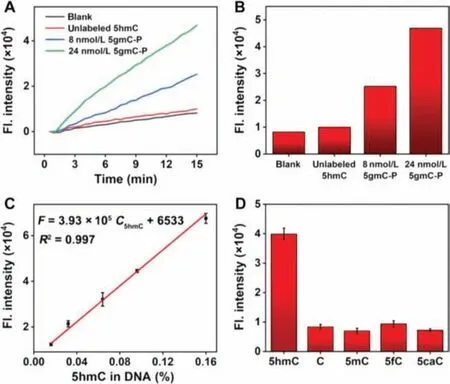
Fig.3.(A) Time-dependent fluorescence spectra and (B) histogram of fluorescence intensity obtained at 15 min of (A) for blank, 24 nmol/L unlabeled 5hmC DNA, 8 and 24 nmol/L 5gmC-P.(C) Linear plots of fluorescence intensity obtained at 15 min versus 5hmC levels.(D) Selectivity of PISDA strategy on model DNA containing 5hmC,C, 5mC, 5fC and 5caC.
Next, the generation of 5gmC-P after the second step, click reaction, was characterized by native polyacrylamide gel electrophoresis (PAGE).As shown in Fig.2C, when the 33-nt primer (lane 1)was added to the 62-nt N3–5gmC-containing model DNA (lane 2),the generated “Y” shaped 5gmC-P caused large steric hindrance for electrophoresis analysis (lane 3).Interestingly, the negligible band of model DNA showed that the click reaction was nearly completed in PBS buffer (pH 7.4), indicating a high conversion effi-ciency.However, there was no band in lane 4 for product in TE buffer (pH 8.0), indicating that the pH of solutions may affect the click reaction.Then, a series of N3-5gmC/DBCO-Primer molar ratios(1:20, 1:50, 1:100 and 1:200) were used to optimize the synthesis of 5gmC-P.A slight increase of the click reaction efficiency was observed with higher DBCO-Primer amount, but the amounts of primer dimers and primer polymers were synchronously increased(Fig.S2, lanes 1–4, in Supporting information), which may cause background signal in the following amplification procedure.Therefore, 1:50 was chosen for click reaction with high efficiency and low background.It has also been proved that 5gmC-P is stable and will not be dissociated in the denaturing step at 95 °C for 6 min(Fig.S2, lane 5, in Supporting information).
In order to test the labeling selectivity, the model DNA containing cytosine (C), 5mC, 5fC and 5caC was treated in the same way of glucosylation and click reaction as 5hmC, and then characterized by native PAGE.As shown in Fig.2D, after treatment with T4-βGT/UDP-6-N3-Glu and DBCO-Primer, none of these cytosine derivatives can form the product band except 5hmC.All these results indicate that 5hmC can be efficiently and specifically labeled with primer to yield 5gmC-P.
The key to realizing 5hmC quantification is that the PISDA reaction can only occur at the introduction of primer on 5hmC site,and the fluorescence signal has a linear relation with 5hmC content as designed.Therefore, we verified the feasibility of the PISDA assay.As shown in Fig.3A, when PBS was analyzed as blank by the PISDA method, there was only a minor increase of the fluorescence intensity, which was mainly due to the nonspecific amplification reaction triggered by KF polymerase and Nt.BsmAI.Similarly, a relatively weak fluorescence response close to blank was observed when 24 nmol/L unlabeled 5hmC was analyzed as control, suggesting that PISDA is hardly triggered by unlabeled 5hmC due to the absence of primer.Compared to those with the blank and unlabeled 5hmC, the fluorescence intensity significantly increased with 8 nmol/L 5gmC-P, and typical linear response was obtained with the progress of PISDA, indicating that PISDA was successfully initiated by the labeled 5hmC.The fluorescence signal obtained at the PISDA time of 15 min exhibited the highest with 24 nmol/L 5gmC(Fig.3B), indicating that the PISDA assay can successfully realize the distinguishment of the labeled 5hmC, and quantify the 5hmC content according to the fluorescence response.
To improve the detection performance of PISDA method, the concentrations of KF polymerase, Nt.BsmAI and template were optimized.Upon increasing the concentration of KF polymerase from 0.1 U/L to 0.3 U/L, an obvious increase of the fluorescence signal was observed until a plateau was reached at 0.25 U/L, after which the intensity almost had no variation (Fig.S3 in Supporting information).With the similar optimization approach, 0.25 U/L and 100 nmol/L were selected as the optimal concentrations for Nt.BsmAI (Fig.S4 in Supporting information) and template (Fig.S5 in Supporting information), respectively.
Under the optimal conditions, the quantitative performance of PISDA assay for 5hmC was investigated.As previously mentioned,the polymerase and nicking enzyme will repeatedly act on each primer, which means that the increase of fluorescence signal is dependent on the labeled 5hmC level.After being purified from the unbound primer, 5gmC-P was mixed with unlabeled 5hmC at a series of different proportions (1%, 2%, 4%, 6%, and 10%), making the detectable 5hmC level as 0.016%, 0.032%, 0.064%, 0.096%,and 0.160% in DNA.Then the samples were subjected to the amplification reaction.As shown in Fig.3C and Fig.S6 (Supporting information), the fluorescence intensity (F) obtained at the PISDA time of 15 min increased with the increasing 5hmC level (C5hmC),with a linear regression equation ofF=3.93×10⁵C5hmC(% in DNA)+6533 (R2= 0.997).The limit of detection (LOD) was calculated to be 0.003% 5hmC in DNA (13.6 fmol, also 4.5 pg, S/N=3)from 150 ng of sample input, which was lower than that obtained by commercial kits (10 pg), and comparable with those of other global 5hmC quantification methods such as standard LC-MS/MS and chemiluminescent biosensor [29–33], but with a shorter detection time (Table 1).Although it takes a long time to chemoenzymatically label 5hmC with an alkyne-modified tag as the previous works did by Shahalet al.[25], taking advantage of simple pretreatments for 5hmC as well as the short detection time,this method is still applicable for detecting multiple samples at the same time.
Before applying this method for biological samples, it is necessary to ensure that the complex DNA samples, which possess all kinds of cytosine derivatives with similar structure, will not interfere the labeling and determining process for 5hmC.Thus, we verified the selectivity of the assay for 5hmC determination.As shown in Fig.3D, the fluorescence intensity of 5hmC showed a significant increase, while those of 5mC-, 5fC-, and 5caC-containing model DNA remained as low as the blank signal (Fig.3B) after the same treatment of PISDA.Consequently, the determination of 5hmC will not be interfered by other bases that are universally present in biological DNA samples even with high structural similarity.
The reliability of the PISDA method was assessedviarecovery experiments by spiking different contents of 5hmC (0.016%,0.048%, and 0.096%) into the artificially prepared DNA sample containing 0.008% 5hmC.After the PISDA measurement, the results showed recovery in the range of 96.4%−108.3%.The parallel measurements of different concentrations of 5hmC gave small relative standard deviations (RSDs) of 2.1%−3.9% (Table S2 in Supporting information), indicating a satisfactory accuracy and reliability.

Table 1 Comparison of the analytical parameters for global 5hmC quantification.
The feasibility of the PISDA method for biological sample analysis was further investigated.5hmC has various distributions in different tissues and cells, which is particularly enriched in the brain of mammals, and will accumulate with age.Thus, the whole genomic DNA extracted from adult rat hippocampal neuronal tissue was used to construct a quantitative calibration curve for the detection of global 5hmC.To make sure that the reaction condition is similar between genomic DNA and model DNA, the extracted genomic DNA was sheared into small pieces (∼250 bp) before the labeling process according to the manufacturer’s instruc-tions (Fig.S7 in Supporting information).The global 5hmC level of rat hippocampal neuronal DNA was quantified to be 0.180% in DNA using standard LC-MS/MS, and served as a standard sample for calibration curve.Samples with different 5hmC level were obtained by mixing the labeled DNA with unlabeled DNA in various proportions, making the detectable 5hmC level as 0.018%, 0.036%,0.072%, 0.108%, 0.144%, and 0.180% in DNA.The mixed DNA samples were detected under optimized conditions, and Fig.4A showed that there was a linear relationship between fluorescence intensity and global 5hmC level, with a linear regression equation ofF=3.66×10⁵C5hmC(% in DNA)+3789 (R2= 0.997).The LOD was estimated to be 0.007% in DNA (S/N=3).It is worth emphasizing that the linear range from 0.018% to 0.180% covers 5hmC levels found in most biological samples [34], making it suitable for determining global 5hmC levels in different tissues.
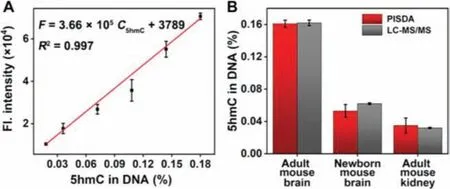
Fig.4.(A) Quantitative calibration curves for 5hmC in rat hippocampal neuronal DNA.(B) Detection of 5hmC in genomic DNA extracted from different mouse tissues by PISDA and the standard LC-MS/MS.
To demonstrate the distribution characteristics of 5hmC in different ages and tissues, the contents of 5hmC from adult mouse brain, newborn mouse brain, and adult mouse kidney, were analyzed by the PISDA method, which were determined as 0.161%,0.053%, and 0.035%, respectively (Fig.4B).Of note, when detecting low-abundance 5hmC, the fluorescence signal was more susceptible to the nonspecific amplification signal, resulting in increased relative errors in both newborn mouse brain and adult mouse kidney samples.However, the results of PISDA method were still in good agreement with those obtained by standard LC-MS/MS (Fig.4B and Table S3 in Supporting information), indicating the good accuracy of the proposed PISDA method even in complex media.Based on the above data, 5hmC is unevenly distributed among different tissues, and a much larger amount of 5hmC was observed in adult mouse brain tissue, suggesting that the distribution of 5hmC is tissue- and age-specific as previously reported[24,34].Importantly, it indicates that 5hmC may play a significant role in the development of mammalian organs especially the brain.
In summary, we propose a facile PISDA method to determine the 5hmC levels in genomic DNA of various biological samples with high selectivity, high efficiency and low sample input.This method is free of severe DNA degradation caused by bisulfite treatment, and is friendly to use without MS-based sophisticated apparatus or complex operations.With the assistance of isothermal amplification method, low-abundance 5hmC can be amplified in several minutes at nanoscale sample input, making it very sensitive with a detection limit of 0.003% 5hmC (13.6 fmol).Moreover, the PISDA strategy is capable of determining 5hmC from multifarious mammal tissues at mild conditions with handy equipment in the laboratory, which is appealing for the 5hmC studies that require numerous samples to be analyzed quickly and inexpensively.
Declaration of competing interest
The authors report no declarations of interest.
Acknowledgments
This work was supported by the Scientific Technology Project of Shenzhen City (Nos.JCYJ20200109142410170,JCYJ20210324120601004 and JCYJ20210324124003008), the National Natural Science Foundations of China (Nos.21775169,21801259 and 21974153), the Scientific Technology Project of Guangzhou City (No.202103000003), the Guangdong Natural Science Foundation (No.2019A1515010587), and the Guangdong Science and Technology Plan Project (No.2020B1212060077).
Supplementary materials
Supplementary material associated with this article can be found, in the online version, at doi:10.1016/j.cclet.2021.12.019.
 Chinese Chemical Letters2022年8期
- Chinese Chemical Letters的其它文章
- Adsorptive removal of PPCPs from aqueous solution using carbon-based composites: A review
- A review on hollow fiber membrane module towards high separation efficiency: Process modeling in fouling perspective
- Recent advances in DNA glycosylase assays
- Chiral pillar[n]arenes: Conformation inversion, material preparation and applications
- Recent progress in carbon-based materials boosting electrochemical water splitting
- Working principle and application of photocatalytic optical fibers for the degradation and conversion of gaseous pollutants