Transcriptome analysis of Porphyridium purpureum under salinities of 0 and 68*
Xudan LU, Fangru NAN, Jia FENG, Junping LÜ, Qi LIU, Xudong LIU, Shulian XIE
School of Life Science, Shanxi Key Laboratory for Research and Development of Regional Plants, Shanxi University, Taiyuan 030006, China
Abstract The most prominent biological characteristic of Porphyridium purpureum is their unique extracellular sulfated polysaccharides that plays an important protective role against salt stress. Adaptation to stress is associated with metabolic adjustments. However, the molecular mechanisms underlying such metabolic changes remain elusive. This study presents the first transcriptome profiling of P. purpureum.A total of 8 019 assembled transcripts were identified, annotated, and classified into diff erent biological categories and pathways based on a BLAST analysis against various databases. The in-depth analysis revealed that many of the diff erentially expressed genes in P. purpureum under salinities of 68 and 0 involved polysaccharide metabolism. A comparison of the gene expression levels under diff erent salinities revealed that the polysaccharide synthetic pathway was significantly upregulated under the 68 salinity condition. The increased expression of the FBP, pfkA, CS, pgm, USP, UGP2, galE, and MPI transcripts in the polysaccharide synthetic pathway and the increase in ATP2 and ATP6 transcripts in the energy metabolic pathway revealed the molecular mechanism of high-salt adaptation. This sequencing dataset and analysis could serve as a valuable resource to study the mechanisms involved in abiotic stress tolerance in Rhodophyta.
Keyword: transcriptome; salinity; polysaccharides; osmotic adjustment; enzyme activity
1 INTRODUCTION
PorphyridiumNägeli is a relatively unique singlecelled red algal genus that is widely distributed in soil and on moist walls.Porphyridiumcan also grow in seawater media, indicating thatPorphyridiumhas high salt resistance. In addition, single-celled algae often collect to form red or light brown flakes.
Porphyridiumcan survive stressful conditions,such as drought, high salt, extreme temperatures, and high light intensities (Tannin-Spitz et al., 2005).Extracellular sulfated polysaccharides play a role in protecting the algae against the external environment(Arad and Levy-Ontman, 2010). Sulfated polysaccharides mainly consist of galactan polymers containing sulfate residues, and the main sugars of the polymers are xylose, glucose, galactose, and uronic acid in diff erent ratios (Heaney-Kieras and Chapman,1976; Percival and Foyle, 1979; Gloaguen et al.,2004). Most of the polysaccharides remain attached to the cell (bound part) during growth in liquid medium, while the outer part dissolves from the cell surface into the medium (soluble part), which becomes progressively more viscous. Based on this unique rheological property (viscoelasticity) of polysaccharides, they are increasingly useful in commercial applications as gelling agents, thickeners,stabilizers, and emulsifiers (Arad et al., 1985). In addition,Porphyridiumpolysaccharides have unique biological activities, such as antiviral, antitumor,hypolipidemic, anti-radiation, and antibacterial eff ects as well as antioxidant activity as free radical scavengers (Tannin-Spitz et al., 2005; Chen et al.,2010). Many studies have been performed on the biological activities of the polysaccharides(Talyshinsky et al., 2002; Wijesekara et al., 2011).Therefore,Porphyridiumpolysaccharides have broad potential for further development into products in the health food, pharmacy, and cosmetic industries(Wijesekara et al., 2011).
In-depth research has been conducted on the physiological and biochemical characteristics, growth environment, and nutritional conditions ofPorphyridium. Research on the genomic and molecular regulation ofPorphyridiumhas also made progress with the development of sequencing technology and the wide application of highthroughput sequencing. A total of 116 genes encoding carbohydrate-active enzymes (CAZymes) has been identified in theP.purpureumgenome database,including 31 glycoside hydrolases (GHs), 83 glycosyltransferases (GTs), and 2 carbohydrates, and the genome characteristics are consistent with their complex extracellular polysaccharide structure(Bhattacharya et al., 2013). The chloroplast genome ofP.sordidumwas published in 2016, which contains the key coding genes of photosynthesis and the carbon fixation reaction pathway. That study provided a theoretical basis for the carbon metabolic and polysaccharide synthetic pathways inPorphyridium(Lee et al., 2016). High salt concentration is a significant chemical stress for microalgae. Microalgae adapt to salinity stress through osmotic adjustment(Mishra et al., 2008), and research on salinity and polysaccharide accumulation in microalgae has received increasing attention (Nuutila et al., 1997).
We have previously reported thatP.purpureumcontains high polysaccharide contents (Lu et al.,2020).P.purpureumgrows normally in high-salt conditions, and contains a high polysaccharide content compared to algae inhabiting freshwater conditions (Lu et al., 2020). However, the molecular mechanism ofPorphyridiumpolysaccharide synthesis under diff erent salinities is not completely understood.The transcriptome is the main method to study gene expression and elucidate transcriptional regulation in organisms. Transcriptome analysis is a powerful tool for studying complex molecular mechanisms (Nan et al., 2018), and RNA sequencing is an effi cient method to analyze transcriptome data.
In this study, we reveal the adaptation and metabolic mechanism ofPorphyridiumunder diff erent salinities at the molecular level by transcriptome analysis, and the transcriptome profile ofP.purpureumis proposed.The coding gene contents and functional annotations were analyzed in a BLAST analysis, the significantly diff erentially expressed genes (DEGs) under diff erent salinities were selected, and the diff erential expression levels were determined. The results will provide the basis for studying the molecular mechanism of the synthesis ofPorphyridiumpolysaccharides under diff erent salinity conditions.
2 MATERIAL AND METHOD
2.1 Algal strain and cultivation
Previous studies have shown thatPorphyridiumhas high salt resistance and can even survive in highsalt environment of 35-46 (Golueke and Oswald,1962). In the study, the original algal strain ofPorphyridiumpurpureumFACHB-806 was purchased from the Freshwater Algae Culture Collection at the Institute of Hydrobiology (Wuhan, China), collected from moist soil (Wuhan, Hubei province, China), but can grow under salinities ranging from 0 to 68 as a freshwater red algae (Lu et al., 2020). TheP.purpureumwas cultured in KOCK medium (http://algae.ihb.ac.cn/english/mediumDetail.aspx?id=13).The components of the medium are shown in Supplementary Table S1.
Based on the principle of controlling a single variable, two salinity conditions were set by changing the artificial seawater in the KOCK medium. Among them, the 0 salinity group (freshwater conditions)replaced the artificial seawater with distilled water,and the 68 salinity group (high-salinity conditions)replaced the water with twice the concentration of artificial seawater. TheP.purpureumthat grew to the logarithmic phase was inoculated into a 500-mL Erlenmeyer flask containing 300 mL of KOCK medium of diff erent salinities, and then placed in a room with a 12-h/12-h photoperiod; illumination was 60 μmol/(m2·s), and the culture temperature was(25±2) °C. The algal solution was shaken three times per day.
The 0 salinity group was labeled P0_1, P0_2, and P0_3, and the 68 salinity group was labeled P68_1,P68_2, and P68_3.P.purpureumcells cultured for 15 days were collected by centrifugation, washed in distilled water, frozen quickly in liquid nitrogen, and the samples were sequenced.
2.2 Enzyme activity
Kinases and phosphorylases are critical for polysaccharide synthesis (Yan, 2016). The citrate acid cycle provides energy for polysaccharide synthesis.Moreover, ATPases are mainly related to ion transport(Hong et al., 2018). Therefore, fructose-1,6-bisphosphatase, phosphofructokinase, citrate synthase(CS), and ATPase were selected to determine enzyme activities and to explore the eff ects of salt stress on key enzyme activities during polysaccharide synthesis.The enzyme activities were measured using a fructose-1,6-bisphosphatase (FBP) kit, a phosphofructokinase(PFK) activity detection kit, a CS activity detection kit, and an ATPase activity detection kit from Solarbio(Beijing, China) to compare the eff ects of the diff erent salinities on enzyme activities in the polysaccharide metabolic pathway.
2.3 RNA extraction and preparation of the cDNA library
Total RNA of each sample was extracted according to Xu (2016). RNA integrity and contamination were monitored by 1% agarose gel electrophoresis. RNA purity was checked using the NanoPhotometer spectrophotometer, and RNA integrity was assessed using the Agilent 2100 Bioanalyzer (Agilent Technologies, Palo Alto, CA, USA).
A total of 1.5-μg sample RNA was taken as the starting material to construct the library, and the NEBNext®UltraTM RNA Library Prep Kit for Illumina (NEB, Ipswich, MA, USA) was used to construct the library. First, polyT oligo-attached magnetic beads were used to enrich the mRNA with polyA tail, and the resulting mRNA was randomly interrupted with the divalent cations in the NEB fragmentation buff er. Subsequently, fragmented mRNA, random hexamer primers, and M-MuLV reverse transcriptase were used to synthesize the firststranded cDNA, and RNase H, DNA polymerase I,and dNTPs were used to synthesize the secondstranded cDNA. Next, the purified double-stranded cDNA was treated by end-repair, A-tailing, and sequencing adapter connections, and the AMPure XP system (Beckman Coulter, Brea, CA, USA) was used to select cDNA fragments of 250-300 bp in length.The polymerase chain reaction (PCR) was performed,the products were purified using the AMPure XP system, and the library was obtained.
After constructing the library, the library was diluted to 1.5 ng/μL, and the Qubit2.0 Fluorometer was used for the preliminary quantification.Subsequently, the insert size of the library was assessed on the Agilent 2100 Bioanalyzer, and quantitative real-time PCR (qRT-PCR) was used to accurately quantify the eff ective concentration of the library (eff ective concentration of the library>2 nmol/L) to ensure the quality of the library.After pooling diff erent libraries, the libraries were sequenced on an Illumina Hiseq platform, and 150-bp paired-end reads were generated. Finally, the sequence information of the test fragment was obtained.
2.4 Transcriptome analysis
Raw data (raw reads) were directly obtained by high-throughput sequencing and contained the joint and lower quality reads. The raw reads were filtered with fastp (version 0.19.7) to ensure high quality. Raw reads in the FASTQ format were processed through in-house perl scripts. In this step, clean data (clean reads) were obtained by removing reads containing adapters, reads containing ploy-N (N indicates that the base information cannot be determined), and lowquality reads (number of bases with Qphred value ≤20 accounted for more than 50% of reads) from the raw data. The Q20 (corresponding to sequencing quality with a 99% accuracy rate), Q30 (corresponding to sequencing quality with a 99.9% accuracy rate), GC content, and sequence repetition level of the clean reads were calculated, and all downstream analyses were based on clean high-quality data.
Trinity was used to assemble the clean reads into transcripts for the transcriptome analysis without a reference genome (Grabherr et al., 2011), and Corset was used for hierarchical clustering of the transcripts(Davidson and Oshlack, 2014). The transcripts were aggregated into clusters according to shared reads between the transcripts, and the transcripts with expression diff erences between samples were separated from the original cluster to establish a new cluster according to the transcript expression level and the H-Cluster algorithm. Each cluster was finally defined as a “gene”. The longest cluster sequence was used for subsequent analysis, and the transcript and cluster sequence length were counted.
After transcriptome assembly, the transcripts were functionally annotated to obtain comprehensive gene function information. Gene function was annotated based on a BLAST (Altschul et al., 1997) search against the following seven databases: Nr (NCBI non-redundant protein sequences), Nt (NCBI nonredundant nucleotide sequences), Pfam (Protein family), KOG/COG (Clusters of Orthologous Groups of proteins), Swiss-prot (A manually annotated and reviewed protein sequence database), Automatic annotation ServerKO (KEGG Ortholog database),and the gene ontology (GO).
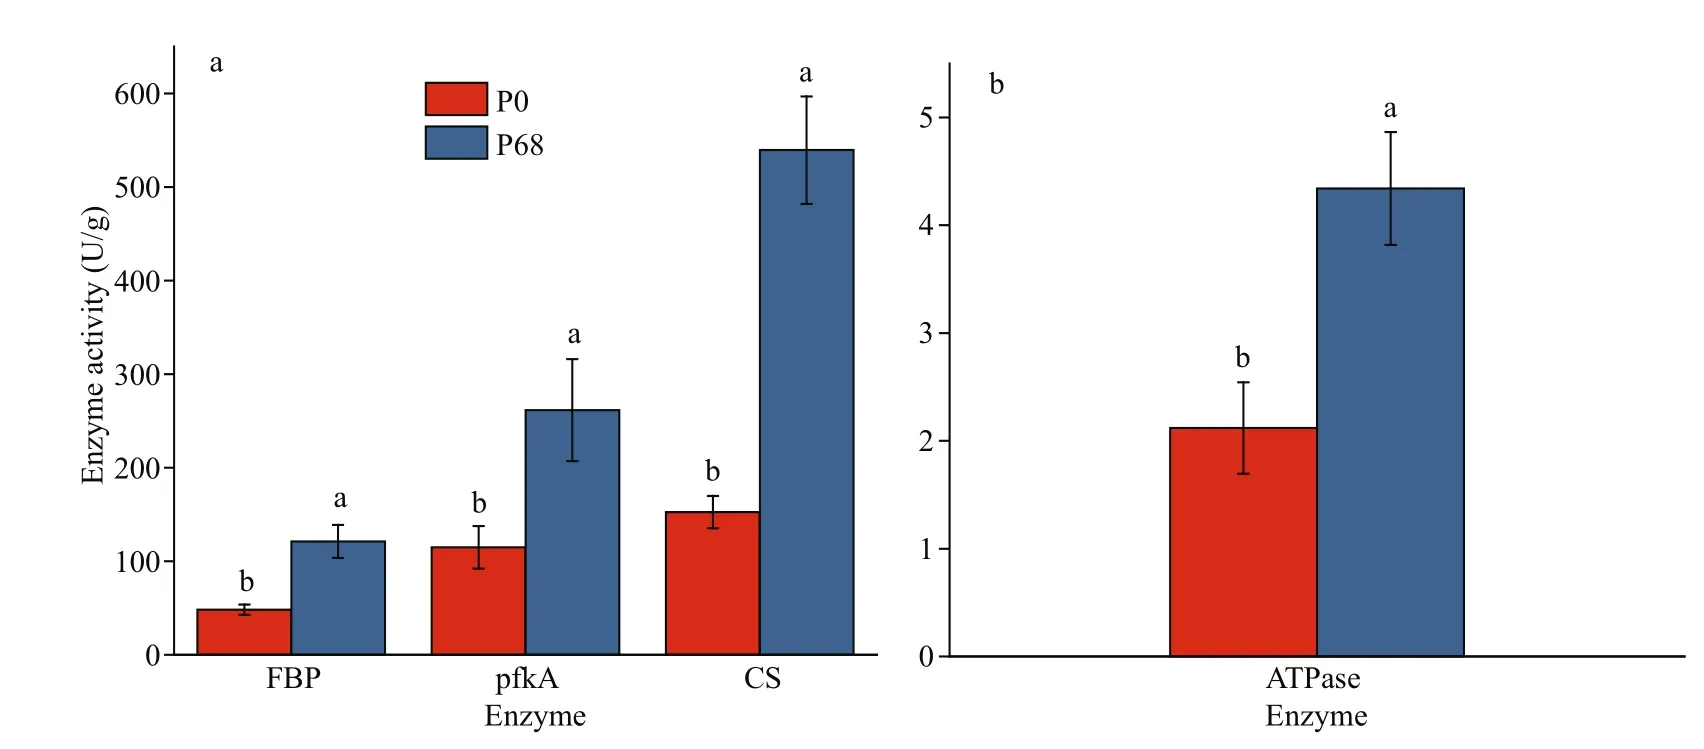
Fig.1 The activity of key enzyme of P. purpureum in P0 and P68
2.5 Quantification of gene expression levels and diff erential expression analysis
The clean reads of each sample were mapped to the reference sequence (assembled transcripts), the read count for each gene was obtained, and gene expression levels were estimated by RSEM (Li and Dewey,2011). Next, the read count for each gene was converted into FPKM (expected number of Fragments Per Kilobase of transcript sequence per Millions base pairs sequenced) (Trapnell et al., 2010) to obtain the gene expression patterns under the diff erent salinities.The correlation coeffi cients within and between groups were calculated based on the FPKM values of all genes in the sample to test the reliability of the experiment and the rationality of sample selection.DESeq was used to detect significant DEGs among diff erent samples (Anders and Huber, 2010), and then the number of DEGs (including upregulated and downregulated) was statistically analyzed. Finally,KOBAS was used to perform the KEGG pathway enrichment analysis on the DEGs (Mao et al., 2005).
2.6 Quantitative real-time polymerase chain reaction (qRT-PCR) validation
A cDNA library was used as the template. Takara TB Green Premix Ex TaqTMII (Tli RNaseH Plus) was used as the fluorescent dye for qRT-PCR. Ten genes from the DEG pool with smallerp-values were screened and selected, includingFBP,pfkA,CS,pgm,USP,UGP2,galE,MPI,ATP2, andATP6.Actinwas selected as the internal control gene according to a previous study (Xu, 2016). The sequences of the qPCR primers are shown in Supplementary Table S2, and the qPCR reaction system is shown in Supplementary Table S3. The amplification procedures were 95 °C for 20 s, 40 cycles of 95 °C for 10 s, 52 °C for 10 s, and 72 °C for 30 s, followed by a dissolution stage of 95 °C for 15 s, 60 °C for 1 min, and 95 °C for 15 s.The specificity of the qPCR products was estimated based on a melting curve analysis. The expression values of each gene were calculated using the method proposed by Pfaffl (2001).
2.7 Construction of the protein-protein interactive network
The protein-protein interaction (PPI) analysis of DEGs was based on the STRING database of known and predicted PPIs (http://string-db.org/). The DEG sequences were BLASTed to theCyanidioschyzonmerolaegenome to obtain the predicted PPIs of the DEGs. The BLAST settings for constructing interaction networks were e-value=1e-10 and max_target_seqs=1. The network was constructed according to the known interactions of the selected reference species, and the PPIs of these DEGs were visualized in Cytoscape (Shannon et al., 2003).
3 RESULT
3.1 Key enzyme activity
As shown in Fig.1, FBP and pfkA in the glycolysis cycle, CS in the citric acid cycle, and ATPase were selected to determine enzyme activities. The results showed that the activities of FBP, pfkA, CS, and ATPase were higher in P68 than in P0 (P<0.05).
3.2 Transcriptome sequencing and assembly
The raw reads from all samples were filtered,and their corresponding clean reads, ratios, and base numbers were obtained (Table 1). The Q30 quality of the clean reads was>95% with similar GC content. The sequences were submitted to the NCBI Sequence Read Archive (Accession numbers:P0_1: SRR13735959, P0_2: SRR13749649, P0_3:SRR13749648, P68_1: SRR13749647, P68_2:SRR13749646, P68_3: SRR13749645).

Table 1 Statistics of RNA-sequencing quality of P. purpureum samples under diff erent salinities
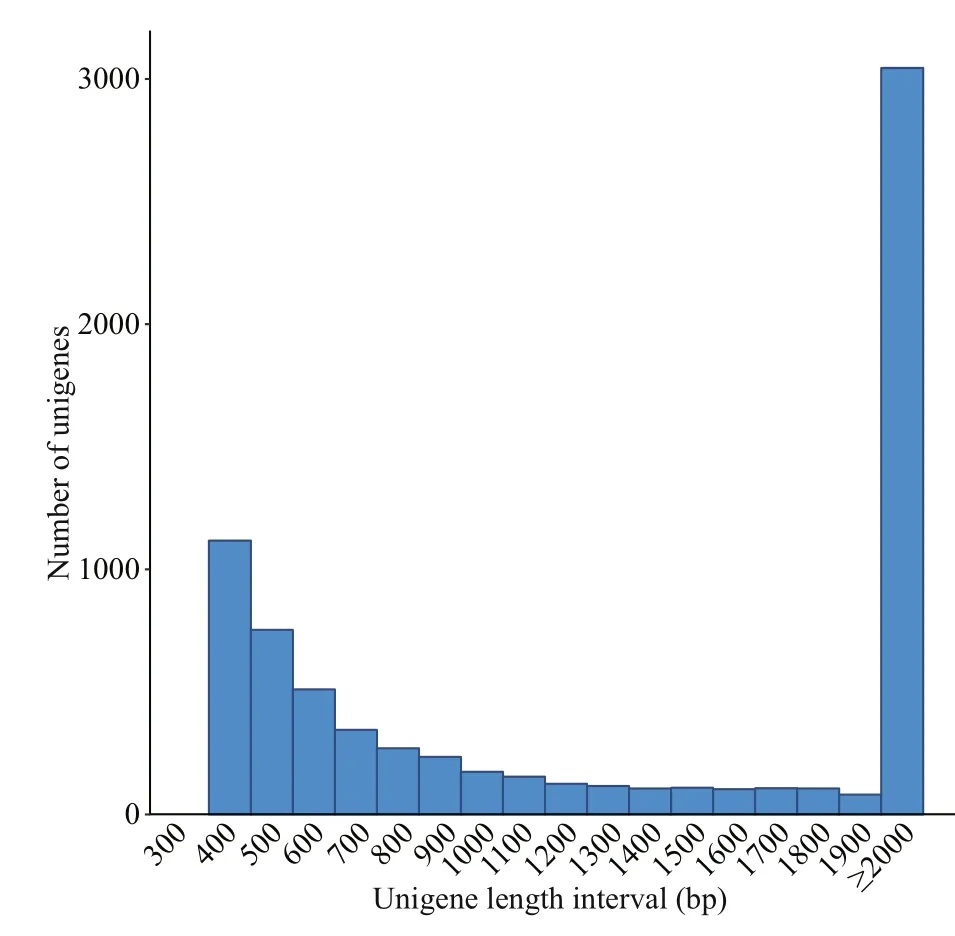
Fig.2 Length distribution of unigenes in P. purpureum
The assembled length distribution and splicing length distribution of the unigenes are shown in Fig.2 and Table 2. The mean length of a unigene was 2 455 bp (shortest: 301 bp, longest: 31 045 bp, N50:5 172 bp, and N90: 946 bp). A total of 8 019 unigenes were generated by assembling the clean reads. The unigenes with the largest length interval were>2 000 bp, while the shortest was 1 000-2 000 bp.Transcripts with lengths of 300-500 bp, 500-1 000 bp, 1 000-2 000 bp, and >2 000 bp accounted for 26.28% (2 107), 22.16% (1 777), 14.14% (1 134),and 37.42% (3 001) of the total transcripts, respectively.
3.3 Gene annotation
Annotation provides information on the expressionand function of unigenes. A total of 8 019 unigenes were annotated against seven annotation databases to obtain comprehensive gene function information(Fig.3a). The numbers of unigenes in the Nr, Nt, KO,Swiss-prot, Pfam, GO, and KOG databases were 5 329 (66.45%), 880 (10.97%), 2 690 (33.54%),5 293 (66.00%), 5 737 (71.54%), 5 737 (71.54%),and 2 888 (36.01%), respectively. Databases,including Nr, Nt, Pfam, GO, and KOG were selected to prepare the Venn diagram, and 569 common genes were commonly shared within the five annotation databases (Fig.3b). Based on the Nr annotation results(Fig.3c), the species with the most homologous genes toP.purpureumwereGracilariopsischorda(12.2%),followed byChondruscrispus(10.1%),Galdieriasulphuraria(8.2%),Porphyraumbilicalis(7.3%),andDorcocerashygrometricum(4.5%).

Table 2 Splicing length distribution of unignes in P. purpureum
GO is an international standardized gene functional classification system that comprehensively describes the properties of genes and their products in any organism. A total of 5 737P.purpureumannotated unigenes were classified into three categories according to the GO assignments and were assigned at least one GO term (Fig.4a). The three categories were biological processes (BP, gene number: 15 456),cellular components (CC, gene number: 6 717), and molecular functions (MF, gene number: 8 928),respectively. These genes were further classified into functional subcategories. Genes corresponding to the“BP” group (Level 1) were divided into 25 subcategories, among which “cellular process” (Level 2) was the largest term with 4 001 genes. Genes corresponding to the “CC” group (Level 1) were divided into 5 subcategories, among which “cellular anatomical entity” (Level 2) was the largest term with 2 958 genes. Genes corresponding to the “MF” group(Level 1) were divided into 12 subcategories, among which “binding” (Level 2) was the largest term with 3 591 genes.
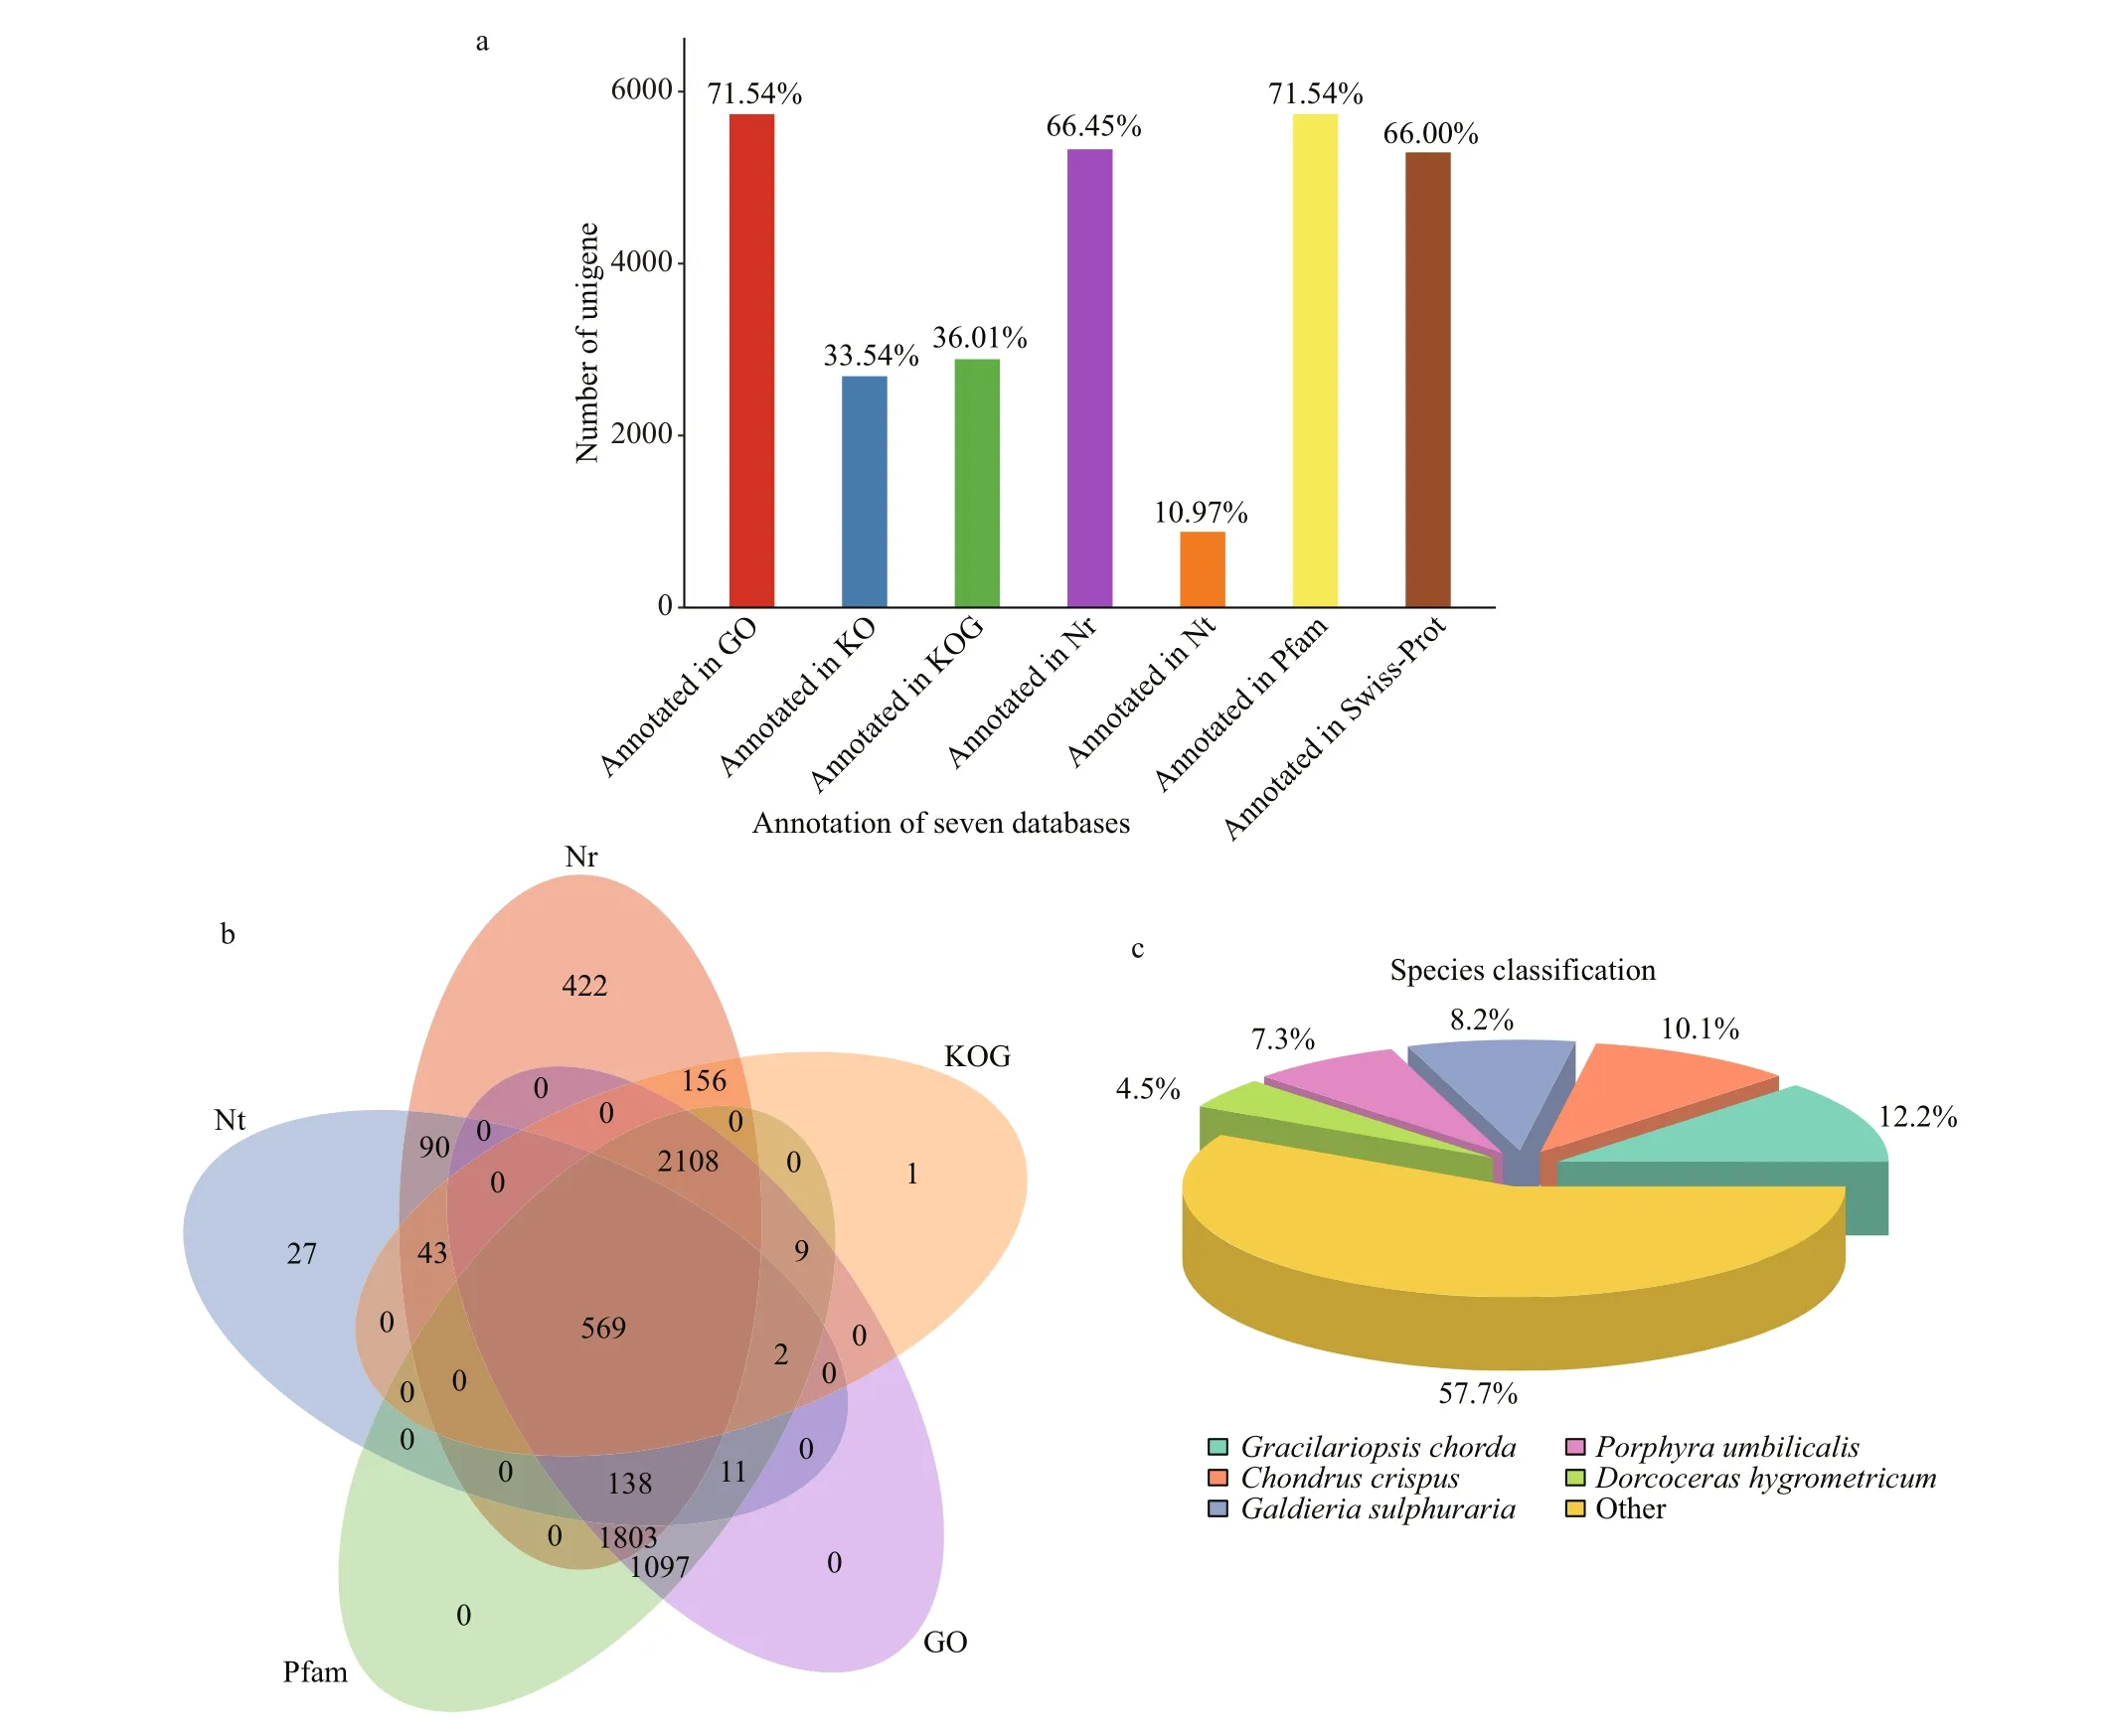
Fig.3 Function annotations of P. purpureum unignes and their distribution based on BLAST against diverse databases
The annotated unigenes were aligned to the KOG database to predict and classify possible functions and to further evaluate the completeness of our transcriptome library. A total of 2 888 unigenes were annotated based on KOG, and 3 220 genes belonging to 25 categories were obtained (Fig.4b). Among these categories, the largest group was genes for the“Translation, ribosomal structure and biogenesis (J)”cluster, which comprised 14.89% of the annotated unigenes. The second group was genes for the“Posttranslational modification, protein turnover,chaperones (O)” cluster, which comprised 13.95% of the annotated unigenes.
KEGG pathway analyses help to further understand the biological functions and molecular interactions of genes. Genes based on the KO annotation were classified according to their participating KEGG metabolic pathways. There were 2 690 unigenes mapped to 34 KEGG pathways in 5 categories(Fig.4c): cellular processes (A), environmental information processing (B), genetic information processing (C), metabolism (D), and organismal systems (E). Among them, the pathways represented by the most genes were metabolism (1 852, 68.85%of the annotated unigenes), followed by genetic information processing (710, 26.39%), organismal systems (535, 19.89%), cellular processes (304,11.30%), and environmental information processing(252, 9.37%).
But the sly old man, who was terrified for his life that the three rogues might do him some harm, was on his guard, and said to his housekeeper, Nina, take this bladder, which is filled with blood, and hide it under your cloak; then when these thieves come I ll lay all the blame on you, and will pretend to be so angry with you that I will run at you with my knife, and pierce the bladder with it; then you must fall on the ground as if you were dead, and leave the rest to me
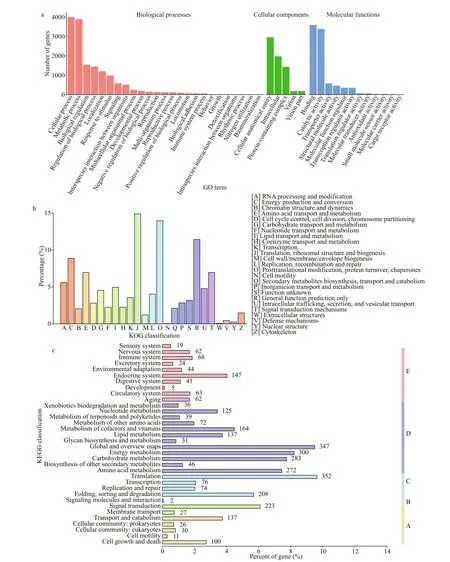
Fig.4 Gene function classification of unigenes of P. purpureum
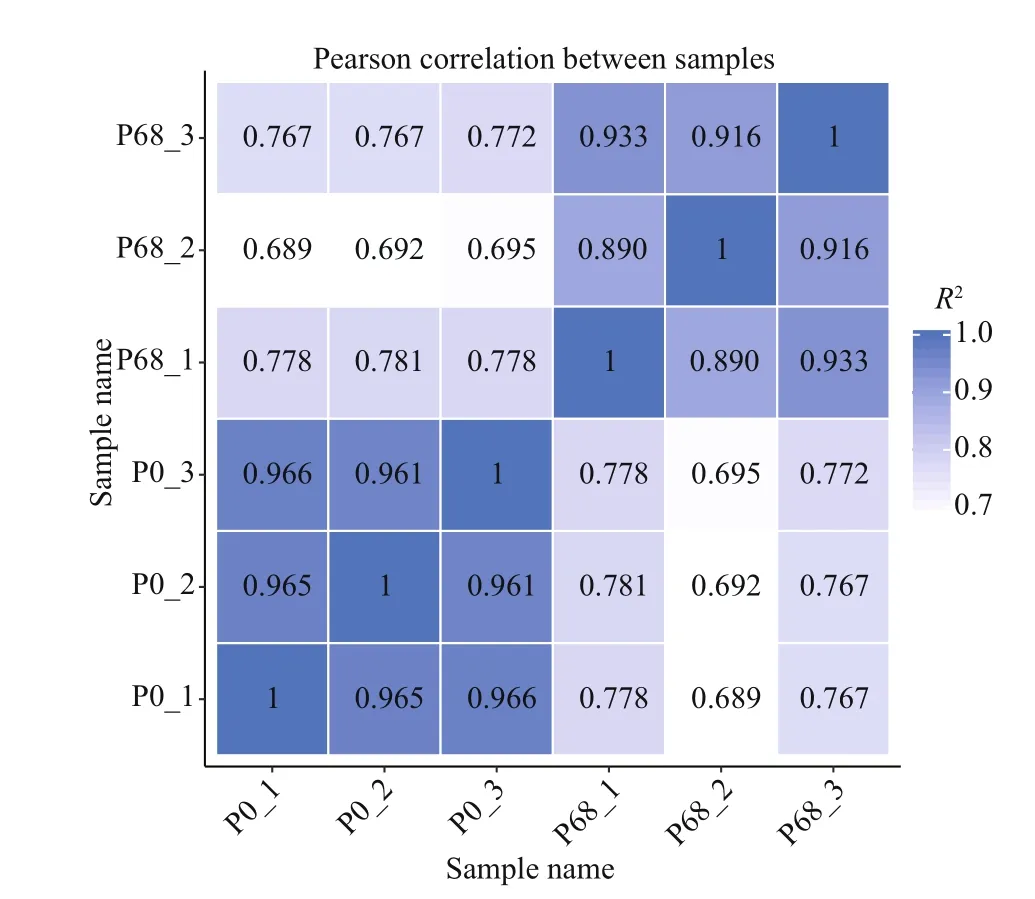
Fig.5 Correlation tests for the replicates
3.4 Diff erential gene expression analysis
The read count was obtained by comparing the clean reads with the reference sequence for each sample and then performing the FPKM conversion on the read count. The correlation coeffi cients within and between groups were calculated according to the FPKM values of all genes in the sample. The correlation coeffi cient heatmap between samples is shown in Fig.5. The correlation coeffi cients between the three repeats in P0 and P68 were 0.96 and 0.90(R2>0.8) respectively, while the correlation coeffi cients between the groups were <0.80. These data indicate the high repeatability between samples within the group and the reliability.
In addition, the gene density distributions under diff erent salinities are shown in Fig.6a. Diff erent gene expression patterns were detected in P0 and P68, and genes with the same expression levels had diff erent densities. After analyzing the expression diff erences,the overall distribution of significant DEGs in P0 and P68 was visually displayed using a volcano map of the DEGs (|log2(fold-change)|>1&padj<0.05)(Fig.6b). There were 2 177 upregulated and 729 downregulated genes in P0 and P68, respectively. The gene lists of upregulated (Supplementary Table S4)and downregulated (Supplementary Table S5) genes are presented.
The top 20 enriched KEGG pathways are illustrated in Fig.6c, and the enriched pathways were all significant withP-values<0.5 (Table 3). The DEGs were mainly enriched in important metabolic pathways, including carbohydrate metabolism (aminosugar and nucleotide sugar metabolism, galactose metabolism, glycolysis/gluconeogenesis, pyruvate metabolism, and butanoate metabolism), amino acid metabolism (cysteine and methionine metabolism,lysine biosynthesis, and tryptophan metabolism),metabolism of other amino acids (beta-alanine metabolism, taurine and hypotaurine metabolism,selenocompound metabolism, and cyanoamino acid metabolism), lipid metabolism (biosynthesis of unsaturated fatty acids, fatty acid degradation, and alpha-linolenic acid metabolism), energy metabolism(photosynthesis-antenna proteins and sulfur metabolism), metabolism of cofactors and vitamins(biotin metabolism and porphyrin and chlorophyll metabolism), and signal transduction (peroxisome).
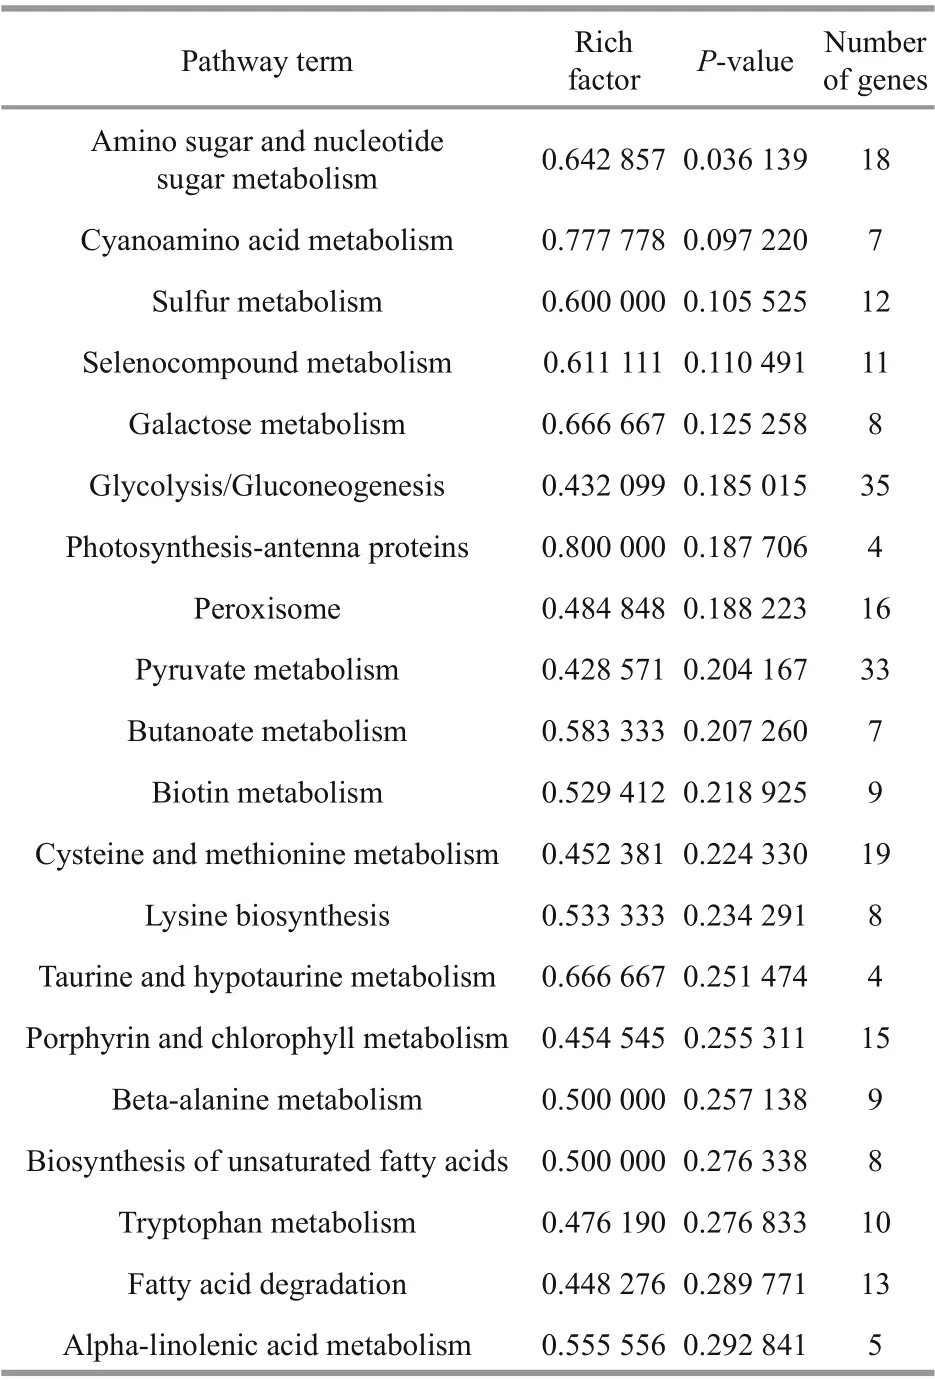
Table 3 The top 20 enriched pathways in P. purpureum sample in P0 and P68
The polysaccharide metabolic pathway inP.purpureumis shown in Fig.7 to understand the metabolic changes in theP.purpureumpolysaccharides under high-salt conditions at the molecular level. Polysaccharides form by assembly and polymerization of common monosaccharide repeating units. The pathways of glycolysis(ko00010), galactose metabolism (ko00052), aminosugar and nucleotide sugar metabolism (ko00520),and the citrate cycle (ko00020) were predicted, and the enzymes of the P0 and P68 DEGs are indicated.Extracellular D-Glucose is transferred to α-DGlucose-6P during glycolysis via the action of the sugar PTS system EIIA component (crr, EC: 2.7.1.-).Then, β-D-Fructose-6P is produced as a result of catalysis by glucose-6-phosphate isomerase (GPI,EC: 5.3.1.9). Pyruvate is finally produced via the catalysis of a series of enzymes. Pyruvate is transferred to acetyl-CoA by pyruvate dehydrogenase E1 component (aceE, EC: 1.2.4.1), pyruvate decarboxylase (PDC, EC: 4.1.1.1), and dihydrolipoamide acetyltransferase (aceF, EC:2.3.1.12). Acetyl-CoA serves as the precursor to enter the citrate cycle. In addition, α-D-glucose-6P is transferred to α-D-glucose-1P via the action of phosphoglucomutase (pgm, EC: 5.4.2.2), and Galacton is metabolized based on α-D-glucose-1P.UDP-Glucose and UDP-Galactose form via UDPsugar pyrophosphorylase (USP, EC: 2.7.7.64), UTPglucose-1-phosphate uridylyltransferase (UGP2, EC:2.7.7.9), and UDP-glucose 4-epimerase (galE, EC:5.1.3.2), which is the main branch pathway for the synthesis of polysaccharides based on UDP-Glucose and UDP-Galactose. β-D-Fructose-6P is transferred to D-Mannose-6P via the action of mannose-6-phosphate isomerase (MPI, EC: 5.3.1.8), and then
GDP-D-Mannose is generated via the action of phosphomannomutase (PMM, EC: 5.4.2.8) and mannose-1-phosphate guanylyltransferase (GMPP,EC: 2.7.7.13). Finally, UDP-glucose, UDP-galactose,and UDP-xylose are transferred and assembled via the action of glycosyltransferase to form repeating units. TheP.purpureumpolysaccharides are composed of repeating units of these monosaccharides.
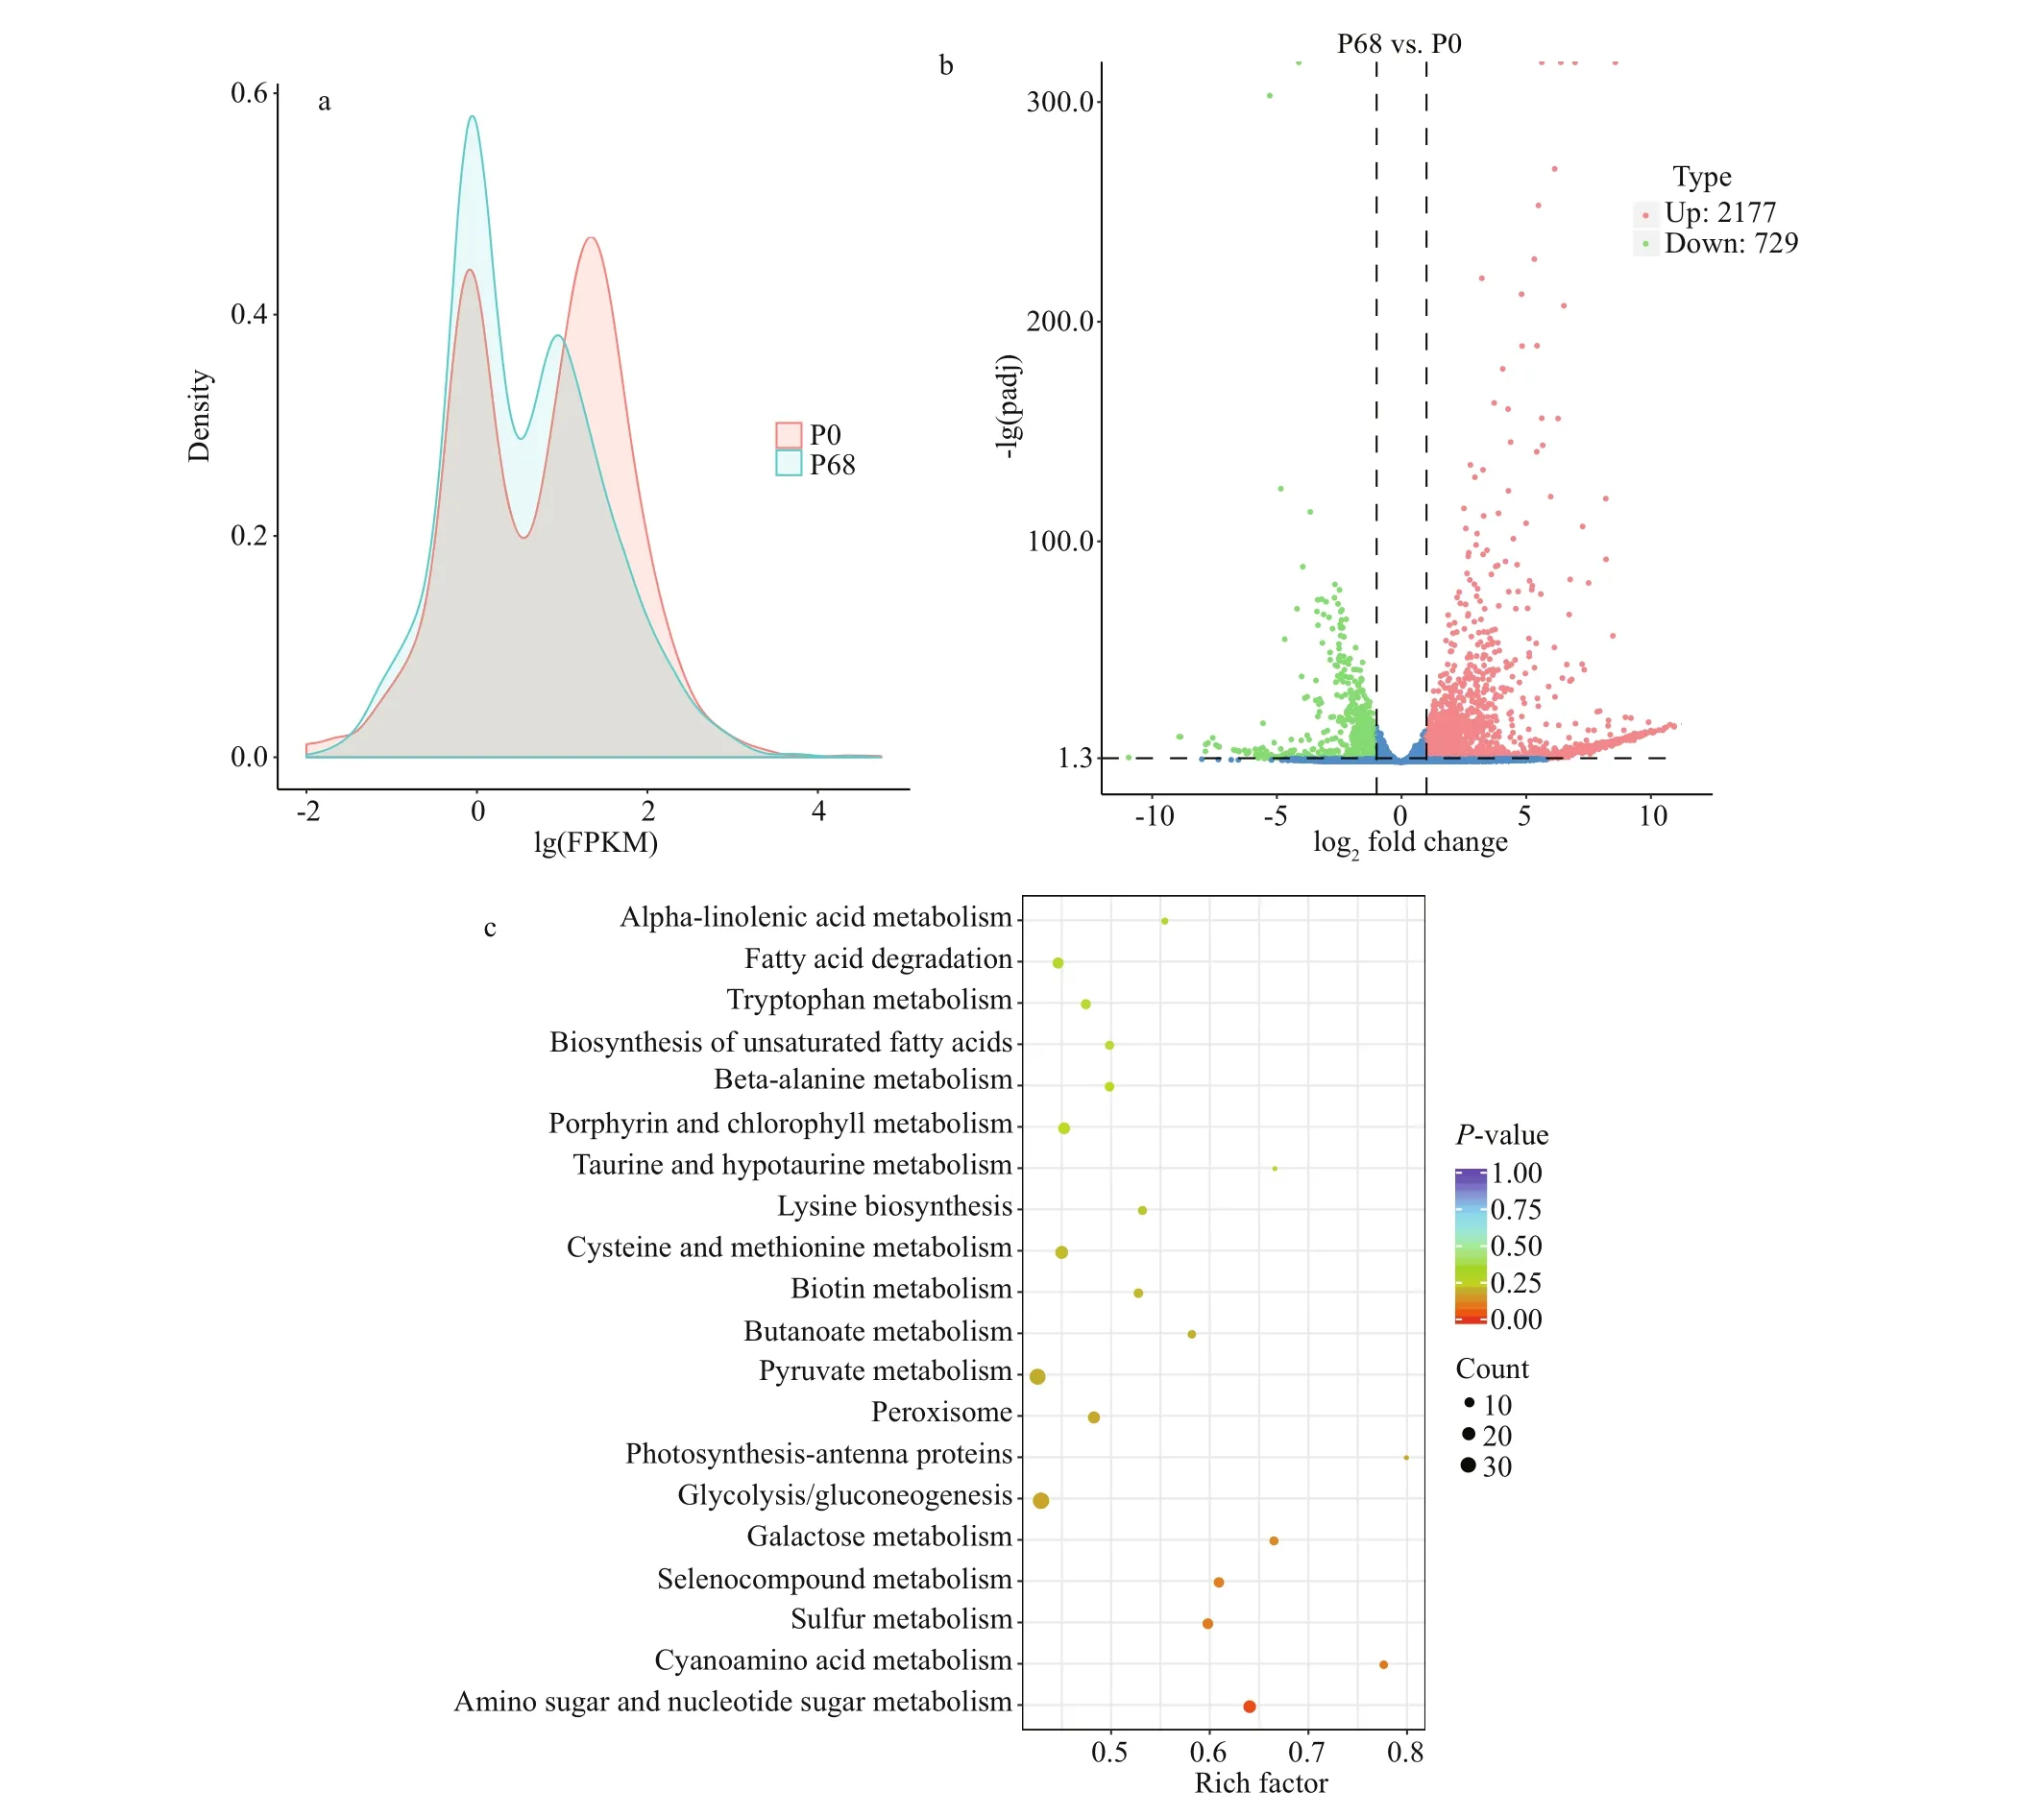
Fig.6 Diff erent gene expression patterns in P0 and P68
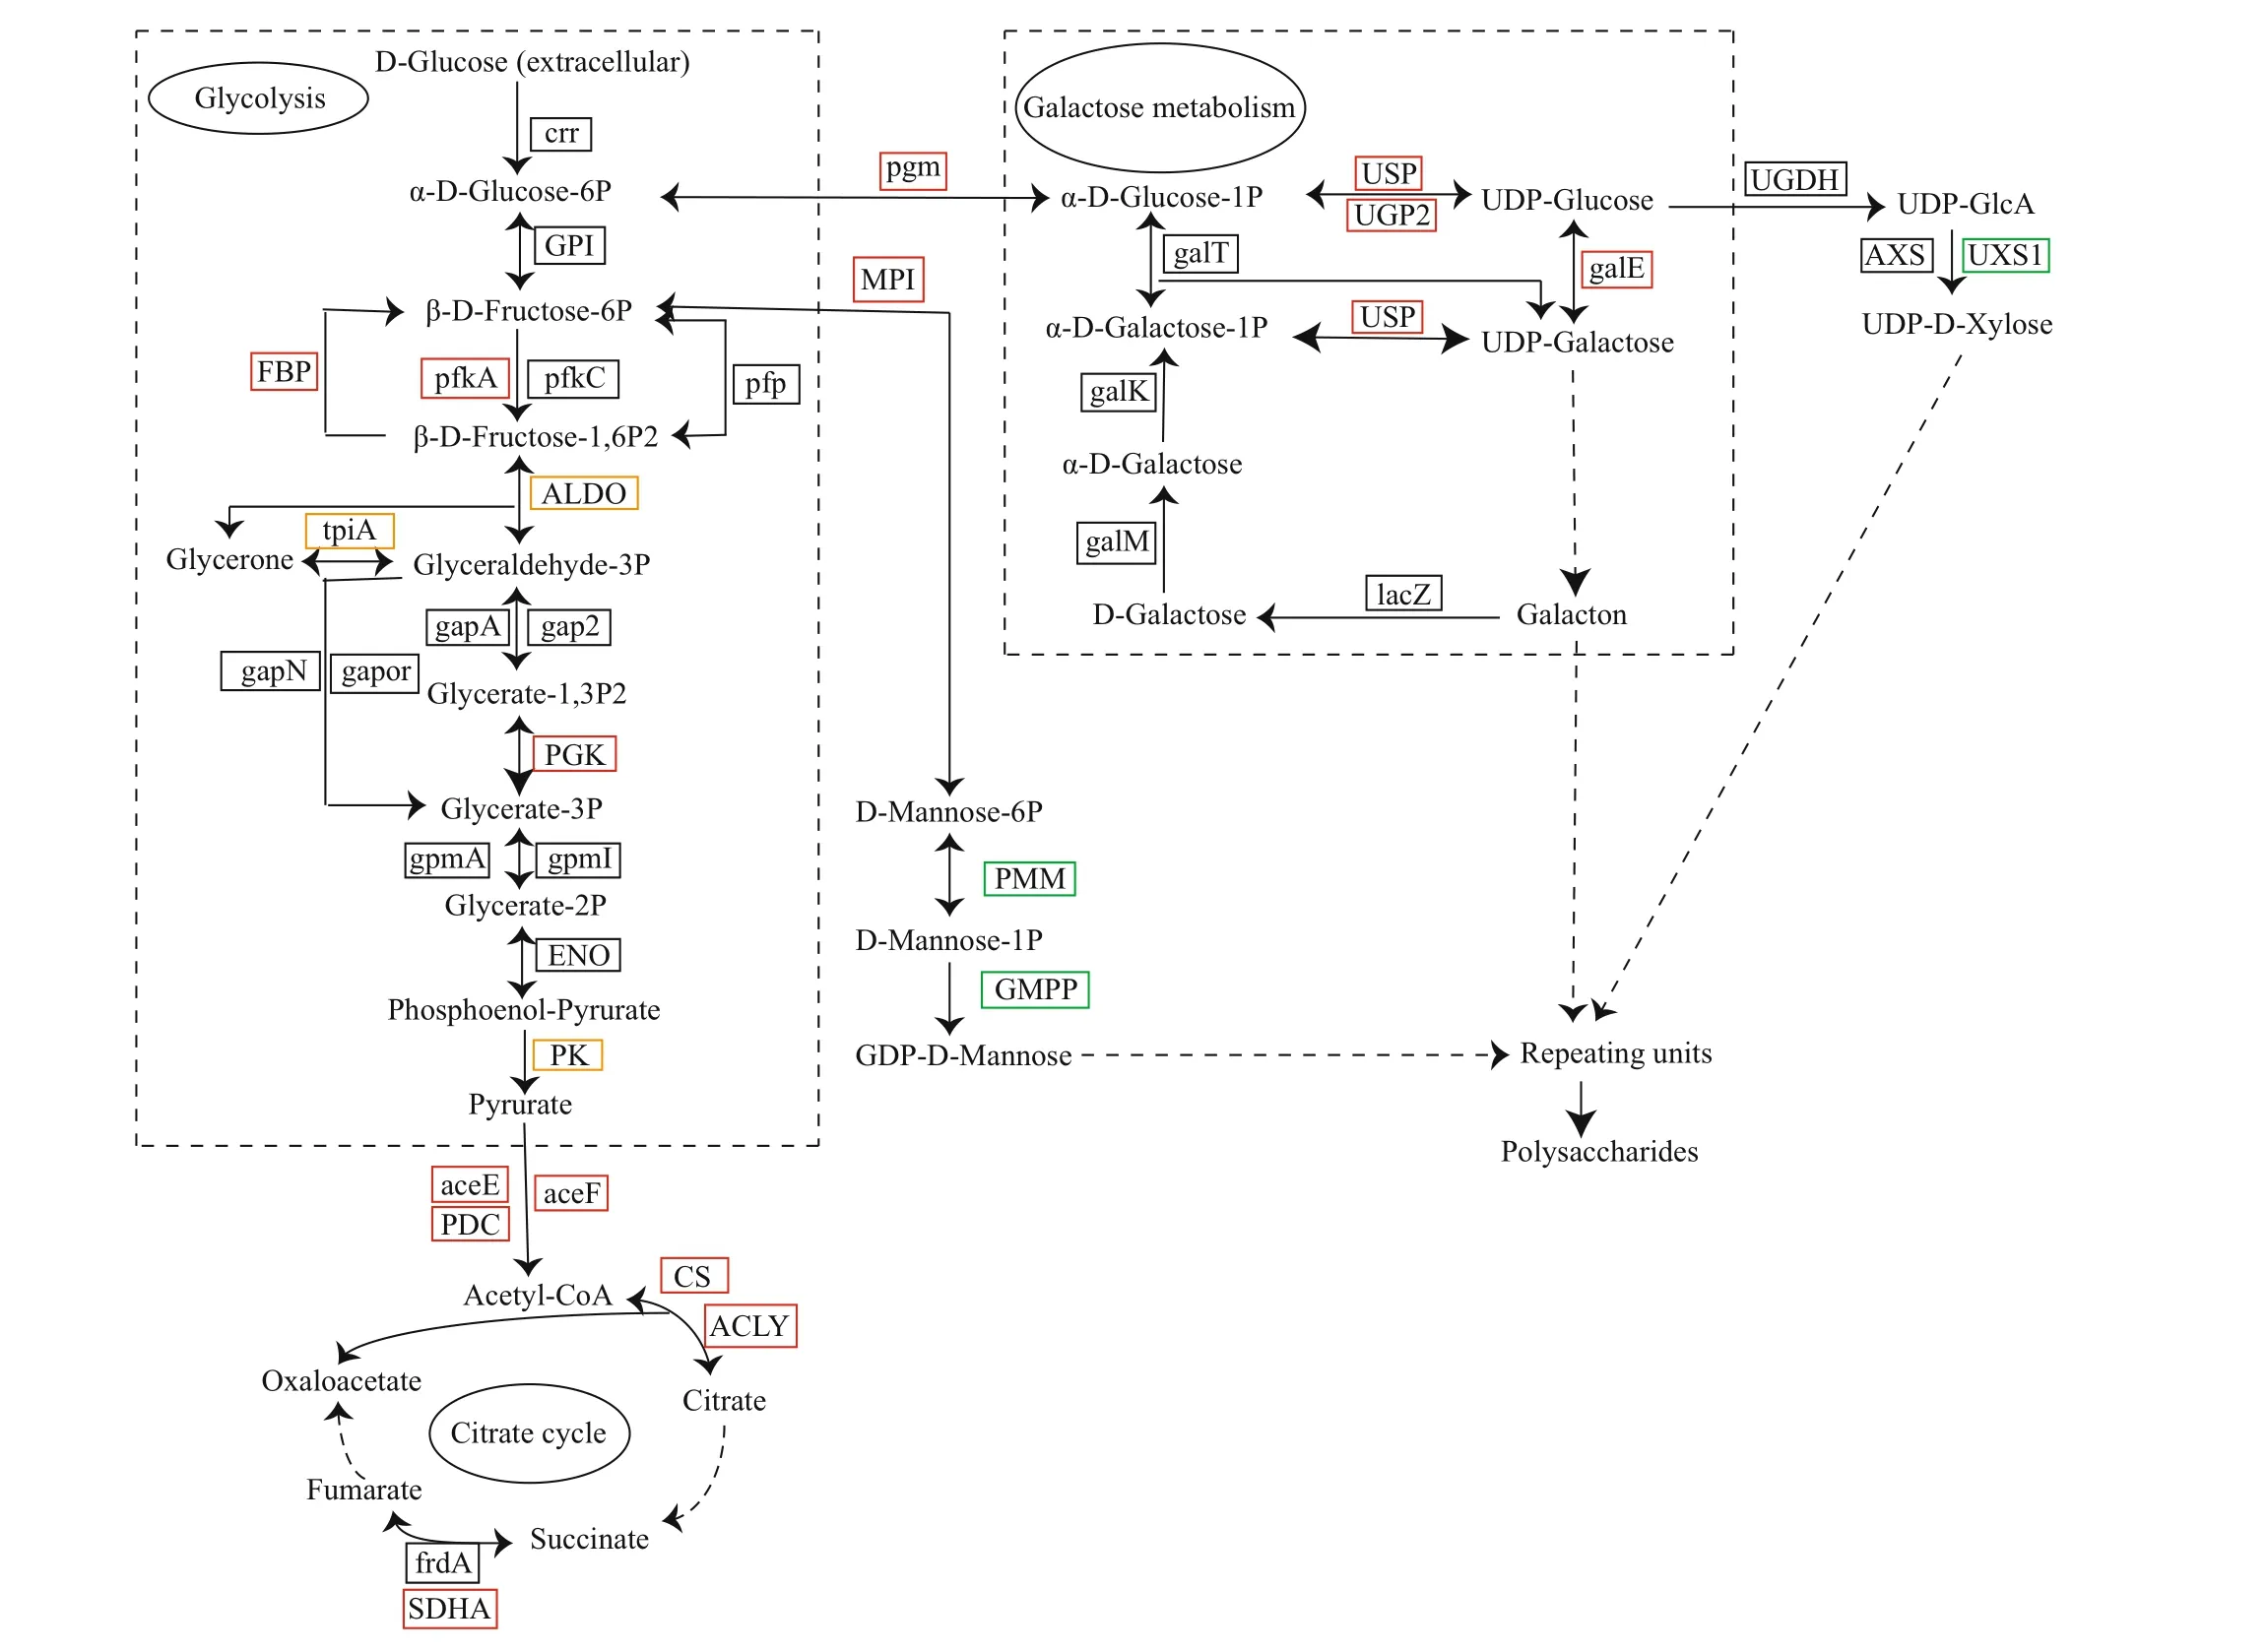
Fig.7 Putative metabolic pathway of polysaccharides synthesis in P. purpureum generated by KEGG
In the glycolytic pathway, the genes encoding FBP(EC: 3.1.3.11), pfkA (EC: 2.7.1.11), phosphoglycerate kinase (PGK, EC: 2.7.2.3), aceE, aceF, and PDC were significantly upregulated, whereas the expression of fructose-bisphosphate aldolase (ALDO, EC: 4.1.2.13),triosephosphate isomerase (tpiA, EC: 5.3.1.1), and pyruvate kinase (PK, EC: 2.7.1.40) were not significantly aff ected under 68 salinity. The expression of CS (EC: 2.3.3.1), ATP citrate (pro-S)-lyase (ACLY,EC: 2.3.3.8), and succinate dehydrogenase (SDHA,EC: 1.3.5.1) increased during the citrate cycle. The expression levels of pgm, USP, UGP2, and galE were significantly upregulated in the galactose metabolic pathway. The expression of UDP-glucuronate decarboxylase (UXS1, EC: 4.1.1.35) decreased during xylose metabolism. The gene encoding MPI was significantly upregulated in the fructose and mannose metabolic pathway, while the expression of genes related to GDP-D-mannose synthesis under 68 salinity was suppressed, particularly, the expression of PMM and GMPP decreased.
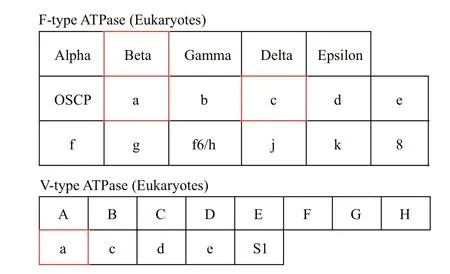
Fig.8 ATPase in energy metabolism
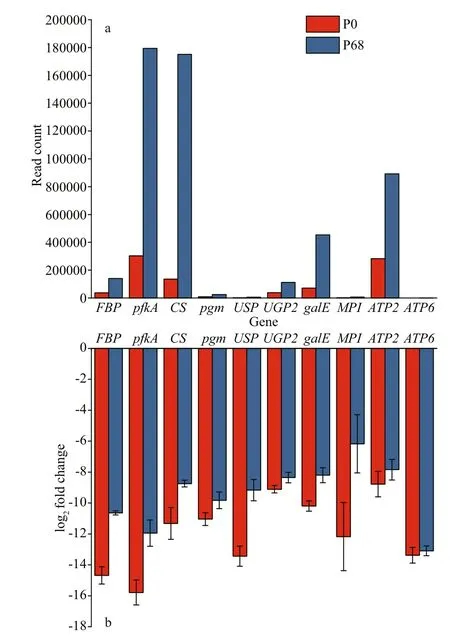
Fig.9 The qRT-PCR validation of main genes in P.purpureum collected under salinity 0 and 68
Pathways related to ion regulation were not found in any of the enriched KEGG pathways. However,energy is needed for osmotic regulation ofions under salinity stress. ATPase is a key enzyme for energy metabolism (oxidative phosphorylation,P= 0.838),and is mainly related to ion transport (Hong et al.,2018). Therefore, the expression of genes related to ATPase is helpful to understand the molecular salinity regulatory mechanism inP.purpureum. Two types of ATPases are shown (Fig.8). Among them, the genes coding F-type H+-transporting ATPase subunit beta(ATPeF1B, ATP5B, and ATP2, EC: 7.1.2.2), F-type H+-transporting ATPase subunit a (ATPeF0A,MTATP6, and ATP6), and F-type H+-transporting ATPase subunit c (ATPeF0C, ATP5G, and ATP9) in the F-type were significantly upregulated, and the gene coding V-type H+-transporting ATPase subunit a(ATPeV0A and ATP6N) in the V-type was significantly upregulated.
3.5 Real-time quantitative PCR analysis
3.6 Protein-protein interactions
The interactive network involving the upregulatedP.purpureumtranscripts under 68 salinity is shown in Fig.10. The results revealed that the transcripts in response to salinity were all cross-linked and in a closely related network. The nodes with the highest degrees were unigenes related to ribosomal proteins,followed by oxidative phosphorylation during energy metabolism, amino acid metabolism, translation factors, the citrate cycle, and ubiqitin C.
4 DISCUSSION
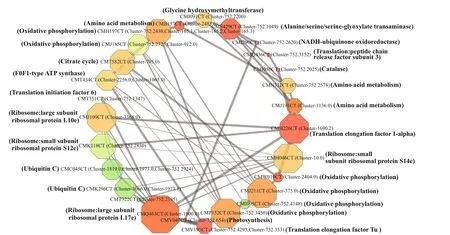
Fig.10 Protein-protein interactive network showing the relationship among up-regulated genes for P. purpureum under salinity 68
A transcriptome is a complete set of transcripts in a cell that becomes active at a specific developmental stage or under a specific physiological condition,which provides information to interpret the functional elements of the genome and reveal the molecular constituents of cells and tissues (Wei et al., 2011; Sun et al., 2015). The first transcriptome profile ofP.purpureumis presented in this study, which will enrich the repertoire of transcripts in the genusPorphyridiumand provide more molecular data for further research on rhodophytes. The mapping coverage was only 25.32% when using thePorphyridiumpurpureumCCMP1328 as reference genome. We analyze the possible reasons for this. ThePorphyridiumpurpureumFACHB-806 was collected from moist soil (Wuhan, Hubei Province, China),maybe the diff erent collection location and habitats of algal strains will impact the mapping coverage to reference genome. Additionally, quality of the transcriptome data in this study is not high enough compared to the reference genome maybe due to poor quality reads or sequencing artifacts. Therefore,transcriptome sequencing without a reference genome was performed, and the percentage of BUSCO gene set was 77.3% (BUSCO was run against the eukaryota dataset), which was eff ective and reliable. In addition,the result of contamination check shown that the transcriptome data were not contaminated with some bacterial genes or other eukaryotes, which is shown in Supplementary Fig.S1.P.purpureumis a ubiquitous species that is widely distributed in freshwater,seawater, and moist soil. Previous reports have shown that there are 161 483 assembled transcripts in the freshwater red algaSheathiaarcuata(Nan et al.,2018), 18 640 annotated transcripts in the marine red algaPyropiayezoensis(Sun et al., 2015), 24 575 unigenes in the marine red algaP.haitanensis(Xie et al., 2013), and 35 421 assembled transcripts in the marine red algaBangiafuscopurpurea(Wang et al.,2019), whereas the number of assembledP.purpureumtranscripts was distinctly smaller. The most abundant transcripts were in the length interval of 200-500 bp in bothPyropiaandS.arcuata, while >2 000 bp transcripts were detected inP.purpureum. The GC content of the unigenes obtained in this study was slightly higher than the freshwater red algaS.arcuatabut lower than the marine red algaPyropia.
Porphyridiumpurpureumhas been collected from environments ranging from freshwater to hypersaline conditions, and its tolerance to a wide range of salt concentrations has been demonstrated (Lu et al.,2020). The transcriptome sequencing analysis was performed onP.purpureumat salinities of 0 and 68 to explore the molecular response mechanism ofP.purpureumto freshwater and high-salt environments.Transcriptome sequencing is an important tool to identify expression patterns and discover genes (Wei et al., 2011). We annotated the genes, classified the functions of the unigenes, analyzed the pathways, and compared diff erences inP.purpureumunder two salinities. In this study, diff erent gene expression patterns were detected under the diff erent salinities,indicating the complicated and diverse regulatory mechanism in response to salt stress inP.purpureum.
Cells adapt to environmental stressors using diff erent mechanisms (Bohnert et al., 1995). Sorting out the mechanisms by which microalgae adapt to environmental stress requires molecular and genetic approaches. The metabolic pathways were enriched based on the KEGG database to understand the highlevel functions and utilities of the transcripts in biological systems. In this study, the top 20 enriched KEGG pathways were related to the metabolites ofP.purpureum, mainly carbohydrate metabolism,amino acid metabolism, and fatty acid metabolism.These results are consistent with a previous report(Mishra et al., 2008). Adaptation to stress is associated with metabolic adjustments leading to the accumulation of metabolites and osmolytes to protect cells from oxidative damage (Mishra et al., 2008).
The most unique biological characteristic ofP.purpureumis their special extracellular sulfated polysaccharides (Percival and Foyle, 1979). The specimens used in this study were cultured at salinities of 0 and 68, which were similar to the salinities used in a previous study ofRuppiamaritimaby Aquino et al. (2011). Aquino demonstrated that the presence of sulfated polysaccharides in plants is an adaptation to a high salt environment and that the sulfated polysaccharide concentration is positively correlated with salinity (Aquino et al., 2011). The trend in polysaccharide concentrations revealed by the physiological parameters measured in Aquino’s study was similar to the transcriptome regulation observed in our study. Furthermore, we have previously measured the polysaccharide contents ofP.purpureumcultured for 15 days under salinities of 0 and 68,respectively (Lu et al., 2020). The results show that the polysaccharide content was higher under 68 salinity, which was consistent with the molecular results. TheP.purpureumFACHB-806 strain was isolated from freshwater. However, the polysaccharide content was higher in the high-salt environment,which provides ideas for exploring the response mechanism ofP.purpureumto high-salt stress.
The transcriptome analysis ofP.purpureumgrown under diff erent salinities sheds light on the molecular mechanisms underlying the high-salt adaption of this species. The results revealed a positive correlation between gene expression and enzyme activities. The regulation of metabolic pathways by related enzymes plays a key role in polysaccharide synthesis.Phosphoglucomutase (pgm) is the key enzyme in the polysaccharide synthetic pathway that transforms glucose-6P into glucose-1P (Xu et al., 2012). In this study, the pgm transcripts were upregulated at 68 salinity, which prompted the metabolic pathway to proceed in the direction of polysaccharide synthesis.UDP-Glucose and UDP-Galactose are precursors of polysaccharides generated by galactose metabolism.In our study, upregulation of the USP, UGP2, and galE transcripts during galactose metabolism in response to high-salt stress triggered an increase in the precursors, which increased the speed of polysaccharide synthesis. However, glucose-6-phosphate isomerase (GPI) is the key enzyme in the glycolytic pathway that transforms glucose-6P into fructose-6P (Xu et al., 2012). No significant diff erence in the GPI transcripts was observed under the diff erent salinities. Overall, theP.purpureumpolysaccharide synthetic pathway was significantly upregulated under the high-salt condition, which plays a key role in maintaining cell osmotic regulation (Fu et al.,2014). In addition, the transcript levels and activities of the key glycolytic enzymes FBP and pfkA were relatively high at 68 salinity. The CS, ACLY, and SDHA transcripts in the citrate cycle were upregulated at 68 salinity, and the activity of CS was relatively high at 68 as a key enzyme in the citrate cycle,indicating that the citrate cycle of the P68 group was enhanced and more energy was provided for polysaccharide synthesis.
Salt stress is complex (Janicka-Russak and Kabała,2015). A key factor in the ability of plants to adapt to salinity is the control ofintracellular ion homeostasis(Niu et al., 1993; Munns et al., 2006). Therefore, the H+-ATPase that generates an electrochemical proton gradient on the plasma membrane is essential. The relatively low concentration of Na+in the cytoplasm is maintained through active exclusion of sodium ions to prevent excessive accumulation of sodium ions in the cytoplasm under salt stress. In this study, the upregulated activity and transcription of H+-ATPase at 68 salinity indicated the importance of H+-ATPase in maintaining ion homeostasis under salt stress.
5 CONCLUSION
The activities of FBP, pfkA, and CS were relatively high during polysaccharide and ATPase synthesis at a salinity of 68. The transcriptome analysis revealed diff erences in the gene expression patterns under salinities of 0 and 68. The related genes of the polysaccharide synthetic pathway were upregulated under the 68 saline condition, suggesting that adaptation to the high-salt environment is associated with polysaccharides. The increased expression of transcripts corresponding to the polysaccharide synthetic pathway and ATPase revealed the molecular mechanism of high-salt adaption. These results clarify that extracellular polysaccharides play a role in osmoregulation in response to high salt inP.purpureum.
6 DATA AVAILABILITY STATEMENT
The datasets generated during and analyzed during the current study are available from the corresponding author on reasonable request.
 Journal of Oceanology and Limnology2022年4期
- Journal of Oceanology and Limnology的其它文章
- Validation and error analysis of wave-modified ocean surface currents in the northwestern Pacific Ocean*
- The energy conversion rates from eddies and mean flow into internal lee waves in the global ocean*
- Observation of physical oceanography at the Y3 seamount(Yap Arc) in winter 2014*
- Decadal variation and trend of the upper layer salinity in the South China Sea from 1960 to 2010*
- Observations of turbulent mixing and vertical diff usive salt flux in the Changjiang Diluted Water*
- Experimental research on oil film thickness and its microwave scattering during emulsification*
