Observations of turbulent mixing and vertical diff usive salt flux in the Changjiang Diluted Water*
Baisu ZHU , Wei YANG , , Chengfei JIANG , Tao WANG , Hao WEI
1 School of Marine Science and Technology, Tianjin University, Tianjin 300072, China
2 Key Laboratory of Marine Environment and Ecology, Ocean University of China, Qingdao 266100, China
Abstract Based on microstructure measurements from a repeated sampling station southwest of the Jeju Island during summer, we studied the hydrography, pycnocline turbulence, and vertical salt flux in the Changjiang Diluted Water (CDW). The water column was well stratified with the CDW occupied the surface~20 m. Most of the large turbulent kinetic energy dissipation rate ( ε) were found in the bottom boundary layer. Interestingly, intermittent strong turbulence ( ε >10 -6 W/kg) occurred in the pycnocline, which may induce strong mixing events and increase the vertical diff usive salt flux at the base of CDW by one order of magnitude. The daily-mean vertical diff usive salt flux could reach 4.3 (2.1, 8.9)×10 -6 m/s. Both moored velocity measurements and associated wavelet analysis showed the presence of velocity fluctuations when there was strong pycnocline turbulence. The moderate resolution imaging spectroradiometer (MODIS)satellite images further suggest that the velocity fluctuations are induced by the prevailing internal solitary waves (ISWs) which are mainly generated at the shelf break of the East China Sea or the topographic features surrounding Jeju Island. The calculated gradient Richardson number denote the occurrence of shear instability in the pycnocline when strong turbulence presents. The presented results have strong implications for the importance of ISWs in influencing the vertical diff usion of CDW and changes in other properties.
Keyword: turbulence; vertical salt flux; internal solitary wave; Changjiang River plume
1 INTRODUCTION
The Changjiang (Yangtze) River is the third longest river in the world and discharges a large amount of fresh water and nutrients into the Yellow Sea and the East China Sea (YECS) (Kim et al., 2009; Song et al.,2013; Kwon et al., 2018). The extension of the Changjiang Diluted Water (CDW) directly alters the distribution of nutrients and primary productivity in the YECS. In addition to the eutrophication caused by the large amount of nutrients entering the sea (Zhao and Guo, 2011; Wang et al., 2019; Zhou et al., 2019),severe hypoxia occurs below the CDW during summer when there is a large freshwater discharge(Zhu et al., 2011; Wang et al., 2012; Zhang et al.,2017; Liblik et al., 2019). Therefore, it is extremely important to understand the physics controlling the spatial extension (both horizontally and vertically) of the CDW and the vertical exchange processes between the CDW and underlying water masses (Zhou et al.,2008; Jiang et al., 2014; Wang et al., 2015).
The mixing of freshwater and underlying salty water to form intermediate-salinity water is key to the dispersion process of diluted water. Previous observations and numerical simulations have investigated the role of diff erent processes, such as tides, wind forcing, and Coriolis forces, in changing the dispersal of a river plume (e.g., Hetland, 2005;Guo and Valle-Levinson, 2007; MacCready et al.,2009; Horner-Devine et al., 2015; Tarya et al., 2015;Wang et al., 2021). Tidal energy is usually several orders of magnitude higher in coastal areas than that in off shore areas, which can enhance vertical mixing and thus aff ect the plume expansion and diff usion of CDW (Zhu et al., 1999; Wu et al., 2011; Zhang et al.,2014). In the far field, wind forcing ultimately controls the mixing and extension of CDW as it is transported via the wind-induced Ekman flow (Moon et al., 2009;Lee et al., 2014). The Changjiang River discharge is known to change seasonally (Zhu et al., 2001; Gao et al., 2012). The CDW extends northeastward toward Jeju Island during summer and flows southward along the Zhejiang coast in winter (Mao et al., 1963).Numerical studies have revealed that wind forcing and tidal mixing are critical factors in driving northeastward CDW transport and the occurrence of off shore low-salinity paths (Moon et al., 2010; Xuan et al., 2012; Liu et al., 2013; Wu et al., 2014).
Direct turbulence measurements in the Changjiang River plume are very limited, and most have focused on the turbulence properties and influencing mechanisms in the bottom boundary layer (Lozovatsky et al., 2012; Yang et al., 2017; Zhang and Wu, 2018).The mixing properties and associated driving mechanisms below the CDW are poorly understood.Based on turbulence measurements from a zonal section, Matsuno et al. (2006) observed weak turbulence (ε<10-8W/kg) just beneath the CDW in the far-field plume. Recently, Wang et al. (2020) showed that the near-surfaceεgenerally decreases with distance from the estuary.
Previous studies have identified the area adjacent to the Changjiang River estuary and regions around Jeju Island and the Korean coast as two hotspots ofinternal waves (IWs) in the East China Sea (ECS)(Hsu et al., 2000; Li et al., 2008; Tsutsumi et al.,2017). Internal solitary waves (ISWs) can be induced by the interaction between strong tidal currents and topographic features adjacent to the Changjiang River estuary, as based on both in-situ observations(Lozovatsky et al., 2012) and satellite images (Li et al., 2008). In recent studies, strong IW-induced pycnocline turbulence was observed to play an important role in nutrient cycling and growth of the phytoplankton (Yang et al., 2020; Zhang et al., 2020).However, few observations of turbulence and internal waves have been conducted adjacent to the Korean coast and Jeju Island, despite the location being identified based on previous satellite images, as an important site for generation of ISWs in the YECS(Hsu et al., 2000). Although this region is relatively far from the Changjiang River estuary (~340-km away), the CDW carrying large amounts of diluted water, can still reach this region. The influence of ISWs on the pycnocline turbulence and vertical exchanges of freshwater and other materials and properties remains unknown.
This study aims to investigate the features and driving mechanisms of the pycnocline turbulence and vertical diff usive salt flux in the region with the CDW. The remainder of this paper is organized as follows. The observation strategy and data processing are described in Section 2. Section 3 presents the structure of the Changjiang River plume. The properties of hydrography, turbulent mixing, and vertical salt fluxes are presented in Section 4. Section 5 discusses the role of the ISW in changing the pycnocline turbulence and vertical salt flux below the CDW. The conclusions are presented in Section 6.
2 DATA AND METHOD
The data analyzed in this study were mainly obtained from one repeated sampling station (Stn MT1). Stn MT1 (125.50°E, 31.99°N, water depth of~65 m) is located at the southwest of Jeju Island approximately 340 km northeast of the Changjiang River mouth (Fig.1). Measurements at Stn MT1 last~24 h (July 22-23, 2013). Along with the measurements at Stn MT1, observations at a total of 44 transect stations were obtained onboard the same cruise in summer (July 14-31, 2013). Our primary instrument was the vertical microstructure profiler(VMP-200), which was equipped with two highfrequency shear probes with a sampling frequency of 512 Hz. Microscale shear data were used to calculate turbulent kinetic energy (TKE) dissipation rateε. We used the conductivity-temperature-depth profiler(CTD, RBR maestro) with an additional sensor of chlorophylla, with sampling at 6 Hz, to measure the vertical profiles of temperature, salinity, and chlorophylla. To obtain the continuous time-depth variations of microscale shear and hydrographic properties, VMP and CTD were deployed once an hour at Stn MT1. For transect stations, only hydrographic properties measured by the CTD were presented and analyzed in the present study.
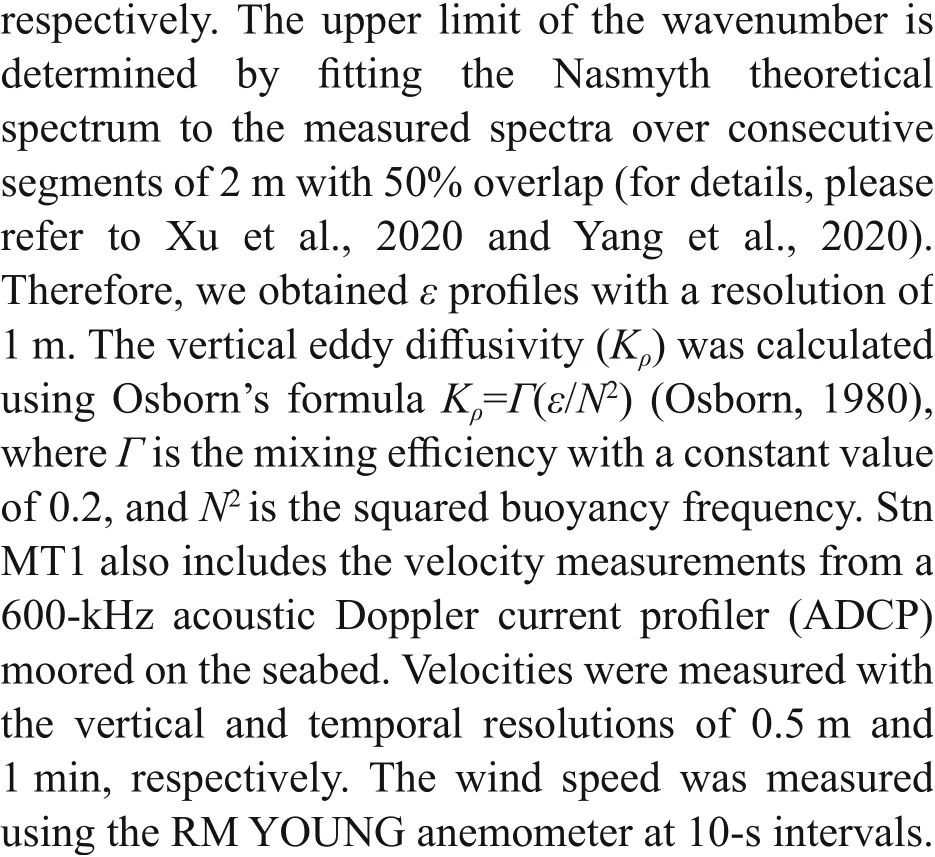
Under the assumption ofisotropic turbulence,εwas calculated as follows:
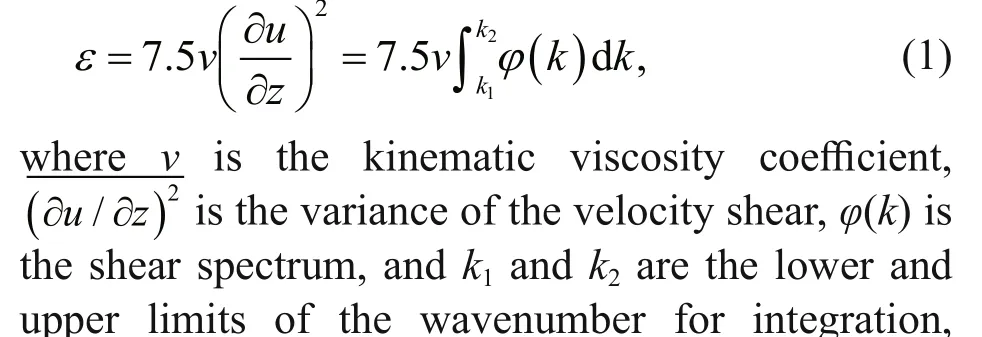
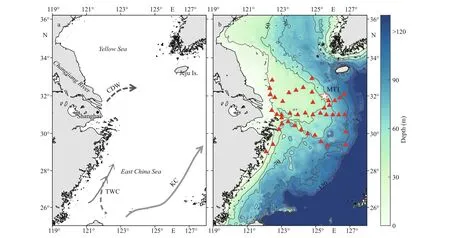
Fig.1 Schematic of the current system in the ECS (a) and bathymetry of the study area (b)
3 BACKGROUND CONDITION
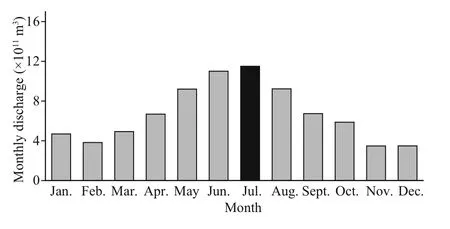
Fig.2 Monthly discharge of the Changjiang River in 2013 obtained from the ocean sediment bulletin of Datong station
The Changjiang River’s discharge varies seasonally, with the largest discharge in summer(~6×10⁴m3/s) and the smallest in winter (~1×10⁴m3/s)(Zhu et al., 2001). Figure 2 shows the monthly discharge of the Changjiang River in 2013 as downloaded from the monthly flow data from the ocean sediment bulletin of Datong station. In 2013,the river runoff peaked at ~1.15×10¹²m3in July, and the minimum was in November, which was~3.48×10¹¹m3. During our observation period, runoffwas the largest, which is typical for summer. Figure 3 shows the spatial distribution of the sea surface temperature and salinity in summer 2013. Figure 3b shows that the CDW spread northeastward from the Changjiang River estuary to Jeju Island in summer.The lowest salinity (S<29) was found at the transect from the Changjiang River estuary to Jeju Island,which may have been related to the detachment process oflow-salinity water (Moon et al., 2010;Xuan et al., 2012). Figure 3b shows the typical paths of the Changjiang River plume in summer (Mao et al.,1963). The CDW has been usually generally defined in previous studies as having a salinity ofless than 31(Chen, 2009; Quan et al., 2013; Bai et al., 2014); this definition has also been adopted within this study. The upper layers of the sampling station (Stn MT1) were covered by the CDW.
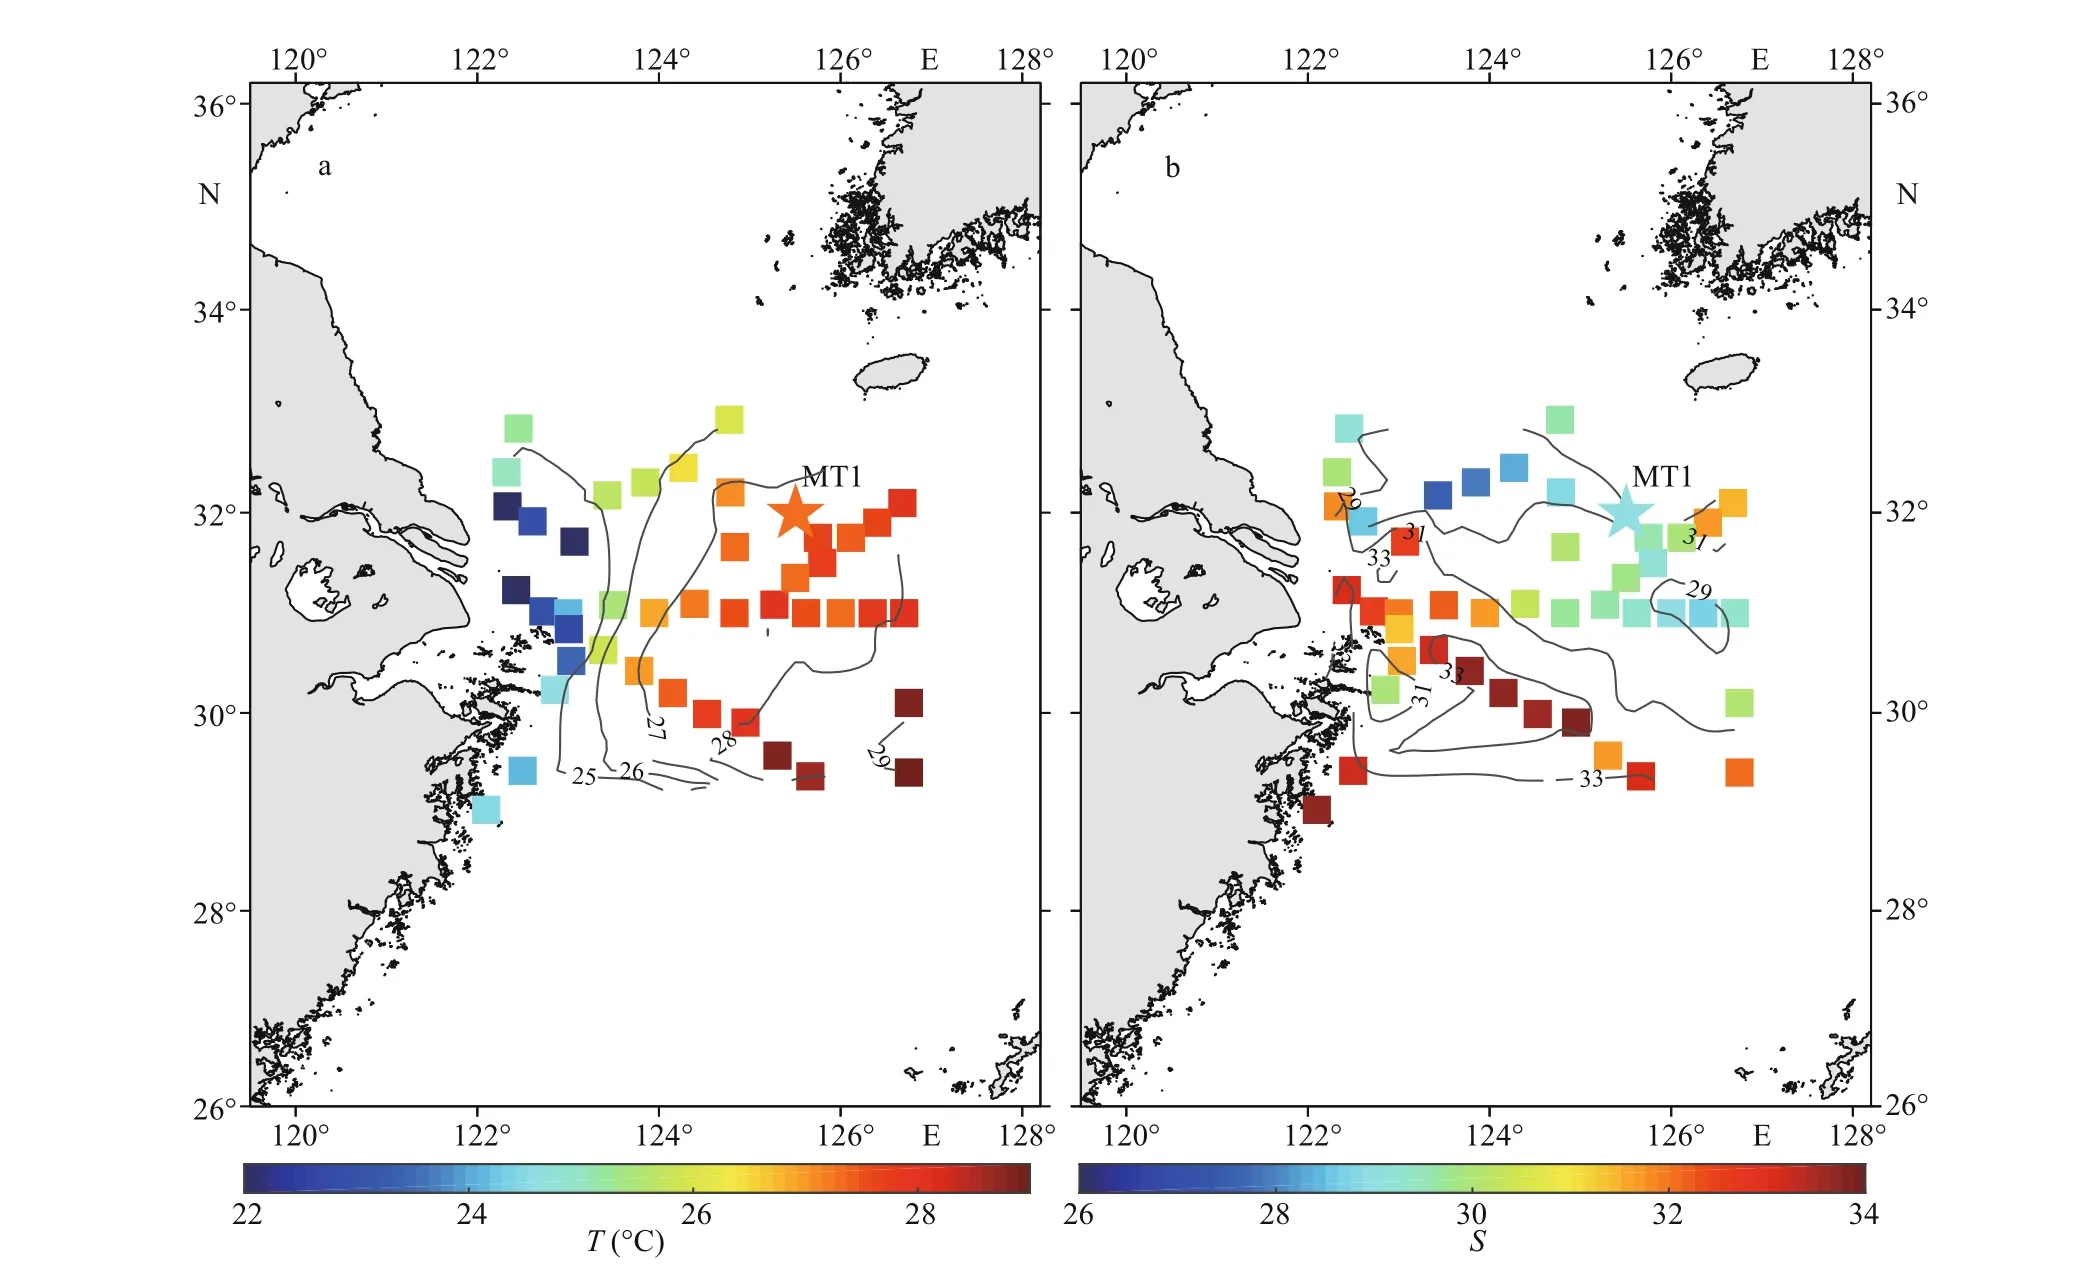
Fig.3 Spatial distribution of sea surface temperature (a) and salinity (b) in summer 2013
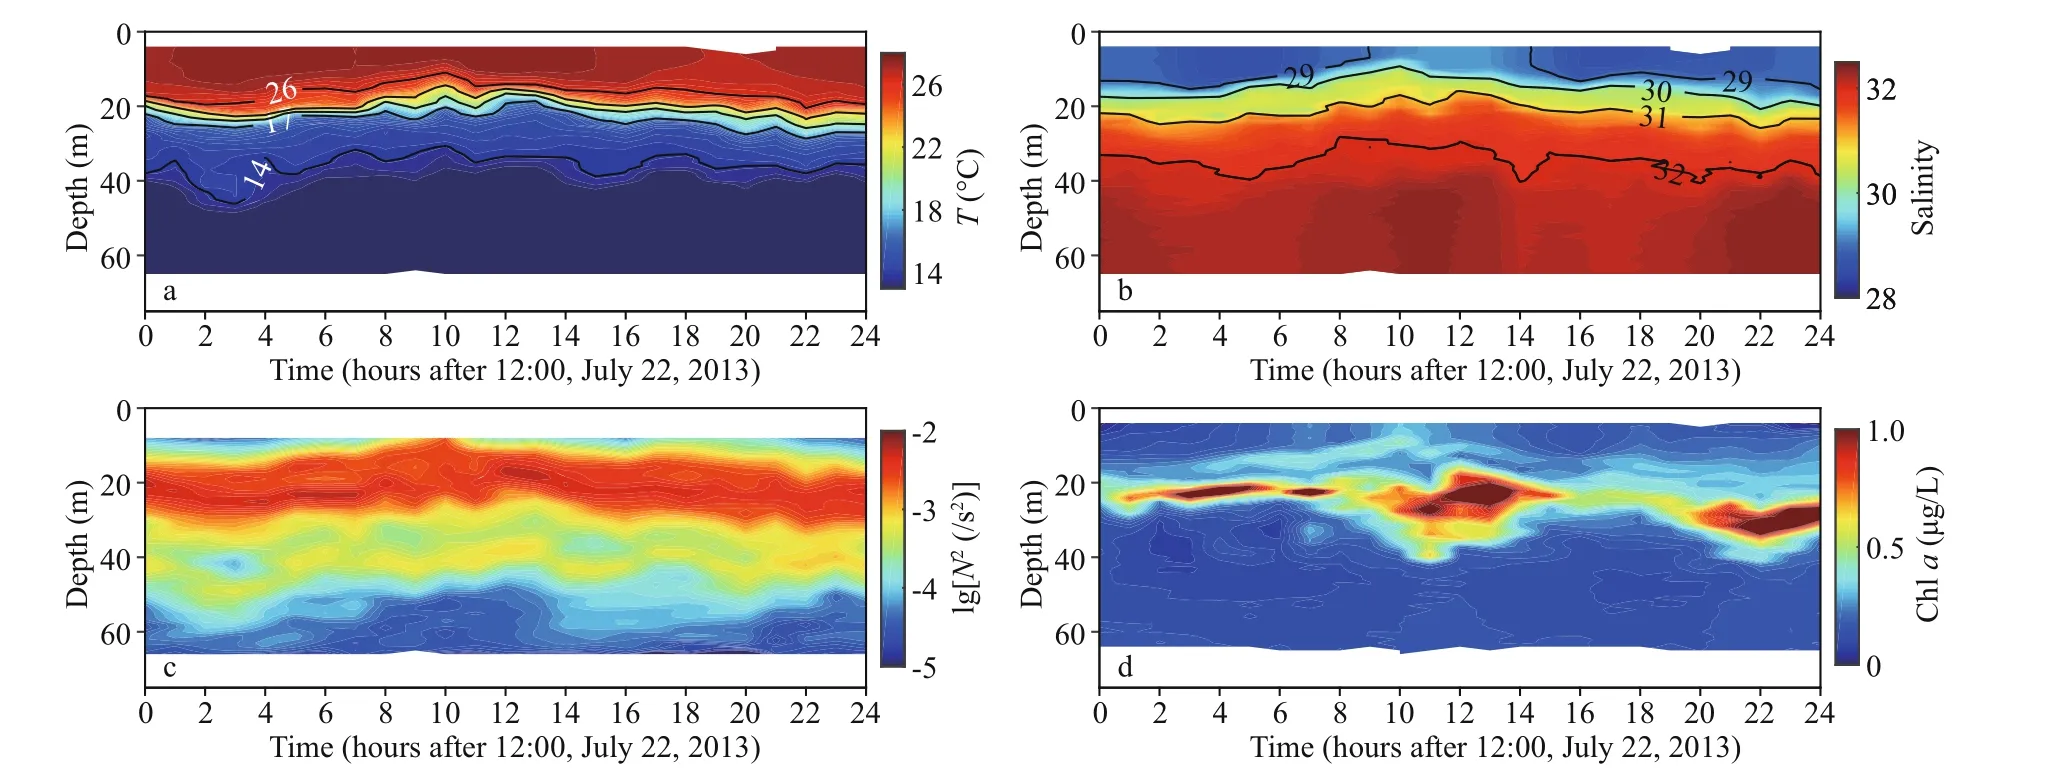
Fig.4 Time-depth variations of temperature (a) (black contours: isotherms), salinity (b) (black contours: isohalines), squared buoyancy frequency N 2 (c), and chlorophyll a (d) at Stn MT1
4 TEMPORAL VARIATION
4.1 Hydrographic property
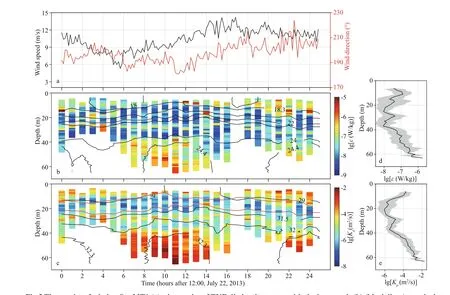
Fig.5 Time series of wind at Stn MT1 (a); time series of TKE dissipation rate ε with the isopycnals (b) (black lines); vertical eddy diff usivities K ρ with isohalines (black lines) (c); time-average profile (black line) of the ε with standard deviation shaded (d), vertical eddy diff usivities K ρ with standard deviation shaded (e)
The time-depth evolutions of temperature, salinity,N2, and chlorophyllaat Stn MT1 are shown in Fig.4.The surface water at Stn MT1 was relatively hot(T>26 °C) and fresh (S<31). On average, the CDW(S<31) at Stn MT1 covered the surface 23 m (Fig.4b).The calculatedN2show that the water column was well stratified with the strongest pycnocline located at the depth range of 10-30 m. The maximumN2could reach approximately 1.0×10⁻²/s2(Fig.4c). The position of the pycnocline corresponded well with the vertical ranges of CDW. The maximum chlorophylla(2 μg/L)was concentrated at a depth of 20-30 m within the pycnocline (Fig.4d).
4.2 Turbulent mixing and vertical salt flux properties
Largeεvalues (~10-6W/kg) were observed in the bottom layer (Fig.5b) because of the bottom friction of strong tidal currents.εgenerally had a low level(~10-9W/kg) in the pycnocline during 6-12 h because of the suppression eff ect of stratification. The weak turbulence level and strong stratification together induced the smallestKρ(~10-7m2/s) in the pycnocline(Fig.5c). One of the most noticeable features of Stn MT1 was the intermittent largeεwithin the pycnocline having a depth range from 17 to 20 m. The strongest turbulence (ε>10-6W/kg) mainly occurred during 0-5 h, 13-15 h, and 18-24 h within the strong pycnocline. The occurrence oflargeεduring 18-24 h was accompanied by strong winds (Fig.5a). However,the large dissipation was likely not induced by the wind-induced turbulence in the surface boundary layer, as theεat surface had lower values than those within the pycnocline. Strong turbulence usually lasted for several hours in the pycnocline, which further led to a largeKρ(~10-4m2/s) (Fig.5c). The driving mechanism of the observed intermittent strong turbulence in the pycnocline at Stn MT1 is examined in Section 5. We suggest the plausible influence of ISWs working at Stn MT1.
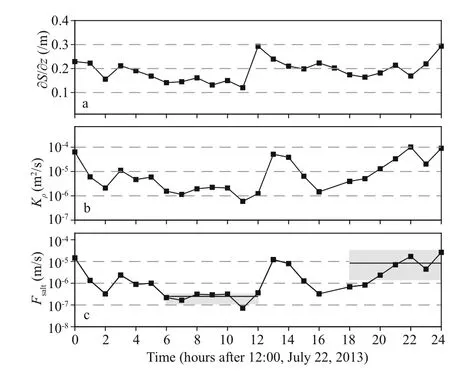
Fig.6 Time series of the vertical salt gradient (a), eddy diff usivity (b), and vertical salt flux (c) at Stn MT1
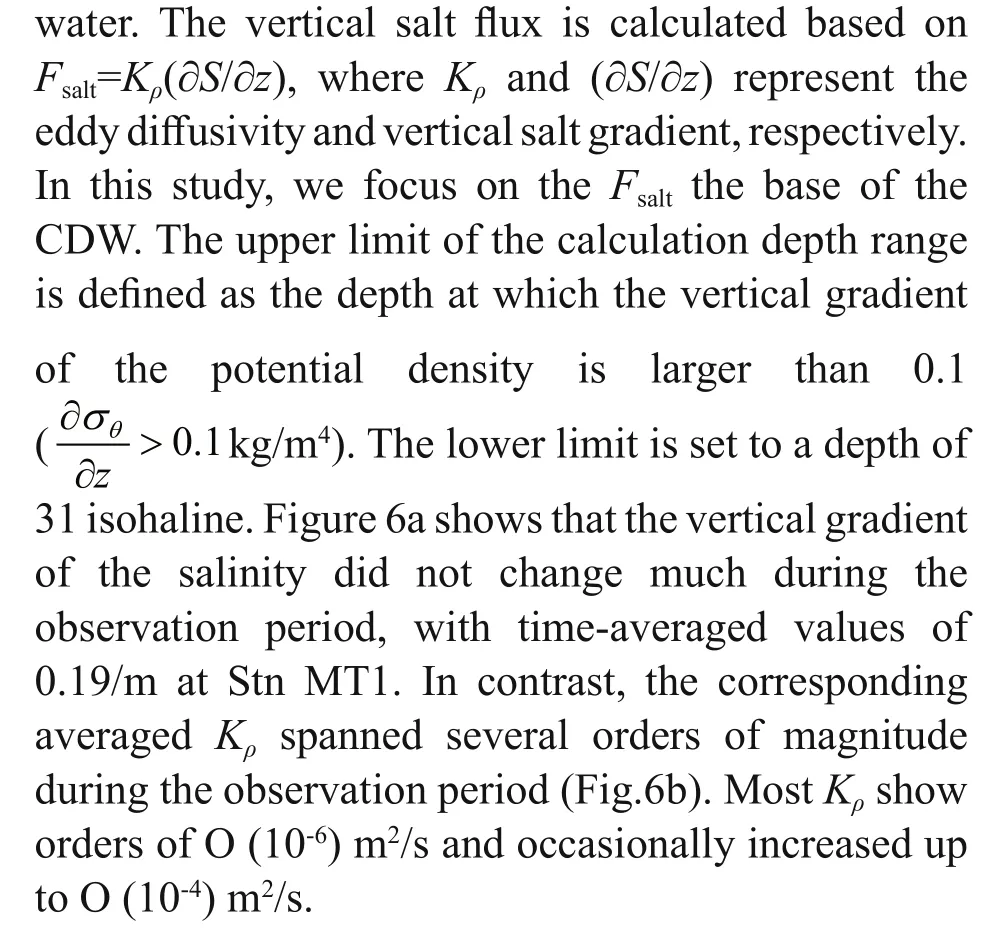
Figure 6c shows that the calculatedFsaltat Stn MT1 has a similar varying trend withKρ. The dailyaveragedFsaltat Stn MT1 was 4.3 (2.1, 8.9)×10-6m/s.Here, numbers in brackets represent the 95%bootstrapped confidence interval for the mean value.Large values ofFsaltappeared during 0-5 h, 13-15 h,and 18-24 h, which was induced by largeKρduring the period that corresponded to a strong turbulence as discussed above. As shown in Fig.6c, we selected two periods of 18-24 h and 6-12 h for comparison. The averageFsaltduring 18-24 h reached 8.4×10⁻⁶m/s,which was 34 times larger than that during 6-12 h(2.5×10⁻⁷m/s). Because the vertical salt gradient did not change much during the observation period,changes inFsaltwere largely determined by the temporal variations inKρ(Fig.6b). The enhancedFsaltduring 18-24 h clearly corresponded to the occurrence oflargeKρandεas shown in Fig.5. This highlights the importance of episodic intense mixing events in driving the exchange between the CDW and the underlying water.
5 DISCUSSION
5.1 Strong pycnocline turbulence and passage ofinternal solitary waves
One interesting phenomenon presented above is the episodic strong pycnocline turbulence, large vertical eddy diff usivity, and vertical salt flux at Stn MT1. Figure 5b & c shows that the largeKρcoincides with the occurrence of a largeε, inducing the large vertical salt flux. Figure 7a & d shows an extensive view ofεwithin the pycnocline during two representative periods of 13-16 h and 18-24 h when strong turbulence occurs. These two periods were denoted as stages 1 and 2, respectively. There was strong turbulence (ε>10-6W/kg) within the pycnocline during both periods (Fig.7a & d). Along with the occurrence of strong pycnocline turbulence, the pycnocline experienced obvious vertical displacements with an amplitude of ~5 m, especially during stage 2 (18-24 h) (Fig.7d). Moreover, the intense turbulence seemed to fluctuate in the vertical direction following the displacement of the isopycnals.
The measurements of the bottom-moored ADCP allow us to examine in detail the physical process accounting for the observed vertical displacement of the pycnocline. Along with the occurrence of pycnocline displacement during stage 2, both the velocity magnitude and vertical velocity showed signals of fluctuations. The periods of the fluctuation gradually increased from ~12 min to ~16 min, as identified from both the velocity magnitude and vertical velocity. We noted that the measured velocity had diff erent vertical depth coverage for these two stages. As shown clearly in Fig.8a, velocity measurements from 6 to 16 h had a long vertical coverage, albeit the settings of the ADCP remain unchanged. The reason is not known. We have confirmed that the available measured velocity is reliable.
The wavelet analysis of the depth-averaged vertical velocity was next performed to identify the periods of fluctuations (Fig.8). The depth-averaged verticalvelocity was calculated within a fixed depth range of 3.2-23.2 m above the seabed (Fig.8b). Figure 8b shows that there are fluctuations with a period of approximately one hour at 14 h, which is consistent with that shown in Fig.7c (stage 1). The fluctuation as shown in Fig.7 during stage 2 is also evident in the wavelet spectrum. Figure 8d shows that the averaged variance has clear peaks within periods of 5-30 min from 18-24 h passing the 95% confidence threshold of the wavelet spectra. We note that although the fluctuations in both velocity magnitude and vertical velocity is well identified, we observed a small isopycnal displacement during stage 1 (Fig.7a). The main cause for this can be that the hourly-deployed VMP likely did not capture the exact evolution of the pycnocline.
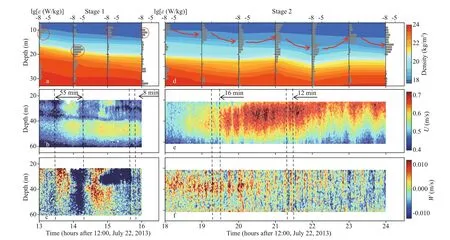
Fig.7 Time-depth variations of the density (a, d), horizontal velocity (U) (b, e), and vertical velocity magnitude (W) (c, f) at Stn MT1 during 13–16 h (left panel, stage 1) and 18–24 h (right panel, stage 2), respectively
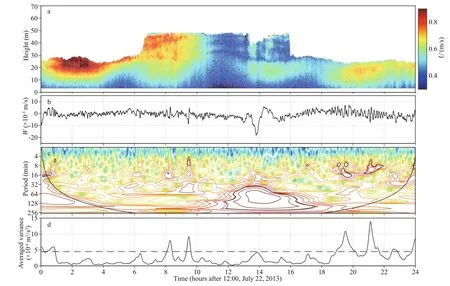
Fig.8 Time-depth variations of horizontal velocity magnitude (a); depth averaged vertical velocity within a fixed depth range of 3.2–23.2 m above the seabed (b); the wavelet spectra of vertical velocity (c); the averaged wavelet spectra variance within the period of 5–30 min (d)
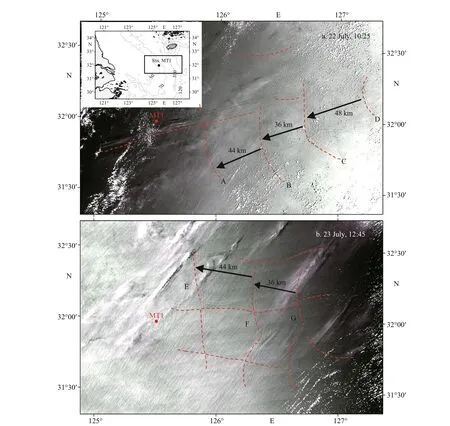
Fig.9 Subscene of a moderate resolution imaging spectroradiometer (MODIS) true-color image around Stn MT1 collected at 10:25 on July 22, 2013 (a) and 12:45 on July 23, 2013 (b)
Next, the possible processes that may lead to these fluctuations were examined. One plausible process is the presence of ISWs that pass through the mooring station. The MODIS true color images, as shown in Fig.9, were created from the calibrated, corrected,and geolocated radiance (Level-1 B), with a spatial resolution of 250 m (bands 1 and 2). Although there was no clear true-color image during our observation period at Stn MT1 (12:00, July 22-12:00, July 23,2013), we found two cloud-free images taken approximately 1.5 h before the beginning of our measurement (10:25, July 22, 2013, Fig.9a) and 0.75 h after the end of our measurement (12:45, July 23, 2013, Fig.9b). As the sampling time of these two satellite images were quite close to our measurement period, these satellite images were thought to be able to reflect the conditions at Stn MT1. Figure 9 shows clear evidence of ISWs that were generated at diff erent sites and propagated in diff erent directions. This indicated multiple generation sites of ISWs in the surrounding area. Interactions frequently occur when diff erent groups of ISWs meet each other.
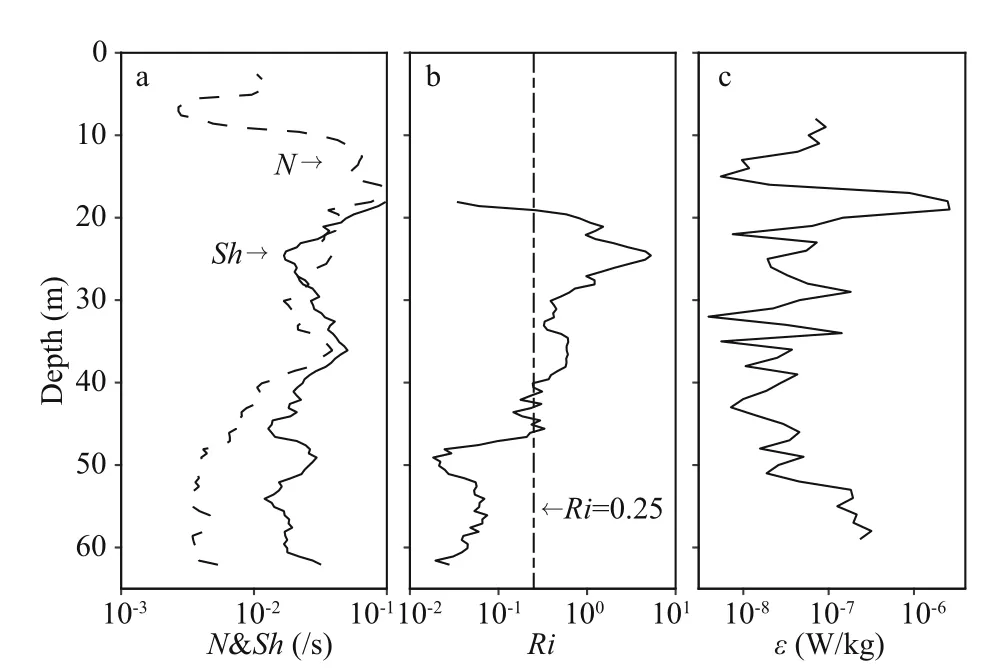
Fig.10 Vertical profiles of buoyancy frequency N (dotted line) and shear Sh (solid line) (a); gradient Richardson number Ri (b); TKE dissipation rate ε in 15 h (c) at Stn MT1
Figure 9 shows that there were two main propagation pathways of the ISW that generally propagate to the west and south. For the same westward propagating direction, the adjacent ISW groups were generally evenly separated by ~40 km.This suggests that these ISWs are periodicity generated through the interaction between tidal currents and bottom topography. Based on synthetic aperture radar images, Hsu et al. (2000) first showed the existence of ISWs propagating from Jeju Island and other small islands near the Korean coast. Based on observations from a nearby station (35 km from Stn MT1), Lee et al. (2006) observed strong ISWs propagating northwestward which mainly appeared during the same tidal phase; they suggested that the wave packets were generated near the shelf break of the ECS, and then propagated to the measurement station. However, it is diffi cult to relate directly the MODIS-observed ISWs to our mooring observation owing to the complicated distributions of the ISWs as shown in Fig.9. Mooring observations that last for extended periods may be helpful in answering the properties of ISWs in the surrounding area.Nevertheless, both the in-situ observation and satellite images suggested that the ISW was a prevailing phenomenon around Stn MT1. The concurrence of the ISW and the strong pycnocline turbulence suggest that the prevailing ISWs may play an important role in modifying the pycnocline turbulence at Stn MT1.
5.2 Shear instability
Previous studies have shown that the turbulence in the pycnocline can be effi ciently generated via shear instability (Bourgault et al., 2001; Moum et al., 2003).We took the vertical profiles of the buoyancy frequencyNand shearSh, gradient Richardson numberRi, and TKE dissipation rateεat 15 h as an example (Fig.10). These profiles were observed during stage 1 when a strong pycnocline turbulence and velocity fluctuations occur. The long vertical coverage of the ADCP measurements in this period allow us to examine the property ofRiin the pycnocline. The gradient Richardson number(Ri=N2/Sh2) can be used to quantitatively describe the relative relationship between the static and dynamic instabilities of the water body. Small-amplitude disturbances in the water are unstable ifRi<0.25(Howard, 1961). Figure 10c shows that largeε(>10-6W/kg) in the pycnocline occurred at ~19 m.This corresponds well with the layers with large velocity shear and smallRi. Figure 10b shows that we haveRi<0.25 at the corresponding depth ranges. This indicated that the velocity shear was large enough to cause shear instability and generate strong turbulence in the pycnocline. The other depth range ofRi<0.25 was found below 45 m, and the bottom friction of tidal currents induced an energetic bottom boundary layer.
Further investigations based on comprehensive field observations in this area are required.Nevertheless, given the prevalence of ISWs at Stn MT1, our results imply that ISWs may play a significant role in facilitating material exchange between the CDW and off shore water masses, thereby influencing the biogeochemical cycle in the ECS.Calculations of the vertical turbulent salt flux show that the calculated values can be increased by one order of magnitude when ISWs are present. Similarly,we can anticipate that ISW-induced pycnocline mixing may play an important role in facilitating heat,momentum, nutrients, and other property exchanges.
6 CONCLUSION
Based on observations at one repeated sampling station southwest of the Jeju Island, this study focuses on the properties of hydrography, pycnocline turbulence, and vertical salt flux in the CDW during summer. The CDW spread northeastward from the Changjiang River estuary to Jeju Island during summer, reaching Stn MT1, which is approximately 340 km from the Changjiang River mouth. Stn MT1 was covered by the CDW at the surface. On average,the CDW (bounded by a salinity of 31) occupied the upper 23 m at Stn MT1.
The TKE dissipation rate had a low value in the pycnocline (~10-9W/kg) during 6-12 h, where stratification inhibited the development of turbulence.In contrast, we observed intermittent intense pycnocline turbulence (ε>10-6W/kg) during 0-5 h,13-5 h, and 18-24 h. The strong turbulence usually lasted several hours and was unlikely to be induced by the strong wind because that theεat surface had lower values than those in the pycnocline. Further analysis showed that the occurrence of strong turbulence is usually accompanied with evident fluctuations in the velocity measurements. Wavelet analysis confirmed the prevailing vertical fluctuations have periods spanning from 10 min to 1 h. Based on satellite images analyses, we suggest that the fluctuations are likely to be related to the presence of ISWs. Satellite observations showed that there are multiple generation sites of ISWs in the surrounding area. These sites were mainly generated at islands near the Korean coast and the shelf break of the ECS and then propagated to Stn MT1. The available vertical profile ofRiconfirmed that the ISW-induced large shear overcomes the suppressing eff ect of the pycnocline, inducing strong pycnocline turbulence. The daily-averaged vertical salt flux (Fsalt) values under the CDW were 4.3 (2.1,8.9)×10-6m/s at Stn MT1. We identified that the large vertical salt flux at Stn MT1 was dominated by the episodic large vertical salt flux driven by the ISWinduced strong pycnocline mixing. During that time,theKρwas elevated by orders of magnitude and so was the vertical diff usive salt flux.
One interesting question remaining is to what extent is the vertical exchange of CDW influenced by the ISWs. This is largely determined by the probability of occurrence of the ISW in the diff erent parts of the CDW. Numerical simulations or further comprehensive observations are needed to address this question. Nevertheless, in this study, we illustrate that in addition to the recently identified area adjacent to the Changjiang River mouth (Yang et al., 2020;Zhang et al., 2020), the prevailing ISWs in regions southwest of Jeju Island also play an important role in modulating the vertical exchange between the CDW and salty off shore water. This may provide further implications for understanding the biogeochemical cycles in the Changjiang River plume.
7 DATA AVAILABILITY STATEMENT
The datasets generated during and/or analyzed during the current study are available from the corresponding author on reasonable request.
8 ACKNOWLEDGMENT
We thank Pengzhao XU of Tianjin University for his help in data processing.
 Journal of Oceanology and Limnology2022年4期
- Journal of Oceanology and Limnology的其它文章
- Validation and error analysis of wave-modified ocean surface currents in the northwestern Pacific Ocean*
- The energy conversion rates from eddies and mean flow into internal lee waves in the global ocean*
- Observation of physical oceanography at the Y3 seamount(Yap Arc) in winter 2014*
- Decadal variation and trend of the upper layer salinity in the South China Sea from 1960 to 2010*
- Experimental research on oil film thickness and its microwave scattering during emulsification*
- Oil-gas reservoir in the Mesozoic strata in the Chaoshan depression, northern South China Sea: a new insight from long off set seismic data*
