Influence of nitrate concentrations on EH40 steel corrosion aff ected by coexistence of Desulfovibrio desulfuricans and Pseudomonas aeruginosa bacteria*
Zhihua SUN , Jiajia WU , Dun ZHANG , Ce LI , Liyang ZHU , Ee LI
1 Key Laboratory of Marine Environmental Corrosion and Biofouling, Institute of Oceanology, Chinese Academy of Sciences,Qingdao 266071, China
2 Open Studio for Marine Corrosion and Protection, Pilot National Laboratory for Marine Science and Technology (Qingdao),Qingdao 266237, China
3 Center for Ocean Mega-Science, Chinese Academic of Sciences, Qingdao 266071, China
4 University of Chinese Academy of Sciences, Beijing 100049, China
5 Key Laboratory of Marine Materials and Related Technologies, Ningbo Institute of Materials Technology & Engineering,Chinese Academy of Sciences, Ningbo 315201, China
Abstract Nitrate addition is a common bio-competitive exclusion (BCE) method to mitigate corrosion in produced water reinjection systems, which can aff ect microbial community compositions, especially nitrate and sulfate reducing bacteria, but its eff ectiveness is in controversy. We investigated the influence of nitrate concentrations on EH40 steel corrosion aff ected by coexistence of Desulfovibrio vulgaris and Pseudomonas aeruginosa bacteria. Results demonstrate that only mixed bacteria or nitrate had little eff ect on EH40 steel corrosion, and nitrate could accelerate the corrosion of EH40 steel through the action of microorganisms.The corrosion promotion of nitrate was dependent on its concentrations, which increased from 0 to 5 g/L and decreased from 5 to 50 g/L. These diff erences were believed to be related to the regulation of nitrate in the growth of bacteria and biofilms. Therefore, care must be taken to BCE method with nitrate when nitrate reducing bacteria with high corrosive activity are present in the environments.
Keyword: microbiologically influenced corrosion; nitrate; Desulfovibrio vulgaris; Pseudomonas aeruginosa
1 INTRODUCTION
Microbiologically influenced corrosion (MIC) is a common phenomenon in oil field industries (Lahme et al., 2019). To save cost, seawater is usually used as make-up water in produced water reinjection (PWRI)systems for off shore oil production (Shartau et al.,2010). SO42ˉ in seawater can aggravate the activity of sulfate reducing bacteria (SRB). Notoriously, SRB induce corrosion, and about half of MIC loss is believed to be associated with them (Oguzie et al.,2013; Chen et al., 2018; Jia et al., 2018; Wang et al.,2021). Various attempts have been made to retard the destructive eff ect of corrosion caused by SRB,including chemical biocides, physical scraping, and biological competition. The overuse of biocides is generally ineffi cient and causes environmental pollution (Pillay and Lin, 2014), and the biocides themselves may cause corrosion (Zuo et al., 2004).Although physical scraping (pigging) is more eff ective than bactericide in controlling MIC in seawater pipelines, it is diffi cult to practice this technique in long and narrow pipes (Costerton, 2007). Compared with the above two methods, bio-competitive exclusion (BCE) method shows unique advantages in cost and environments (Lai et al., 2020). The addition of nitrate is a common BCE method to mitigate corrosion in PWRI systems, which can aff ect microbial community compositions, especially nitrate reducing bacteria (NRB) and SRB, but its eff ectiveness is in controversy.
Numerous works have demonstrated that corrosion was inhibited by nitrate addition in PWRI systems.Schwermer et al. (2008) discovered that uniform corrosion in PWRI systems was clearly mitigated by the addition of 1-mmol/L NO3ˉ, and corrosion inhibition was due to the change in microbial communities. Compared to the community with low biomass but rich species without treatment, nitrate introduction increased biomass, reduced diversity,and stimulated the growth of NRB. The biological inhibition played by nitrate on the SRB growth has also been reported by Lai et al. (2020) and corrosion was inhibited accordingly. Moreover, Kebbouche-Gana and Gana (2012) discovered that the total amount of sulfide decreased in static tests with the SRB consortium obtained from the In Amenas injected water, when nitrate was dosed at 120 mg/L.However, the positive role of nitrate addition was doubted by some researchers, and they claimed that it promoted corrosion instead ofinhibition. Chen et al.(2013) investigated the corrosion influence of nitrate added with diff erent concentrations in the static experiment simulating Shengli oilfield PWRI system,and found that corrosion rate increased with the addition of 80-mg/L nitrate. Nemati et al. (2001)found that the addition of nitrate to the nitratereducing, sulfide-oxidizing bacterium (NR-SOB) and SRB consortium improved the average corrosion rate from 0.2 to 2.9 g/(m2·d). Hubert et al. (2005)discovered that nitrate (17.5 mmol/L) eliminated sulfide but brought pitting corrosion, and shifted the corrosion risk from the bioreactor outlet to the inlet(i.e., from production to injection wells). This corrosion acceleration by nitrate introduction might be related to the activity of NRB, which have been reported to promote steel corrosion by extracellular electron transfer (EET) (Gu et al., 2019). The conflicts in corrosion aff ected by nitrate addition might be closely associated with diff erences in nitrate concentration, environment, and microbial community feature, and microbial communities could also be regulated by nitrate concentrations (Reinsel et al.,1996; Hubert et al., 2005; Rodríguez-Gómez et al.,2005). Consequently, the concentration of nitrate is believed to play a significant role in the conflicts.
In the present work, nitrate was added at diff erent concentrations into a microbiota consisting ofDesulfovibriovulgarisandPseudomonasaeruginosa,which were typical strains of SRB and NRB.DesulfovibrioandPseudomonasspecies are commonly found in seawater, and dominated in enriched produced water (Batmanghelicha et al.,2017). EH40 steel corrosion in the biotic systems was investigated, and the corrosion influence mechanism of nitration introduction was proposed.
2 EXPERIMENTAL
2.1 Material and specimen
EH40 steel was manufactured by Nanjing Iron &Steel Co., Ltd., and its chemical composition (wt.%)was C 0.086, Si 0.24, Mn 1.49, P 0.011, Al 0.034, Nb 0.034, Cu 0.028, Cr 0.118, Ni 0.013, Ti 0.01, Mo 0.001 and Fe balance. Coupons with dimensions of 20 mm×10 mm×5 mm, 10 mm×10 mm×5 mm, and 5 mm×5 mm×3 mm were utilized for weight loss,electrochemical tests, and X-ray photoelectron spectroscope (XPS), respectively. To avoid crevice corrosion, the flanks of electrochemical coupons were coated with polytetrafluoroethylene. After copper wires were welded, the samples were embedded with epoxy resin, leaving an exposed area of 100 mm2. All coupons were polished with a series of abrasive papers (80, 240, 400, and 800 grit), washed with pure ethyl alcohol, and dried with warm air. Before corrosion tests, they were wrapped by aluminum foil and sterilized in an autoclave (LDZM-40KCS;Shanghai Shenan Medical Instrument Co., Ltd.) at 121 ℃ for 20 min. Our previous work has shown that the high-temperature sterilization has no eff ect on epoxy resin or coupons (Gao et al., 2018).
2.2 Bacterial cultivation and experimental system organization
Pseudomonasaeruginosawas cultivated in 2216E medium containing yeast extract 1 g, tryptone 5 g,and FePO40.01 g/L of natural seawater.D.vulgariswas cultured in a modified Postgate’s medium with the composition of K2HPO40.65 g, NH4Cl 1.00 g,CaCl20.10 g, Na2SO43 g, yeast extract 1.00 g, and sodium lactate 4 mL in 1-L natural seawater. Resazurin was added as an anaerobic indicator before sterilization, and L-cysteine was adopted as an oxygen scavenger (Li et al., 2018).
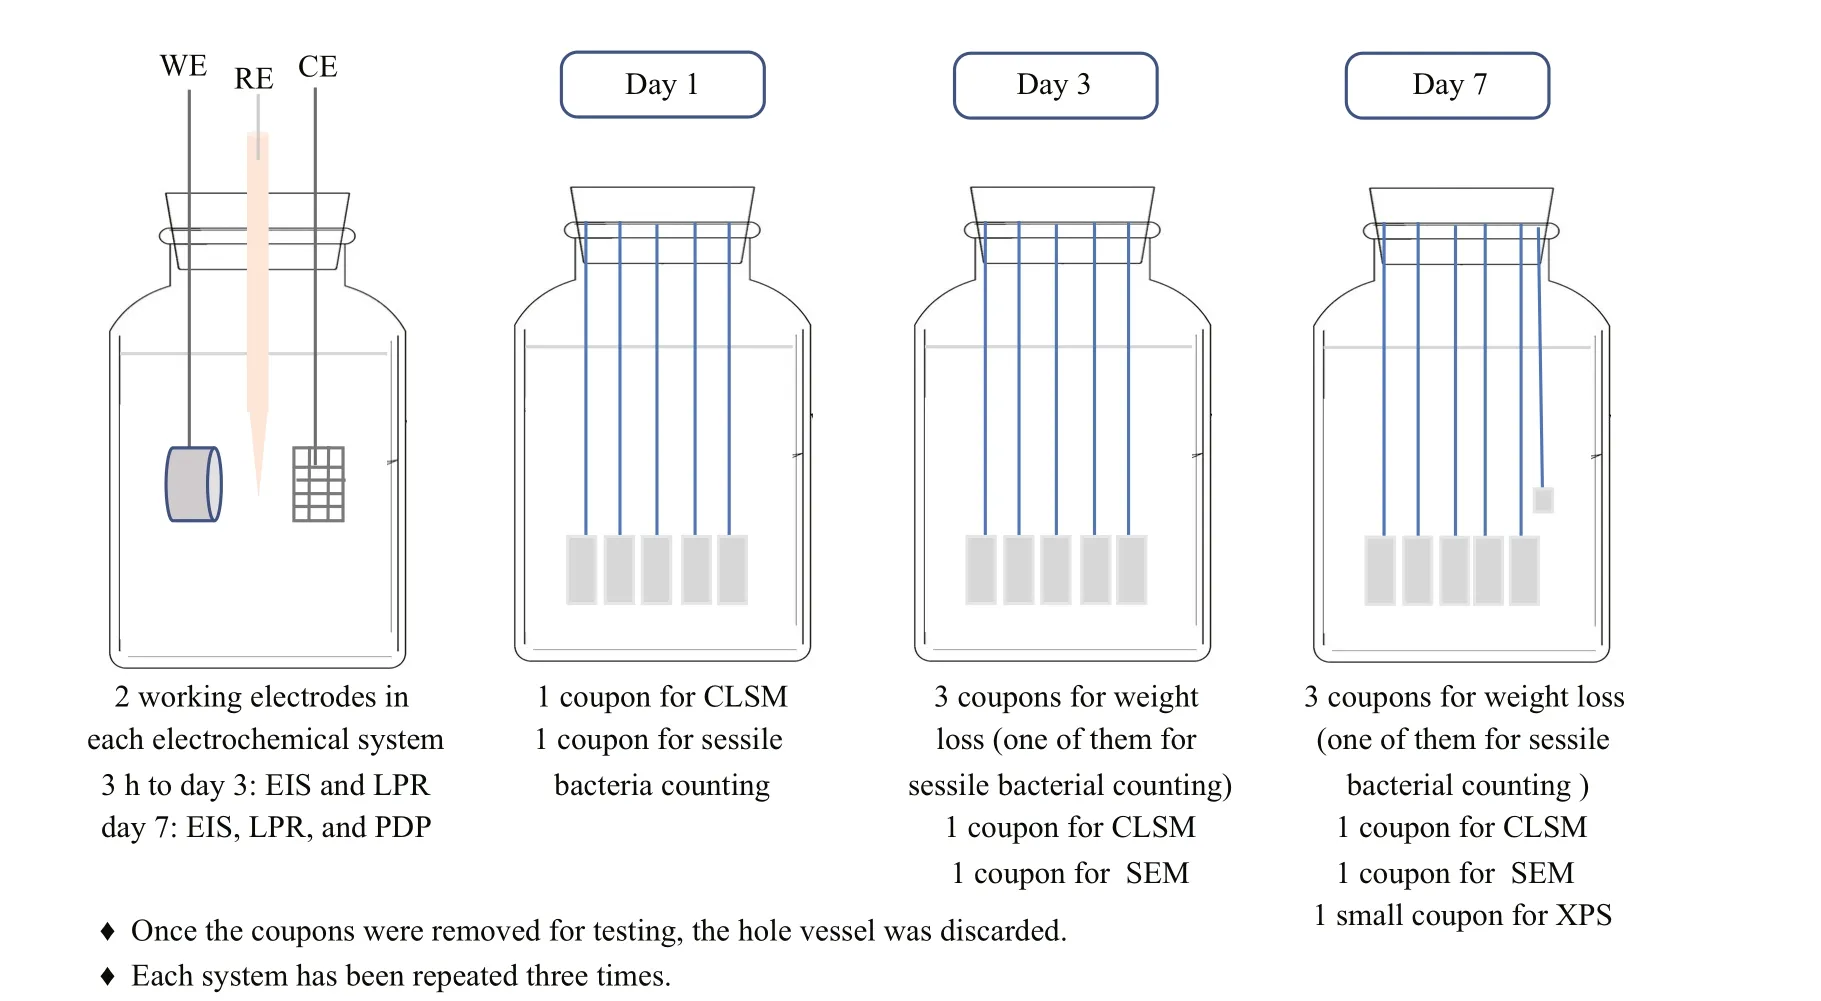
Fig.1 The experimental procedure
Diff erent amounts of NaNO3were added into the modified Postgate’s medium to give concentrations of 0, 0.5, 5, and 50 g/L.P.aeruginosaandD.vulgarisseed cultures with a volume of 4 mL in the logarithmic growth phase were inoculated after the autoclaved Postgate’s media became oxygen-free in an anaerobic box (COY-8300600, COY Laboratory Product Inc.).All systems were operated in batch mode without the addition of nutrients over a 7-d experimental period,and were kept in the anaerobic box. The experimental procedure is shown in Fig.1.
2.3 Tests of corrosion rate
2.3.1 Weight loss measurement
After immersion in diff erent systems for 3 and 7 d,the coupons were taken out. Corrosion products were removed by Clark’s solution (ASTM g1-03) in the ultrasonic cleaner for 20-40 s. Then they were washed with distilled water and absolute ethanol, dried with N2, and weighed. Corrosion rates were calculated by dividing weight loss by surface area. Three replicates were conducted for each system.
2.3.2 Electrochemical experiments
An electrochemical workstation (Gamry 3000)was used to test the electrochemical corrosion behavior of coupons. A three-electrode system was used, where the EH40 steel specimen, a platinum mesh, and Ag/AgCl (KCl-sat) were used as working,counter, and reference electrodes, respectively. After open circuit potential (OCP) stabilized, the electrochemical impedance spectroscopy (EIS) was measured in the frequency range of 100 kHz to 10 MHz, applying a sinusoidal voltage signal of 10 mV, and the data were fitted with Zsimpwin software. Linear polarization resistance (LPR)measurements were carried out within the potential range of ±10 mV vs. OCP with the scan rate of 0.167 mV/s. In the range of -600 mV to +600 mV vs.OCP, the potentiodynamic polarization (PDP) curves were recorded at a potential sweep rate of 1 mV/s.
2.4 Biofilm observation
A Live/Dead™ BacLight™ Bacterial Viability Kit(Molecular Probes, Texas, USA) was used to stain biofilms on coupons. The coupons immersed in diff erent systems for 1, 3, and 7 d were taken out,rinsed gently with phosphate buff ered saline (PBS)solution, and stained under dark conditions for 15 min. Coupons were observed under a confocal laser scanning microscope (CLSM, CZ microimaging GmbH). Biofilm thickness was measured using the 3D model.
2.5 Corrosion morphology and corrosion product characterizations
After immersed in diff erent systems for 3 and 7 d,the coupons were taken out, and fixed with 2.5%glutaraldehyde for 1 h. Subsequently, they were dehydrated through a graded series of ethanol (30%,50%, 70%, and 100%), and then dried and gold sprayed. The surface morphologies of the coupons before and after corrosion product removal were observed by scanning electron microscopy (SEM).The corrosion product compositions were measured with an XPS.
2.6 Environmental parameter measurements and cell counting
A pH meter (PHS-3C) was used to measure the pH values of diff erent solutions after 7 d. And the concentrations of HS-, SO42ˉ, NO3ˉ, and NO2ˉ ions in diff erent systems were measured by ion chromatography. The number of sessile and planktonic cells ofP.aeruginosawere determined on day 1, 3,and 7 using the plate count method with 2216E solid medium under aerobic conditions.
3 RESULT
3.1 Weight loss analysis
Figure 2 displays corrosion weight losses (Fig.2a)and rates (Fig.2b) of EH40 steel in biotic systems with diff erent concentrations of NaNO3added. In the presence of mixed bacteria, the weight loss increased with NaNO3concentrations added in the range of 0 to 5 g/L, and decreased from 5 to 50 g/L. The highest weight loss was achieved with an added NaNO3concentration of 5 g/L. Corrosion rates of EH40 steel on day 3 were much larger than those on day 7 in biotic systems with NaNO3concentrations added from 0 to 5 g/L, indicating that steel corroded faster at the early stage in these systems. In the biotic system with 50-g/L NaNO3added, the corrosion rates on day 3 and 7 were similar, and EH40 steel corroded steadily. These corrosion discrepancies in diff erent biotic systems might be relevant to the distinct growth status of bacteria, which will be evidenced below.
In abiotic systems, the weight loss of EH40 steel was around 0.3 mg/cm2no matter whether 50-g/L NaNO3was added or not (Fig.2c), and NaNO3addition has no influence on corrosion under sterile conditions. Consequently, the impact of nitrate on EH40 steel corrosion was achieved by the action of bacteria.
3.2 Electrochemical characterizations
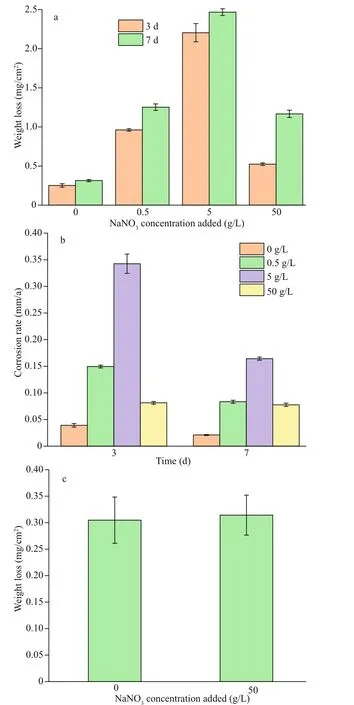
Fig.2 Corrosion weight loss (a) and rate (b) of EH40 steel after 3 and 7 d ofimmersion in biotic systems with diff erent concentrations of NaNO 3; comparison of weight loss after 7-d immersion in sterile systems with and without 50-g/L NaNO 3 added (c)
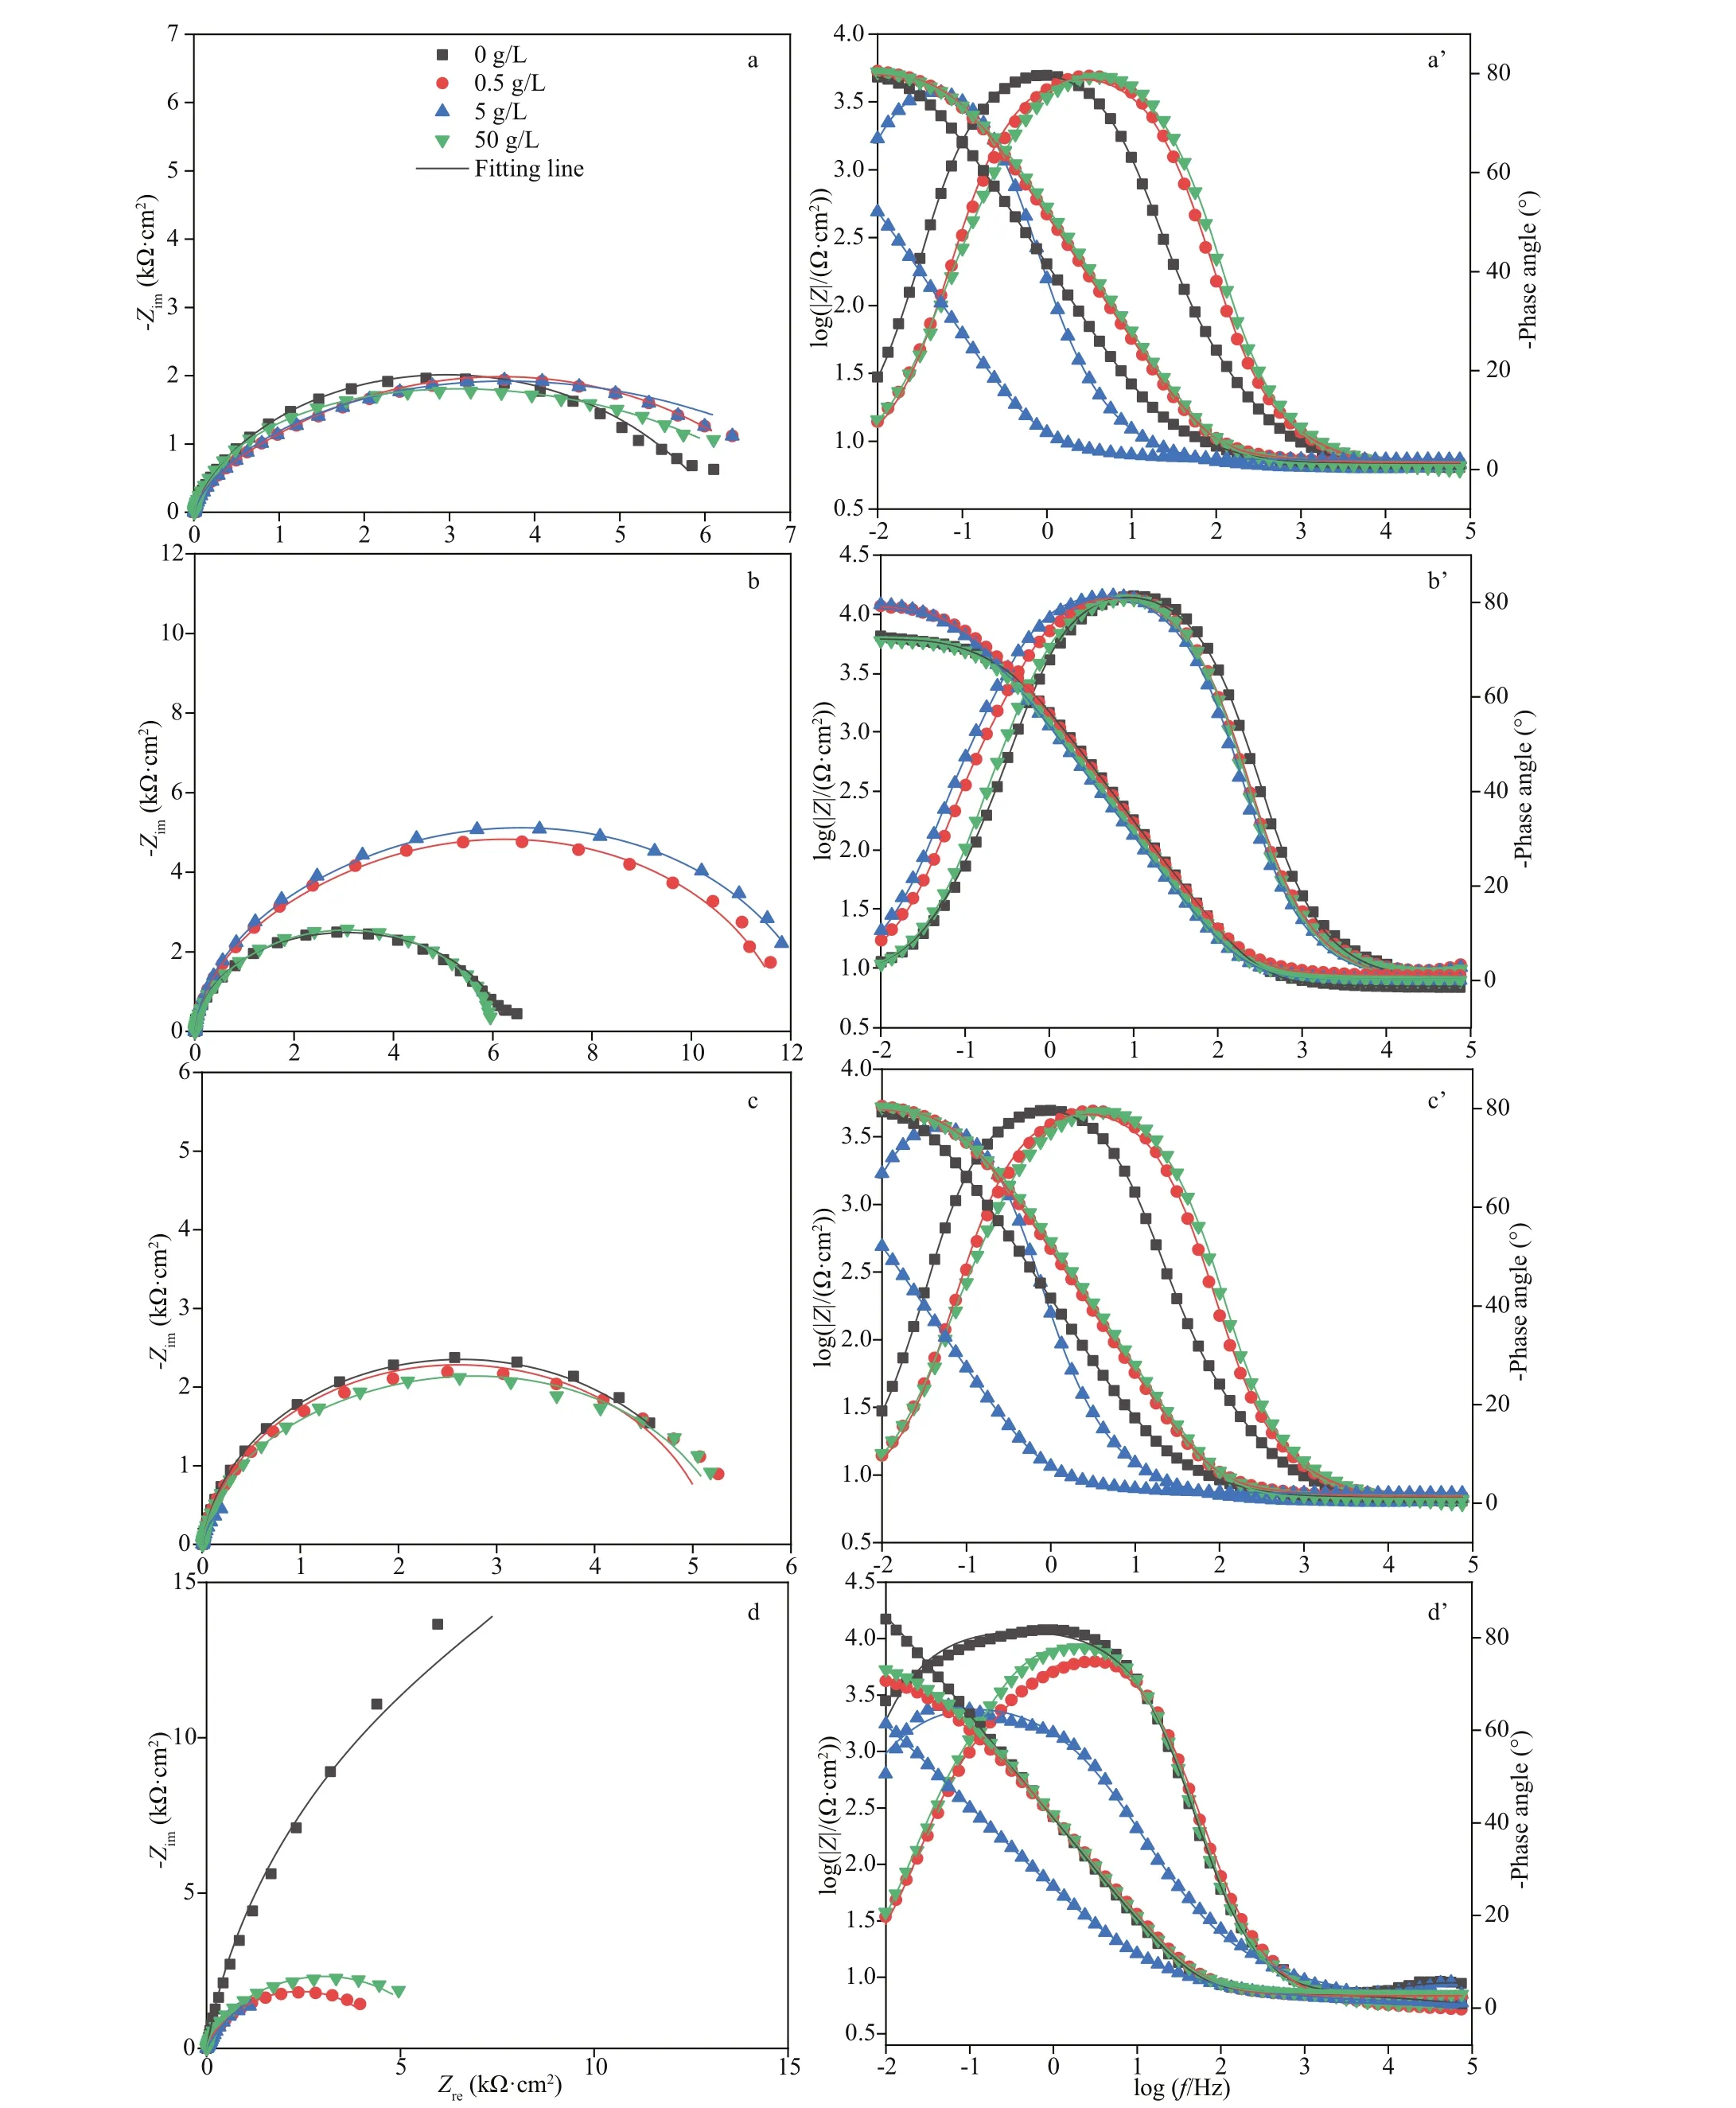
Fig.3 Nyquist (a–d) and Bode plots (a’–d’) of EH40 steel after immersed in biotic systems with diff erent concentrations of NaNO 3 added for diff erent times
Figure 3 shows the Nyquist and Bode plots of EH40 steel in diff erent biotic systems after immersion for diff erent times. After 3 h ofimmersion (Fig.3a,a’), all coupons shared similar plots, indicating that the initial surface conditions of all coupons were comparable. The diameters of capacitive loops in Nyquist plots of coupons exposed to the system without NaNO3addition were stable in the initial stage and increased sharply from day 3 to 7 because of the accumulation of corrosion products. In the systems added with 0.5- and 5-g/L NaNO3, the diameter increased on the first day, and then decreased sharply. Meanwhile, the decrease of diameters in the system added with 5-g/L NaNO3was more pronounced than that with 0.5-g/L NaNO3added. When the medium was added with 50-g/L NaNO3, the diameters changed slightly in the whole experimental period.Before day 1 impedance modulus plots were close to each other in diff erent systems, but distinct diff erences were observed on day 3. And coupons exposed to the system added with 5-g/L NaNO3possessed the smallest values, indicating its worst corrosion resistance. Similarly, phase angle plots appeared divided into 3 groups from day 3. The plots from systems with 0.5- and 5-g/L NaNO3added were similar, which were diff erent from those recorded in the other 2 systems. The phase angle plots exhibited 2 peaks in the system added with 5-g/L NaNO3on day 7, and the others gave one broad peak. Consequently,equivalent electrical circuit with 2 time constants shown in Fig.4 was utilized to fit EIS data.

Fig.4 The equivalent electrical circuit used for fitting EIS spectra
Rs,Rf, andRctin the equivalent electrical circuit stood for the solution resistance, the resistance of the films, and the charge transfer resistance of the doublecharge layers, respectively. The films were composed of corrosion products and biofilms. And capacitances of the surface films and electric double layers were denoted asQfandQdl, respectively. Variations ofRctandRfwith time are shown in Fig.5. In all systems,the values ofRfwere always smaller than those ofRct,demonstrating that corrosion was mainly controlled by charge transfer. Therefore, the corrosion rate was inversely proportional toRct. When NaNO3was not added,Rffluctuated slightly before day 3, and then increased sharply, which might be due to the accumulation of corrosion products and biofilms shown below. There was an obvious increase inRfon day 1 in systems added with 0.5- and 5-g/L NaNO3,and then it decreased. This could be associated with fast biofilm formation on day 1 and its later decay shown below. If 50-g/L NaNO3was added,Rfincreased slightly with time due to slow accumulation of corrosion products and biofilms. The time dependence ofRctwas similar to that ofRfin all systems except the one added with 50-g/L NaNO3.Rctin systems added with diff erent concentrations of NaNO3increase in the order of 5 < 0.5 < 50 < 0 g/L on day 7, which was in agreement with weight loss results. Corrosion promotion by NaNO3addition in the presence ofD.vulgarisandP.aeruginosamixed bacteria was clarified again, and the largest corrosion acceleration was achieved by NaNO3addition with 5 g/L. Figure 6 displays time dependence ofRpin diff erent systems.Rpvariations were similar to those ofRct, and the smallest corrosion rate was recorded in the system without nitration addition.
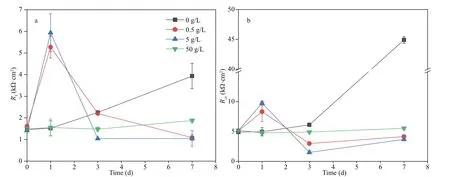
Fig.5 Time dependence of R f (a) and R ct (b) in biotic systems with diff erent concentrations of NaNO 3 added
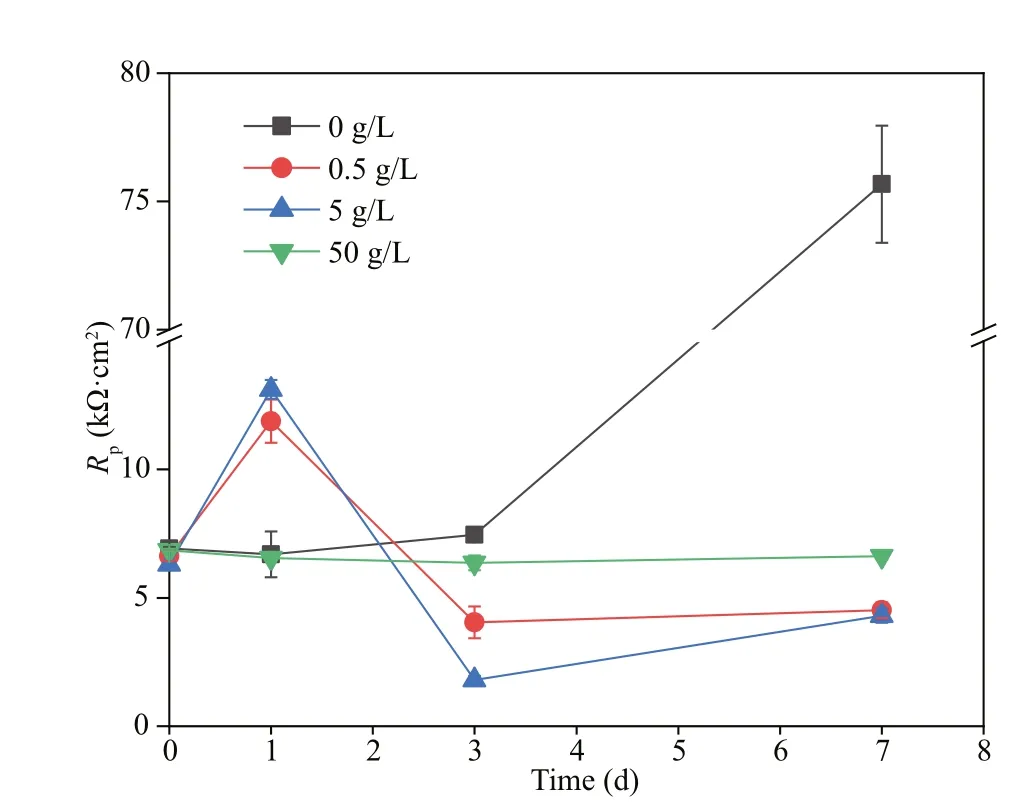
Fig.6 Time dependence of R p in biotic systems with diff erent concentrations of NaNO 3 added
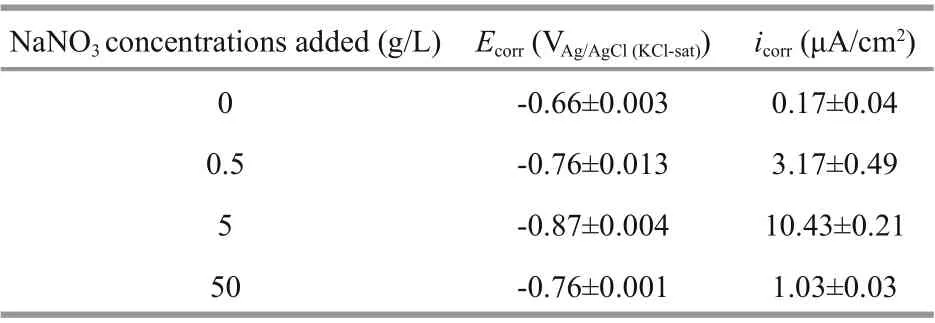
Table 1 Electrochemical parameters derived from PDP curves
Figure 7 illustrates PDP curves of the coupons at the end of 7 d ofimmersion. It was obvious thatEcorrshifted negatively with the addition of NaNO3(Fig.7; Table 1), and the value in the system added with 5-g/L NaNO3was the most negative. Both the acceleration in anodic reactions and inhibition in cathodic ones could result in negative shift ofEcorr,and depolarization of anodic reactions were observed and responsible for theEcorrshift. A high corrosion current density (icorr) indicates a larger corrosion rate, and it could be concluded that coupons corroded at the highest rate when 5-g/L NaNO3added owing to the largesticorr. Meanwhile,icorrwas the smallest in the system without NaNO3addition, and consequently coupons possessed the lowest corrosion rate. Furthermore, the lack of an evident passivity branch in the anodic curve in the system without NaNO3addition demonstrated that the surface was free of passivation. But passivity appeared around -0.65 V vs. Ag/AgCl reference electrode with the addition of NaNO3at 5-g/L. This passivation by NaNO3addition might be associated with the accumulation of sessileP.aeruginosacorrosion products.
3.3 Biofilm observation
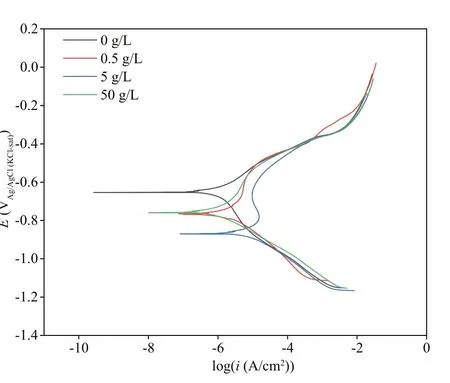
Fig.7 PDP curves recorded after 7 d ofimmersion in biotic systems added with NaNO 3 in diff erent concentrations
CLSM images of EH40 steel in biotic systems after diff erent times ofimmersion are described in Fig.8.Biofilm development varied in systems added with NaNO3in diff erent concentrations. On the first day,bacteria grew rapidly and formed a dense biofilm on the surface of the coupons in the systems with 0.5-and 5-g/L NaNO3added. After 3 d ofimmersion,about half of bacteria in biofilms were live, and then most died at day 7. The decline of bacteria was caused by the depletion of nutrients. Compared with the former two systems, the number of bacteria was smaller in the system without NaNO3addition, but most were live. Because there was no extra addition,NaNO3was limited.D.vulgariswas expected to dominate, and it could sustain for a longer time due to its slower metabolic rate thanP.aeruginosa. Besides,there were the least bacteria on coupons in the system added with 50-g/L NaNO3, suggesting that high concentration of nitrate hindered the growth of bacteria. But almost sessile bacteria were alive in this system, maybe determining the steadily increased weight loss.
3.4 Morphology analysis
Figure 9 displays the morphology of EH40 steel with/without corrosion product removal after 7 d ofimmersion in biotic systems with diff erent concentrations of NaNO3added. When the concentrations of NaNO3added were 0.5 and 5 g/L,EH40 steel coupons were covered by a layer of corrosion products with more bacteria and extracellular polymeric substance (EPS). While in the other 2 systems, the corrosion product layer held fewer bacteria and EPS. After removing corrosion products,polishing scratches were still visible on coupons exposed to the system without NaNO3addition, and consequently corrosion was slight. The addition of NaNO3accelerated the corrosion of EH40 steel. When the added NaNO3concentration was 5 g/L, EH40 steel suff ered from most serious corrosion.
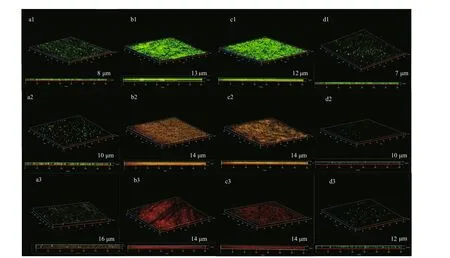
Fig.8 The CLSM images of EH40 steel obtained after 1 d (a1–d1), 3 d (a2–d2), and 7 d (a3–d3) ofimmersion in biotic systems added with NaNO 3 in diff erent concentrations
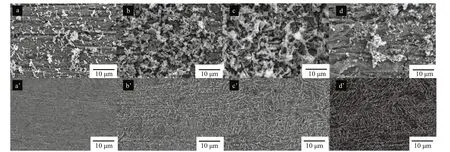
Fig.9 The SEM images of EH40 steel without (a–d) and with (a’–d’) corrosion product removal after 7 d ofimmersion in biotic systems added with NaNO 3 in diff erent concentrations
Surface roughness was further measured to check corrosion diff erences among diff erent systems, and the result are shown in Fig.10. The surface roughness increased with time, and the surface roughness of coupons increased in the order of 0- < 50- < 0.5- <5-g/L NaNO3added no matter on the 3thor 7thday.When the NaNO3concentration added was 5 g/L, the surface roughness was the largest (1.323), followed by 0.5 g/L. Evident rougher surfaces were observed when NaNO3was added, indicating acceleration in corrosion again.
3.5 Corrosion product composition analysis
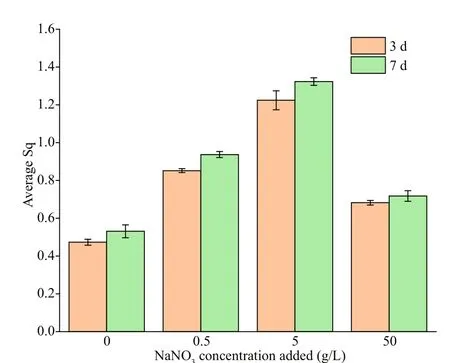
Fig.10 The surface roughness of EH40 steel after 3 and 7 d ofimmersion in biotic systems added with NaNO 3 in diff erent concentrations
The Fe 2p3/2spectra of the EH40 steel after immersed in biotic systems for 7 d are depicted in Fig.11. The components of products in diff erent systems were identical, all consisted of FeS2, FeO,and FeS, and their peaks were located at around 708.5,710.3, and 712.1 eV, respectively (Binder, 1973;Allen et al., 1974; Best et al., 1977; Hawn and Dekoven, 1987). The growth diff erences of two species in diff erent systems did not aff ect the composition of corrosion products due to the fact that metabolites ofP.aeruginosacould not form depositions with Fe.
3.6 Environmental parameter analysis
3.6.1 pH value
After 7 d ofincubation, pH values of the biotic systems with the addition of diff erent NaNO3concentrations are shown in Fig.12. When NaNO3in concentration of 5 g/L was added, pH was the highest(8.39), and followed by 0.5 g/L (7.74). In the systemswithout NaNO3added and with the addition at 50 g/L,the change of pH was rather slight compared with the initial pH (7.10). The high pH in systems with 0.5-and 5-g/L NaNO3indicated thatP.aeruginosawas stimulated, and it grew better in the system with 5-g/L NaNO3added. Furthermore, the promotion of nitrate to corrosion was not achieved by organic acids.
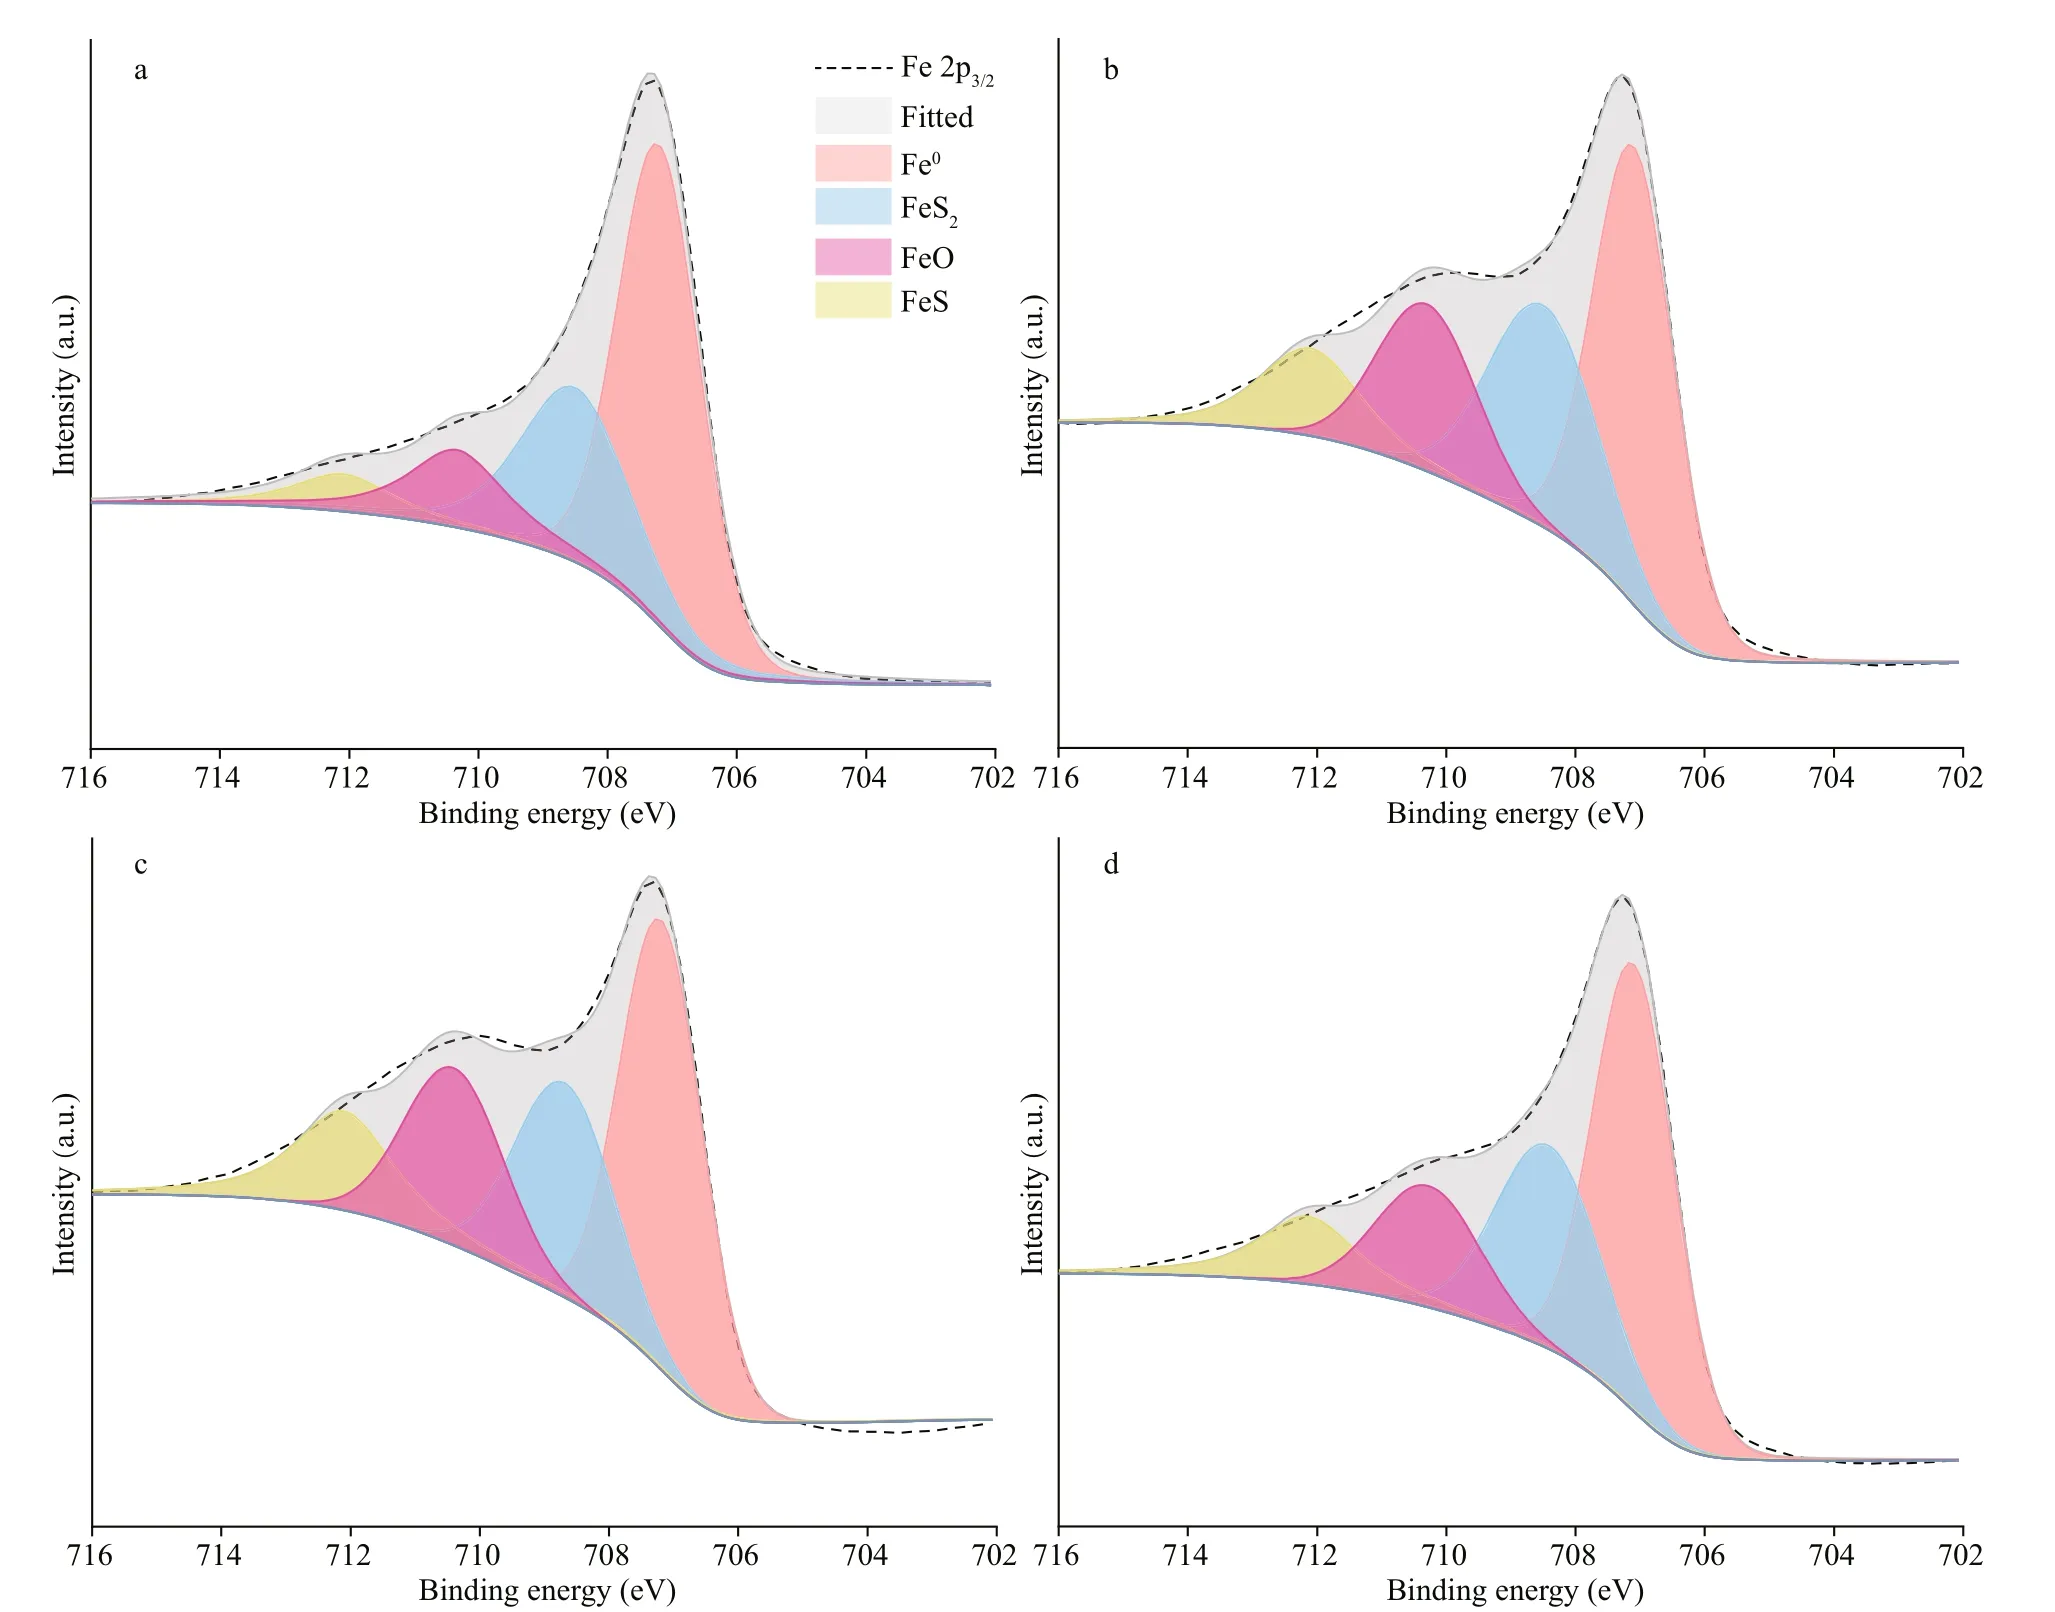
Fig.11 The Fe 2p 3/2 spectra of corrosion products on EH40 steel after 7 d ofimmersion in biotic systems added with NaNO 3 in diff erent concentrations

Table 2 Concentrations of HS–, SO 42ˉ, NO 3 ˉ, and NO 2 ˉ in diff erent systems before and after 7 d of culture (×10-6)
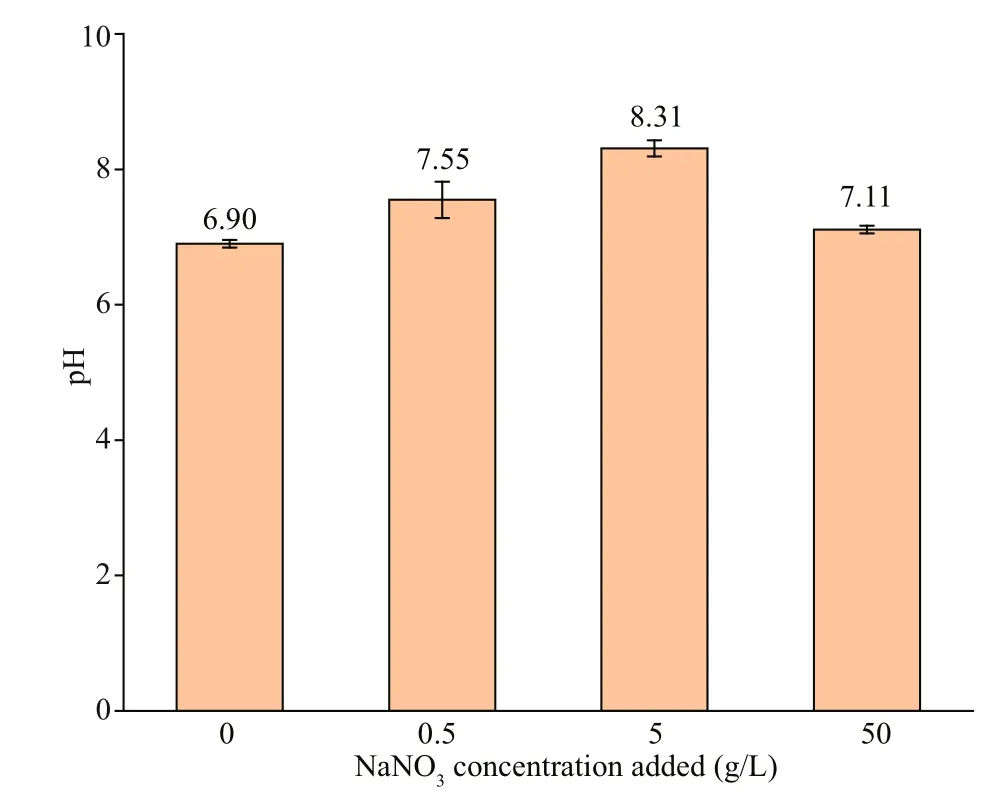
Fig.12 The pH in biotic systems added with NaNO 3 in diff erent concentrations on day 7
3.6.2 Ion concentration analysis
Table 2 displays the concentrations of HS-, SO42ˉ,NO3ˉ, and NO2ˉ in diff erent systems before and after 7 d of culture. In the system without NaNO3added, a large amount of SO42ˉ (1 197×10-6) was consumed and HS-(56×10-6) was produced. Instead, only 4×10⁻⁶NO3ˉ was utilized. The result indicated thatD.vulgarisplayed a dominant role in the system without nitrate added, and it reduced sulfate to sulfide by metabolism.In the systems with 0.5- and 5-g/L NaNO3added, less SO42ˉ was consumed and almost no HS-was detected after 7 d of culture, suggesting that quite fewD.vulgarisgrew in these systems. While there was almost no residual NO3ˉ, and 96%-99% of NO3ˉ was consumed. Because of the addition of NaNO3,P.aeruginosawas dominant by utilizing NO3ˉ as the electron acceptor for metabolism. Besides, there was almost no NO2ˉ produced, which might be due to the strong metabolic activity and direct reduction of NO3ˉ to NH4+ofP.aeruginosaunder optimum conditions.
Around 95×10-6NO2ˉ was accumulated in the system with 50-g/L NaNO3added, which might be due to the decline of bacterial metabolic activity by high nitration concentration. Rodríguez-Gómez et al.(2005) discovered that the denitrification was incomplete when the high nitrate concentration of nitrate was provided. Compared with the other two systems with the addition of 0.5- and 5-g/L NaNO3,NO3ˉ consumption was inhibited sharply by the addition of 50-g/L NaNO3.
3.6.3 Quantification ofP.aeruginosa
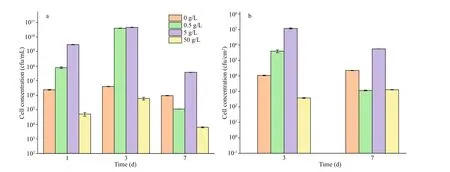
Fig.13 The planktonic (a) and sessile (b) cell numbers of P. aeruginosa in systems added with NaNO 3 in diff erent concentrations
The planktonic and sessile cell numbers ofP.aeruginosain systems with diff erent NaNO3concentrations added are displayed in Fig.13. The quantity of planktonic cells was close to the initial inoculation (ca. 106cfu/mL) in the whole period when NaNO3was not added, indicating propagation was limited due to the lack of electron acceptors forP.aeruginosa. The sessile quantity was around 104cfu/cm2on days 3 and 7. In the systems with 0.5-and 5-g/L NaNO3added,P.aeruginosareproduced rapidly in the first 3 days due to substantial electron acceptors available, and more than 1010cfu/mL cells were recorded on day 3. There was a sharp decrease of the planktonic quantity on day 7, which could be associated with the depletion of NO3ˉ (Table 2).Similarly, the numbers of sessileP.aeruginosacells decreased significantly from day 3 to day 7. Compared with the system without NaNO3addition, the numbers of sessileP.aeruginosacells increased by 1.5 and 4 orders of magnitude in systems added with 0.5- and 5-g/L NaNO3on day 3, respectively, but it decreased by 1 order of magnitude in the system with 0.5-g/L NaNO3added on day 7. The numbers of planktonic and sessileP.aeruginosacells in the system added with 5-g/L NaNO3were more than 1 order of magnitude higher than those in the system without NaNO3addition on day 7. The quantity of both planktonic and sessileP.aeruginosacells was the smallest in the system added with 50-g/L NaNO3.Corrosion rate is not always linear with sessile bacterial number, and corrosion activity of cells play a key role. Jia et al. (2017) reported that the number of sessileP.aeruginosadecreased under carbon starvation, but the weight loss increased. The quantity of planktonic cells was close to the initial inoculation in the whole period when NaNO3was not added,indicating propagation was limited due to the lack of electron acceptors forP.aeruginosa. In the system added with 50-g/L NaNO3, the number of sessileP.aeruginosawas smaller than that in the system without NaNO3addition due to high osmotic pressure.But the bacteria tended to aggregate (Fig.9). It was diffi cult for bacteria at the bottom of aggregates to obtain organics from solution, so they were expected to attack iron to obtain electrons. In addition, the presence of nitrite might aff ect corrosion, and it was found that corrosion rate increased from 0.02 mm/a in the system without NO2ˉ addition to 0.06 and 0.1 mm/a when 0.07- and 0.14-g/L NaNO2was added (Fig.14).However, the specific mechanism was not clear.
4 DISCUSSION
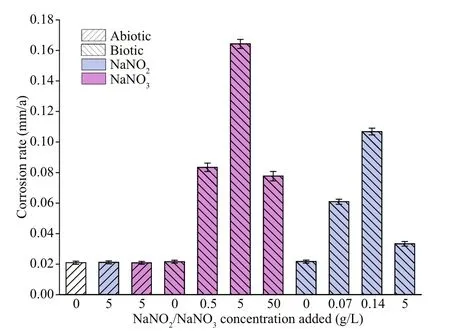
Fig.14 Corrosion rate of EH40 steel immersed in diff erent systems for 7 d
The mixed bacteria had little eff ect on EH40 steel corrosion in the systems without NaNO3addition.After 7 d ofimmersion, the weight loss in biotic media was close to that in the sterile media (Fig.2).According to the results ofion concentrations(Table 2),D.vulgarisdominated in the mixed bacteria.Nutrients were rich in the present media, and biofilms were relatively thin (Fig.8). Consequently, EH40 steel corrosion acceleration by EET under carbon starvation did not play the leading role, which was in good agreement with our previous work on Q235 carbon steel corrosion aff ect byDesulfovibriosp.Huiquan2017 (Li et al., 2021). On the other hand,corrosion byD.vulgarismight be hampered byP.aeruginosa. Liu and Cheng (2020) claimed that the presence ofP.aeruginosacould promoteD.vulgariscells to be surrounded by corrosion products, leading to weaker corrosion than the system withD.vulgarisonly.
EH40 steel corrosion was promoted with nitrate addition in the presence of mixed bacteria, but no corrosion diff erences were observed in sterile systems with and without the addition of 50-g/L NaNO3.Subsequently, the corrosion acceleration of nitrate addition was achieved by bacteria. Meanwhile,corrosion promotion was dependent on the addition of nitrate concentrations, which increased from 0 to 5 g/L and decreased from 5 to 50 g/L. However,Schwermer et al. (2008) discovered that the addition of 1-mmol/L NO3ˉ mitigated the uniform corrosion in PWRI systems. This diff erence was believed to be closely associated with diff erent states of bacterial growth and biofilms in diff erent systems. In the systems with 0.5- and 5-g/L NaNO3added, bacteria grew rapidly and formed dense biofilms on the coupons in the early state (Fig.8), which resulted in increasedRfvalues and protected EH40 steel.Moreover, dense biofilms hindered the electron transfer and the values ofRctincreased in the early stage of the experiment. Furthermore, EET did not play a major role due to abundant nutrients and the decreased corrosion rate. In the later stage of the trial,bacteria decayed rapidly due to the depletion of organic matter, and the protective eff ect of biofilms was weakened. These led to decreasedRfandRct.Bacteria began to attack EH40 steel in the bottom of biofilms to obtain electrons, and EET played a key role. According to the results ofion concentration, the addition of nitrate promoted the growth ofP.aeruginosa, which utilized NO3ˉ as electron acceptor. The voltage diff erence between NO3ˉ/NH4+(EhpH=7.0=+358 mV vs. SCE) and Fe/Fe2+(EhpH=7.0=-447 mV vs. SCE) was larger than that between SO42ˉ/HS-(EhpH=7.0=-217 mV vs. SCE) and Fe/Fe2+, and more energy was obtained from NO3ˉ reduction(Eckford and Fedorak, 2002; Jia et al., 2017; Gu et al.,2021). This proved thermodynamic feasibility.Accordingly, high corrosion activity ofP.aeruginosawas expected from the perspective of energetics.Meanwhile, compared with the system added with 0.5-g/L NaNO3, the one added with 5 g/L supported more sessileP.aeruginosacells in the later stage of the experiment (Fig.13), and the corrosion promotion was stronger. Nevertheless, despite the favorable thermodynamics, corrosion rates are determined by kinetic limits. Hence, taking into account the complexity of the long-term denitrification process,the central role of the biofilm’s catalytic activity was crucial (Jia et al., 2017).
In the system with 50-g/L NaNO3added, the growth of both bacteria was inhibited, and the bacterial activity decreased due to high osmotic pressure. The high concentration of nitrate influenced the denitrification and around 100×10-6NO2ˉ was detected after 7 d ofinoculation. The impact of NO2ˉ intermediate on corrosion has been investigated, and the result is shown in Fig.14. Corrosion rate increased from 0.02 mm/a in the system without NO2ˉ addition to 0.06 and 0.1 mm/a when 0.07- and 0.14-g/L NaNO2was added, and then decreased to 0.03 mm/a with the addition of 5-g/L NaNO2. The acceleration in corrosion rate by NaNO2addition with low concentrations might be associated with additional electron acceptors provided by NO2ˉ and other unknown mechanisms. Moreover, the decrease by the high concentration could be due to its toxicity (Hubert et al., 2005). Lee et al. (2012) found that the addition of 200×10-6nitrite decreased the corrosion rate of a carbon steel pipeline in deoxidized synthetic tap water by forming a passive film which was composed mainly of maghemite (γ-Fe2O3). But passivation eff ect of NaNO2added with 5 g/L was not observed in abiotic media in the present work, which might be due to the diff erence in media.
The inhibition of nitrate addition on SRB growth and metabolism is in good agreement with previous reports. For example, Kebbouche-Gana and Gana(2012) discovered that the total amount of sulfide decreased in static tests with the SRB consortium obtained from the In Amenas injected water, when nitrate was dosed at 120 mg/L. In addition, Einarsen et al. (2000) discovered that nitrate prevented the formation of H2S and other odorous compounds.However, the inhibition on SRB did not inhibit corrosion in the present study, on the contrary, it promoted corrosion of EH40 steel. This was due to the stimulation on NRB with high corrosive activity.Therefore, care must be taken to BCE method with nitrate when NRB with high corrosive activity were present in the environments.
5 CONCLUSION
This study identified that only mixed bacteria ofD.vulgarisandP.aeruginosaor nitrate had little eff ect on EH40 steel corrosion, but nitrate could accelerate the corrosion of EH40 steel through the action of microorganisms.D.vulgariswas dominant without nitrate added, and its eff ect on EH40 steel by EET was weak in the case of suffi cient nutrients. The corrosion promotion of nitrate addition in the presence ofD.vulgarisandP.aeruginosawas dependent on its concentrations, and it increased from 0 to 5 g/L and decreased from 5 to 50 g/L. These diff erences might be attributed to the regulation of nitrate in the growth of bacteria and biofilms. NaNO3added with 0.5 and 5 g/L promoted the growth ofP.aeruginosawith high corrosive activity, and accordingly accelerated corrosion. Meanwhile, 5-g/L NaNO3supported more sessileP.aeruginosacells than 0.5 g/L in the later stage, and severer corrosion was achieved by EET.Further increase in NaNO3concentration added to 50-g/L weakened corrosion promotion of EH40 steel due to low bacterial quantity and activity by high osmotic pressure. Although nitrate is commonly used as a corrosion inhibitor in PWRI system, it induces more serious corrosion when NRB with high corrosive activity are present in the environments. Therefore,sodium nitrate should be classified as a dangerous inhibitor and carefully adopted according to the specific environments.
6 DATA AVAILABILITY STATEMENT
The datasets generated during the current study are available from the corresponding author on reasonable request.
 Journal of Oceanology and Limnology2022年4期
- Journal of Oceanology and Limnology的其它文章
- Validation and error analysis of wave-modified ocean surface currents in the northwestern Pacific Ocean*
- The energy conversion rates from eddies and mean flow into internal lee waves in the global ocean*
- Observation of physical oceanography at the Y3 seamount(Yap Arc) in winter 2014*
- Decadal variation and trend of the upper layer salinity in the South China Sea from 1960 to 2010*
- Observations of turbulent mixing and vertical diff usive salt flux in the Changjiang Diluted Water*
- Experimental research on oil film thickness and its microwave scattering during emulsification*
