
Forthrightly monitoring ferroptosis induced by endoplasmic reticulum stresses through fluorescence lifetime imaging of microviscosity increases with a specific rotor
2022-06-20 08:00ChuanhaoLiuLinZhouLijuanXieYingZhengHuiziManYiXiao
Chinese Chemical Letters 2022年5期
Chuanhao Liu, Lin Zhou, Lijuan Xie, Ying Zheng, Huizi Man, Yi Xiao,*
a Engineering Research Center of Molecular Medicine of Ministry of Education, Key Laboratory of Fujian Molecular Medicine, School of Medicine, Huaqiao University, Quanzhou 362021, China
b State Key Laboratory of Fine Chemicals, Dalian University of Technology, Dalian 116024, China
Keywords:Ferroptosis Viscosity FLIM ERS Rotor
ABSTRACT To test the hypothesis that the microviscosity changes of Endoplasmic Reticulum (ER) can be a useful indicator of ferroptosis promoted by ER Stresses (ERS), a new ER targeting viscosity rotor, L-Vis-1 was developed and applied in the quantitation of viscosity by FLIM imaging in live cells.The FLIM imaging exhibited an excellent resolution almost as good as the corresponding confocal imaging, more significantly, during ferroptosis processes promoted by different types of ERS, the viscosity increases were clearly monitored by FLIM of L-Vis-1 within ER, which has not been demonstrated before.
Ferroptosis is a new kind of iron-dependent programmed cell death, which is different from apoptosis, necrosis, and autophagy in terms of morphological, biochemical, and genetic features [1].Ferroptosis is implicated in various physiological and pathological processes, such as T cell immunity [2], Alzheimer’s disease [3], and cancers [4].Therefore, the identification of ferroptosis is of significance for biological researches and medical diagnoses.Generally,determining the intracellular expression levels of Xct (system xc-)[5] and GPX-4 (glutathione peroxidase 4) [6] are the most common methods to evaluate ferroptosis.However, these ways are timeconsuming and invasive.Therefore, there is an urgent need to develop a rapid and non-invasive method to monitor ferroptosis.
The endoplasmic reticulum (ER), an important type of subcellular organelles, has been recognized as a major participant in ferroptosis [7].ER plays many critical roles for maintaining the normal homeostasis of cells.However, when ER is affected under various stress conditions, such as hypoxia, glucose deficiency, calcium imbalance, oxidative stress, inflammation, the processing of proteins within ER will be disordered [8].Therefore, there is no wonder that ER stresses (ERS) can be important causes of ferroptosis.Recent evidences have indicated that ERS can activate the pathway of the transcription factor 4(ATF4)-C/EBP homologue protein(CHOP), which promotes the occurrence of ferroptosis [9–13].Since ERS will result in the accumulation of unfolded or misfolded proteins, there should be an apparent increase in viscosity inside ER[14].Thus, we hypothesize that ERS-associated ferroptosis can be revealed by the dynamic changes in ER viscosity.If feasible, this provides a simple and convenient way for ferroptosis monitoring,as a novel alternative to conventional method to quantitate the protein markers.
Since viscosity is well known as one of the critical environmental factors in cells, a variety of fluorescent probes have been developed to sense and image intracellular viscosity [15–17].Although some probes had been reported to detect cell viscosity during the ferroptosis process, these probes not localized in ER, but preferentially localized in other organelles, such as lipid droplets, cytoplasm [18,19].Even in pioneering works, few fluorescent probes could be targeted for the local viscosity of the endoplasmic reticulum.However, their sophisticated dual-fluorophore configures,multimode sensing, and challenging syntheses are unfavorable factors restricting their extensive applications.Briefly, there was a lack of qualified probes that monitored ferroptosis by visualizing the ER microviscosity [20–23].
Herein, a new viscosity probe L-Vis-1 targeting ER was developed through conjugating a BODIPY rotor and a sulfonamide unit(Scheme 1).On the one hand, BODIPY rotor is advantageous in design of viscosity probes, due to its high sensitivity to viscosity, and excellent photophysical properties [24–28].And on the other hand,sulfonamide is an ER targeting group simplified from the structure of sulfonylurea [29,30].It was confirmed that probe L-Vis-1 could label ER specifically, and maintain the sensitive responsiveness to local viscosity.In combination of probe L-Vis-1 and fluorescence lifetime imaging technique, the microviscosity of ER in live cells could be accurately mapped with the high spatial resolution.Most importantly, under ferroptosis occurring at induction conditions, apparent viscosity increases in endoplasmic reticulum were quantitatively monitored for the first time.
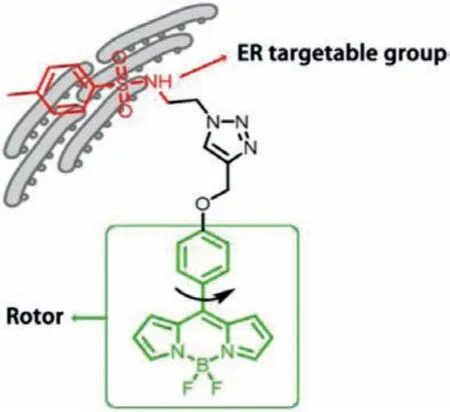
Scheme 1.Working principle of endoplasmic reticulum viscosity probe L-Vis-1.
All compounds were prepared according to the procedures detailed in Supporting information and well-characterized by1H NMR,13C NMR, and mass spectrometry.Firstly, to characterize the viscosity responsiveness, the fluorescence emission spectra of L-Vis-1 were measured in series of methanol/glycerol mixture solutions with different viscosities.As shown in Fig.1a, the probe showed weak fluorescent emission at 515 nm in pure methanol solution under excitation at 460 nm.As the glycerol content increased from 10% to 99% (v/v, viscosity values from 1.8 cP to 950 cP), the fluorescence intensity of L-Vis-1 at 515 nm showed a remarkable 26-fold enhancement.The viscosity-dependent rotation of the C-C single bond linked to the BODIPY and phenyl unit was restricted with increasing solvent viscosity, which resulted in a decrease in energy consumption in the form of non-radiation.And the response to viscosity by fluorescence intensity of L-Vis-1 was quantitatively transformed into a linear relationship between logIand logη(R2= 0.99,x= 1.38) in the range of 1.8–950 cP according to the Forster-Hoffmann equation (Fig.1b).Subsequently, fluorescence lifetimes of L-Vis-1 in above viscosity systems were investigated.As shown in Fig.1c, the fluorescence lifetime of L-Vis-1 exhibited a similar variation tendency toward viscosity, which gradually prolonged with the increase of viscosity, as well as a faultless linear relationship between logτand logη(R2= 0.99,x= 0.55)following the variational Forster-Hoffmann equation (Fig.1d).It was also worth noting that, the highly sensitive viscosity-response of L-Vis-1 was independent of solvent polarity and pH (Figs.S1 and S2 in Supporting information).In order to evaluate the selectivity of L-Vis-1, other environment factors may potentially influence the response signals were investigated.The fluorescent intensity and lifetime of L-Vis-1 PBS solution (pH 7.4) containing Ca2+,Cu2+, K+, Mg2+, Fe2+, Zn2+, cysteine, alanine, lysine, glucose, glutathione, human serum albumin, H2O2and·OH, respectively.As shown in Fig.S3 (Supporting information), the introduction of all these species caused negligible changes in the fluorescent intensity and lifetime, which confirmed that L-Vis-1 had very good selectivity the potential of applications for sensing viscosity changes in a complex biological environment.
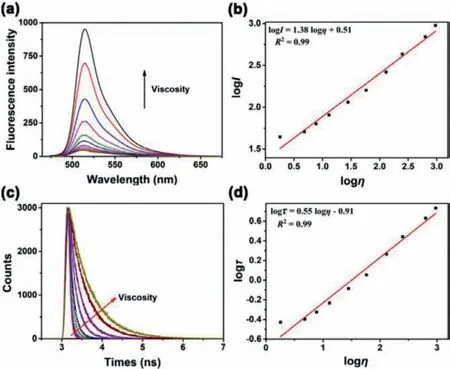
Fig.1.(a) Fluorescence spectra of L-Vis-1 (2 μmol/L) in methanol/glycerol mixtures.(b) The relationship between fluorescence intensity and the viscosity.(c) The fluorescence lifetime spectra for 2 μmol/L L-Vis-1 with the increase of the viscosity of mixed methanol-glycerol solutions.(d) The relationship between the fluorescence lifetime and the viscosity for L-Vis-1.
The cytotoxicity of L-Vis-1 was very low within 24 h of incubation (Fig.S4 in Supporting information).The standard MTT assay indicated that L-Vis-1 at low micromolar concentrations shown no marked cytotoxicity toward the cells (85% HeLa cells survived after 24 h with 20 μmol/L of probe incubation).Which meant L-Vis-1 can be used for cell imaging.
Co-localization experiments were carried out to inspect the probe’s subcellular targetability, by staining cells with of L-Vis-1 together with the commercial organelles’trackers for ER and mitochondria, respectively.As shown in Fig.2a, L-Vis-1 emited green fluorescence signals in channel 1 and the commercial ER tracker emited red signals in channel 2.These two channels overlapped very well, with a Pearson’s colocalization coefficient high up to 0.93, confirming the high specificity of L-Vis-1 to ER.Moreover, the poor overlapping of L-Vis-1 and Mito Tracker Red (Fig.2b), as well as the low colocalization coefficient (0.54), indicated that L-Vis-1 was not distributed in mitochondria.
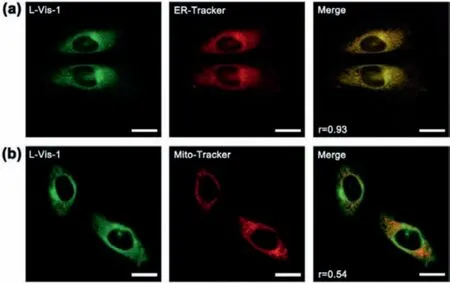
Fig.2.Fluorescent colocalization imaging of L-Vis-1 in HeLa cells.(a) HeLa cells were incubated with L-Vis-1 (5 μmol/L) for 30 min and then stained with ER Tracker Red (1 μmol/L) for 10 min.(b) Colocalization fluorescence images of HeLa cells incubated with L-Vis-1 (5 μmol/L) for 30 min and then stained with Mito-Tracker Deep Red (1 μmol/L) for 5 min.Scale bars:20 μm.
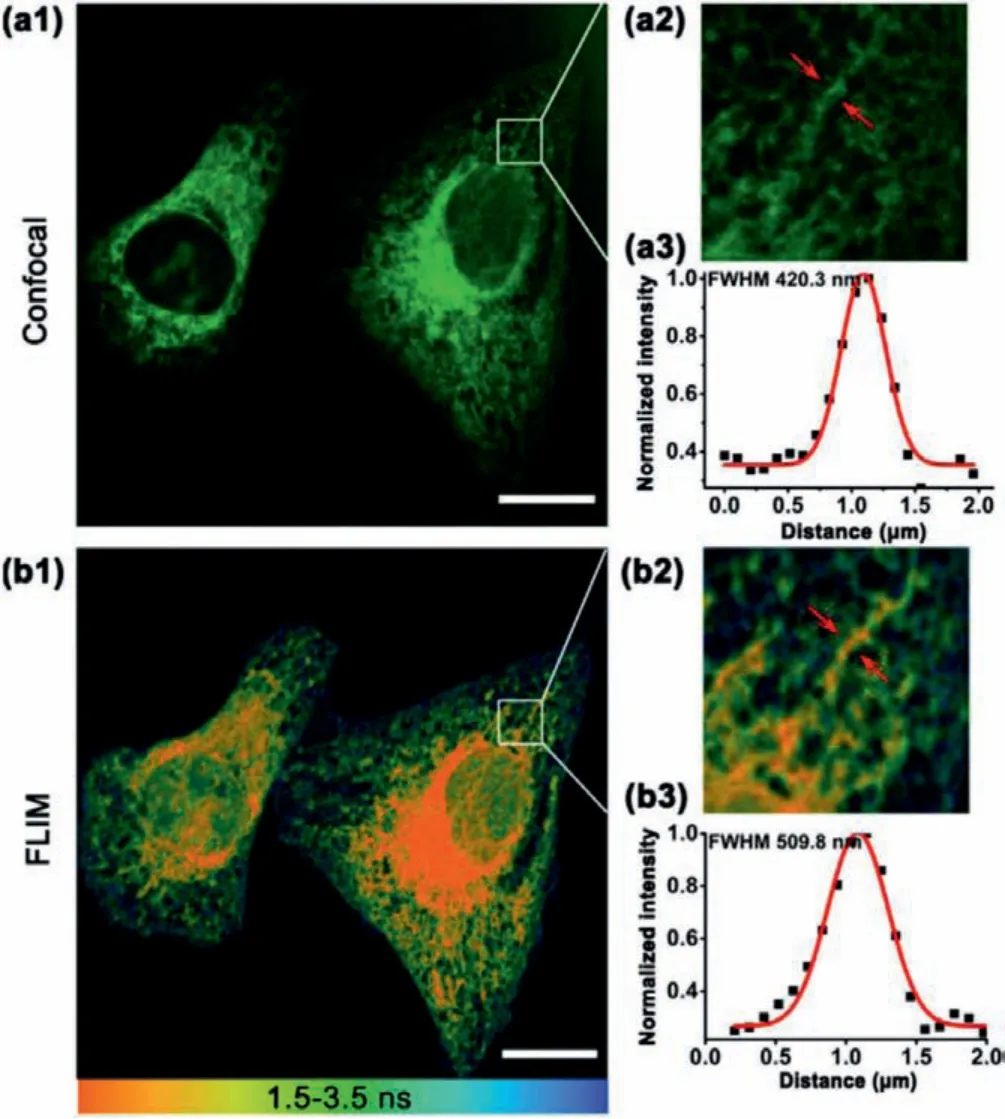
Fig.3.Fluorescence and lifetime imaging of L-Vis-1 in HeLa cells.(a1) Fluorescence imaging of L-Vis-1 (5 μmol/L) incubated with HeLa cells for 30 min.(a2) The magnified image of the region of interest (ROI) in (a1).(a3) Intensity profiles of the red arrow marked regions in (a2).(b1) FLIM of L-Vis-1 incubated with HeLa cells for 30 min.(b2) The magnified image of the region of interest (ROI) in (b1).(b3) Intensity profiles of the red arrow marked regions in (b2).Data were fitted with the Gaussian function.Scale bar = 20 μm.
Next, the applicability of L-Vis-1 to sense the microviscosity in ER of live cells was tested.For quantitatively detection, fluorescence lifetime imaging (FLIM) is advantageous over intensity imaging, because the former is not affected by a probe’s inhomogeneous concentration distributions.L-Vis-1 was well suited for FLIM imaging, as its fluorescence lifetime was highly sensitive to viscosity.However, a general disadvantage of FLIM is its relatively lower spatial resolution.Fortunately, the FLIM imaging (Figs.3b1–b3) with L-Vis-1 demonstrated an excellent resolution which was almost as good as the corresponding confocal imaging (Figs.3a1–a3).Such a good imaging quality should be ascribed to the strong fluorescence signals of this BODIPY-based probe and its high specificity to ER.With the good resolution, FLIM image could accurately and quantitatively map the local viscosity in any designated ER regions, no matter rough or smooth ER (Fig.S6 in Supporting information).To the best of our knowledge, no cases on this topic have been reported recently [23,31].
Then, our research was directed to the visualization of ERSassociated ferroptosis, through utilizing the combination of L-Vis-1 and FLIM.The information on the local viscosity changes in different ER regions during ferroptosis could be quantified, thanks for the high spatial resolution in FLIM with L-Vis-1.To induce cellular ferroptosis, two stimulants were adopted.Erastin, a wellknown ferroptosis activator, could inhibit cysteine uptake by the cystine/glutamate antiporter (Xct), creating a void in the antioxidant defenses of cells and ultimately leading to ferroptosis [1].Artesunate, a water-soluble derivative of the natural compound artemisinin, could interact with lysosomal iron generates levels of ROS that overcome the capacity of the antioxidant response, which led to lipid peroxidation and ferroptosis [32,33].Ferrostatin-1 (Fer-1), as a small molecule inhibitor of ferroptosis [1].As shown in Figs.4g1-g3, the average lifetime in the erastin-treated cells apparently increase to 2.42 ns (from 1.59 ns for the untreated cells).According to the calibration curve, the corresponding viscosity of erastin-treated cells was averaged at 225 cP, which was higher than that of untreated cells (105 cP).While in contast with untreated cells (1.56 ns, 105 cP), the average lifetime of earstin and Fer-1-treated cells was barely changed (1.63 ns, 109 cP), which reflected that Fer-1 was effective in alleviating ERS caused by ferroptosis.In Figs.4a–f, 1○, 3○and 5○were the rough endoplasmic reticulum (RER), as well as 2○, 4○and 6○represented the smooth endoplasmic reticulum (SER).After stimulation with erastin for 4 h, the fluorescence lifetime of the RER in the erastin-treated cells (region 3○) apparently increased to 1.96 ns (from 1.53 ns for region 1○of untreated cells).The corresponding viscosity of region 3○was averaged atca.153 cP, which was higher than region 1○(ca.98 cP)(Fig.4h1).As well as the fluorescence lifetime of the SER increased from 3.05 ns (region 4○) to 2.82 ns (region 2○).According to the calibration curve, the viscosity of region 4○was averaged atca.343 cP, which was higher than region 2○(ca.297 cP) (Fig.4h2).It is worth noting that the viscosity of RER during the ferroptosis process changed more than that SER.These can be explained as the rough endoplasmic reticulum was the site of protein synthesis, and UPR (unfolded protein response) caused by ER stress has a greater impact on the viscosity of the rough endoplasmic reticulum microenvironment.Meanwhile, after co-incubation with erastin and Fer-1 for 4 h, both the fluorescence lifetime of RER (e.g.,1.60 ns for Region 6○,ca.106 cP) and SER (e.g., 2.93 ns for Region 5○,ca.319 cP) were almost unchanged compared with the control group.And similar phenomena were also found by treated with artesunate (Fig.S7 in Supporting information).These experimental results confirmed that ferroptosis can be detected by monitoring changes of endoplasmic reticulum viscosity.
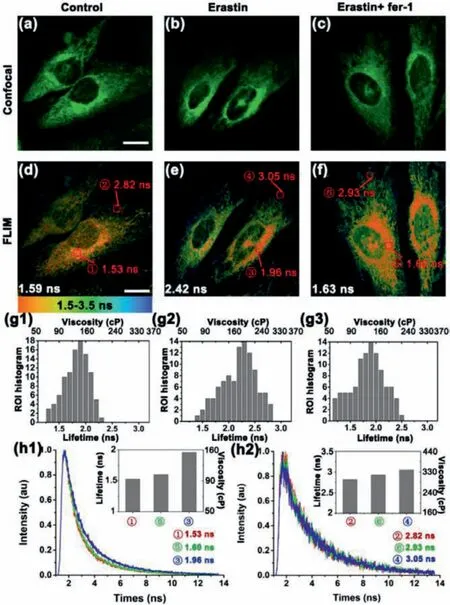
Fig.4.Fluorescence and lifetime imaging of L-Vis-1 in HeLa cells during different incubation times.Fluorescence imaging and fluorescence lifetime imaging (FLIM)of HeLa cells under different conditions.(a) Fluorescence imaging and (d) FLIM of L-Vis-1 incubated with HeLa cells for 30 min; (b) fluorescence imaging and (e)FLIM of HeLa cells pretreated with 10 μmol/L erastin for 4 h and then incubated with 5 μmol/L L-Vis-1 for 30 min; (c) fluorescence imaging and (f) FLIM of HeLa cells pretreated with 10 μmol/L erastin and 5 μmol/L Fer-1 for 4 h and then incubated with 5 μmol/L L-Vis-1 for 30 min.(g1-g3) Fluorescence lifetime distribution histogram of 100 regions of interest (ROIs) in (d), (e), (f), respectively.ROI size = 0.8 μm × 0.8 μm, 9 pixels.(h1) Fluorescence decays and distribution histogram (inset) of different regions of interest (ROIs) in (d), (e), (f); (h2) Fluorescence decays and distribution histogram (inset) of different regions of interest (ROIs) in(d), (e), (f).Scale bar = 20 μm.
Encouraged by the above results, we further monitor the viscosity changes of ER under different conditions which induced ferroptosis.It could clearly observe that the red plaques represented the short lifetime gradually became smaller, which proved that the ER viscosity increased during the ferroptosis process induced by erastin and artesunate (Fig.5a).As shown in Fig.5b, after stimulation with erastin for 4 h, the average fluorescence lifetime of ER changed from 2.01 ns to 2.42 ns, which meant that the average viscosity increased fromca.161 cP toca.225 cP.Similar phenomena were also found by incubating with artesunate (Fig.5c).After stimulation with artesunate for 4 h, the fluorescence lifetime in ER of HeLa cells increased from 2.02 ns to 2.60 ns, which indicated that the average viscosity increased fromca.162 cP toca.256 cP.And it is worth noting that the viscosity of ER in the artemisinin group barely increased from 3 h on compared with the erastin groups.This should be related to the different mechanism of action of ferroptosis in two drugs.Thus, under our stimulation conditions, both erastin and artesunate did greatly influence the ER viscosity.These experiments demonstrated that the ferroptosis process was clearly accompanied by ER viscosity increased.Based on these findings, it can be confirmed that L-Vis-1 is an available detection tool for ferroptosis.
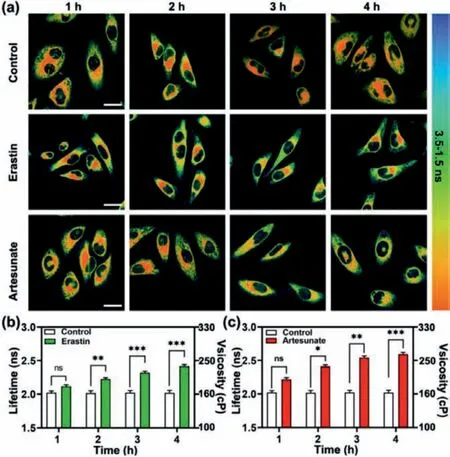
Fig.5.Monitoring of viscosity change in ferroptosis induced by erastin and artesunate during different incubation times.(a) Cells incubated for 0–4 h and then incubated with 5 μmol/L L-Vis-1 for 30 min; Cells pretreated with 10 μmol/L erastin for 0–4 h and then incubated with 5 μmol/L L-Vis-1 for 30 min; Cells pretreated with 10 μmol/L artesunate for 0–4 h and then incubated with 5 μmol/L L-Vis-1 for 30 min.(b) Fluorescence lifetime changes of control group and erastin group cells during different incubation times in (a); (c) Fluorescence lifetime changes of control group and artesunate group cells during different incubation times in (a).The results are presented as mean ± standard deviation (n = 3).Significant differences(ns:no significant difference; *P <0.05; **P <0.01; ***P <0.001) are performed by Student’s t-test.Scale bar = 20 μm.
In summary, in order to monitor ferroptosis, we developed LVis-1, a new type of probe which specifically targets the endoplasmic reticulum and senses local viscosity with its fluorescence lifetime.The FLIM imaging with high spatial resolution is nearly as good as that of confocal imaging.For the first time, during different ferroptosis processes, real-time quantitative analysis of ER viscosity changes in living cells has been achieved by the combination of L-Vis-1 and FLIM.This research fully proves our hypothesis that ER microviscosity is a suitable indicator for ferroptosisrelated diagnoses.And it is believed that L-Vis-1 is a practical tool for future diagnoses in ferroptosis and ER stresses related diseases.
Declaration of competing interest
The authors declare no conflict of interest.
Acknowledgments
This work was financially supported by the National Natural Science Foundation of China (Nos.21776037, 22174009), Dalian Science and Technology Innovation Fund (No.2020JJ25CY014), and Quanzhou Science and Technology Plan Project (No.2019C033R).The authors wish to acknowledge Prof.Tao Sun and the Analysis and Testing Center of Huaqiao University for the helps in this work.
Supplementary materials
Supplementary material associated with this article can be found, in the online version, at doi:10.1016/j.cclet.2021.11.082.
 Chinese Chemical Letters2022年5期
- Chinese Chemical Letters的其它文章
- Recent advances in enhancing reactive oxygen species based chemodynamic therapy
- An integrative review on the applications of 3D printing in the field of in vitro diagnostics
- Recent developments of droplets-based microfluidics for bacterial analysis
- Dynamics and biological relevance of epigenetic N6-methyladenine DNA modification in eukaryotic cells
- Recent progress in advanced core-shell metal-based catalysts for electrochemical carbon dioxide reduction
- Recent advances in carbon-based materials for electrochemical CO2 reduction reaction