
The integrated analyses of metabolomics and transcriptomics in gill of GIFT tilapia in response to long term salinity challenge
2022-05-17 11:57HuiQinZholongYuZongxinZhuYilongLinJunhongXiYongxiJi
Aquaculture and Fisheries 2022年2期
Hui Qin, Zholong Yu, Zongxin Zhu, Yilong Lin, Junhong Xi,,*, Yongxi Ji
aState Key Laboratory of Biocontrol, Institute of Aquatic Economic Animals and Guangdong Provincial Key Laboratory for Aquatic Economic Animals, College of Life Sciences, Sun Yat-Sen University, Guangzhou, 510275, China
bGuangdong Guanlida Marine Biological Co.,Ltd, Maoming, 525400, China
cSouth China Botanical Garden, Chinese Academy of Science, No.723 Xingke Road, Tianhe District, Guangzhou, 510650, China
Keywords:
Nile tilapia
Metabolomics
Transcriptomics
Salinity
A B S T R A C T
The Nile tilapia, Oreochromis niloticus, GIFT strain is suggested to be a good candidate for culture in brackish water. Gill is regarded as the dominate site of osmo-regulation. Recently, the mechanisms underlying salinity challenge in gill of tilapia are getting increasing attention. In this study, an integrated analysis of metabolomics and transcriptomics on gill of GIFT tilapia under salinity 17 and 27 challenge for three and a half months are conducted. 1164 DEGs in the comparison 0 vs 17 and 910 DEGs in the comparison 0 vs 27 are identified. Many typical genes involved in osmo-regulation are found, including calcium/calmodulin-dependent protein kinase II beta 1, Aquaporin 3, Potassium channel subfamily K member, chloride channel 2, Solute Carrier Family 12 Member 8, Solute Carrier Family 12 Member 2, Na +/K +ATPase. Some biosynthesis, metabolism, energy or transport related pathways are over-represented, such as Synthesis of UDP-N-acetyl-glucosamine, Synthesis of substrates in N-glycan biosynthesis, Biosynthesis of DPAn-3 SPMs, Metabolism of lipids, Gluconeogenesis and SLC-mediated transmembrane transport. In addition, totally 23 metabolites are significantly responded in gill under salinity challenge. Of which, 11 metabolites including 12-Hydroxyeicosatetraenoic acid and choline are significantly down-regulated and 8 metabolites including adenine, Lys-Pro, inosine are significantly up-regulated under salinity challenge. Our study provides an important database for further functional analysis of osmoregulation in gill of Nile tilapia.
1.Introduction
Osmo-regulation is critical for survival in fish. Euryhaline species of teleost fishes have remarkable ability to withstand wide fluctuations in environmental salinity (Baltzegar et al., 2014). Gill is regarded as the dominate site of osmo-regulation (Evans et al., 2005). In freshwater,teleosts gain water osmotically across the body surface, principally via the gill (Takei & Yuge, 2007). The osmotic permeability of the eel gill decreases drastically during seawater acclimation (Isaia & Hirano,1976). Low salinity media affects ion transporter expression in gill, thus leading to reduced growth performance and survival in juvenile Gulf killifish (Fundulus grandis) (Patterson et al., 2012). Tilapia are capable of switching the direction of active ion transport across their gill epithelium from salt absorption mode in freshwater to salt secretion mode in seawater (Fiol & Kultz, 2007). Gill claudins play a role in the salinity acclimation process of the euryhaline Mozambique tilapia(Oreochromis mossambicus) (Tipsmark et al., 2008). These findings indicate gill plays important roles in osmo-regulation in fish. Nevertheless, the specific functional mechanism in osmo-regulation remains unclear in teleosts.
Nile tilapia,Oreochromis niloticus, is found in the river basins and lakes of western, northern and central Africa (Trewavas, 1983). At present, GIFT strain that originated from Nile tilapia accounts for majority of tilapia production in China (Qiang et al., 2018) and the rest of the world. The GIFT strain is suggested to be a good candidate for brackish water culture (Ridha, 2008). Recent investigations of the growth under brackish water indicated salinity 16 is suitable for rearingO. niloticus,due to their high adaptability to such salinity condition without changes in their growth rate (El-Leithy et al., 2019). GIFT strain may display better growth performance together with a relatively higher endogenous LC-PUFA biosynthetic ability under brackish water (salinity 12 and 24), probably through improving the expression ofelovl5andpparαin liver (You et al., 2019). Low salinity negatively affects early larval development of Nile tilapia (Melo et al., 2019).
Stress response is a series of coordinated physiological reactions increasing the capacity of an organism to maintain homeostasis in the presence of threatening agents (Lacoste et al., 2001). In the face of variable salinity conditions during brackish aquaculture, the mechanisms underlying salinity challenge in tilapia are important and getting increasing attention. Vitamin C supplementation enhanced the expression of genes related to antioxidant capacity in Nile tilapia exposed to higher salinity, thereby increasing protection against the oxidative effects induced by high water salinity (Vieira et al., 2018). The osmotic control of branchial clc-2c (Clc Cl−channel family member) contributes to the freshwater adaptability of Mozambique tilapia (Breves et al.,2017). Investigation of two prolactins and their receptors (Yamaguchi et al., 2018) indicated the differentiated effects of water salinity between the Nile tilapia and Mozambique tilapia, which differ in their salinity tolerance. Recently the transcriptomic responses in hepatopancreas (Xu et al., 2015), spleen and head kidney (Xu et al., 2018), brain(Liu et al., 2018) and skin (Qin et al., 2020) of the Nile tilapia lines have been investigated in response to salinity challenge using RNA-seq. These studies provide a global overview of gene expression patterns and pathways that related to osmo-regulation in Nile tilapia.
Metabolomics is the study of the complete set of low-molecular weight metabolites present in a cell or organism at any one time. The integrated analyses of metabolomics and transcriptomics may be valuable for studying the effects of other stressors in fish, e.g., the stickleback(Santos et al., 2010) and Nile tilapia (Zhu et al., 2019). In this study, we explore the transcriptomic and metabolomic responses in gill of GIFT tilapia acclimated in 0, 17 and 27 of salinity conditions for three and a half months. We identified lots of differentially expressed genes (DEGs)and important over-represented pathways and 23 significantly differently responded metabolites in gill under salinity exposure. Our study provides a valuable database for further functional analysis of osmo-regulation in gill of Nile tilapia.
2.Materials and methods
2.1.Ethics statement
This study was supported by the Animal Care and Use Committee of the School of Life Sciences at Sun Yat-Sen University and all experiments were performed under the regulations and guidelines of this committee.
2.2.Fish sources and management
A fingerling population was generated at a local farm in Maoming,Guangdong province, China by masscrossing 50 GIFT tilapia. Nearly 300 individuals (~30 dph) were transferred to the fish facility in the college of Life Sciences, Sun Yat-Sen University. Fishes were cultured in circulating freshwater and were fed with pellets twice a day.
2.3.Experiment design and sample collection
Totally 210 fishes with similar initial body weight (~21.55 g/ fish)were randomly divided into 6 one cubic meter tanks with 35 fishes per tank. The water temperature was kept at 25–28 ℃ and the dissolved oxygen (DO) was kept at>5 mg O2/L. Two of the six tanks were used as the control group (0). Two of the remaining four tanks were set as medium salinity group (17) or high salinity group (27), respectively. The salinity concentration for the test group was gradually increased at ~5/day to the target concentration of salinity in each tank. We applied an aquarium filter system in each tank to keep water clean. Water in each tank was weekly renewed during the experiment. The whole experiment was lasted for three and a half months.
All fishes were fasted for 24 h before sample collection. Gill samples from 2 fish per tank were dissected and then frozen in liquid nitrogen,Totally 4 fish for each salinity group (0, 17 and 27, respectively) were obtained. Gill samples from 12 fish were finally transferred to a −80 ℃ refrigerator before RNA extraction. For metabolic analysis, gill samples from 10 healthy fish of the four tanks (0 and 17) and 6 healthy fish of the two salinity 27 tanks were collected separately, and kept in a −80 ℃ refrigerator before extracting metabolites.
2.4.RNA extraction and NGS sequencing
Total RNA was extracted from gill samples using TRIzol reagent(Invitrogen, UK) according to the manufacturer’s instructions. Total RNA integrity was further evaluated using Bioanalyzer 2100 (Agilent Technologies). Twelve libraries were constructed and submitted for 2 ×150 bp paired-end (PE) sequencing using Illumina Hiseq 2500.
2.5.Analysis of DEGs under salinity exposure
The high-quality clean reads were mapped against Nile tilapia reference genome (Oreochromis_niloticus.Orenil1.0.dna.toplevel.fa)using software Bowtie2 (Langmead & Salzberg, 2012). The cuffdiff program (Nookaew et al., 2012) was then applied to conduct DEG analysis. The generated DEGs were filtered using the parameterqvalue of<0.05. Venn diagram of the DEGs was created using online tool(http://bioinformatics.psb.ugent.be/webtools/Venn/).
2.6.GO annotation and pathway enrichment
Gene Ontology (GO) annotation of the DEG dataset was investigated using software Metascape (http://metascape.org) with apvalue of<0.01. Statistical over-representation test of DEGs was performed with the online tool PANTHER (http://www.pantherdb.org/) andDanio reriowas used as the reference geneset. PANTHER Reactome pathways were carried out using Fisher’s Exact with FDR<0.05.
2.7.Metabolite LC-MS analysis
Metabolites were extracted from ~150 mg per sample as described in Zhu et al. (2019). All samples were analyzed by high resolution mass spectrometry (Thermo Scientific; LTQ Orbitrap Elite mass spectrometer)with scanning model as fullmass +ddms2 and the Thermo Scientific™UltiMate™ 3000 HPLC system. The software CD2.1 was used for exacting raw peaks, filtering and calibration of the baselines, peak alignment, peak identification and integration of the peak area.T-test statistics was performed to identify the differentially responsible metabolites between groups with a minimump-value of<0.05. The heatmap for the metabolomic profiles was shown using the software Genesis(Sturn et al., 2002).
2.8.cDNA synthesis and qRT-PCR validation
Two μg of total RNA from each sample was reversely transcribed to cDNA according to the manufacturer’s instructions (Dongsheng Biotech,China). Briefly, a mixture of 13.4 μL, including 2 μg DNase I treated total RNA, 1 μL oligo (dT) primer, 1 μL 50 mmol/L EDTA and RNase-free ddH2O, was kept at 70 ℃ for 5 min. A total of 6.6 μL of mixture which included 4 μL of 5 × first-strand buffer, 1 μL dNTPs (10 mmol/L each), 0.6 μL RNasin, and 1 μL M-MLV) was added into the tube and kept at 42 ℃ for 60 min. To end the reaction, the mixture was kept at 70 ℃ for 5 min. The reactions were conducted in a PCR machine (BIO-RAD,USA).
PCR primers for thirty randomly selected DEGs were designed using the NCBI primer design tool (https://www.ncbi.nlm.nih.gov/tools/prim er-blast/). qRT-PCR reactions were conducted on LightCycler480(Roche, Switzerland) in a final volume of 10 μL containing 5 μL of 2 ×SYBR green MasterMix reagents (Dongsheng biotech, China), 0.2 μL of ddH2O, 2.5 μL of 1:10 diluted cDNA and 2 μL of each primer (10 μmol/L). The reaction consisted of a pre-incubation at 95 ℃ for 3 min, 40 cycles of denaturing at 95 ℃ for 15 s, annealing at 60 ℃ for 15 s and expanding at 72 ℃ for 20 s. Each sample was analyzed with three technical replications according to the ΔΔCt method.Ef1awas used as an internal reference gene. The primer information was shown in the Supplementary Table 1. Two-tailedtstatistical test was carried out to evaluate the expression differences between the control and test samples.
3.Results
3.1.DEGs detected in gill under salinity exposure
During the high salinity exposure, we found the tilapia populations in the two tanks with 27 salinity showed the highest mortality (43%),and the range of mortalities (0–10%) was observed at the salinity concentration of 0 and 17.
Totally 12 RNA-seq libraries were constructed with four biological replicates for each salinity group (0, 17, 27). About four Gb clean data for each library was obtained. The overall read alignment rate was ranging from 65.5% to 71.5%. We identified 1164 DEGs in the comparison of salinity 0 vs 17, including 626 up-regulated DEGs and 538 down-regulated DEGs (Supplementary Tables 2) and 910 DEGs in the comparison 0 vs 27 which included 415 up-regulated DEGs and 495 down-regulated DEGs (Supplementary Table 3). Besides, the comparison 17 vs 27 has the most DEGs (1555) with 740 up-regulated DEGs and 815 down-regulated (Supplementary Table 4). Overlapping analysis of these three datasets revealed 38 common DEGs in three comparisons in response to salinity stress (Fig. 1).
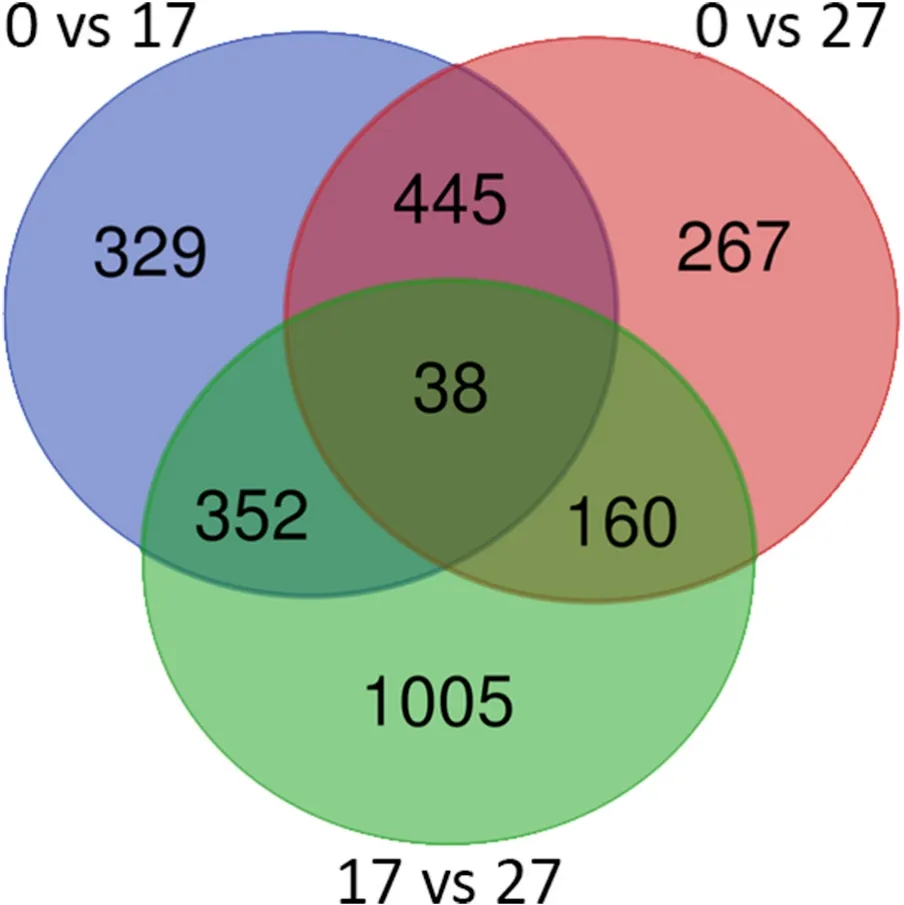
Fig. 1.Venn diagram showing the overlapping of DEGs detected among three comparisons. ‘0 vs 17’ means the comparison between the control (0) with the challenged fish group under salinity 17.
3.2.Over-representation analysis of the DEGs
Reactome pathway enrichment analysis of the DEGs found that many pathways, e.g., synthesis of UDP-N-acetyl-glucosamine (FDR =0.0302,Fold enrichment =19.94), GAB1 signalosome (FDR =0.0291, Fold enrichment =12.47), SLC-mediated transmembrane transport (FDR =0.00903, Fold enrichment =3.19) were over-represented under 17 salinity challenge. Nine pathways were over-represented under salinity 27 challenge, including biosynthesis of DPAn-3 SPMs (FDR =0.00837,Fold enrichment =64.72), erythropoietin activates Phosphoinositide-3-kinase (PI3K) (FDR =0.00924, Fold enrichment =23.53), RAF-independent MAPK1/3 activation (FDR =0.00208, Fold enrichment=23.11) and metabolism of lipids (FDR =0.0098, Fold enrichment =2.54). In addition, DEGs in the comparison 17 vs 27 were overrepresented in more pathways, e.g., cap-dependent translation initiation (FDR =8.13×10⁻⁸, Fold enrichment =5.46), SRP-dependent cotranslational protein targeting to membrane (FDR =7.16×10⁻⁸,Fold enrichment =6.37), metabolism of carbohydrates (FDR =0.00385,Fold enrichment =2.39) and synthesis of PIPs at the late endosome membrane (FDR =0.011, Fold enrichment =16.39) (Table 1). Overrepresentation of DEGs in the Glycolysis/Gluconeogenesis pathway was shown in Fig. 2. In this pathway, 6 DEGs in the comparison 0 vs 17 and 11 DEGs in the comparison 0 vs 17 were identified.
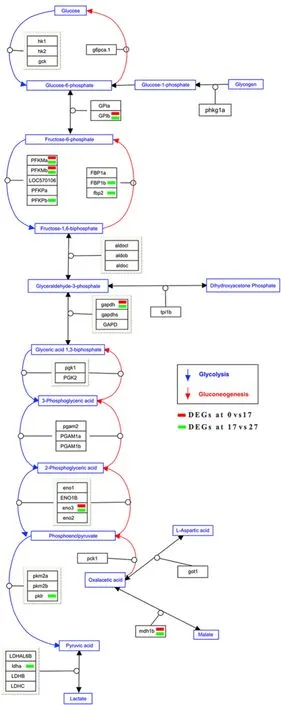
Fig. 2.The enrichment of DEGs in the glycolysis and gluconeogenesis pathway.
3.3.GO enrichment analysis of the DEGs
GO enrichment analysis of the DEGs suggested that many GO categories were significantly enriched in three comparisons. Protein domain specific binding (GO:0019904) in molecular function category, sarcomere (GO:0030017) in cellular components category and organic acid biosynthesis process (GO:0016053) in biological process category were found significantly enriched in the comparison group 0 vs 17. In the comparison group 0 vs 27, DEGs were significantly enriched in multiple categories which included MAP kinase tyrosine/serine/threonine phosphatase activity (GO:0017017), polymeric cytoskeletal fiber(GO:0099513) and regulation of intracellular signal transduction(GO:1902531). Organophosphate metabolic process (GO:0019637) in biological process category in the comparison group 17 vs 27 had the most abundant DEGs (69, Log10(P) =7.79), and DEGs were only enriched in actin binding (GO:0003779) of molecular function. Gene number and fold enrichment of every GO term were given in Fig. 3.

Fig. 3.GO enrichment of DEGs that detected in three comparisons of different salinity conditions. The horizontal axis shows the gene number in every GO term. The value of -Log10(P) was given after the bar.
3.4.Metabolic responses in gill exposed to high salinity
Gill samples from the three groups (0, 17 and 27) were extracted and run for identification of responded metabolites. We totally observed 23 metabolites were significantly differentiated responded, such as 11-α-Hydroxy-17-methyltestosterone and α-Eleostearic acid. Four of 23 metabolites were annotated as unknown (Fig. 4). In the comparison 0 vs 17, 14 metabolites were down-regulated and 9 metabolites were upregulated. Besides, both of the comparisons (0 vs 27 and 17 vs 27)found 11 down-regulated and 12 up-regulated metabolites (Fig. 4).
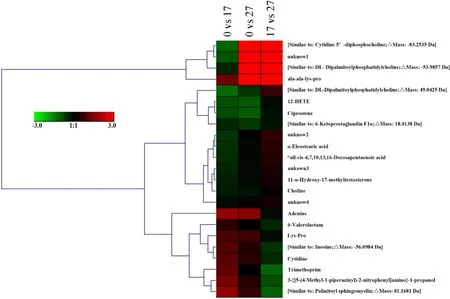
Fig. 4.Heatmap of the responded metabolites detected in gill among three salinity comparisons.
3.5.Validation of the DEGs in RNA-seq datasets
qRT-PCR technique was used to verify the RNA-seq datasets. To evaluate the reliability of the candidate DEG datasets, we randomly selected 10 DEGs in each comparison to quantify gene expression.Among these DEGs, 12 of the 30 DEGs were found significantly differentially expressed (p <0.05) and 27 showed the same regulation trend between two datasets (Supplementary Fig. 1).
4.Discussion
4.1.Molecular investigation of salinity response in gill of GIFT tilapia
Osmo-regulation is critical for survival of tilapia that cultured in brackish or seawater for several months. Our study shows the highest mortality (43%) that associated with salinity 27 concentration and the minimal range of mortality (0–10%) is observed at the salinity from 0 to 17 during three and a half months experiments. Another study observes about 50% of the test tilapia die at 24 ppt and the minimal range of mortality (3.7%–19.5%) at the salinity from 6 to 16 (El-Leithy et al.,2019). However, forO. mossambicus, salinity tolerance is zero mortality to all salinity concentrations up to 25 and 100% mortality at 35 (Fitwi,2003). In a previous study on the intestinal transcriptome ofO. mossambicusandO. niloticus, gene expression patterns showed differentiated change in response to salinity between species (Ronkin et al., 2015). These preliminary data in tilapia shows increased mortality that associated with increased salinity concentration and there are differential adaptation of salinity among populations and species.
In brackish aquaculture of Nile tilapia, the mechanisms underlying salinity challenge are getting increasing attention. Knowledge on the tilapias’ response to long term salinity challenge at the gene expression level is important for selection and functional study of tilapia. In both red tilapia and Nile tilapia (Gu, Jiang, et al., 2018; Jiang et al., 2019), a major QTL region that associated with salinity tolerance has been identified on chrLG18. The enhancer of polycomb homolog 1 (EPC1)(Gu, Lin, & Xia, 2018) and DNA polymerase delta subunit 3 (POLD3)genes (Gu, Li, et al., 2018) are observed within the QTL interval. In Nile tilapia, the transcriptomic responses in hepatopancreas (Xu et al., 2015),spleen and head kidney (Xu et al., 2018), brain (Liu et al., 2018) and skin(Qin et al., 2020) of the Nile tilapia lines have been investigated in response to salinity challenge using RNA-seq recently. The transcriptomes of gill in hybrid tilapia (O. mossambicus♀ ×O. urolepis hornorum♂) under salinity stress (25) after 24 h of treatment have been investigated (Su et al., 2020). These studies provide a global overview of gene expression patterns and pathways that related to osmo-regulation in tilapia. However, little information on stress response of gill in Nile tilapia under a long-term salinity challenge is available.
In our study, we identify 1164 DEGs in the salinity comparison 0 vs 17, including 626 up-regulated DEGs and 538 down-regulated DEGs,and 910 DEGs in the comparison 0 vs 27 which included 415 upregulated DEGs and 495 down-regulated DEGs. These numbers are not quite different from other data reported in tilapia. For example, 772 and 502 genes are annotated for significantly different expression in the spleen and head kidney, respectively (Xu et al., 2018). In the brain of Nile tilapia under long-term hypersaline stress (Liu et al., 2018), 391 genes are expressed differently in the salinity treatment. In the transcriptomes of gill in hybrid tilapia under salinity stress (25), a total of 1958 up-regulated and 1824 down-regulated genes (p <0.05) are identified in the salt stress, compared with those in the control group (Su et al., 2020).
The DEGs obtained in this study are in accordance with previous knowledge on tilapia. In the DEG dataset, we observe some of the typical genes involved in osmo-regulation, including calcium/calmodulindependent protein kinase (CaM kinase) II beta 1 (camk2b1),Aquaporin 3 (AQP3), Potassium channel subfamily K member (kcnk1b),chloride channel 2 (CLCN2), Solute Carrier Family 12 Member 8(SLC12A8), Solute Carrier Family 12 Member 2 (SLC12A2; NKCC1),Na+/K+ATPase (ATP1A1). Previous studies on teleosts have revealed ATP1A1 (Armesto et al., 2014; Wong et al., 2016), NKCC1 (Tipsmark et al., 2002), CAMK2, AQP1, SLC4A4/NBC1, CLCN2, SLC12A2/NKCC1 showing significant responses to salinity challenges (Su et al., 2020).The interaction of CaM with Ca2+resulted in Ca2+/CaM complexes which are reported to modulate downstream targets such as protein kinase, phosphatases, ion channel and ion pump activities (Clapham,2007). The Ca2+/CaM–dependent protein kinase II (CaM-KII) is a ubiquitous second messenger highly expressed in neurons and mediates many diverse physiological processes in response to increases in intracellular Ca2+(Reeves et al., 2005). Aquaporins (AQPs) are commonly known as cell membrane water channel proteins with various isoforms.In the gill, numerous studies suggested that AQP3 expression was elevated to hypo-osmotic challenge in European eel (Cutler & Cramb,2002), silver sea bream (Sparus sarba) (Deane & Woo, 2006), and Atlantic salmon (Salmo salar) (Tipsmark et al., 2010). Chloride channel 2 belongs to chloride channel proteins family which are mainly distributed in cell endomembrane systems mediating the uptake and transport of anions (Liu et al., 2020) and was involved in a wide variety of biological functions, e.g., the stabilization of cell membrane, maintenance of intracellular pH, and regulation of cell volume (Gururaja Rao et al.,2020).
Pathway over-representation analysis of the DEGs in the comparison 0 vs 17 and 0 vs 27 indicates many biosynthesis, energy or metabolism related pathways were over-represented, such as Synthesis of UDP-N-acetyl-glucosamine, Synthesis of substrates in N-glycan biosynthesis,Biosynthesis of DPAn-3 SPMs, Metabolism of lipids and Gluconeogenesis. This data is in accordance with previous reports, e.g., Energy and metabolism related pathways (Glycolysis/Gluconeogenesis and Methane metabolism) are over-represented in the spleen and head kidney, respectively (Xu et al., 2018). The over-representation of the pathway Glycolysis/Gluconeogenesis is observed in many stress-related studies (Su et al., 2020; Xu et al., 2018). In addition, pathways containing proteins with transporting functions, e.g., SLC-mediated transmembrane transport, are also affected. InDanio rerio, SLC-mediated transmembrane transport participates in transport of inorganic cations/anions, amino acids/oligopeptides, bile salts and organic acids,metal ions, amine compounds, vitamins, nucleosides, and related molecules (http://www.reactome.org/content/detail/R-DRE-425407). In euryhaline fishes, gills are highly oxidative tissues and sufficiently and timely modulate various ion transporters and enzymes responding to fluctuating salinities, which are highly energy consuming (Lee et al.,2003; Lin et al., 2004). Furthermore, the analysis of the DEGs in the comparison ppt 17vs27 also shows metabolism and energy related pathways are over-represented, e.g., Gluconeogenesis, Glucose metabolism, Metabolism of carbohydrates and Metabolism of lipids. This suggests there is a salinity-dependent increased expression of most of the metabolism and energy related genes, since energy supply is a prerequisite for the operation of iono- and osmoregulatory mechanisms in fish.This study highlights the expression difference of genes and energy metabolism in response to different salinity concentration.
4.2.Differentiated responded metabolites in gill under salinity challenge
Most of the salinity challenge studies in tilapia are carried out at the gene or transcriptomic level. Metabolomic analysis may be helpful in the exploration of the molecular mechanism underlying the regulation of in tilapia exposed to high salinity. Currently, only limited metabolomic works were reported on the stress responses in tilapia, e.g.,Edwardsiella tardainfection (Zeng et al., 2017), acute ammonia (Zhu et al., 2019) andStreptococcus agalactiae(Hua et al., 2020). In this study, totally 23 metabolites are significantly responded in gill under long term salinity challenge. Of which, 11 metabolites including 12-Hydroxyeicosatetraenoic acid (12-HETE) and choline are significantly down-regulated and 8 metabolites including adenine, Lys-Pro, inosine under salinity 17 and 27 challenge are significantly up-regulated. The number of detected differentiated responded metabolites is comparable to previous studies in tilapia. In the liver of Nile tilapia exposed to acute ammonia (Zhu et al., 2019), metabolomics analysis detected 31 and 36 metabolites showing significant responses to ammonia-nitrogen stress at 6 hpc and 24 hpc, respectively. In the Nile tilapia maintained under different temperatures (Hua et al., 2020), 27 differentially abundant metabolites identified under challenge ofStreptococcus agalactiae.
Numerous studies have shown most of these metabolites in our study are related to stress response in cells. However, the stress relevance of many metabolites, such as the biologically active small peptides containing the Lys-Pro, is often uncertain due to their rapid proteolytic degradationin vivo. Our study provides an important metabolite database for further exploration of the mechanism in tilapia osmoregulation.
12-HETE is an arachidonic acid metabolite produced in lipoxygenase pathway. Previous studies have shown 12-HETE is stress associated and may be involved into the osmo-regulation in fish. 12-HETE is associated with several oxidative stress-related pathological conditions and mitochondria and oxidative stress (Nazarewicz et al., 2007). 12-HETE mediates diabetes-induced endothelial dysfunction and mitochondrial dysfunction in endothelial cells (Otto et al., 2020). The ability of 12-HETE to modulate the activity of ion channels has been observed in mammals, and clearly this activity is important for osmo-regulation in gill of fish (Bell et al., 1996).
Many evidences have shown that choline plays roles in osmotically stressed cells. Choline and glycine betaine enhance the growth ofStaphylococcus aureusat high osmolarity (i.e., they acted as osmoprotectants). Glycine betaine accumulates to high levels in osmotically stressed cells, and choline is converted to glycine betaine (Graham &Wilkinson, 1992). Osmotically stressedEscherichia colicells synthesize the osmoprotectant glycine betaine by oxidation of choline (Landfald &Strøm, 1986).
Inosine is formed during the breakdown of adenosine. The deamination of adenosine to inosine occurs mainly at high intracellular concentrations of adenosine, which are associated with cellular stress(Kaster et al., 2013). Adenosine is the core of the cell’s energy. Adenosine may exert its protective effects by decreasing the energy demand of the tissue. When ATP is metabolized for energy production due to increased energy demand, adenosine levels increase (Jacobson & Gao,2009). Inosine and adenosine can be used as energy sources byLactobacillus(Rimaux et al., 2011). This is consistent with that found in RNA-seq data since osmo-regulation has an energy cost. Carbohydrate metabolism appears to play a major role in the energy supply for ionoand osmo-regulation. In addition to playing an important role in the energy metabolism of the cell, adenosine accumulates extracellularly in tissues undergoing oxidative or metabolic stress since ATP release is a common response to cell injury or stress. Inosine is prescribed as a therapeutic supplement for nerve injury, inflammation and oxidative stress.
Adenine DNA Methylation N (6)-methyladenine (6 mA), recently discovered in mammalian cells, has been demonstrated in the mouse brain in response to environmental stress (Yao et al., 2017). Adenine may act in a regulatory fashion without having to bind to special sites on the enzymes concerned. Adenine depletion has a direct impact on desiccation stress tolerance in haploid yeast strains (Kokina et al., 2014).Conversion of the adenine nucleotides to adenosine can be realized by 5′-nucleotidase.
Overall, our study identified many energy related differentiated responded metabolites and suggested energy supply related pathways e.g., Mitochondrial function was affected under salinity stress. This finding is consistent with the RNAseq data. In a previous study,metabolomic results have provided strong support for the likely mitochondrial dysfunction after ammonia exposure(Zhu et al., 2019). All these evidences suggested that regulation of energy supply could be one of the most important parts during stress response in tilapia.
4.3.Integrated analysis of metabolomics and transcriptomics under osmotic challenge
Under long-term salinity stress, the gene expression was significantly up or down-regulated. Especially, in the energy supply-related pathways, e.g., Glycolysis and Gluconeogenesis. The expression levels of glucose-6-phosphate isomerase b (GPIb), glyceraldehyde-3-phosphate dehydrogenase (gapdh) and enolase 3 (eno3) in the comparison 0 vs 17, fructose-1,6-bisphosphatase 2 (fbp2), pyruvate kinase L/R (pklr) and lactate dehydrogenase A4 (ldha) in the comparison 0 vs 27 were significantly changed (Fig. 2).
Glycolysis and Gluconeogenesis play vital roles in glucose homeostasis and energy production. gapdh is a glycolytic enzyme involved in pathway of energy and carbon molecule supply. The reduction of gapdh protein may result in preservation of glycolytic pathway enzymes that allow for increased glucose utilization (Baumgarner et al., 2012). ldha is a key protein in the glycolytic pathway, converting pyruvate to lactate,whose oxidation meets the energy requirement in gill when fish are transferred to seawater (Vijayan et al., 1996). High glucose utilization in fed fish probably enhanced the activity of osmoregulatory organs and acclimation to extreme salinities in gilthead sea bream (Sparus auratus)(Polakof et al., 2006). A clear decrease in the capacity for utilizing exogenous glucose, as well as an increase on glycolytic potential was observed in gills in parallel with the increased salinity (Sangiao-Alvarellos et al., 2003).
23 metabolites were detected significantly expressed in this study.We found that some metabolites were reported to be associated with gluconeogenesis in our and previous studies. In the liver of cat fish, some amino acids additionally serve as potential gluconeogenic substrates(Goswami et al., 2004). Organic osmolytes such as betaine are of great importance in regulating inner and outer medullary epithelial cells volume (Gullans et al., 1988). The intracellular betaine content is osmotically regulated by betaine synthesis in rabbit kidney cells (Grunewald et al., 1997). Adenine nucleotide arises in response to server energetic stress induced by eliminating exogenous substrate supply and the accumulation of metabolic by-products, such as lactate (Welsh &Lindinger, 1997). AMP was identified as a switch regulating glycolysis and gluconeogenesis in Trypanosoma (Fernandes et al., 2020). The study addresses the correlation between gluconeogenesis and metabolites, thus providing important basis for further investigation on underlying mechanism in response to salinity challenge.
5.Conclusion
In this study, an integrated analysis of metabolomics and transcriptomics is conducted on gill of Nile tilapia under salinity 17 and 27 challenge. 1164 DEGs in the comparison 0 vs 17 and 910 DEGs in the comparison 0 vs 27 are identified. Many biosynthesis, energy, metabolism or transport-related pathways, e.g., synthesis of UDP-N-acetylglucosamine, GAB1 signalosome, and SLC-mediated transmembrane transport are over-represented. Totally 23 metabolites are significantly differentiated responded under long-term hypersaline stress, such as 11-α-Hydroxy-17-methyltestosterone and α-Eleostearic acid. Four of 23 metabolites are annotated as unknown. Our study provides important DEG and metabolite databases for functional analysis of gill of Nile tilapia under long-term hypersaline stress.
Funding
This work is supported by Special Science and Technology Program of Maoming, Guangdong, China (2019S002004), National Natural Science Foundation of China (No.32072970).
Availability of data and materials
All the read data are available at the DDBJ database (BioProject Accession: PRJDB10880).
Authors’ contributions
JHX, YXJ and ZLY contributed to project conception. HQ, YLL and ZXZ collected the materials. HQ, ZLY, YLL, YXJ and ZXZ conducted the experiments. Data analysis was conducted by: HQ, YXJ and JHX. The manuscript was prepared by HQ, YXJ and JHX. All authors read and approved the final manuscript.
Declaration of competing interest
The corresponding authors declare that there is no conflict of interest in this study.
Acknowledgements
We thank two anonymous reviewers for comments on the manuscript.
Appendix A.Supplementary data
Supplementary data to this article can be found online at https://doi.org/10.1016/j.aaf.2021.02.006.
The color scale indicates the expression level of metabolites in each comparison: the higher the expression level is, the darker the color will be. The red represents up-regulation, while the green represents downregulation.
 Aquaculture and Fisheries2022年2期
- Aquaculture and Fisheries的其它文章
- An overview of disruptive technologies for aquaculture
- CRISPR-Cas9 sgRNA design and outcome assessment: Bioinformatics tools and aquaculture applications
- Phenotyping and phenomics in aquaculture breeding
- VNN disease and status of breeding for resistance to NNV in aquaculture
- LAMP for the rapid diagnosis of iridovirus in aquaculture
- Insects as a feed ingredient for fish culture: Status and trends