Upper-Ocean Lateral Heat Transports in the Niño3.4 Region and Their Connection with ENSO
He ZHAO, Tongwen WU, Laurent Z. X. LI, Fanghua WU, Weihua JIE, Xiangwen LIU,Ronghua ZHANG, and Chengjun XIE
1 Chinese Academy of Meteorological Sciences, China Meteorological Administration, Beijing 100081, China
2 College of Earth and Planetary Sciences, University of Chinese Academy of Sciences, Beijing 100049, China
3 Beijing Climate Center, China Meteorological Administration, Beijing 100081, China
4 Laboratoire de Météorologie Dynamique, Centre National de la Recherche Scientifique, Sorbonne Université,Ecole Normale Supérieure, Ecole Polytechnique, Paris 75252, France
5 Key Laboratory of Ocean Circulation and Waves, Institute of Oceanology, and Center for Ocean Mega-Science,Chinese Academy of Sciences, Qingdao 266071, China
6 Center for Excellence in Quaternary Science and Global Change, Chinese Academy of Sciences, Xi’an 710061, China
ABSTRACT In the Niño3.4 region (tropical Pacific, 5°S–5°N, 170°–120°W), sea surface temperature (SST) changes are highly correlated with temperature variations in the upper 40-m layer. This study explores the upper-ocean heat budget in the Niño3.4 region using Ocean Reanalysis System 5 (ORAS5) monthly data from 1979 to 2018, with a focus on ocean heat transports at lateral boundaries in the top 40-m layer and their correlation with temperature variations. In the region, there is a well-defined structure of opposite meridional circulation in the upper and lower parts of the thermocline, characterized by divergence in the upper layer above 40 m and convergence in the lower layer. The change of mean temperature in the upper layer is determined by the sum of zonal, meridional, and vertical heat transports,which, however, tend to largely compensate for each other. In general, part of the surface heat flux from the atmosphere to the ocean and the heat transport from the subsurface ocean are transported out of the domain by meridional and zonal currents, leaving only a tiny part to warm or cool the upper ocean. The amplitude of the net surface heat flux effective for the entire 40-m layer of the ocean is weaker than the lateral heat transport. On an interannual timescale, variations of heat transports in both zonal and meridional are positively correlated with temperature anomalies,while the vertical heat transport from the subsurface ocean is negatively correlated. Composite analyses for five El Niño events and five La Niña events also revealed that there is a positive contribution of horizontal transport convergence to temperature anomalies during the evolution of El Niño (warming) and La Niña (cooling), while vertical transport acts against temperature variations.
Key words: heat budget, lateral heat transport, surface heat flux, Niño3.4 region, El Niño–Southern Oscillation (ENSO)
1. Introduction
The El Niño–Southern Oscillation (ENSO) is the most prominent and energetic signal of interannual climate variability on the planet. It originates in the tropical Pacific but has pronounced influences on the global climate through ocean circulation and atmospheric teleconnections (Alexander et al., 2002; Timmermann et al.,2018). Its impacts on marine and terrestrial ecosystems,water availability, human activities, and even social stability are also detectable (Glantz, 2001; Iizumi et al.,2014; Blunden and Arndt, 2016; Cashin et al., 2017). Accordingly, understanding the physical processes that affect the thermal variability in the upper ocean is important for fully characterizing ENSO, predicting seasonal climate variations, and making projections of future climate change (Feng et al., 2015; Guan and McPhaden,2016; Zhang and Gao, 2016; Palmer et al., 2017; Tseng et al., 2017; Zhang et al., 2020; Bayr et al., 2021). Many studies have explored the driving factors for the thermal variability of the upper ocean, including local wind stress anomalies (Chelton and Xie, 2010; Zhang and McPhaden, 2010; Gao and Zhang, 2017), surface heat flux (Roemmich and Gilson, 2011; Gulev et al., 2013;Roberts et al., 2017), and heat transport (Jin, 1997a, b;Buckley et al., 2015; Ballester et al., 2016; Wang, 2018).Generally, the findings of previous investigations indicate that the ocean above the thermocline is characterized by a fully mixed layer in which the temperature changes uniformly (Dewitte et al., 2013; Lübbecke and McPhaden, 2014; Ballester et al., 2016; Guan and McPhaden, 2016). However, the meridional circulation of the ocean above the thermocline is characterized by divergent poleward transport (from the equator to the subtropics) near the surface and convergent equatorward transport in deeper layer. Recently, researchers have noted the differences in the ocean current distribution between the surface layer and the subsurface layer (Kim et al., 2007; Huang et al., 2012; Hu et al., 2016; Zhao et al., 2020). Some researchers have focused on the shallower upper ocean layer to explore the possible effects of heat transport on temperature changes in the upper ocean(Chatterjee et al., 2017; Warner and Moum, 2019).
By performing heat budget analyses, previous studies have investigated the role played by dynamic processes in the temperature variation of the upper ocean (Liu et al., 2010; Huang et al., 2012; Hu et al., 2016). Among these processes, the spatial integration of local temperature advection has been shown to affect these temperature changes. For example, to study the surface layer heat balance, Wang and McPhaden (2000) calculated the spatial integration of local temperature advection using Tropical Atmosphere Ocean (TAO) buoy observations at four fixed locations (i.e., 165°E and 170°, 140°, and 110°W) and found that the vertical heat transport and zonal heat advection were positively correlated with the temperature tendency, while the adjusted net surface heat flux and meridional heat advection had damping effects on the temperature change. Huang et al. (2012) also used temperature advection based on daily data from the Climate Forecast System and postulated that meridional contributions play an essential role in the development of El Niño. However, Lee et al. (2004) suggested that the spatial integration of local temperature advection reflects the internal redistribution of heat, while lateral heat transport signifies external processes, and thus, the two components are distinct. Lateral heat transport includes two terms: a temperature advection term [-v·∇(ρT)] and an oceanic current divergence term [-T∇(ρv)]. Following Lee et al. (2004), Kim et al. (2007) used the heat transports across regional boundaries to estimate advection and proposed that the surface heat flux opposes temperature change in the mixed layer, whereas horizontal advection and subsurface processes facilitate changes in the Niño3 region. Bowen et al. (2017) used heat transports to investigate the mechanisms responsible for the interannual variability in upper ocean temperatures in the Southwest Pacific and suggested that the air–sea heat flux and ocean heat transport convergence due to ocean dynamics both contribute to the temperature variability therein. More recently, Wu et al. (2019) leveraged heat transports to quantitatively describe the heat content mechanism over the entire depth of the global ocean and found a cooling tendency during El Niño decaying phases due to an opposing surface heat flux anomaly in the tropics.
In the past, few studies have employed the zero-divergence interface as the lower boundary of the upper layer even though doing so entails a tremendous advantage in terms of homogeneity when exploring lateral heat transports. Thus, variations in the lateral heat transports of the upper ocean and their relations with ENSO require more investigation. In this study, we consider the upper ocean layer (the uppermost 40 m) in the Niño3.4 region as a whole pack (or box), for which the volume-averaged temperature is highly associated with the surface temperature and which exhibits a uniform circulation pattern.By performing a heat budget analysis, we obtain the heat transports at different lateral boundaries, where transports are determined by the ocean currents and temperatures at the boundaries. Furthermore, we investigate the seasonal and interannual characteristics of these heat transports and their associations with ENSO. The data and method are introduced in Section 2. The criteria for selecting the upper ocean layer, the seasonal characteristics of heat transports at all boundaries, their relations with temperature anomalies, and their correlation with the package-averaged temperature anomaly are presented in Section 3. Finally, we summarize our findings in Section 4.
2. Analytical framework and data
The budget equation for the ocean heat content (Liu et al., 2010) can be expressed in a general form as

wherevis the three-dimensional velocity vector of the ocean current, ρ is the seawater density,Cpis the specific heat of seawater in the upper ocean [4100 J (kg °C)-1],and the water temperatureTis in degrees Celsius. Here,FForcis the external forcing, which is the downward heat flux from the atmosphere, and the residual termRincludes heat diffusion and sub-grid-scale processes.
For the upper-ocean in the Niño3.4 region, the volume average of Eq. (1) can be expanded as∭dxdydz

whereV= , and the left-hand side (LHS) of Eq.(2) represents the change in ocean heat over time per unit volume (W m-3). The first term on the right-hand side(RHS) of Eq. (2) represents the volume-averaged total net heat transport through all surfaces of the closed volume.
The ocean density in the equations mentioned above varies both over time and over the grid, but the magnitude of this variation is miniscule. Comparing the heat transport terms calculated by using a varying density and the regionally averaged density ρ0, as shown in Fig. S1 in the supplementary material, reveals that the difference in the values of the terms does not exceed 1%. Then, Eq.(2) can be approximately expressed as
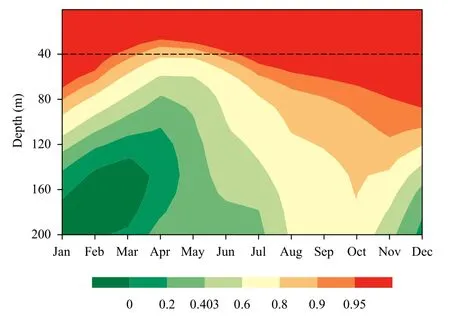
Fig. 1. Temporal correlation coefficients as a function of the month of the year between the sea surface temperature and the upper ocean temperature in the Niño3.4 region, calculated during 1979–2018 (40 yr). A correlation coefficient is statistically significant at the 99% confidence level when it exceeds 0.403.
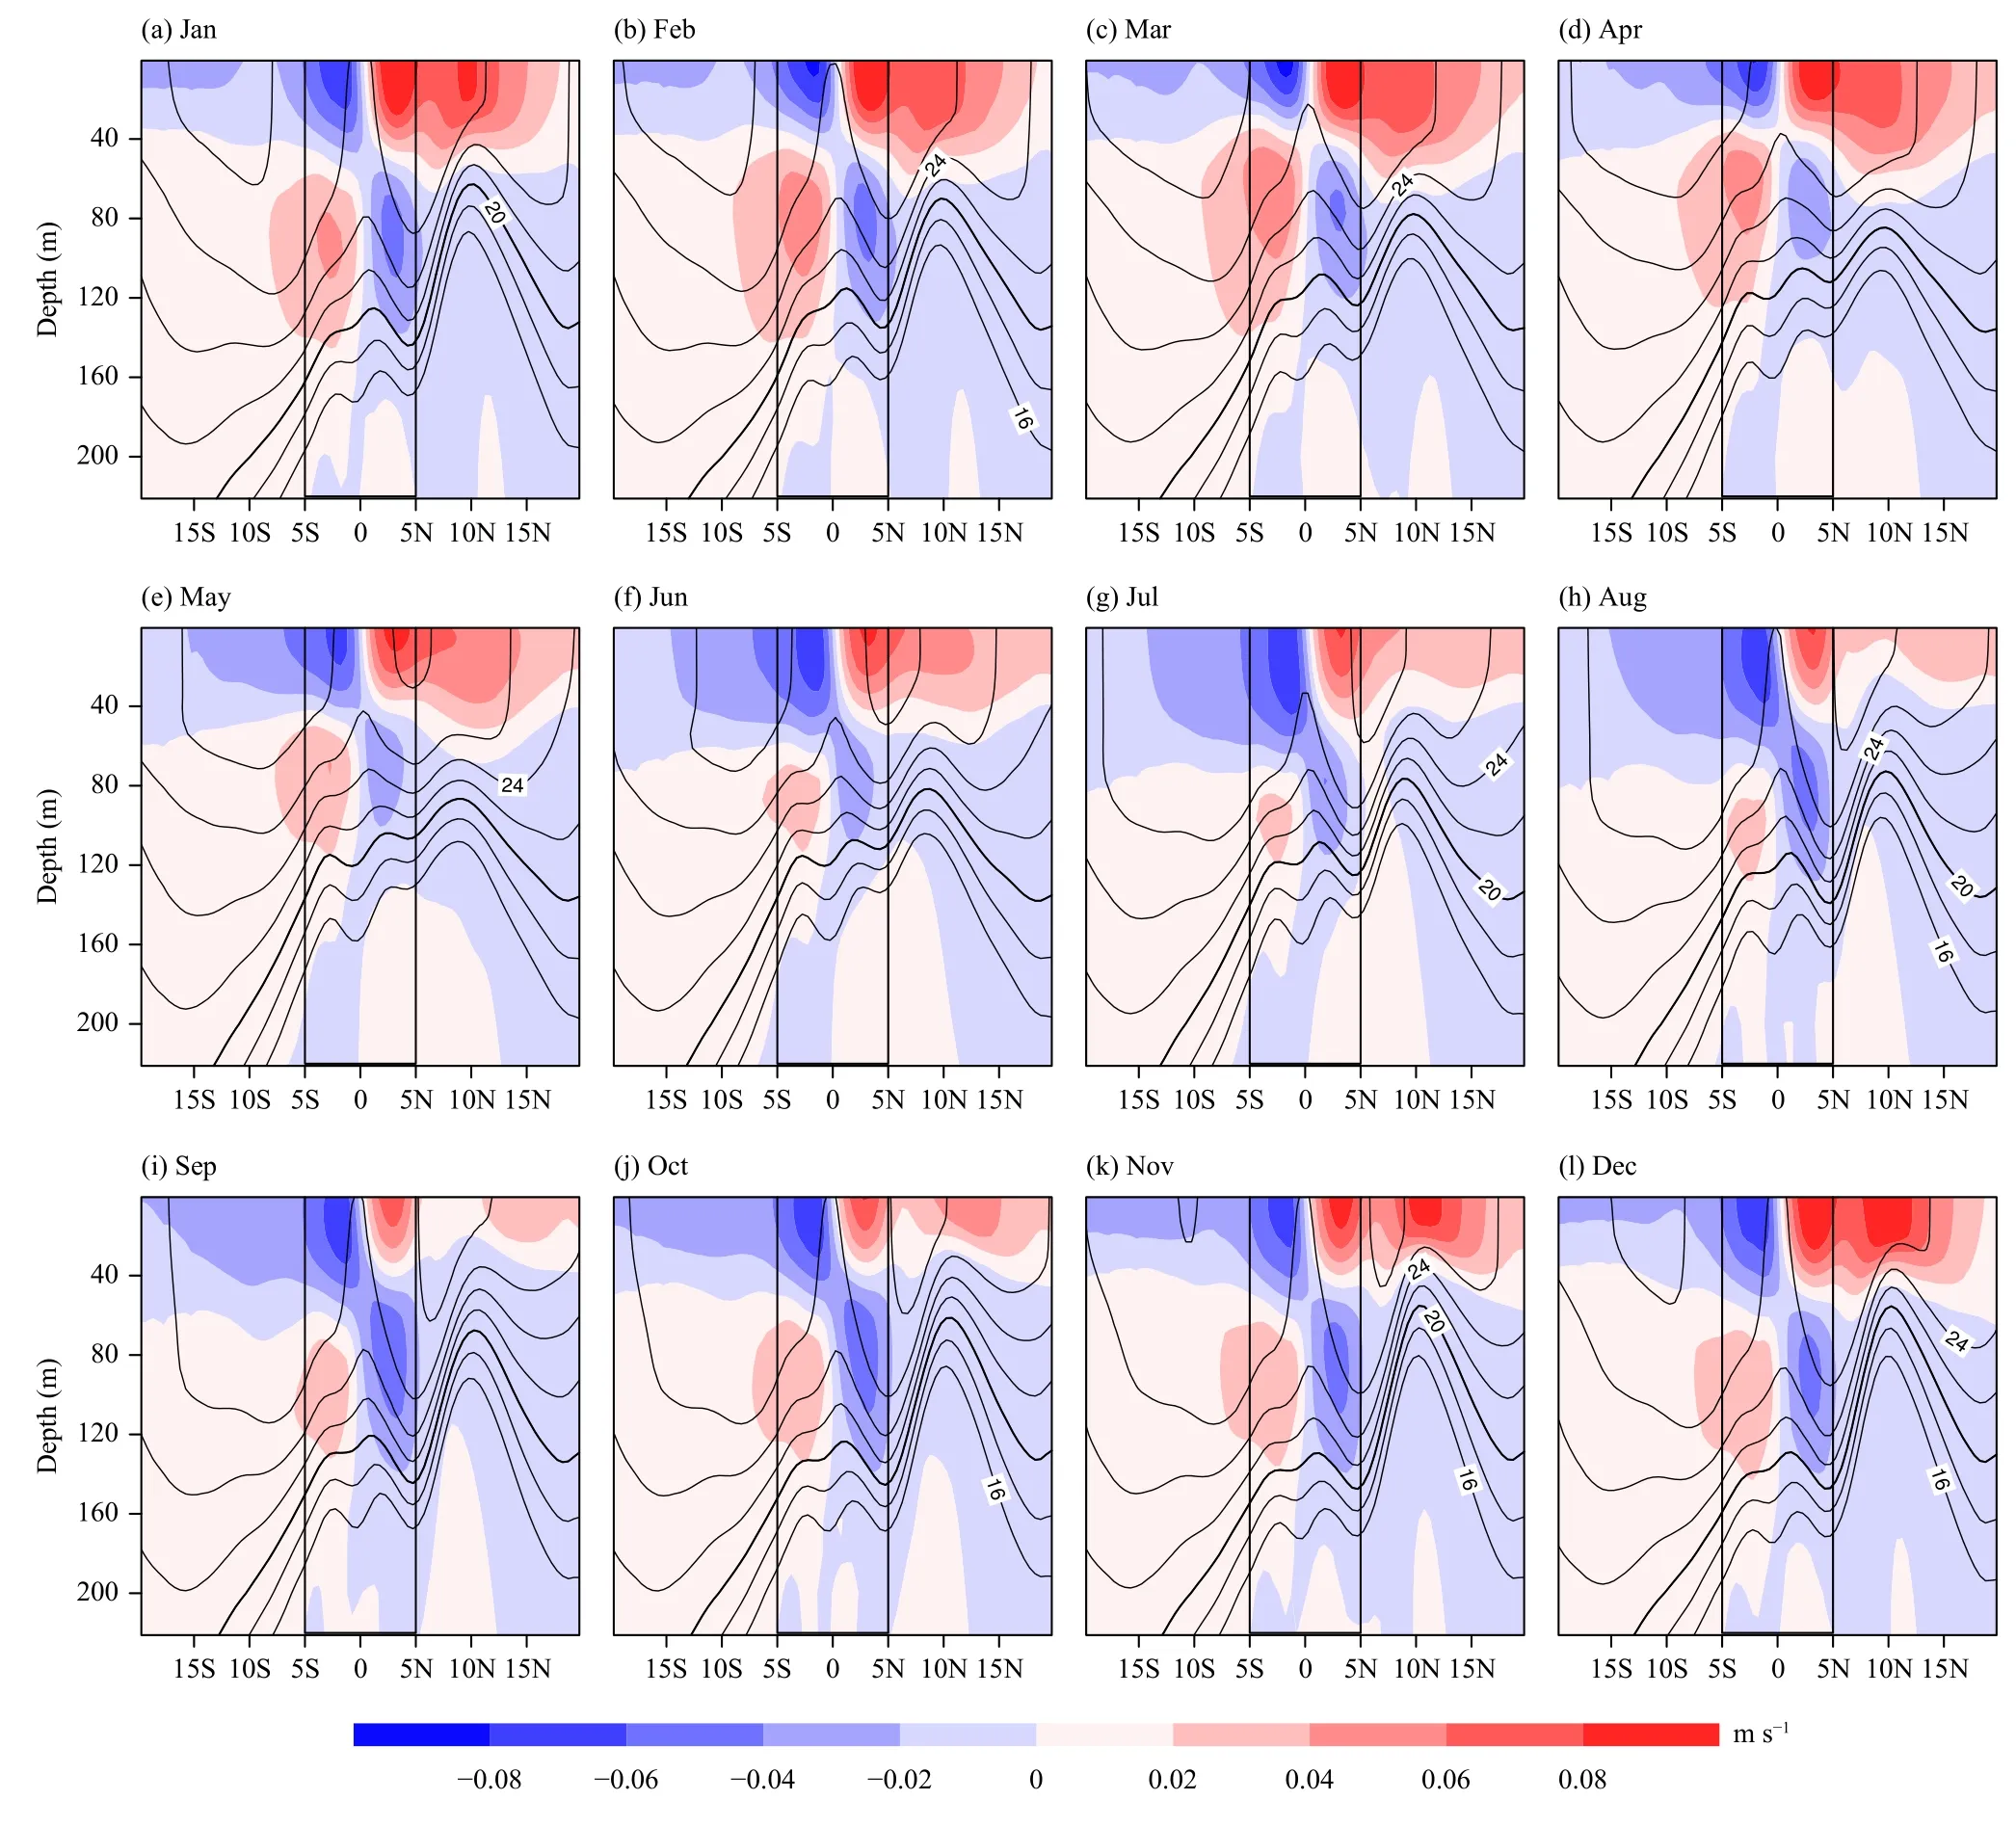
Fig. 2. Latitude–depth cross-sections of the climatological temperature (contour lines; the interval value is 2°C) and meridional current (color shading; m s-1) averaged between 170° and 120°W during 1979–2018. The bold black curves indicate the 20°C isotherm. The vertical black lines denote the southern (5°S) and northern (5°N) boundaries of the Niño3.4 region.

Positive values foru,v, andware assumed to represent eastward, northward, and upward, respectively. Then the first and second terms on the RHS of Eq. (3) can be expressed as
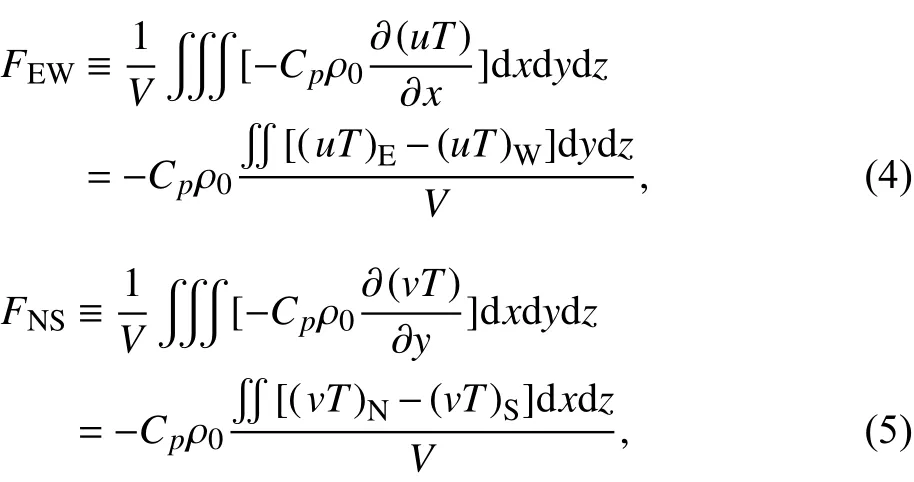
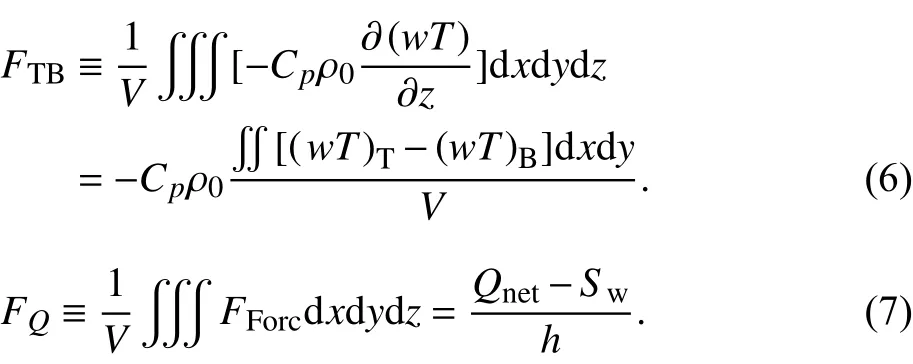
Here,FEW,FNS, andFTBdenote the net heat transport in the zonal, meridional, and vertical directions, respectively. The variables (uT)E, (uT)W, (vT)N, (vT)S, (wT)T,and (wT)Bshow the values ofu·Tat the east and west sides, the values ofv·Tat the north and south sides, and the values ofw·Tat top and bottom boundaries, respectively. The variablesQnetandSware the downward net sea surface heat flux and the penetrating shortwave radiation at the bottom of the upper ocean layer, respectively;his the depth of the upper-ocean. According to the widely used shortwave radiation transfer scheme(Paulson and Simpson, 1977),

whereI0is the net shortwave radiation flux,A1andA2are scale factors, andB1andB2are the depths of penetration, we follow the classification of seawater turbidity by Jerlov (1968) and set the optical properties of seawater as class I (A1= 0.58,A2= 1 -A1= 0.42,B1= 0.35 m, andB2= 23.0 m). For the upper ocean in our study,h= 40 m,and thenSw≈0.07×Qnet. Therefore,
Hereafter, we use the bracketto denote the threedimensional average over the upper-ocean layer in the Niño3.4 region. Then, Eq. (3) can be simplified as

where the residual term 〈R〉, which includes turbulent transport, heat conduction, and other sub-grid processes,has a very small contribution to the variation in 〈T〉 and can be neglected. The average heat tendency is mainly determined by the net heat transports in the zonal, meridional, and vertical directions and the net surface heat flux. Equation (9) can be rewritten as
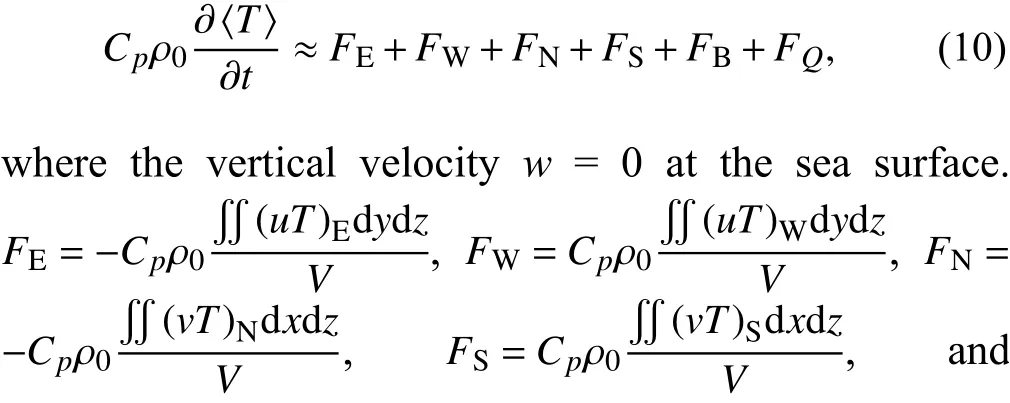
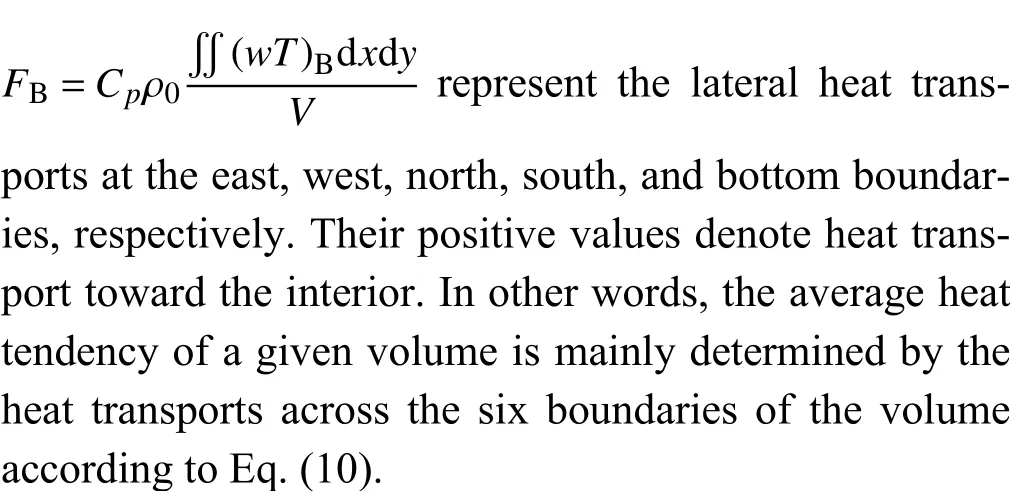
Equation (10) differs from Eq. (11), which has generally been used in previous studies (e.g., Huang et al.,2012; Graham et al., 2014; Ballester et al., 2016),

Equation (11) can be deduced from Eq. (3) which is decomposed as,
assuming that ocean water is an incompressible liquid[∇ (ρv)=0].
Equation (10) can be used to analyze the effect of large-scale currents outside the region on the mean temperature change, as the heat transports from different directions are independent of its inside temperature.However, Eq. (11) ignores the effect of the divergence term and makes all advection terms dependent on not only the temperature and ocean current inside the region but also those outside the region. Lee et al. (2004) pointed out that the spatial integration of local temperature advection in Eq. (11) can only reflect the internal redistribution of heat and cannot explain external processes that control the heat content of a domain.
The primary data used in this study are monthly temperature, zonal and meridional currents, net surface heat flux, and salinity from 1979 to 2018 with a horizontal resolution of 0.25° and 75 levels in the vertical direction.The data are produced by the Ocean Reanalysis System 5(ORAS5; Zuo et al., 2019) operated at ECMWF with the widely-used Nucleus for European Modelling of the Ocean (NEMO). The vertical discretization is approximately 1 m near the surface, and 24 levels are in the upper 100 m of the ocean. Carton et al. (2019) showed that the simulated ocean temperature and salinity in ORAS5 are nearly free from large-scale errors when compared with observations.
3. Results
3.1 Sea surface temperature (SST) relations with the upper ocean temperature and currents in the Niño3.4 region
Previous studies have typically assumed that the ocean above the thermocline is fully mixed and behaves identically, allowing them to focus on the thermocline depth (Jin et al., 2006; Dewitte et al., 2013; Graham et al., 2014; Ballester et al., 2016). However, the distributions of ocean currents and temperature on either side of the thermocline (in the upper and lower layers) exhibit different characteristics. Figure 1 shows the correlation coefficient between the SST and the vertical temperature profile of the upper 200 m in the Niño3.4 region(5°S–5°N, 170°–120°W). The positive correlation decreases with depth but remains high (> 0.80) above 40 m throughout the year. The highly uniform upper ocean layer shows obvious seasonality with regard to its depth, being the shallowest in April and May and the deepest in November and December.
The thickness of the upper ocean layer is strongly related to ocean dynamics with a high correlation coefficient. The color shading in Fig. 2 signifies the climatological mean (1979–2018) meridional currents in each month averaged between 170° and 120°W. In the tropical zone from 5°S to 5°N, the meridional circulation is characterized by poleward divergent transport from the equator to the subtropics in the upper ocean but equatorward convergent transport in the deeper layer. The depth of the zero-divergence interface is approximately at 40 m in most months. The thermocline, shown as the thick black line in Fig. 2, is extensively used in ongoing research and is defined as the climatological 20°C isotherm. As depicted in Fig. 2, the distribution of meridional currents has different characteristics in the upper and lower layers across the thermocline: divergent circulation is observed in the upper layer, whereas equatorward convergence is detected in the lower layer. This configuration of nearsurface divergence and subsurface convergence (40–120 m) favors equatorial upwelling at the thermocline, which is visible from the temperature contours in Fig. 2.
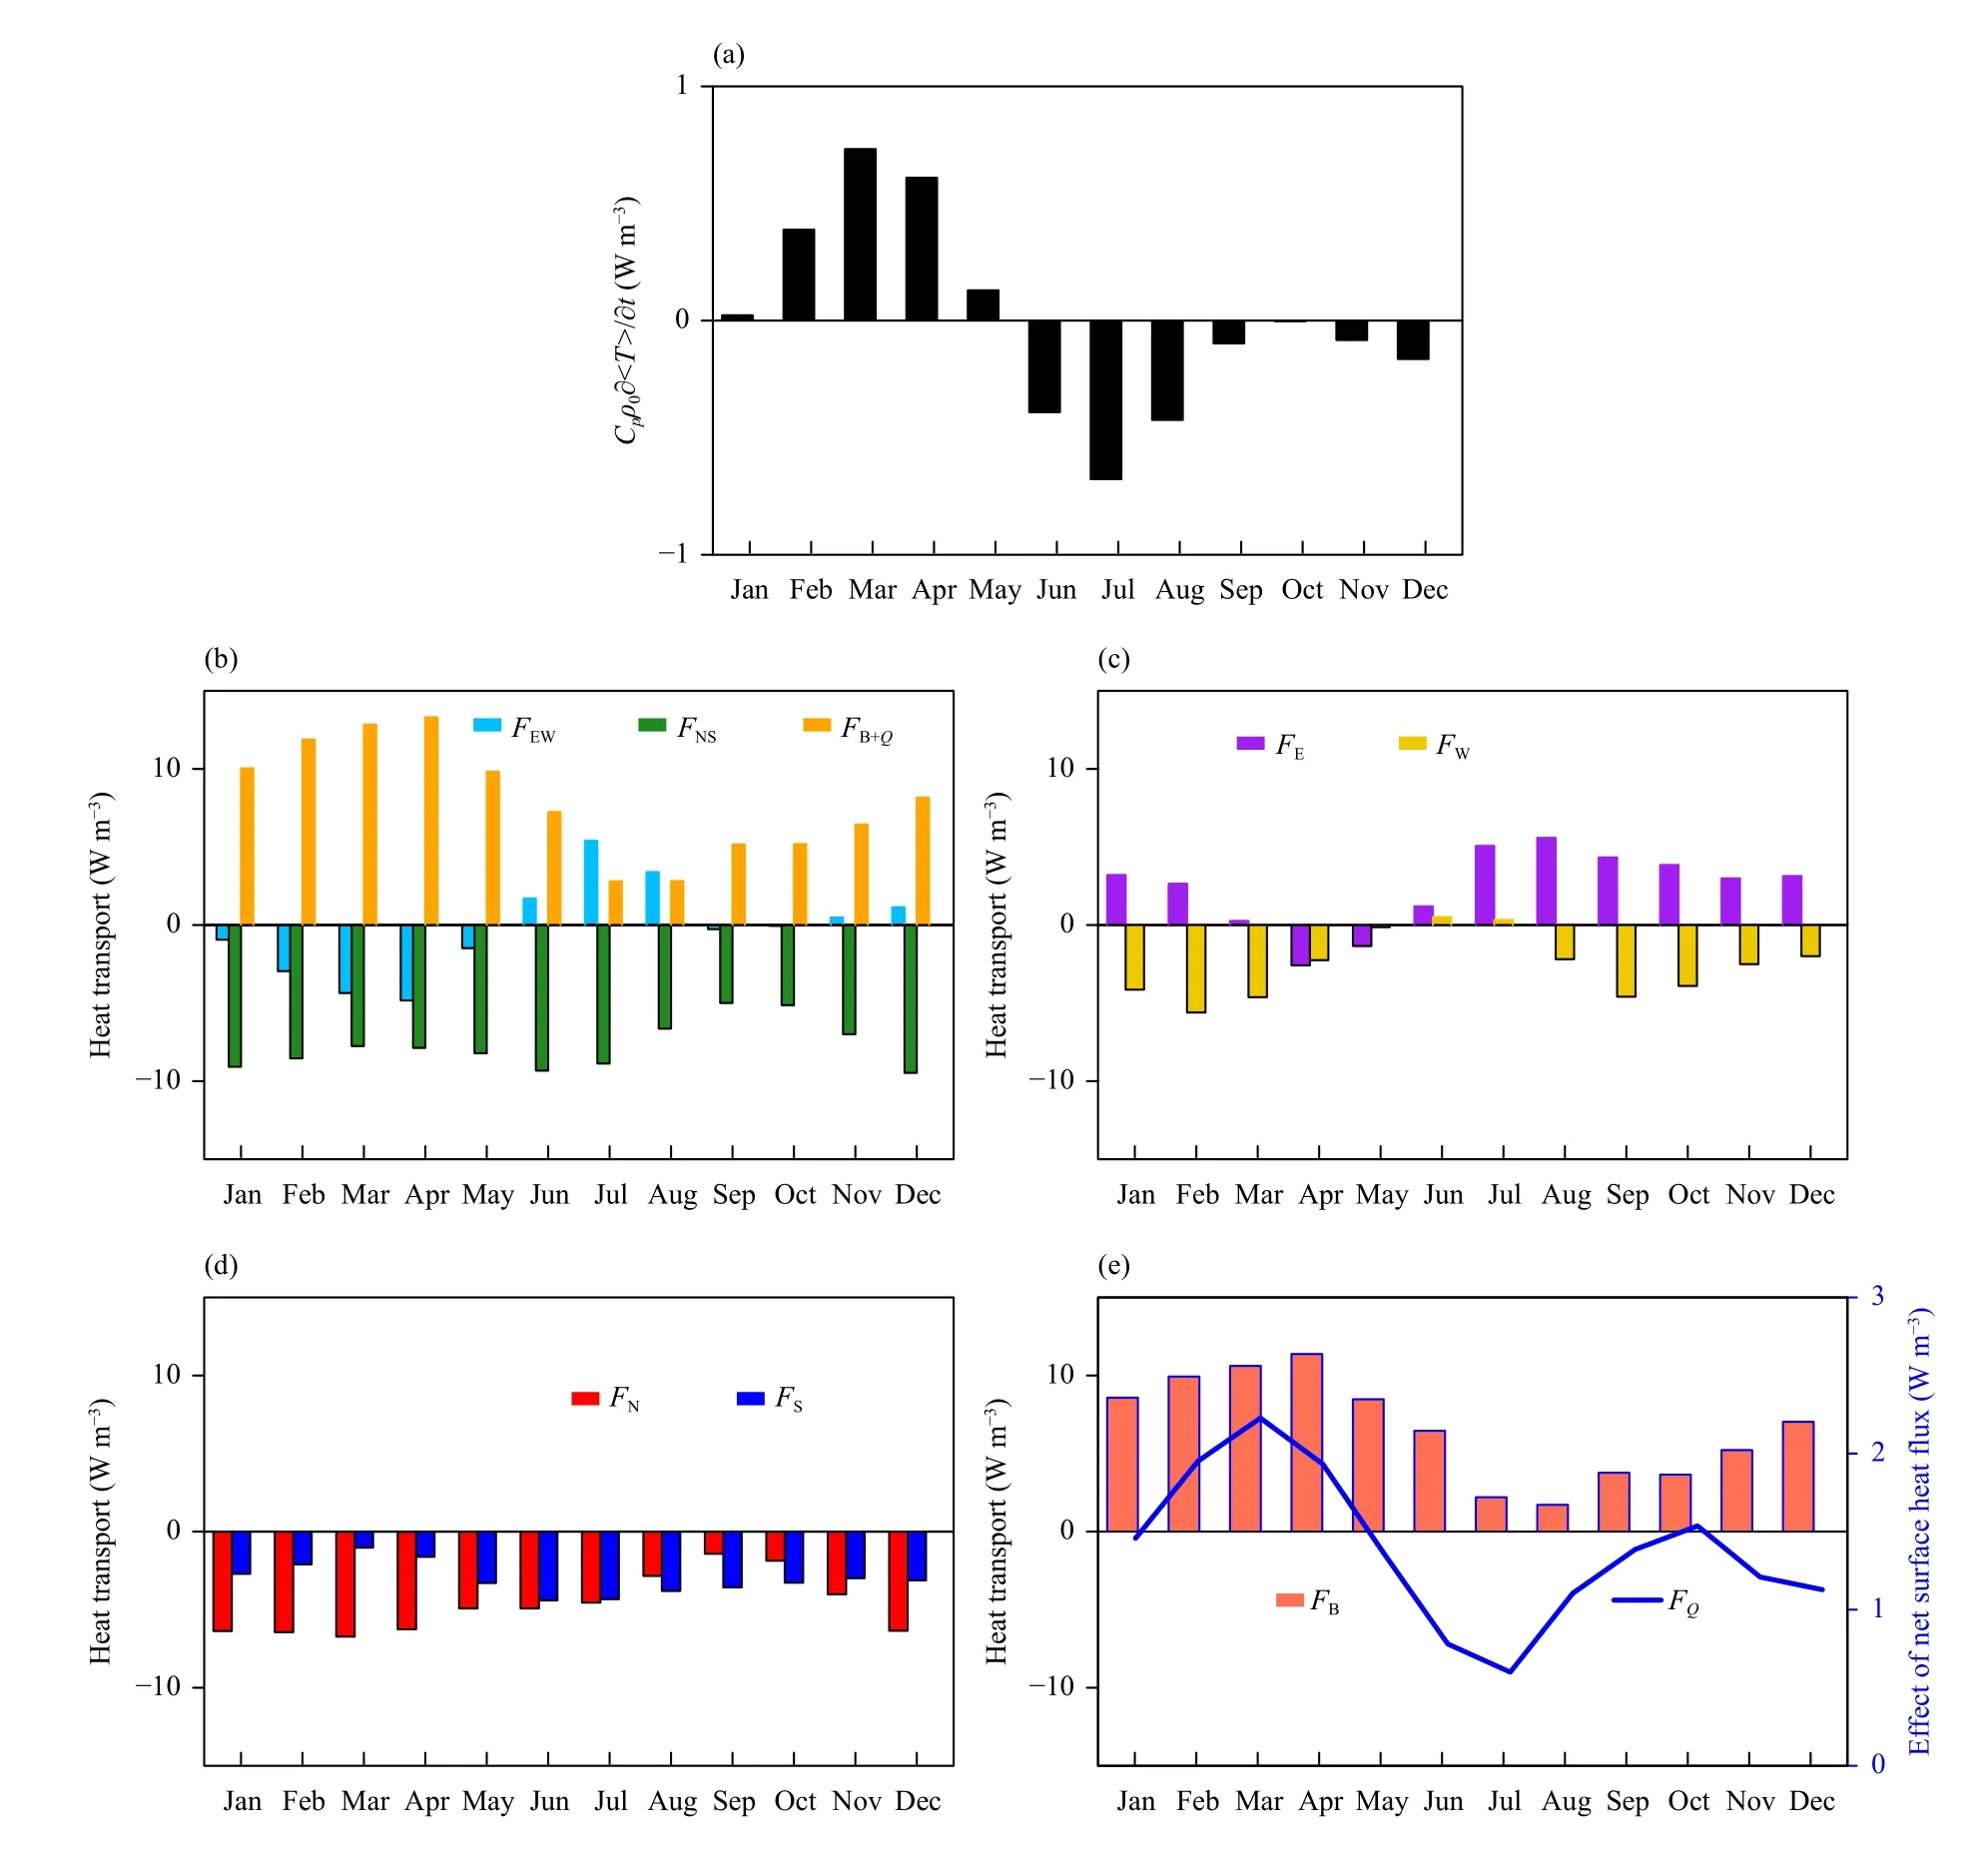
Fig. 3. Climatological mean-field averaged in the Niño3.4 region as a function of the month for the (a) tendency of the volume-averaged heat(Cpρ0∂〈T〉/∂t), (b) net heat transports in three directions, (c) zonal heat transports through the east and west sections, (d) meridional heat transportsthroughthenorth andsouthsections, and(e)vertical heat components.The blue line in(e) represents the area-averaged effect of net downward heatflux atthesea surface(FQ),whichisplottedon the scaleontherightaxis (Wm-3).
Given the temperature profile and the structure of the meridional currents in the vertical direction, we divide the upper ocean layer above the thermocline into two parts based on the annual average boundary separating the meridional convergence from the divergence. The following analysis focuses mainly on the volume-averaged temperature in the upper ocean of the Niño3.4 region, where this temperature is highly related to the average heat content of the 40-m layer (hereafter referred to as the Niño3.4 upper box). The average density ρ0of the box is 1023 kg m-3. In the following section the variation characteristics of the heat transports in this region and their association with temperature changes are explored.
3.2 Effects of heat transports on the upper-ocean temperature variations
Figure 3a shows the climatological seasonal cycle(1979–2018) of the monthly-mean heat tendency per unit volumewhich is positively correlated with the change in the volume-averaged temperature. The water column warms from February to May and cools in other months. The strongest warming and cooling occur in March and July, respectively. May (January) is the transition time from warming to cooling (from cooling to warming). September–January of the following year is the period when the average heat and volume-averaged temperature are almost stationary.
The change in the upper-ocean temperature in the Niño3.4 upper box is determined by the net heat transports in the vertical, zonal, and meridional directions. As shown in Fig. 3, the average monthly heat transports during 1979–2018 show significant seasonal variations. The net meridional heat transport is negative for the entire time (green bar in Fig. 3b), which means that there is continuous outbound heat transport in this direction. The north–south divergence is a consequence of the meridional divergent circulation that is present in the upper ocean throughout the year (Fig. 2). The multiyear-averaged net zonal heat transport is divergent (negative) from February to May, convergent (positive) from June to August, and almost neutral in all other months (cyan bar in Fig. 3b). In terms of zonal heat transport across individual boundaries (Fig. 3c), except for the period from March through May, the heat transport through the east boundary (purple) continuously flows into the box. In contrast,the heat transport through the western boundary (yellow)leaves the region throughout the year, except during June and July. As suggested by Cronin et al. (2000), the flow in the weakly-stratified surface layer is, to a large extent,directly forced by local winds. Under the Pacific westward trade wind forcing, the tropical Pacific is dominated mainly by the North Equatorial Current and South Equatorial Current. This can explain why the climatological zonal heat transport continues to flow out from the Niño3.4 region through the west boundary and into the box through the east side most of the year.
The 40-yr-averaged vertical net heat transport (FB+Q=FB+FQin Fig. 3b), including the external forcing from the sea surface (FQ) and upward heat transport from the bottom (FB), is characterized by positive values throughout the year, indicating continuous vertical heat transport flowing into the Niño3.4 upper box from the top and bottom boundaries. As shown in Fig. 3e, the vertical net heat transport is dominated by upward heat transport through the bottom border at the depth of 40 m.
In our study, the vertical heat transport (FB) in Eq.(10) representing oceanic upwelling apparently acts as a warming term, which seems contradictory to the general view that oceanic upwelling induces a cooling effect in the upper ocean. In fact, the contradiction is only an apparent one and the reconciliation resides in the fact that the vertical heat transport actually includes two parts,expressed as the vertical divergence termand the vertical temperature advection termin Eq. (12). The upper ocean temperature decreases as the depth increases, which implies the advection termIn other words, oceanic upwelling exerts a cooling effect on the upper ocean temperature.However, there is no water flux passing through the sea surface, that is,, which implies that the upward heat transport apparently accumulates in the upper layer and causes apparent warming. We use SODA3(Simple Ocean Data Assimilation; Carton et al., 2018)reanalysis data to estimate the values of divergence and advection terms and find that
can reach 15 W m-3(warming) which is remarkably larger than the value of -1 W m-3(cooling) caused by(Fig. S2 in supplementary material).
The annual variation in the net surface heat flux is correlated with that of the upper ocean heat tendency, both of which exhibit a semiannual cycle (Fig. 3e). Likewise,the annual variations of the vertical and meridional net heat transports and the heat transport through the west and south boundaries also show semiannual characteristics. This semiannual feature is likely linked to the variation in solar radiation. As a whole, the downward net heat flux at the surface warms the entire 40-m-deep box by less than 2.0 W m-3, which is much smaller than the contributions of heat transports through the other boundaries. As shown in Fig. 4, the net surface heat flux can dominate the average temperature variation in the upper ocean only when the depth of the chosen ocean layer is minimal (shallower than 15 m). Thus, the revised net surface heat flux (minus the penetrating shortwave radiation) is as important as the heat transport terms when the layer depth is shallower than 5 m. Its magnitude decreases sharply as layer depth increases. When the layer depth is approximately at 40 m, the effect of the net surface heat flux is only one-fifth of that of the heat transports across the volume boundaries.
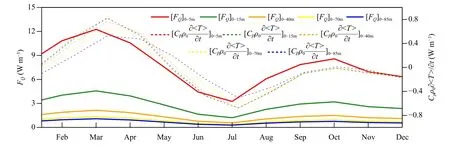
Fig. 4. Climatological monthly mean averaged in the Niño3.4 region for the upper ocean of the net surface heat flux heating (FQ; solid lines)and the tendency of heat (C pρ0∂〈T〉/∂t; dashed lines, plotted on the scale on the right axis). The results are shown for different depths (0–5, 0–15,0–40, 0–70, and 0–85 m).
Comparing theFEW,FNS, andFB+Qterms in Fig. 3b indicates that the mean annual accumulation of heat is due mainly to the input of the net vertical heat transport and the heat outputs along the horizontal boundaries. We also note that the net heat transports in the vertical, zonal,and meridional directions may result in ocean heat content changes up to ±10 W m-3(in Fig. 3b), which is larger than the actual changes in the ocean heat content(shown in Fig. 3a). Thus, most of the incoming heat transport from the atmosphere and the deeper ocean is directly transferred outside the domain by horizontal heat transport. As a result, the heat transport components in different directions compensate for each other, leaving only a small portion of the incoming heat transport to participate in the average temperature changes.
3.3 Associations of upper ocean temperature interannual variation with lateral heat transports
How is the volume-averaged temperature anomaly connected to heat transport anomalies in different directions? Figure 5 depicts the interannual correlation coefficients between anomalies of the volume-averaged temperature in the Niño3.4 upper box and the net heat transport in three directions (F'EW,F'NS, andF'B+Q, with the mean seasonal cycle during 1979–2018 removed) for each month of the year. Unlike the contributions of the multiyear-averaged heat transports, in most months of the year, the volume-averaged temperature anomaly is positively correlated with the horizontal net heat transport anomalies but negatively correlated with the net heat transport through the surface and the 40-m-deep bottom boundary. In an abnormally warm year, for example,positive anomalies of the net horizontal heat transports are observed, indicating that more heat accumulates in this area. Surface zonal currents are known to be affected by wind in the tropical Pacific. Affected by abnormal trade winds, the eastward zonal heat transport anomaly brings abnormal heat from the western Pacific into the Niño3.4 upper box, resulting in the accumulation of heat therein. Therefore, as shown in Fig. 5, the zonal net heat transport favors the interannual variation in the average temperature anomaly most of the year, except during May, June, and November.
In addition, the net meridional heat transport is positively correlated with temperature most of the time except in winter. Weakening the poleward meridional heat transport divergence from the equator to the subtropics favors heat accumulation in the Niño3.4 upper box and results in a positive temperature anomaly. However, a weakening of the horizontal divergence must be accompanied by the weakening of the vertical upward currents.Therefore, as shown in Fig. 5, the vertical heat transport anomaly is negatively correlated with the temperature anomaly. Interestingly, the net surface heat flux anomaly is negatively correlated with the average temperature anomaly (black line), which means that a warm (cold) temperature anomaly is accompanied by strong (weak) heat loss from the sea surface. The damping effect of the net surface heat flux on changes in the heat content within the volume is consistent with the findings of Zhang et al.(2007), which were simulated by the NCEP coupled model, and Wu et al. (2019) who used Estimating the Circulation and Climate of the Ocean (ECCOv4) reanalysis data. The net surface heat flux is known to be composed of net longwave radiation, net shortwave radiation,sensible heat, and latent heat; except for the net surface shortwave radiation, the other three components follow the change in the average temperature and release extra energy when the surface layer is anomalously warm(Roemmich and Gilson, 2011; Chatterjee et al., 2017),leading to a negative effect on the temperature anomaly.
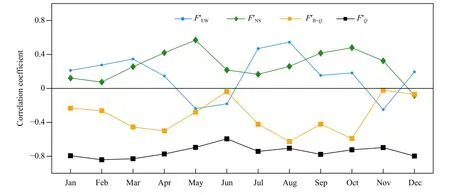
Fig. 5. Correlation coefficients as a function of 12 months calculated between the mean temperature anomaly and three-direction net heat transport terms and net surface heat flux in the Niño3.4 region. A correlation coefficient of 0.31 is statistically significant at the 95% confidence level.
3.4 Upper-ocean lateral heat transport anomalies in typical ENSO years
To further explore the role that heat transport plays during the typical evolution of El Niño and La Niña events, we conduct a composite analysis assembling some recently observed La Niña and El Niño events.Monthly composites covering 2-yr ENSO evolution episodes are computed for the temperature anomaly and heat transport anomalies using data spanning 1991–1992,1997–1998, 2002–2003, 2009–2010, and 2015–2016 for El Niño events and 1988–1989, 1998–1999, 1999–2000,2007–2008, and 2010–2011 for La Niña events (http://ggweather.com/enso/oni.htm), respectively.
The composite time series of anomalous heat transports and the Niño3.4 index are shown in Figs. 6 and 7.For both El Niño and La Niña events, the net heat transports in the west–east and north–south directions are the sources of temperature anomalies, but the vertical heat transport at the bottom offsets the horizontal transport anomaly effects. When the temperature anomaly is first generated (from April to June in the first year), the meridional term makes an important positive contribution.Subsequently, during the development and decay stages,the zonal and meridional net heat transports dominate the temperature anomaly variation. Furthermore, the zonal net heat transport (blue bar in Fig. 6a) during the warm temperature phase is mainly due to the heat transport anomaly from the west side (yellow bar in Fig. 6b), while the heat transport through the east boundary has an opposite contribution to the out-of-phase anomalies and offsets the effect of the west side. The heat transport across the west (east) boundary exhibits a positive (negative)anomaly during ENSO development and becomes negative (positive) when the temperature anomaly tendency becomes negative (positive). In the meridional direction,the net heat transport anomaly is attributed to both north and south heat transport anomalies during the development of ENSO events. The vertical component is determined by the net surface heat flux anomaly and the heat transport anomaly through the bottom of the Niño3.4 upper box. Huang et al. (2012) also identified the abnormal downward transport during the entire evolutionary cycle of the El Niño event. In summary, during the warmer(cooler) phase, the horizontal transport anomalies are positive (negative), so the Niño3.4 upper box gains(loses) heat, thereby warming (cooling) the water column, while the vertical heat transport anomaly is negative (positive), facilitating less (more) upwelling heat transport.
Some previous studies (e.g., Graham et al., 2014; Jin et al., 2020) have suggested that thermocline feedback is one of the largest contributors to SST growth. The relevant argument is that weaker (stronger) upwelling occurs in El Niño (La Niña) years, and causes weaker (stronger)cooling by vertical advection. However, this conception seems to be incomplete. As shown in Fig. 6, the weak upwelling in El Niño years actually causes weak vertical heat accumulation in the upper layer and results in negative anomalous heat transport (orange bars in Fig. 6a).The latter plays a cooling role in temperature anomalies for the upper ocean. The warmer temperature anomalies of the upper ocean in El Niño years mainly result from zonal and meridional heat transport anomalies (blue and green bars in Fig. 6a). Their warming effect exceeds the cooling effect due to the vertical heat transport. The reverse situation occurs in La Niña years.
We further quantify the contributions of heat transport anomalies by analyzing their averages in the developing and decaying phases for El Niño and La Niña events. We define the developing and decaying phases by an increase or a decrease in the averaged Niño3.4 index of the five El Niño (La Niña) events, respectively. The development for the El Niño (La Niña) event starts from the first month when the absolute value of the averaged Niño3.4 index is greater than 0.5 K and continues until the peak appears. The decaying phase starts from the peak of the Niño3.4 index to the end of the event. The evolution of ENSO events is determined by the mutual offset of horizontal and vertical net heat transport anomalies. According to Fig. 8, when the absolute value of the total horizontal net heat transport anomaly is greater than that of the vertical net heat transport anomaly, the ENSO develops. It decays otherwise. Specifically, the sum of the meridional and zonal net heat transports has a positive anomaly in both the developing and decaying phases of El Niño events, which means that the divergence of the net heat transport in the horizontal direction decreases, with its abnormal transports causing heat to accumulate in this region. At the same time, the upwelling heat transport from the bottom is restrained with the heat transport in the vertical direction, displaying a negative anomaly.When La Niña events occur (Fig. 8b), the divergence of the horizontal lateral heat transports in this region is abnormally strong and produces a cooling effect. At the same time, more heat is vertically transported from the deeper ocean to offset the abnormally increased horizontal divergence. Interestingly, the mechanisms for warming processes during the development of El Niño events or the decay of La Niña events are different. The warming tendency during El Niño development is due to the effect of the accumulated abnormal heat transports in the horizontal direction, which is greater than that of the negative abnormal heat transport in the vertical direction.However, for La Niña decay, the increased horizontal outbound transport is completely offset by the increased vertical upward heat transport, resulting in a warming tendency.
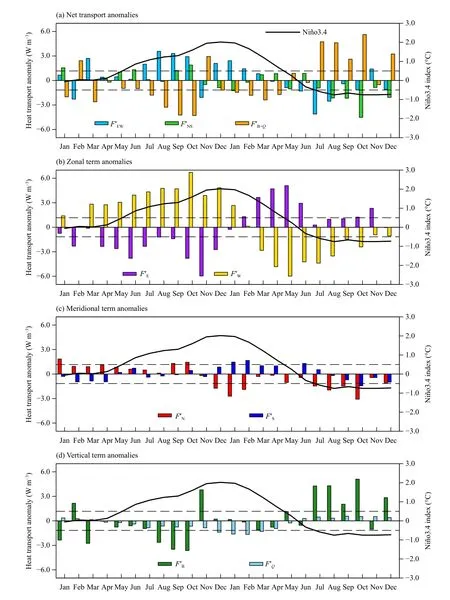
Fig. 6. Time series averaged in the Niño3.4 region for the (a) monthly mean net heat transport anomalies in three directions and individual heat transport anomalies through the (b) zonal, (c) meridional, and (d) vertical boundaries; the results are shown for the five El Niño composites(1991–1992, 1997–1998, 2002–2003, 2009–2010, and 2015–2016). The thick black line denotes the sea surface temperature anomalies (°C) averaged over the Niño3.4 region. The climatological mean is the average during 1979–2018.
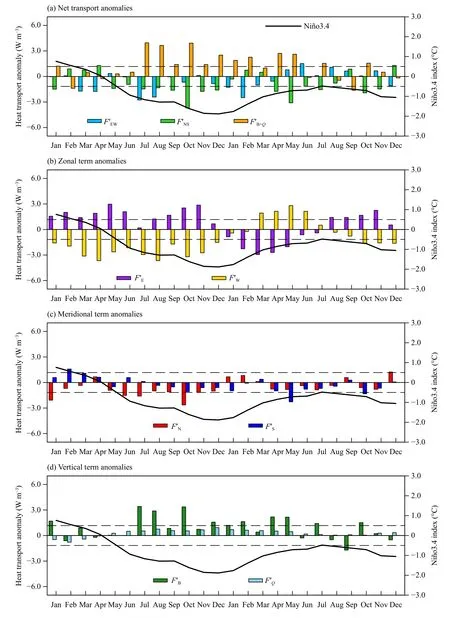
Fig. 7. As in Fig. 6, but for the composite of five La Niña events (1988–1989, 1998–1999, 1999–2000, 2007–2008, and 2010–2011).
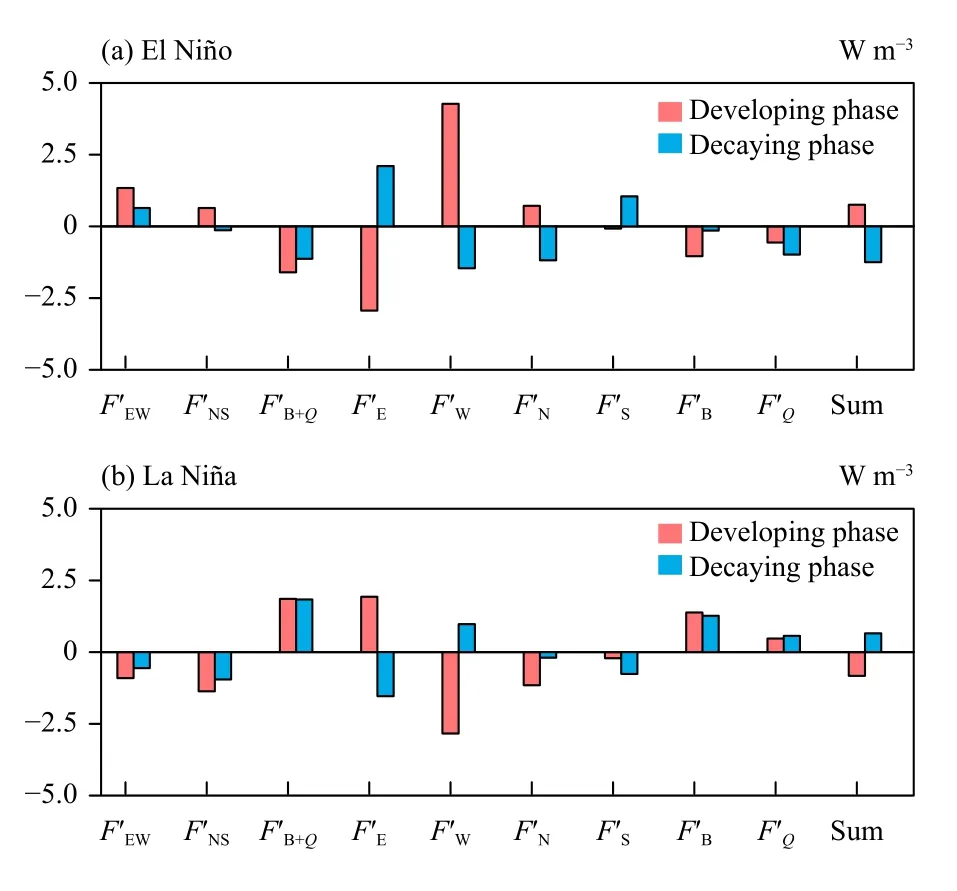
Fig. 8. Averaged net heat transport anomalies in three directions(F'EW, F'NS, and F'B+Q) and heat transport anomalies across individual boundaries (F'E, F'W, F'N, F'S, F'B, and F'Q) during the developing phase (red) and decaying phase (blue) of the composite of the (a) five El Niño events in Fig. 6 and (b) five La Niña events in Fig. 7. The climatological mean is the average during 1979–2018.
The average abnormal heat transport at individual boundaries shows that the warming process in the Niño3.4 region (El Niño development stage and La Niña recession stage) is often accompanied by additional heat transport into the region from the west and anomalously high heat transport out of the region toward the east. In other words, the warming process is often accompanied by an eastward anomaly of the zonal ocean current. In contrast, in the cooling process (El Niño recession stage and La Niña development stage), the opposite situation occurs. Moreover, the anomalies of the two heat transport terms in the vertical direction are opposite to the average temperature anomaly at all times. Additionally, the positive temperature anomaly in the Niño3.4 region is accompanied by reduced transport associated with vertical upwelling at the bottom, with more energy escaping from the surface layer into the atmosphere.
4. Summary and discussion
With the ORAS5 reanalysis product covering 40 yr from 1979 to 2018, the main features of the oceanic heat transports and their association with the upper ocean temperature anomalies in the Niño3.4 region were investigated. In the Niño3.4 region, the distributions of the meridional current are different in the upper 40-m layer and the layer between 40 m and the thermocline depth; these distributions manifest as poleward divergence in the upper 40-m layer and equatorward convergence in the deeper layer. This region is also strongly marked by a high correlation between the SST and the water column temperature of the top 40 m, which motivated us to take the divergent layer as a whole box (0–40 m; 5°S–5°N,170°–120°W). By performing heat budget analysis, we illustrated the lateral heat transport effects, which are independent of the average temperature in the Niño3.4 upper box, and then examined their climatological state and association with the average temperature anomaly in the Niño3.4 region. Furthermore, we explored how these heat transport anomalies change when ENSO events occur.
The climatological mean temperature change was determined by the upwelling-related heat transport at the bottom of the upper 40-m layer and the horizontal heat transport divergence. Most of the incoming heat is transported from the deeper ocean and the surface is directly transferred out of the Niño3.4 domain by horizontal heat transport, leaving only a residual portion to effectively heat or cool the upper ocean. Moreover, the heating effect of the net surface heat flux on the mean temperature in the upper ocean is much weaker than that of the heat transport through the other boundaries. The interannual correlation coefficients between the temperature anomaly and the heat transport anomalies in different months were also calculated, demonstrating that the zonal and meridional net heat transports generally have positive contributions to the interannual change in temperature.When positive anomalies of the horizontal heat transports appear, they result in abnormal heat accumulation in the Niño3.4 region and give rise to a positive temperature anomaly. The net vertical heat transport offsets the positive anomaly of the horizontal net heat transports and is negatively correlated with the temperature anomaly. A composite analysis for five El Niño events and five La Niña events showed that the meridional net heat transport is critical when the temperature anomaly starts to appear. During the development and decay of ENSO events, zonal and meridional net heat transports play positive roles in balancing the negative effect due to the vertical heat transport anomaly; the development and decay of ENSO events are determined by the mutual offset of horizontal and vertical net heat transport anomalies. In contrast, the net surface heat flux plays a negative role by removing anomalous heat. We believe that clarifying the important roles played by the lateral heat transports of all directions in affecting the temperature anomaly can help to further understand ENSO.
To assess the robustness of the results, we used the same method to analyze SODA version 3 reanalysis for 1980–2015 and GECCO (German contribution to the Estimating the Circulation and Climate of the Ocean project; Köhl, 2020) version 3 reanalysis for 1948–2018,and we obtained similar conclusions (see Figs. S3–S8 in supplementary).
Finally, it should be noted that the results presented in this study are based on simultaneous analyses. In future work, we will investigate the lead–lag relationship between the heat transports and temperature anomalies.Furthermore, the different ENSO types (with prominent signals in the central Pacific and the eastern Pacific) and the sensitivity of ENSO to the depth of the upper ocean layer should be studied.
Acknowledgments. The authors wish to thank the anonymous reviewers for their comments that helped to improve the original manuscript. The data are obtained from the ECMWF OCEAN5 system (https://icdc.cen.uni-hamburg.de/daten/reanalysis-ocean/easy-init-ocean/ecmwf-oras5.html).
 Journal of Meteorological Research2022年2期
- Journal of Meteorological Research的其它文章
- An Updated Review of Event Attribution Approaches
- CMIP6 Projections of the “Warming–Wetting” Trend in Northwest China and Related Extreme Events Based on Observational Constraints
- Role of Anthropogenic Climate Change in Autumn Drought Trend over China from 1961 to 2014
- Deep Learning for Seasonal Precipitation Prediction over China
- Contribution of Winter SSTA in the Tropical Eastern Pacific to Changes of Tropical Cyclone Precipitation over Southeast China
- Diagnostic Quantification of the Cloud Water Resource in China during 2000–2019
