
Contribution of Winter SSTA in the Tropical Eastern Pacific to Changes of Tropical Cyclone Precipitation over Southeast China
2022-05-07 07:06XianghuaWUQihaoZHUChaoWANGYueZHOUYiqiCHENXintongTIANandYajieHUA
Xianghua WU, Qihao ZHU*, Chao WANG, Yue ZHOU, Yiqi CHEN, Xintong TIAN, and Yajie HUA
1 School of Mathematics and Statistics, Nanjing University of Information Science & Technology, Nanjing 210044
2 Key Laboratory of Meteorological Disaster of Ministry of Education/Joint International Research Laboratory of Climate and Environment Change/Collaborative Innovation Center on Forecast and Evaluation of Meteorological Disasters and Earth System Modeling Center,Nanjing University of Information Science & Technology, Nanjing 210044
3 Hubei Key Laboratory for Heavy Rain Monitoring and Warning Research, Institute of Heavy Rain,China Meteorological Administration, Wuhan 430074
ABSTRACT Tropical cyclone precipitation (TCP) accounts for 10%–40% of the boreal summer precipitation that occurs over Southeast China (SEC), causing flood disasters and serious damage. On the decadal scale, TCP increases significantly in SEC while TC frequency decreases in the western North Pacific (WNP) during 1980–2019. Therefore, variations in TCP and the corresponding physical mechanism are investigated in this study. First, an empirical statistical method is introduced to quantify the TCP amount based on accumulated cyclone energy (ACE) and TC frequency with the TCP anomaly decomposed into three items (rainfall frequency, rainfall intensity, and nonlinear item). ACE,as the integration of TC intensity and frequency, is a more effective index than TC frequency for depicting the characteristics of TCP because the contribution of rainfall frequency represented by ACE is higher than that of TC frequency. Then, the physical mechanism affecting the WNP TC activities and TCP in SEC are inspected. Positive sea surface temperature anomaly (SSTA) over the tropical eastern Pacific (TEP) in winter can trigger variations of air–sea interaction over the tropical Pacific, including low-level divergent winds, mid-tropospheric descent flows,high-level convergent winds coupled with negative anomalies of vorticity and humidity over the tropical western Pacific (TWP) in the next summer. These dynamic conditions provide unfavorable environments for TC activities in the WNP and constrain TCP in SEC. Furthermore, more significantly negative SSTA events in the TEP facilitate enhanced ACE along with positive relative vorticity, relative humidity, and upwelling vertical winds anomalies over the coast of SEC after 1998, which is a reasonable explanation for the increasing TCP in SEC.
Key words: tropical cyclone precipitation, accumulated cyclone energy, sea surface temperature anomaly, air–sea interaction
1. Introduction
Tropical cyclone (TC) is one of the most extreme natural events that occur over the western North Pacific(WNP), and often affects the spatial distribution of regional precipitation since approximately 3/4 of WNP TCs form in the main TC genesis area (10°–40°N,100°–170°E) in summer (Wang et al., 2020). Tropical cyclone precipitation (TCP) can contribute 20%–50% to summer rainfall in Southeast China (SEC), inducing severe rainstorms and flooding in China (Liu et al., 2013;Li and Zhou, 2015). In Taiwan, the precipitation caused by TC can even account for 60% of the summer rainfall over some regions (Kubota and Wang, 2009). Hence, a better understanding of the interannual variations and associated causes of summer TCP in China is critical for the exploration of the local climate and disaster prevention.
At the interdecadal timescale, the main spatial distribution of summer TCP has changed, which has experienced meridional precipitation changes in southern China. It is found that the main reason for TCP variations is the increased frequency of TC landings (Li and Zhou, 2015). Apart from this, there are several detailed reviews on changes in atmospheric conditions (Chen and Chen, 2011; Chen et al., 2011; Liu et al., 2013). The westward extension of the subtropical high over the WNP leads to the enhancement of water vapor convergence over eastern China; on the other hand, changes in TC steering flow cause the prevailing paths of TC to shift from the South China Sea to the coast of East Asia in summer. Moreover, previous studies noticed that the WNP TC frequency decreased significantly in the late 1990s (Liu and Chan, 2013; Yokoi and Takayabu, 2013).In terms of atmospheric conditions, reduced low-level relative vorticity and increased vertical wind shear were responsible for the TC reduction in the WNP after 1998(Zhao and Wang, 2019). Comparing the two periods before and after 1998, the number of TC decreased significantly in the southern WNP and increased significantly in the northern WNP (He et al., 2015). Wu and Wang(2008) and Zhao et al. (2014) found that the changes in the magnitude of intense TC over the past 30 years may be caused by the variations in TC formation locations and prevailing tracks, which are related to the environmental conditions on the WNP, such as subtropical high belt, monsoon trough, and sea surface temperature anomaly (SSTA) (Tu et al., 2009; Wu et al., 2012; Zhang et al., 2020).
In addition to the pronounced factors that influence the variability in TCP, such as the Pacific decadal oscillation(PDO), North Atlantic Oscillation (NAO), and monsoon trough in the WNP (Goh and Chan, 2010; Wu et al.,2012; Zhou and Cui, 2014; Wang and Liu, 2016; Wang and Wu, 2016), El Niño events are also critical in regulating the TC activities in the WNP and summer rainfall in China (Wang et al., 2000; Chan and Zhou, 2005; Yuan and Yang, 2012; Zhao and Wang, 2016). In El Niño years, there is a tendency that the number of TC genesis increases significantly in the southeast quadrant of the WNP, inducing more longer-lived and intense TC than in La Niña years (Camargo and Sobel, 2005; Zhan et al.,2011), which may be affected by a synergy of large-scale dynamic and thermodynamic conditions (Goh and Chan,2010; Liu et al., 2019). However, as a result of the positive relative humidity anomalies, the significant anomalous cyclones occupy the South China Sea. Meanwhile,the easterly wind anomalies provide a favorable steering flow for TC landfall, making the TC generally more frequent and stronger over China in La Niña years (Liu,2019). Due to the PDO switching to a cool phase, more central Pacific (CP) El Niño and La Niña events occurred after 1998 (Zhao and Wang, 2019). However, the influence of the SSTA shift in the tropical Pacific associated with the variations in atmospheric conditions on the interdecadal changes of WNP TC activities is less studied.
The purpose of this study is to analyze the variations of the summer TCP in SEC and the corresponding physical mechanisms during 1980–2019. The remainder of this article is structured as follows. In Section 2, the data and method used herein are described. Section 3 shows the climatology of the spatial distribution of summer TCP in China and introduces an empirical statistical method to analyze the TCP anomaly. The relationship between SSTA in the tropical eastern Pacific (TEP) and TC activities over the WNP is investigated by examining the air–sea interactions, and possible explanations for the decadal changes of TCP in SEC are discussed in Section 4, followed by a summary in Section 5.
2. Data and method
The 6-h WNP TC best-track dataset from the China Meteorological Administration (CMA; Ying et al., 2014;Lu et al., 2021) is used to analyze TC activities in summer, and a TC location is adopted when the TC 2-minaveraged sustained surface wind speed exceeds or equals to 17.5 m s-1. As the observed TC data are considerably poor before the satellite era (1979), we employ the datasets from 1980 to 2019. This study examines the contributions of TC days and accumulated cyclone energy(ACE) to TCP. ACE is an integrated measure of TC activity and calculated by the sum of squared maximum winds over the lifetime of each cyclone. For the same period, quality-controlled daily precipitation observations at 699 meteorological stations provided by the CMA are obtained to depict the characteristics of TCP.The monthly averaged reanalysis data reflecting different pressure levels retrieved from the Copernicus Climate Change Service (C3S) Climate Data Store (CDS)are applied to examine the large-scale atmospheric variations in a 0.5° × 0.5° box (Hersbach et al., 2019), and the monthly mean SST data are obtained from the Extended Reconstructed Sea Surface Temperature (ERSST) v5 with a resolution of 2° × 2° (Huang et al., 2017).
We inspect the relationship between the SSTA index of different basins in the tropical Pacific and TCP in SEC, including the Niño-3/3.4/4 SSTA index, which is estimated by the monthly mean of ERSST v5 (derived from the climatology of SST during 1981–2010). The Butterworth filter is used to extract decadal features of time series (Murakami, 1979), and to detect abrupt shifts of TC frequency, the Bayesian change point analysis is adopted to provide the probability estimate of the shifts(Hsu et al., 2014; Zhao and Wang, 2016). In addition, the significances of the correlations and differences are detected by using the Student’st-test.
3. TCP variation in SEC
3.1 Spatial distribution of TCP
TCP is generally defined as the rainfall within a certain distance to the TC center along with the individual track of TC, yet there is no consensus on this definition and the TCP radii are difficult to define with a range from 250 to 1100 km in previous studies (Chen and Chen, 2011; Ying et al., 2011; Bagtasa, 2017; Chen and Huang, 2019). However, researchers found that precipitation rarely changed when it exceeded the TC center by approximately 800 km (Dare et al., 2012; Wang et al.,2020). Lin et al. (2015) used satellite observed data and noticed a weak relationship between TC radius and intensity. Moreover, in a later section, when the TCP range is defined as 500 km, the precipitations rarely change at most stations, but the correlation between TCP and the SSTA index weakens. Based on the above conclusions,we apply 800 km as the effective TCP radius.
Figure 1a shows the climatology of the TCP distribution at 699 stations across the country in summer during 1980–2019. TCP gradually decreases from the southeast coast to the inland, and mainly occurs in the coastal cities of eastern and southeastern China. In general, the spatial distribution of total precipitation is relatively balanced, and the main precipitation area is still in SEC(Fig. 1b). The TCP contribution even exceeds 40% in some southeast coastal regions, and most areas in SEC reach a ratio of 10%–30% (Fig. 1c), and SEC should therefore be regarded as the main TCP area (18°–35°N,105°–123°E) in China.
3.2 Diagnosis of TCP anomaly
Figure 2 shows the time series of WNP TC numbers and TCP in the main TCP area per year. Butterworth’s filter extracts decadal features of time series and trends show that the number of WNP TC significantly decreased (Fig. 2a) while Fig. 2b shows that TCP in SEC increased significantly during 1980–2019. It is suggested that the TC number on the WNP is not the only critical factor that modulates the SEC TCP in summer.Moreover, due to the remarkable reduction of TC numbers in the late 1990s over the WNP, TCP also encountered an obvious reduction (Fig. 2), which was consistent with previous studies (Tu et al., 2009; He et al.,2015; Zhang et al., 2020). In order to explore the reasons for the differences between trends of time series, the 40-yr data can be divided into two periods. As shown in Fig.2a, we note a great probability of a change point on TC frequency in 1998, and the average WNP TC number in P1 (1980–1997) was about 13 TCs per year, which was larger than 10.6 TCs per year in P2 (1998–2019).
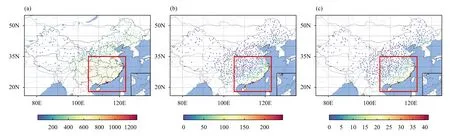
Fig. 1. The climatology of (a) total precipitation (mm yr-1), (b) TCP (mm yr-1), and (c) TCP contribution (%) in summer during 1980–2019.The red rectangle is the main TCP area.

Fig. 2. (a) TC number per year on the WNP and (b) TCP (mm yr-1) on SEC in summer during 1980–2019. The solid lines are original time series and the yellow dashed lines are Butterworth’s filter of 10 yr. The black dotted lines are the linear trends significant at the 95% confidence level and the bars in (a) represent the conditional posterior probability mass function (PMF) of change points.
The amount of TCP at a station is determined by the rainfall rate and TC frequency, so we introduce a new empirical statistical method proposed by Li and Zhou(2015), defining the TC rainfall intensity as follows:

wherePis the total annual TCP at a station,Fis the total TC days that cause rainfall, andIis the calculated TC rainfall intensity. To analyze the effects of changes in TC days on the interannual variations of TCP, the TCP anomaly with respect to its climatology is finally resolved into three main items as follows:

Apart from the TC frequency, the TC rainfall rate is also a decisive variable regulating TC rainfall and increases remarkably with TC intensity, particularly toward the TC center (Yu et al., 2017). To verify whether there is a difference between contributions of TC days and intensity to the TCP anomaly, the rainfall frequency is measured by TC days withF1and by ACE withF2.The results are shown in Table 1. In SEC, the mean contribution rate ofis 1.21, while that ofreaches 1.8 when ACE is used during 1980–2019, indicating that ACE is a more effective index reflecting the variations of TCP compared to TC days. In addition, the features of contributions in P1 and P2 are similar because ACE is an integration of TC days and intensity, and there is a distinction ofbetween P1 and P2, indicating that the ACE values fluctuate intensively in P1.

Table 1. Contributions of rainfall frequency, intensity, and nonlinear items measured by TC days ( F 1) and ACE (F 2) to TCP anomaly in different periods over SEC
4. Large-scale climate factors associated with changes of TCP
4.1 Relationship between SST and TCP
It can be inferred from the spatiotemporal distributions of TCP anomalies that the TC numbers over the WNP are not the only factor influencing TCP in SEC.Though the Niño-3.4 SSTA index is generally applied to describe the TEP SSTA, it may not distinguish SSTA in the central or eastern Pacific. Therefore, the lag correlations between the Niño-3/4/3.4 SSTA index and TCP are detected (Fig. 4). For different regions, the highest lag correlation value occurs in December of the last year,and the highest season-averaged correlation coefficient is found in winter (November–January, NDJ) with -0.45/-0.38/-0.26. As a result, the mean Niño-3 SSTA index in NDJ is regarded as the reference for the influence of TEP SSTA on TCP over SEC in the following summer.
4.2 Influence of SST on atmospheric circulation
On account of the Pacific climate shift along with the changing ENSO, TC activities had a closer connection with ENSO after 1998 (Zhao and Wang, 2019). As depicted in Fig. 5a, the positive winter Niño-3 index causes a zonal pattern of warm SST over the central Pacific and cold SST over the subtropical Pacific in the next summer. In winter, the positive Niño-3 SSTA can trigger the dominant mode of low-level divergent winds and highlevel convergent winds over the TWP (Figs. 5b, c). As demonstrated in Fig. 5d, the critical variable affecting TC genesis, the relative vorticity that regressed to the Niño-3 SSTA index in summer displays a meridional distribution pattern, in which apparent low-level anticyclone anomalies are found over the South China Sea and east of Taiwan. Simultaneously, consistent with the SST pattern,the relative humidity and vertical velocity show zonal distributions under the motivation of convergent winds and positive SSTA (Figs. 5e, f). These similarities can be concluded from the fact that warmer seawater causes the surface water to evaporate more intensively, while local low pressure makes the surrounding air converge to the center, causing local updrafts to carry water vapor upward to occupy the mid atmosphere. The above dynamical conditions demonstrate unfavorable environments for the WNP TC genesis in summer under the influence of positive TEP SSTA in the last winter.
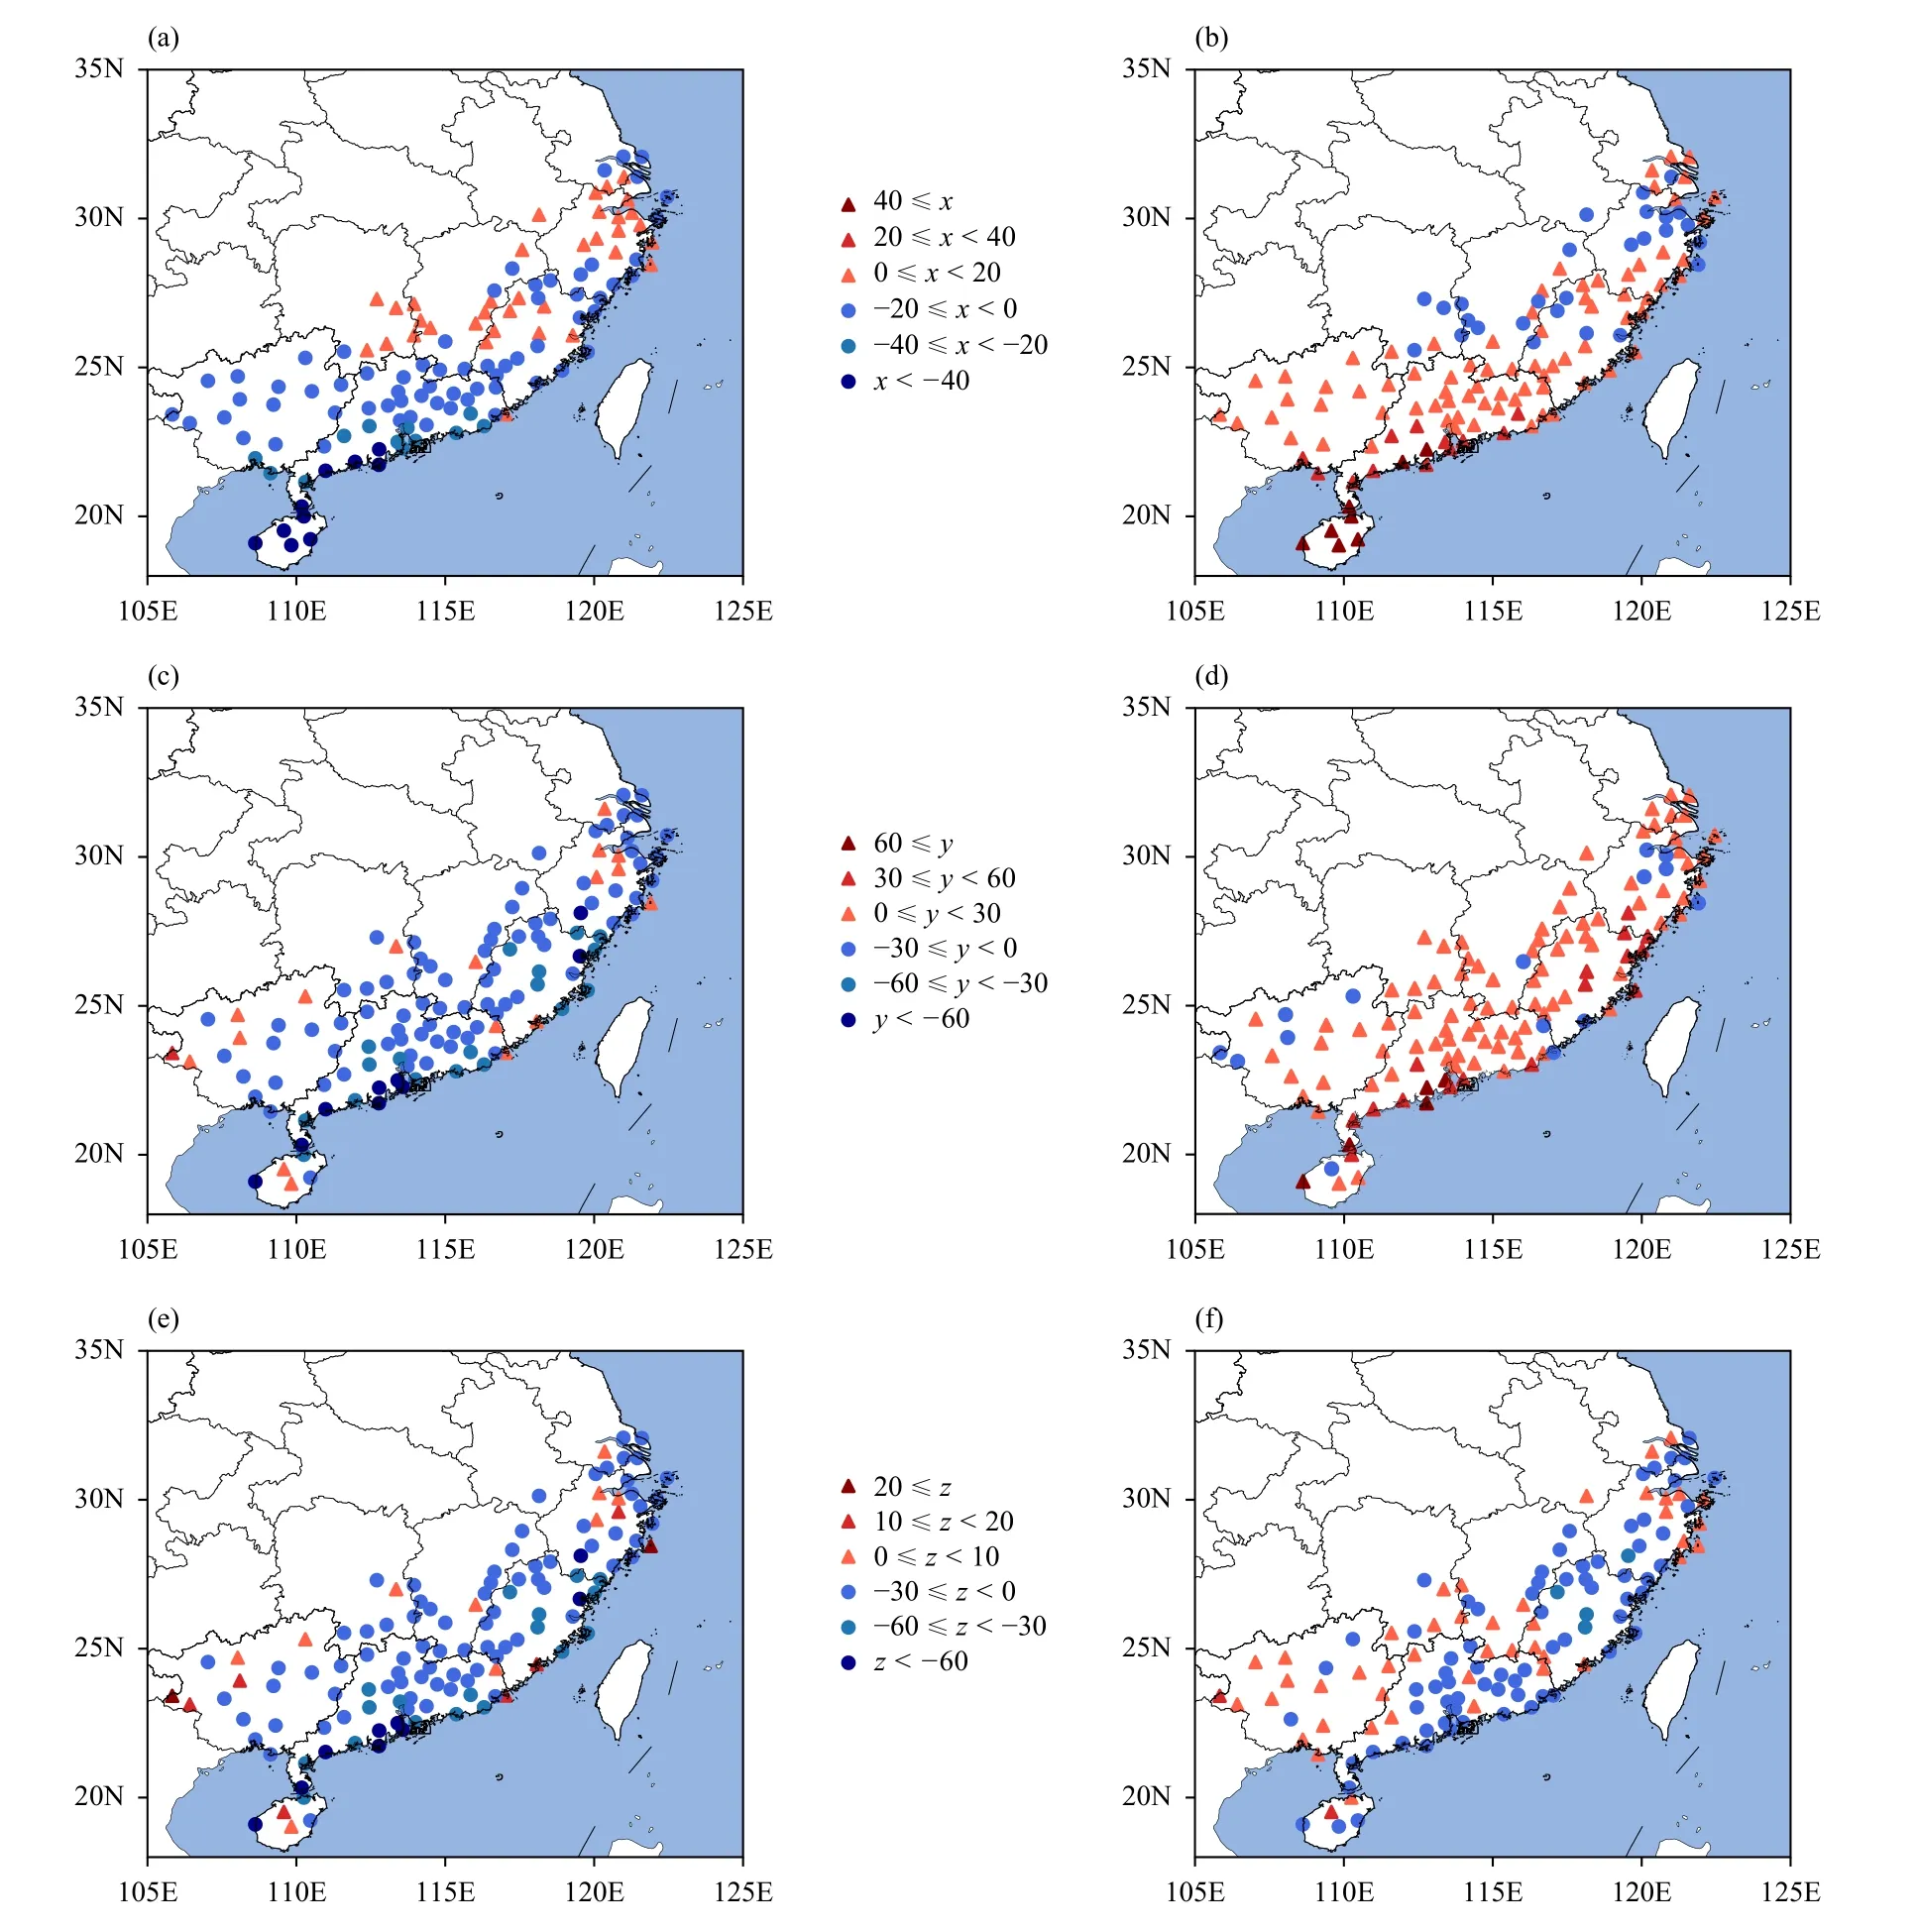
Fig. 3. Distributions of (a, b) rainfall frequency (x; mm yr-1), (c, d) rainfall intensity (y; mm yr-1), and (e, f) nonlinear item (z; mm yr-1) in (a, c,e) P1 and (b, d, f) P2.
To explicitly examine the relationship between SEC TCP and the air–sea conditions over the tropical Pacific,Fig. 6 shows the regressed pattern with respect to the TCP in SEC. Consistent with the positive SST in the CP,sufficient humidity over the mid atmosphere is found in a zonal pattern (Figs. 6a, e). Meanwhile, obvious high vorticity anomalies occupy the South China Sea (Fig. 5d),which is the main region of TC activities discussed in Section 4.3. Furthermore, the increase in precipitation is induced by the enhancement of low-level convergence,mid-level rise, and high-level divergence in south of China (Wu et al., 2010), which can be concluded by Figs.6b, c, f.
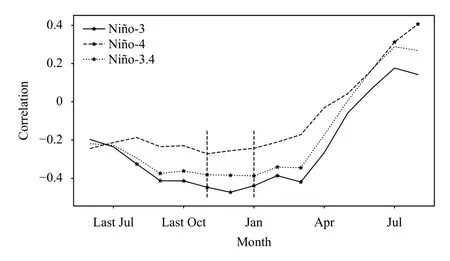
Fig. 4. Correlation coefficients between the monthly mean SSTA (including lag) in different Pacific regions and the summer TCP in SEC during 1980–2019. The * dots represent that the correlations are significant at the 90% confidence level, and the vertical dotted lines mark the highest correlation value in the last winter.
4.3 Atmospheric circulation in different periods
There is a possible linkage between the diversities of SSTA in the tropical Pacific and WNP TC activities. According to the definition of a significant SSTA event with a threshold of one standard deviation, four negative SSTA events in P1 and more than two events in P2 are identified (Fig. 7). Then, we compare the differences of several critical fields between P1 and P2. As shown in Fig. 8a, the main area of TC activities is located in eastern East Asia (15°–35°N, 105°–150°E) with TC activities measured by the climatology of ACE in each 2° × 2°box. It is found that a northwestward track of ACE was enhanced, especially affected the coast of SEC (Fig. 8b).As for the air–sea interaction, although SST was higher in P2 than in P1 (Fig. 8c), less low-level relative vorticity and downward vertical winds in the main TC genesis area (Figs. 8d, f) led to constraining the growth of TC.However, over the local regions in the coastal SEC in Figs. 8d–f, the higher relative vorticity, higher relative humidity, and upward vertical velocity are related to more negative SSTA events over the TEP in P2 and favorable for TC occurrences with TCP increase in SEC.

Fig. 5. Regression patterns of summer (a) SST, (b) 850-hPa divergent wind (m s-1 °C-1; vectors), (c) 200-hPa divergent wind (m s-1 °C-1; vectors), velocity potential [× 106 m2 s-1 °C-1; shaded in (b, c)], (d) 850-hPa relative vorticity (× 10-6 s-1 °C-1), (e) 500-hPa relative humidity (%°C-1), and (f) 500-hPa vertical velocity (× 10-2 Pa s-1 °C-1) with respect to the Niño-3 SSTA index of the last winter during 1979–2018. The dots represent that the regressions are significant at the 90% confidence level.

Fig. 6. Regression patterns of summer (a) SST (× 101 °C m-1), (b) 850-hPa divergent wind (× 101 m s-1 m-1; vectors), (c) 200-hPa divergent wind (×101 m s-1 m-1; vectors), velocity potential [× 107 m2 s-1 m-1; shaded in (b, c)], (d) 850-hPa relative vorticity (× 10-5 s-1 m-1), (e) 500-hPa relative humidity (× 101 % m-1), and (f) 500-hPa vertical velocity (× 10-1 Pa s-1 m-1) with respect to SEC TCP in summer during 1980–2019.The dots represent that the regressions are significant at the 90% confidence level.

Fig. 7. Winter SSTA (°C) of Niño-3/3.4 during 1979–2018. The red(orange) area is a positive Niño-3 (Niño-3.4) SSTA, the blue area is a negative Niño-3 SSTA, and the blue line is one standard deviation of the Niño-3 SSTA.
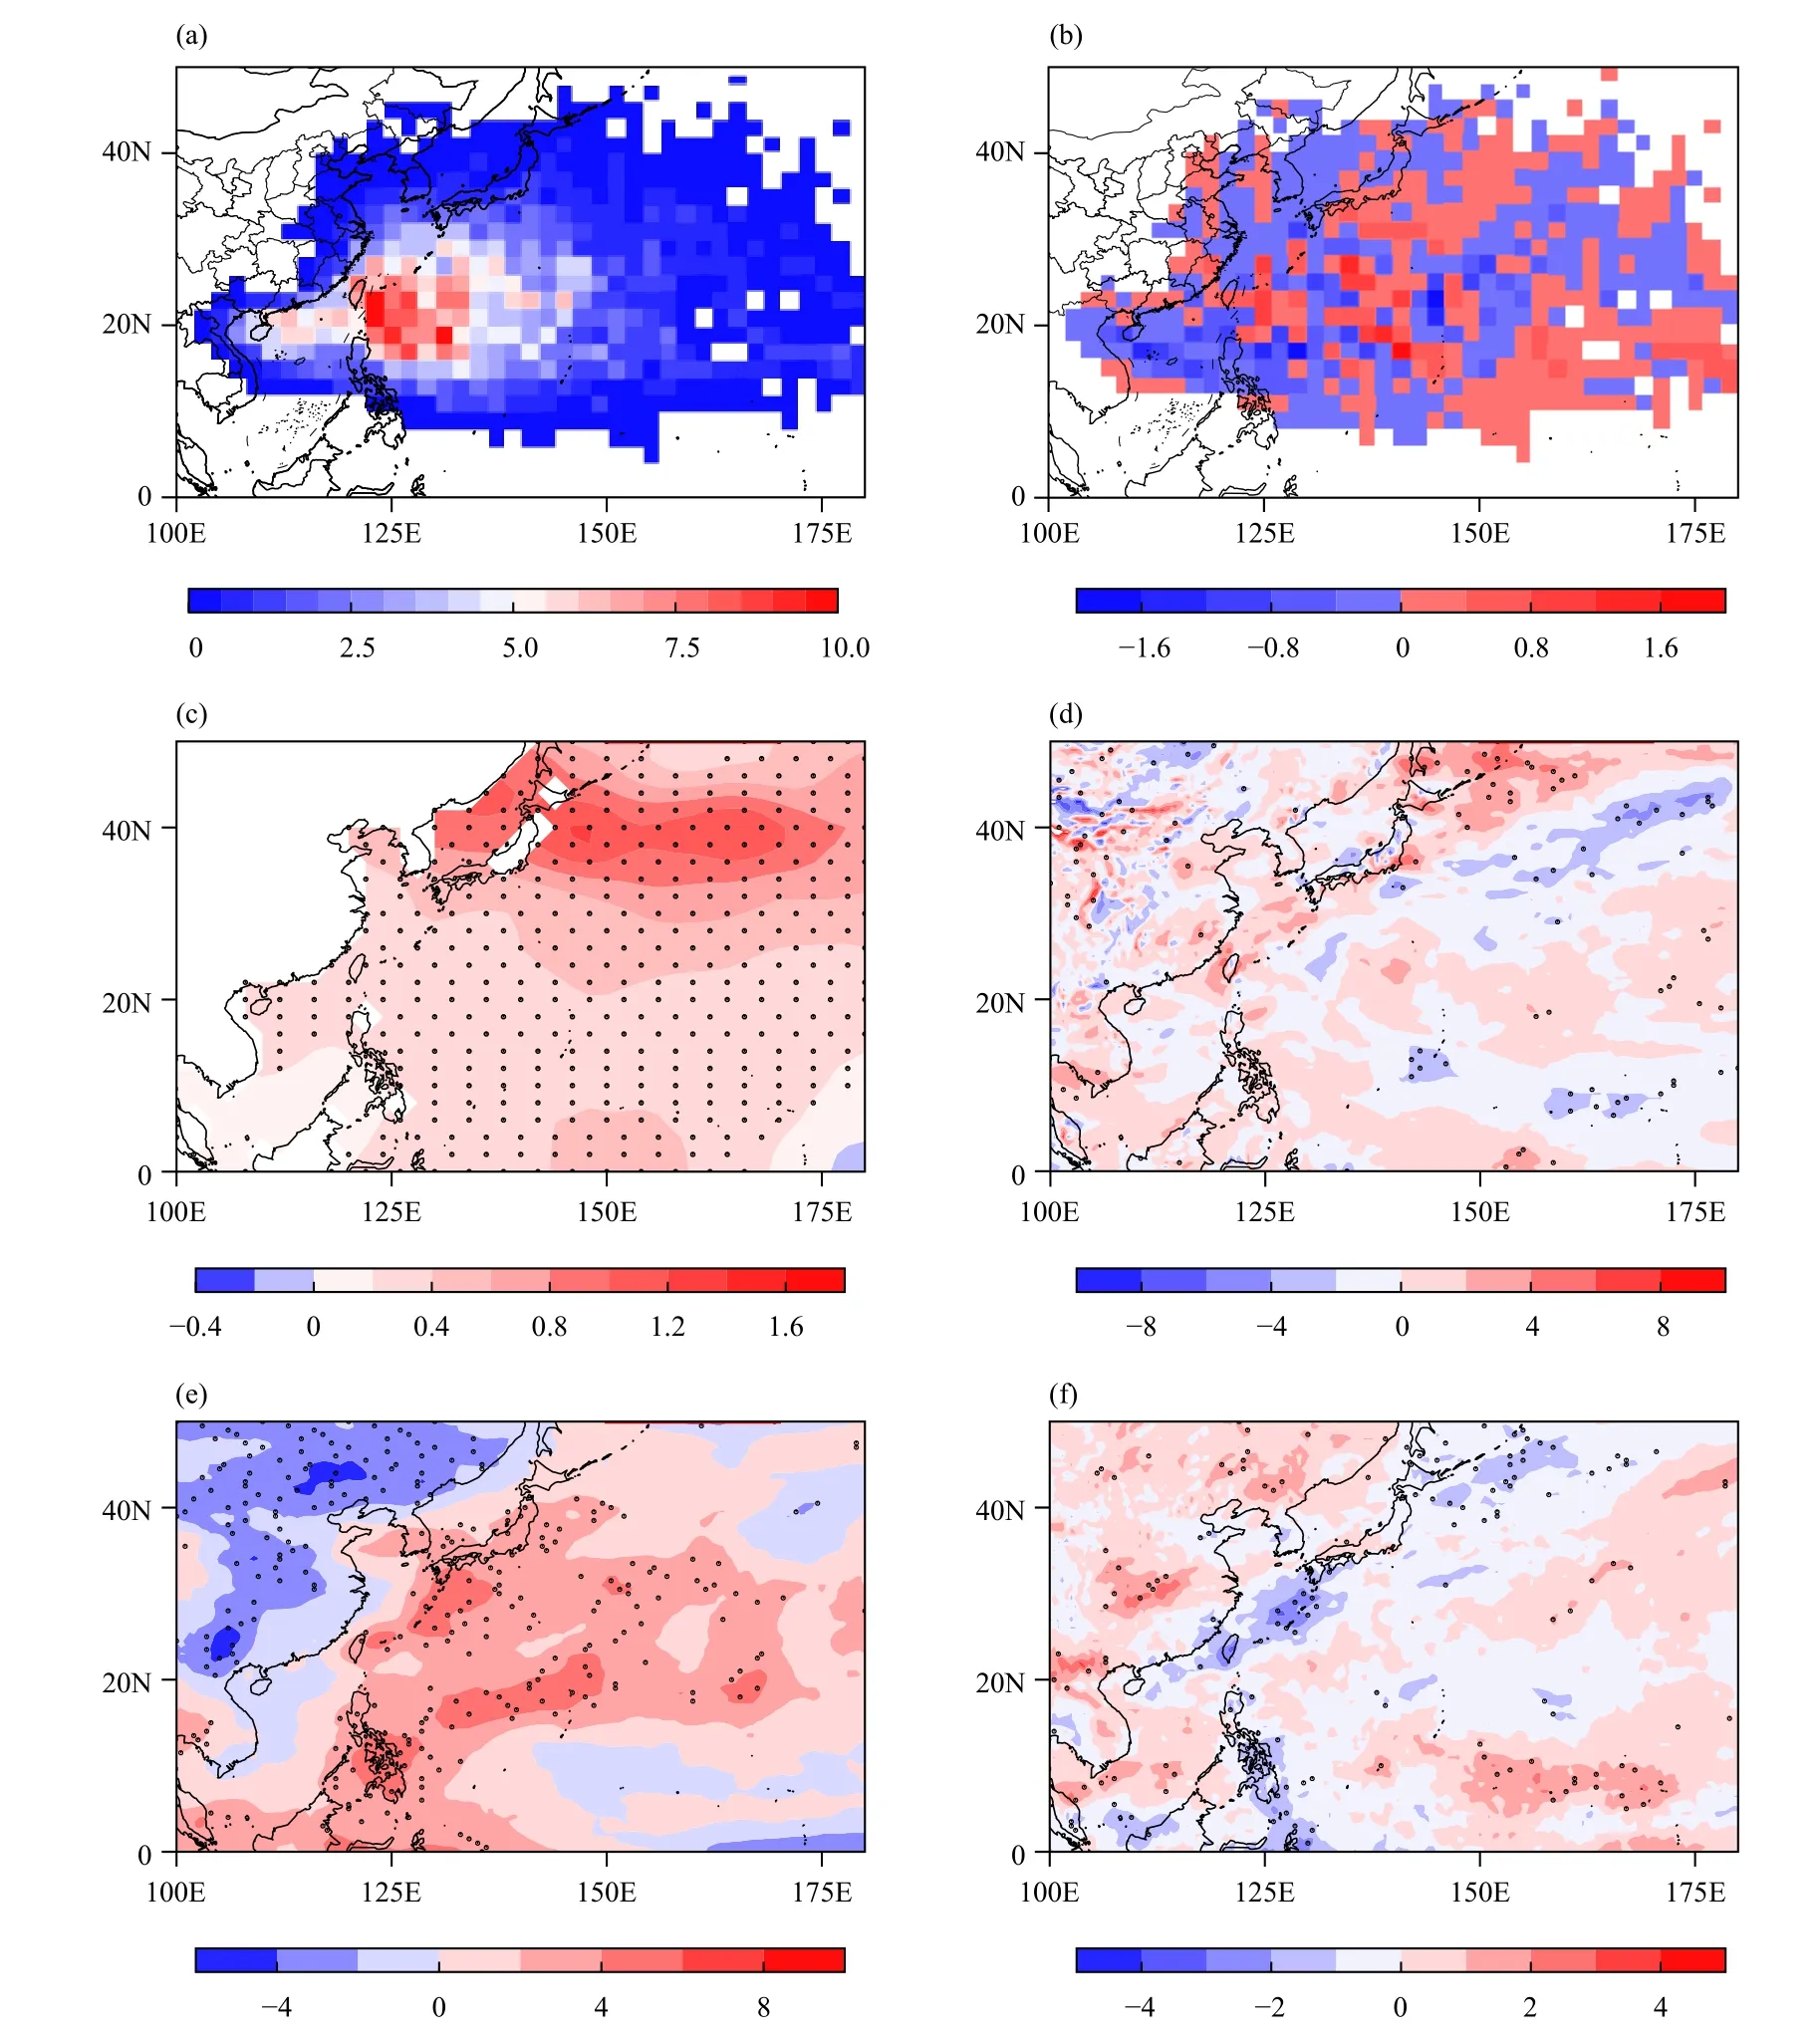
Fig. 8. (a) ACE per year (× 104 m2 s-2 yr-1) during 1980–2019, and the differences of (b) ACE (× 104 m2 s-2 yr-1), (c) SST (°C yr-1), (d) 500-hPa relative humidity (% yr-1), (e) 850-hPa relative vorticity (s-1 yr-1), and (f) 500-hPa vertical velocity (Pa s-1 yr-1) between P1 and P2. The dots represent that the differences are significant at the 90% confidence level.
5. Summary and discussion
TCP, which is evaluated by using daily precipitation observations in boreal summer, affects eastern and northeastern China and accounts for 10%–40% of the total precipitation in the main TCP area. Among the seven major typhoon areas worldwide, the WNP is the area that generates the highest frequency of high-intensity TCs(Xiao and Xiao, 2010). This study investigates the variations of TCP in SEC and associated air–sea interaction over the WNP. In addition, it is found that TCP in SEC increases significantly while the number of TC over the WNP decreases during 1980–2019, although TCP encountered a decrease with an obvious reduction of TC numbers in the late 1990s. This suggests that TC frequency is not the only decisive contributor to the TCP.To disentangle the factors that influence the variations in TCP characteristics, we apply and extend an empirical statistical method that can reasonably describe the contribution of TC frequency and intensity to the TCP anomaly. The results show that ACE is more effective than TC frequency in the TCP anomaly model and that TCP has a tight relationship with both TC frequency and intensity.The positivevalues recorded in most areas of SEC after 1998 show that ACE was higher in P2 than P1, corresponding to the differences of ACE between P1 and P2 along the coast of SEC discussed in Section 4.
Previous studies have noted that TC activities are controlled primarily by the local environmental conditions,such as SST, vertical winds, and humidity (Hill and Lackmann, 2009; Knaff et al., 2014; Lin et al., 2015). In this study, a significant lag correlation between the TEP SSTA averaged in NDJ and TCP over SEC in the next summer is identified. Then, we mainly discuss the largescale climate factors that regressed to the Niño-3 SSTA index. The results show that winter SSTA over the TEP impacts the atmospheric circulation anomalies in the tropical Pacific, modulating the WNP TC activities and TCP in SEC in the next summer. Wang et al. (2020)found that the transport of SSTA from winter to the next summer is a gradual physical process, and the circulation anomalies will persist until the next summer under the air–sea interaction. The positive winter TEP SSTA can force a zonal SST pattern of positive CP SSTA and negative SSTA in the subtropical Pacific. These conditions trigger a chain reaction of low-level divergent winds and high-level convergent winds in the TWP while the opposite status is found in the TEP. The negative relative vorticity anomalies dominate the south of East Asia and the Philippines along with the mid-tropospheric anomalies of relative humidity and vertical velocity, which are highly similar to the SSTA pattern. Overall, the results show that the above dynamic conditions induced by the positive winter SSTA over the TEP are unfavorable for the formation of WNP TC in the next summer. Then,these critical fields that adjust WNP TC activities are also regressed to the SEC TCP to distinguish the impacts on precipitation. The sufficient TCP is ascribable to the positive CP SST that promotes humidity to occupy the mid atmosphere and high vorticity in the South China Sea. Moreover, the enhancements of low-level convergence, mid-level rise, and high-level divergence in the WNP are favorable conditions for the increase of TCP.
On the interdecadal timescale, there were more negative SSTA events in the TEP after 1998. More explicitly,we compare the ACE differences in a 2° × 2° box between P1 and P2, and a northwestward track of higher ACE was found in SEC, suggesting that TC activities were more frequent over coastal SEC in P2. Moreover,due to the more negative TEP SSTA events, the synergistic effects of higher relative vorticity, humidity, and updraft winds are favorable for the increased TCP in SEC after 1998.
Changes in TC rainfall evolve multi timescale variability. Here, we mainly focused on the large-scale anomalies on the interannual and longer timescales, while changes in synoptic features of TC may contribute as well. For instance, the asymmetric TC rainfall-induced by cold wave may contribute to changes in local precipitation after TC passages (Ma et al., 2020). However, how these synoptic scale features contribute to the decadal changes in TC rainfall remains unclear, which may deserve further investigation.
 Journal of Meteorological Research2022年2期
- Journal of Meteorological Research的其它文章
- An Updated Review of Event Attribution Approaches
- CMIP6 Projections of the “Warming–Wetting” Trend in Northwest China and Related Extreme Events Based on Observational Constraints
- Role of Anthropogenic Climate Change in Autumn Drought Trend over China from 1961 to 2014
- Deep Learning for Seasonal Precipitation Prediction over China
- Diagnostic Quantification of the Cloud Water Resource in China during 2000–2019
- Factors Influencing Diurnal Variations of Cloud and Precipitation in the Yushu Area of the Tibetan Plateau