Role of Anthropogenic Climate Change in Autumn Drought Trend over China from 1961 to 2014
Xuyu ZHANG, Jinhua YU*, Laurent Z. X. LI, and Wei LI
1 Key Laboratory of Meteorological Disaster, Ministry of Education/Collaborative Innovation Center on Forecast and Evaluation of Meteorological Disasters, Nanjing University of Information Science & Technology, Nanjing 210044, China
2 Laboratoire de Météorologie Dynamique, Centre National de la Recherche Scientifique, Sorbonne Université,Ecole Normale Supérieure, Ecole Polytechnique, Paris 75252, France
ABSTRACT Understanding the impact of anthropogenic climate change on drought is of great significance to the prevention of its adverse effects. Two drought indices, standardized precipitation index (SPI) and standardized precipitation evapotranspiration index (SPEI), are used here for the detection and attribution of autumn droughts in China, and for the exploration of the role played by the anthropogenic climate change. SPI is only related to precipitation, but SPEI involves both precipitation and potential evapotranspiration. For their trend’s spatial patterns, the historical simulations(including all forcings, noted as ALL) from 11 models of the Coupled Model Intercomparison Project phase 6, as an ensemble, are able to reproduce their observational counterpart. SPI shows wetting trend in the north of 35°N and drying trend in the south. SPEI shows drying trend in almost whole China. The drying trend in historical simulations ALL is significantly stronger, compared with the counterpart from the accompanying simulations (called NAT) with only natural forcings implemented. This result clearly indicates that anthropogenic climate change plays a dominant role in the enhancement of autumn drought in China. A more rigorous detection work is also performed with the signal’s fingerprint of ALL (and NAT) projected onto the observation and assessed with the background noise from no external-forcing control simulations. The trend pattern signal in ALL is significantly detected in observation for both SPI and SPEI, with a more pronounced signal in SPEI than in SPI, while the signal of NAT is not detected for neither SPI nor SPEI. Finally, extreme droughts (with indices beyond -2) are assessed in terms of probability ratio between ALL and NAT. It is shown that the anthropogenic precipitation change plays a leading role in the south of 35°N,while the anthropogenic temperature change leads in the north.
Key words: drought, anthropogenic effect, detection and attribution, standardized precipitation index (SPI) and standardized precipitation evapotranspiration index (SPEI)
1. Introduction
Drought is a common natural disaster of water shortage, with important consequences on the regional agriculture, economy, environment, and many other aspects for its afflicted areas. In the context of global climate warming, the duration and frequency of droughts in China show an upward trend in recent years, even in some areas that are generally considered as humid (Zhai et al., 2010; Zhang and Zhou, 2015). Drought is thus a strong concern, which has serious impacts, not only on food security and ecological conditions, but also on sustainable development of social economy (Zou et al.,2005; Wang et al., 2011).
Droughts occur more frequently and more severely since the late 1990s in China, with prolonged and consecutive droughts increasing in recent years (Yu et al.,2014; Chen and Sun, 2015). Wang et al. (2015),however, reported that the whole country should not be taken as a single bloc and there is a rich regional diversity with drying trend particularly remarkable in central and southwestern China in spring and autumn. Xu et al. (2021) evaluated the aridity changes in China’s drylands and found a significant wetting trend in regions of hyper-aridity. Droughts are often related to particular atmospheric circulation anomalies. Ma et al. (2017) pointed out that dry conditions in the southeastern periphery of the Tibetan Plateau are driven by the Indian–Pacific warm pool sea surface temperature (SST) through the enhanced local Hadley circulation and anomalous cyclonic motion over the South China Sea. In recent years, compound drought and heat events also attract public attention and awareness due to their high impact (Yu and Zhai, 2020a, b). It is reported that such compound events become more frequent and extend to wider areas since the late 1990s, especially in Southwest China, eastern Northwest China, northern North China, and in the coastal area of Southeast China.
The complexity of drought makes it difficult to quantify its intensity, duration, and spatial extent. In order to objectively detect and monitor drought, a number of researchers define different drought indices by considering both precipitation and evaporation rates which are directly related to the gain and loss of soil moisture (Palmer,1965; McKee et al., 1993; Vicente-Serrano et al., 2010;Dai, 2011; Beguería et al., 2014).
Palmer drought severity index (PDSI) is a popular drought monitoring index. Together with its different variants, it is widely used for operational purpose. PDSI considers the effects of various factors including precipitation and evaporation to measure the water balance of the surface, but it also takes into account precedent conditions in the calculation of the index’s current state. This relation between ancestor and successor allows to take into account some mitigation and adjustment capabilities of the natural systems and human societies through their past experience. But there are some obvious inconveniences, such as the interference among different time scales, and the strong influence of the selection of calibration period. Such issues limit us to perform spatial comparison among different locations, and to objectively interpret results of temporal correlation (Palmer,1965; Yu et al., 2014; Chen and Sun, 2015). The self-calibrating Palmer drought severity index (sc-PDSI) proposed by Wells et al. (2004) ameliorates the original PDSI, but some issues of PDSI of timescale dependence still remain.
Besides PDSI, the standardized precipitation index(SPI) is also one of the most widely used drought indices(McKee et al., 1993; Guttman, 1994; Okpara et al., 2017;Guenang et al., 2019), which only considers the effect of precipitation. Due to its flexibility, and availability in various temporal and spatial scales, WMO (2012) recommended SPI for meteorological drought monitoring. According to Wang W. et al. (2021), the SPI with the gamma distribution is the best to describe the cumulative precipitation in China, and the uncertainty of SPI decreases gradually with the increase of time span. This uncertainty occurs more strongly when the absolute value of SPI is relatively large. A similar index to SPI is the standardized precipitation evapotranspiration index(SPEI), which was proposed by Vicente-Serrano et al.(2010), and improved by Beguería et al. (2014). Like PDSI, SPEI takes into account the synergistic effect of precipitation and evaporation, while maintaining the advantage in calculation, stability in different temporal scales, and comparability in different spatial scales.
Another point worthy of attention is that the calculation of potential evapotranspiration can be of two different ways: one is from the empirical Thornthwaite equation (TH; Thornthwaite, 1948; van der Schrier et al.,2011; Christidis and Stott, 2021), using only temperature,another is the Penman–Monteith (PM) method, which considers the influence of temperature, humidity, wind speed, radiation, and other variables (Allen et al., 1998).In our study, we use the TH equation.
The IPCC’s last Assessment Reports (AR4 to AR5) all concluded on the role of anthropogenic activities in global climate change (IPCC, 2007, 2013). Understanding the impact of anthropogenic warming on drought is of great significance, which can provide scientific basis for policy decision-makers to formulate relevant energy conservation and emission reduction measures (Stott et al., 2016).Yuan et al. (2019) defined flash drought from the perspective of soil moisture, and used the optimal fingerprint method (Hasselmann, 1997; Allen and Tett, 1999)to conclude that 77% ± 26% of the increase in the frequency of flash droughts in China can be attributed to anthropogenic warming caused by greenhouse gas emissions. Wang S. S. et al. (2019, 2021) conducted attribution research on the record-breaking extreme dry heat events in Northeast China and Southwest China, and found that anthropogenic warming would increase their risk. In addition, precipitation, potential evaporation, and the difference between precipitation and potential evaporation are also research hotspots in drought attribution(Nangombe et al., 2020; Zhang et al., 2020; Lu et al.,2021).
Interestingly, both precipitation and potential evaporation are considered in the drought indices, but seldom researchers used the drought index in attribution studies.Christidis and Stott (2021) used SPI and SPEI to detect and attribute anthropogenic warming in Europe, but there is still a lack of relevant research in China. This paper will try to use SPI and SPEI to explore the role of anthropogenic warming on drought in China. As a first step of our efforts, we report here only results in Autumn, the average from September to November. Autumn is the transitional season from hot and wet summer to cold and dry winter for most regions in China under the monsoonal regime. It is also the season of maturation and harvest for most crops. Besides, a lack of rainfall in autumn can constitute an important threat for the restoration of water resources in many regions across China for water usages in the following winter and spring (Wang and Zhou, 2019).Severe autumnal droughts can lead to considerable ecological damage and agricultural losses (Zhang et al., 2014).
The paper is structured as follows. The data and methods used in this paper will be presented in Section 2, the main results will be given and analyzed in Section 3, and the whole paper will be summarized in Section 4.
2. Data and method
2.1 Data
In our research, we use monthly-mean temperature and precipitation observation data (OBS) of over 2400 stations, derived from Climate Data Center of China National Meteorological Information Center (NMIC), with a time span of 1961–2017. After eliminating the stations with too many missing values, we retain 2040 stations for investigation. Simulations from 11 CMIP6 (Coupled Model Intercomparison Project phase 6; Eyring et al.,2016) models are used (Table 1), including mainly three experiments: piControl (CTL, external forcing kept at constant level of 1850), historical (ALL, under all observation-based external forcing from 1850 to 2014), and hist-nat (NAT, same as ALL but only natural external forcing retained, solar activity and volcanic eruptions).
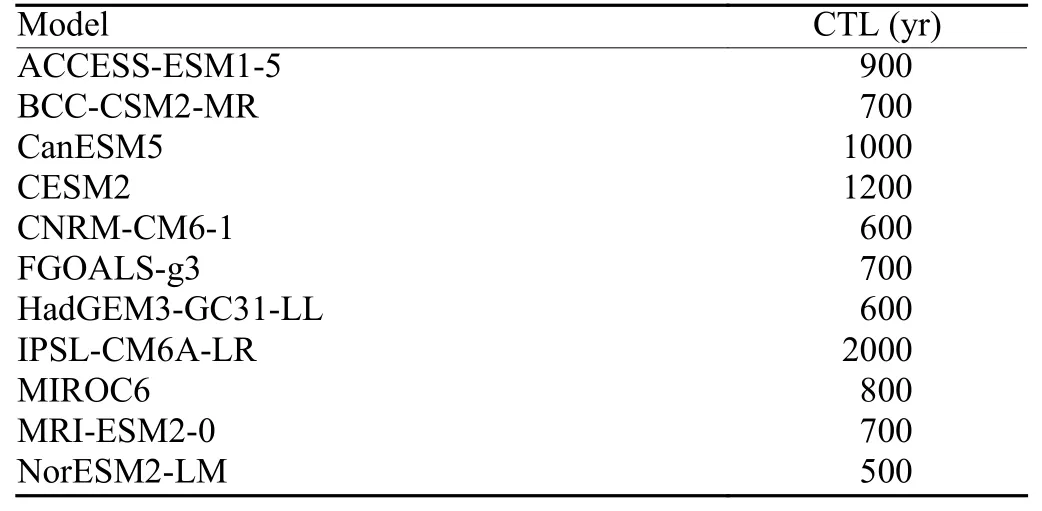
Table 1. Name of the 11 climate models used in this study and the duration (yr) of their control simulations
To facilitate the intercomparison among models and their ensemble processing, we use bilinear interpolation to interpolate simulation data to a common grid of 1° ×1°. It is to be noted that the interpolation intervenes afterthe accomplishment of SPI and SPEI calculations which are purposely performed at the original grid of each model. Furthermore, only the first member (r1i1p1f1) of each simulation from the 11 models is used in our calculation to ensure a maximum fairness of intercomparison among models and to reduce the ensemble bias. The observation data follow the same processing scheme with SPI and SPEI calculated at station level, and the interpolation to the common 1° × 1° grid realized through the Cressman method (Cressman, 1959). Since ALL experiments end in 2014, OBS and NAT experiments are also cut off in 2014. Finally, our analysis focuses on the Chinese mainland with mask applied beyond the country’s frontier.
But now the time was come for Sylvia to receive her gift, and all her companions were assembled; the Fairy stood in the midst and in the usual manner asked what she would take with her into the great world
2.2 The calculation of SPI and SPEI
We focus in this work on drought in autumn, so we choose to calculate the 3-month SPI and SPEI (i.e., SPI-3 and SPEI-3) from September to November. Autumn is actually a season with frequent drought in China (Yang et al., 2012; Zhang et al., 2013; Wang et al., 2014). Generally speaking, the calculation of SPI is to select a suitable probability density distribution to fit the precipitation (P) for a period of time, and then convertPto the standardized normal distribution. Gamma distribution is regarded as the best choice to describe the accumulated precipitation in China (Wang W. et al., 2021). In practice, we use the gamma distribution to fit the precipitation of CTL and get the parameters of gamma distribution. These parameters are then used to convert the precipitation of ALL and NAT experiments following a standardized normal distribution. The SPI values calculated in this way, when between -0.5 and 0.5, indicate a small departure from the baseline climate and a normal level of dry and wet conditions. However, when SPI is smaller than -2 or larger than 2, we experience a large departure from the baseline climate and suffer from extremely dry or wet conditions.
The calculation of SPEI is very similar to that of SPI,but the precipitation is replaced by the difference between precipitation and potential evapotranspiration PPET. It is also revealed that a log-logistic function shows a better fitting effect for P-PET (Vicente-Serrano et al.,2010). The calculation of SPEI can be sensitive to the exact calculation method of PET, with either the TH algorithm or the PM method. Actually, following a few studies comparing effects of the two methods (van der Schrier et al., 2011; Chen and Sun, 2015; Sun et al.,2017), the difference between them is small and they generally show similar behaviors in terms of trend, spatial average, and extremes. Therefore, in our study where the specific value of SPEI is of secondary importance,the TH method seems the best choice (Christidis and Stott, 2021), due to its simplicity of calculation using only temperature as input.
2.3 The calculation of detection variable and noise
To detect the signal of drought trend, we follow the fingerprinting methodology used in Christidis and Stott(2021). It consists of firstly extracting the signal (or the fingerprint) from simulations (ALL or NAT), and secondly projecting (dot product of two vectors) the fingerprint onto the observational pattern (OBS) to form the detection variable. Finally, the significance of the detection variable is evaluated against a background noise which is obtained in a similar way to the detection variable, but the observational pattern (drought’s temporal trend) is replaced by that obtained with a random combination from the control simulation (CTL) without any external forcing, each combinatory sequence being of the same length of the observation dataset.
2.4 Attribution of extreme droughts
We follow the usual practice for the attribution of extremes to anthropogenic activities (Allen, 2003; Stott et al., 2004; Fischer and Knutti, 2015). It is a probabilistic assessment of the extremes. It consists of firstly quantifying their respective probabilities with and without the influence of anthropogenic activities, and then calculating the probability ratio (PR).

whereP0is the probability in NAT, andP1the same probability but in ALL. It allows us to specifically explain the probabilistic role of anthropogenic activity in the extreme events. In our work, we consider SPI and SPEI below -2 as extreme drought events, and estimate their occurrence risk.
3. Results
3.1 Spatial pattern
We first analyze the spatial patterns ofPand P-PET trends during the historical period in China. To ensure a consistent comparison between observation and simulations, a common period (1961–2014) is used for ALL,NAT, and OBS. The spatial distribution ofPand P-PET trends in autumn is shown in Fig. 1 for a comparison between OBS and ALL. NAT is not shown, since it does not produce significant trend, neither consistent spatial structure. ALL is run under all-forcing conditions; it is highly expected that it reproduces what is deduced from OBS. Figure 1, actually, confirms our expectation, with lower panels from ALL resembling to upper ones from OBS. It is worthy of noting that ALL is the ensemble average from 11 different models and the average operation can mathematically reduce the spatial contrast of the drought trend pattern. This partly explains the difference of amplitude between the upper (OBS) and lower (ALL)panels in Fig. 1.
Figure 2 shows the spatial distribution of SPI and SPEI trends in autumn in OBS, ALL, and NAT. It can be seen that SPI and SPEI in OBS and ALL show similar behaviors asPand P-PET in Fig. 1, as expected. Because the trend ofP(P-PET) in OBS is stronger than that in ALL, when we convertP(P-PET) to SPI (SPEI), the trend in OBS (Figs. 2a, b) is also stronger than that in ALL (Figs. 2c, d) correspondingly, especially in NWC,SWC, and NEC. Again, the discrepancy can be partly explained by the fact that ALL is the ensemble average of 11 models while OBS experiences only one “realization.” The spatial distribution of SPI trend in ALL (Fig.2c) shows a rough demarcation line at 35°N. There is a general wetting trend in the north while a drying trend in the south. In terms of SPEI trend in ALL (Fig. 2d), most regions across China show negative values, except two small regions around 53°N, 123°E and 35°N, 80°E. If we examine now the NAT configuration with only natural forcing implemented, the drying trend in North China in SPEI NAT (Fig. 2f) is stronger than in SPI NAT (Fig. 2e)although the trend is not statistically significant in neither of them. It is clear that the drought strength in North China is also sensitive to temperature variation, not only to changes of precipitation. It is easy to see that the drying trend in China is generally stronger for SPEI ALL(Fig. 2d) than that for SPEI NAT (Fig. 2f). This clearly indicates that anthropogenic activities in the historical period enhanced drought risks in China.
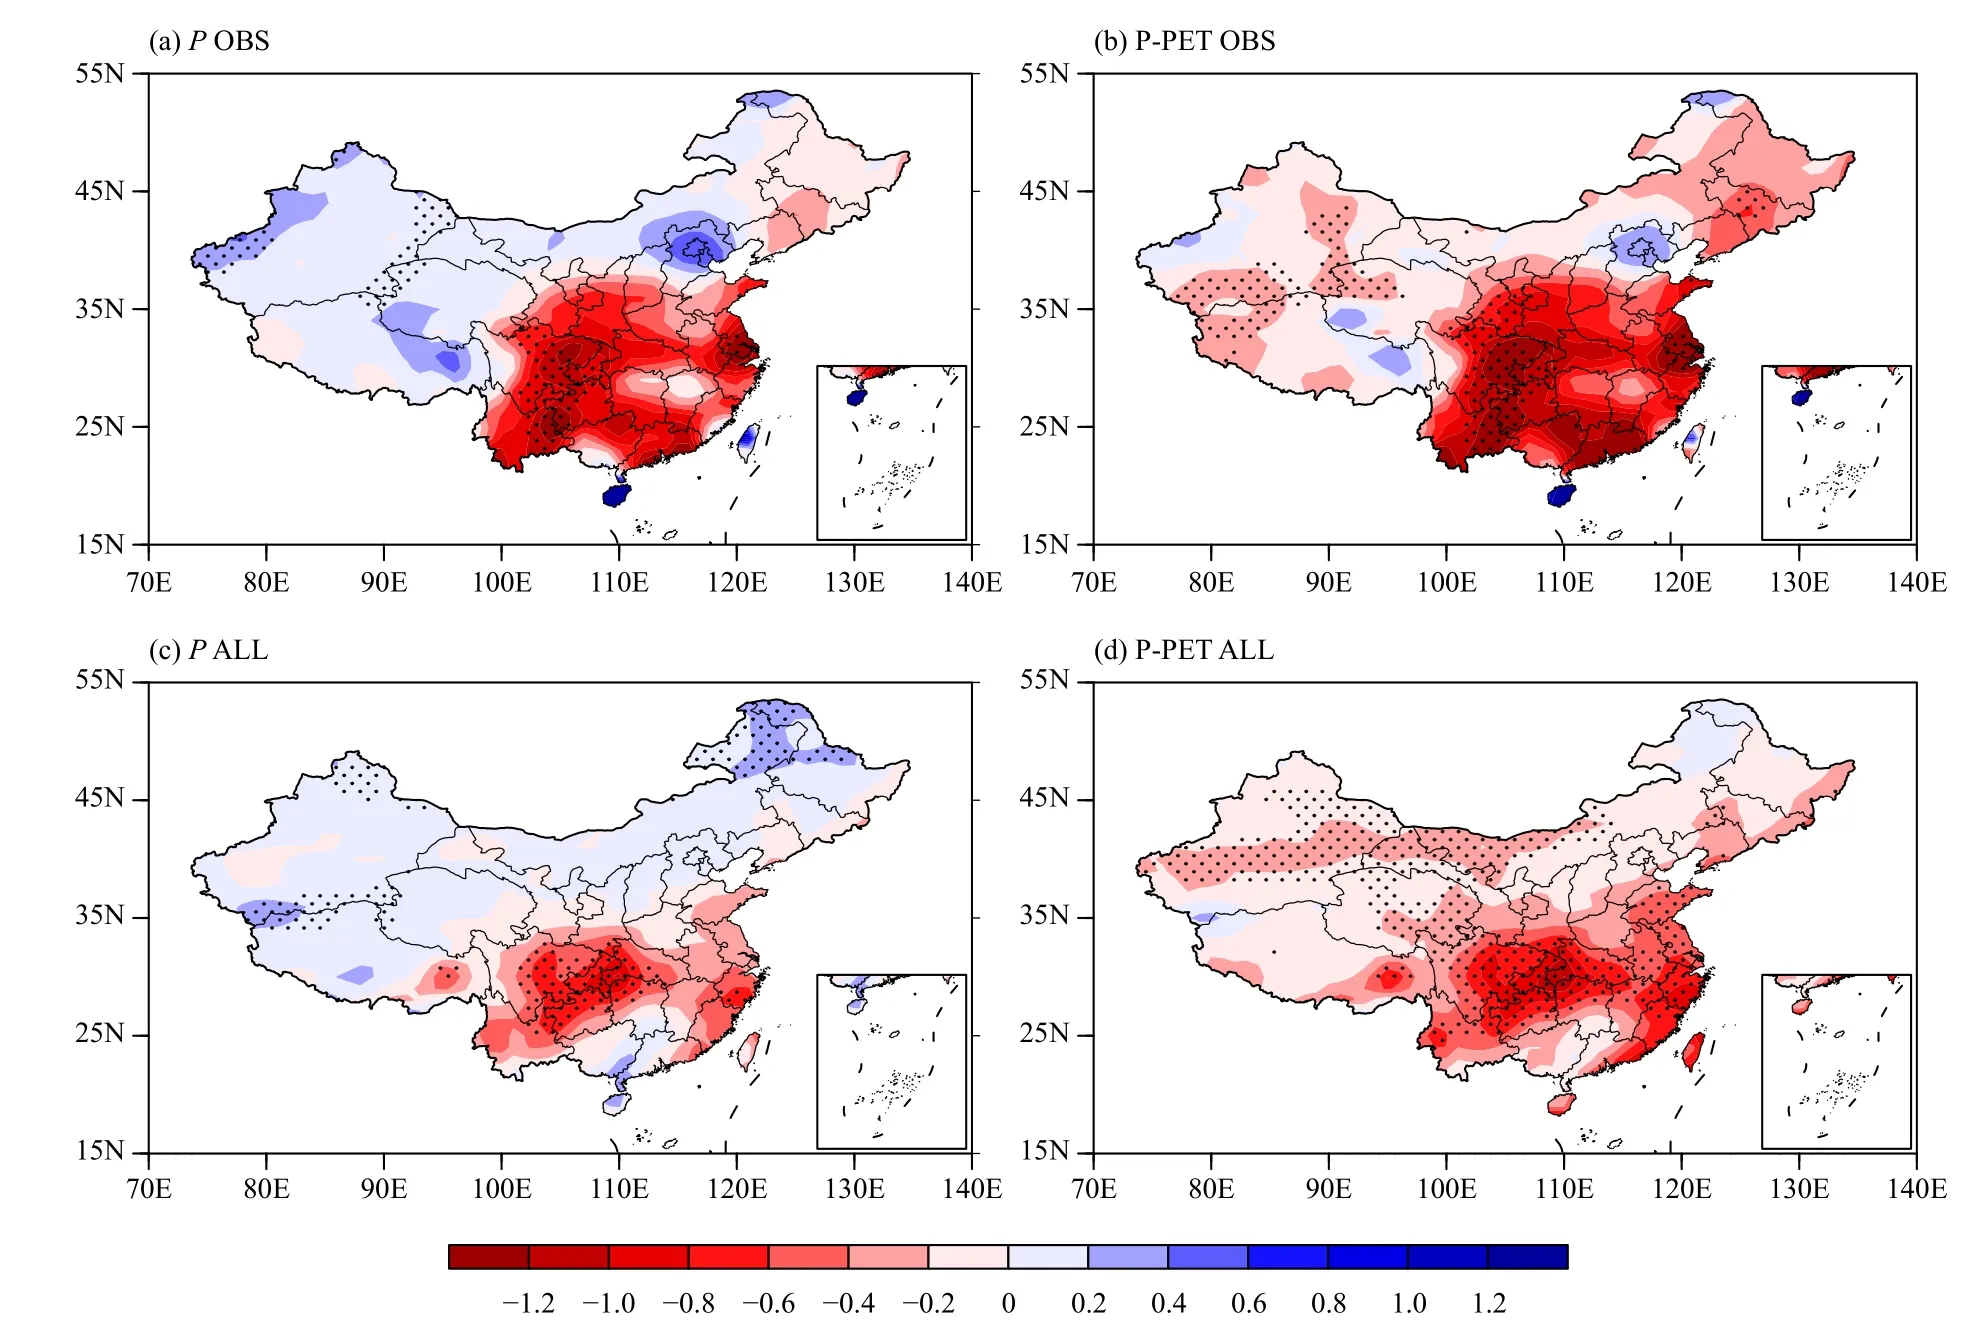
Fig. 1. Geographic distributions of temporal trends (from 1961 to 2014, mm yr-1) for autumn (September–October–November accumulation)(a) P and (b) P-PET in OBS. Panels (c) and (d) are their counterpart in the simulation ALL with all climate forcing in the 11-member multimodel ensemble. Dotted areas indicate the statistical significance at 95% confidence level.
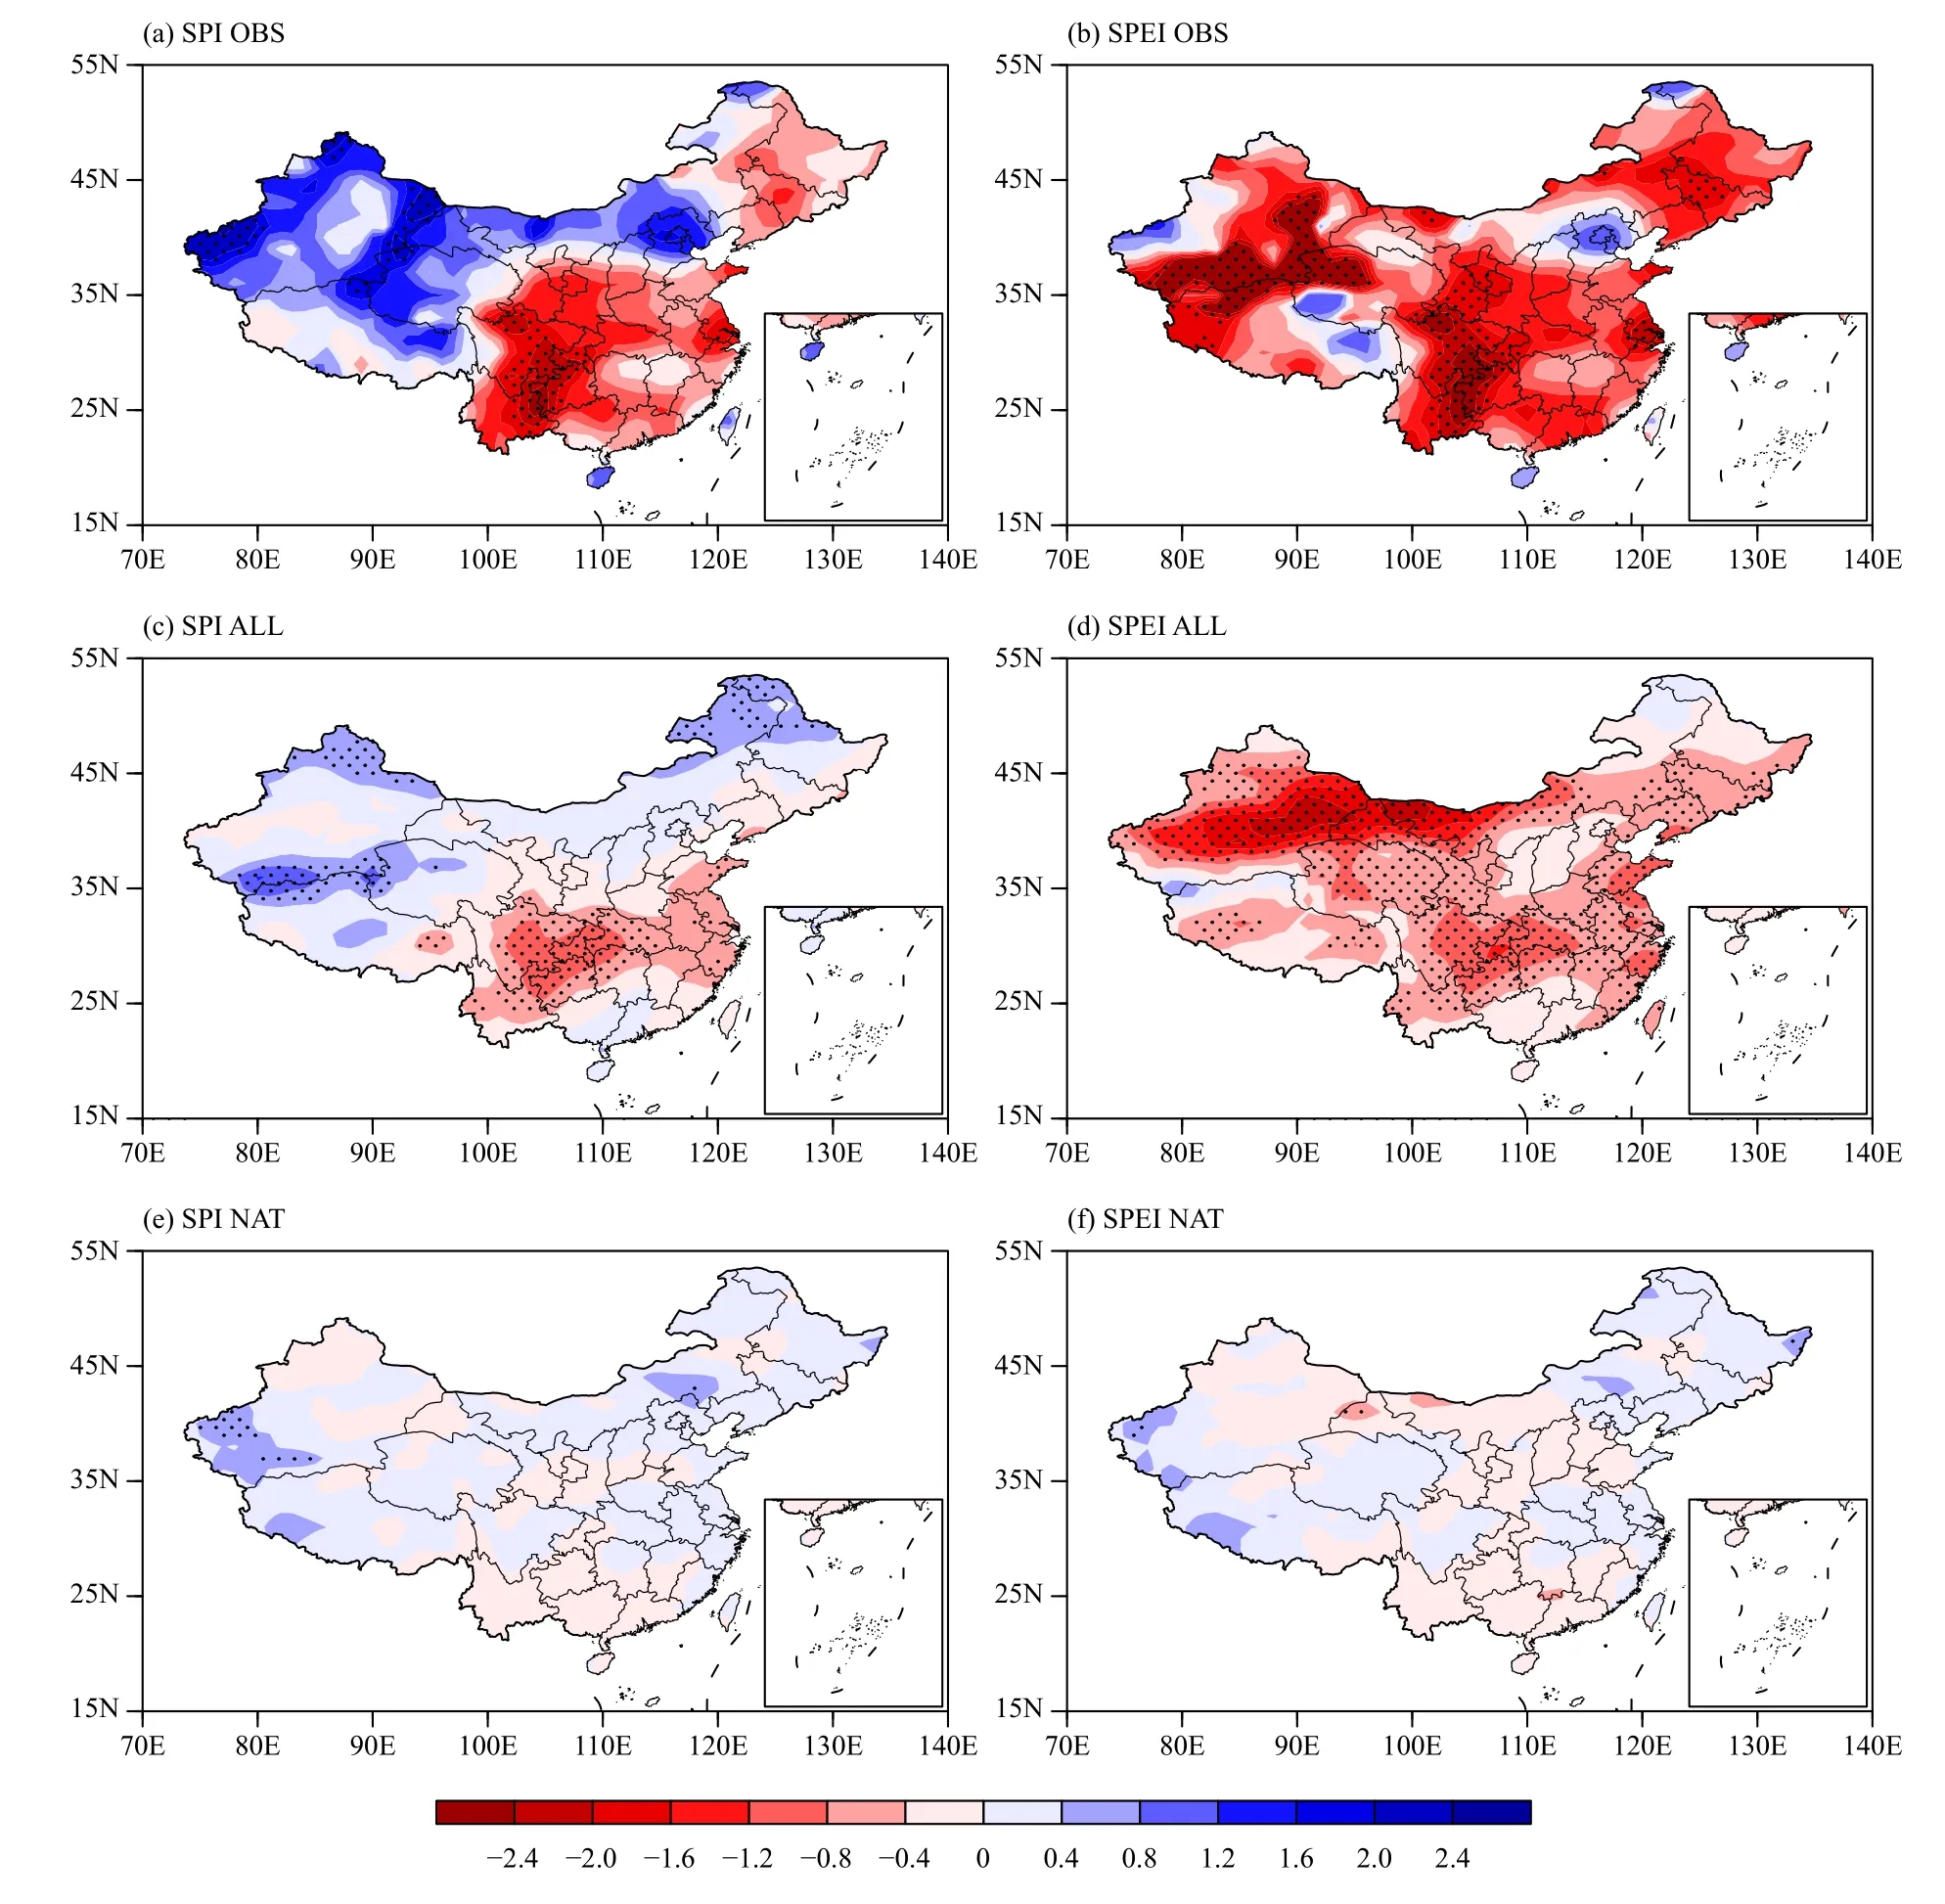
Fig. 2. Panels (a–d) as in Fig. 1, but for SPI (left) and SPEI (right) (unitless index per hundred years). Panels (e) and (f) are the counterpart deduced from the natural-forcing simulation NAT. Dotted areas indicate the statistical significance at 95% confidence level.
3.2 The detectability in trend signal
It is clear now that, for both SPI and SPEI trends, a robust structure across China can be identified in ALL and considered as the signal or fingerprint of climate change.In consideration of the similarity in the trend of SPI or SPEI between OBS and ALL, we want to know whether this signal is formally detectable in observation. To do so, we use the concept of fingerprint (Hegerl et al., 1996)and the associated methodology largely used in traditional attribution researches (Stott and Tett, 1998). The fingerprint is actually the spatial pattern reflecting the response of climate to external forcing (Allen and Stott,2003). In our work, the relevant fingerprint is the climate response pattern deduced from ALL. Our goal is to find out whether this fingerprint signal can be detected in OBS. We also attempt to detect the NAT trend pattern signal as a reference. In this way, we can simply compare ALL and NAT detection results to assess the anthropogenic impact.
The detection method, as described in Stott and Tett(1998), Allen and Stott (2003), and Christidis and Stott(2021), mainly consists of verifying whether a detection variable falls outside a certain threshold of noise, the noise being the natural variability in an unforced climate.The detection variable in our work is the projection (dot product) of the trend pattern from OBS onto the fingerprint. Similarly, the noise is the dot product of the fingerprint and the trend pattern from CTL. In order to be consistent with the time span of OBS, CTL is sliced into 174 segments, and each segment contains 54 yr as OBS has.The dot product of the fingerprint and the trend patterns of these 174 segments makes an ensemble of 174 values,and forms the noise distribution. As generally practiced with this methodology, we take the 90th percentile as a threshold to determine the detection of climate change signal in OBS.
We can see that the signal can be detected in both SPI and SPEI (Fig. 3), but it is obvious that the signal detected in SPEI is stronger than that in SPI, which once again proves the influence of temperature increase on autumn drought. In parallel to the signal detection with ALL (all forcing), that with NAT (only natural forcing) is also presented in Fig. 3. It is quite obvious that the signal or the fingerprint from NAT (almost inexistent as in Figs.2e, f) cannot be detected in OBS, with the detection variable around zero. We can now confidently conclude that the relevant signal detected in ALL actually reflects anthropogenic effects.
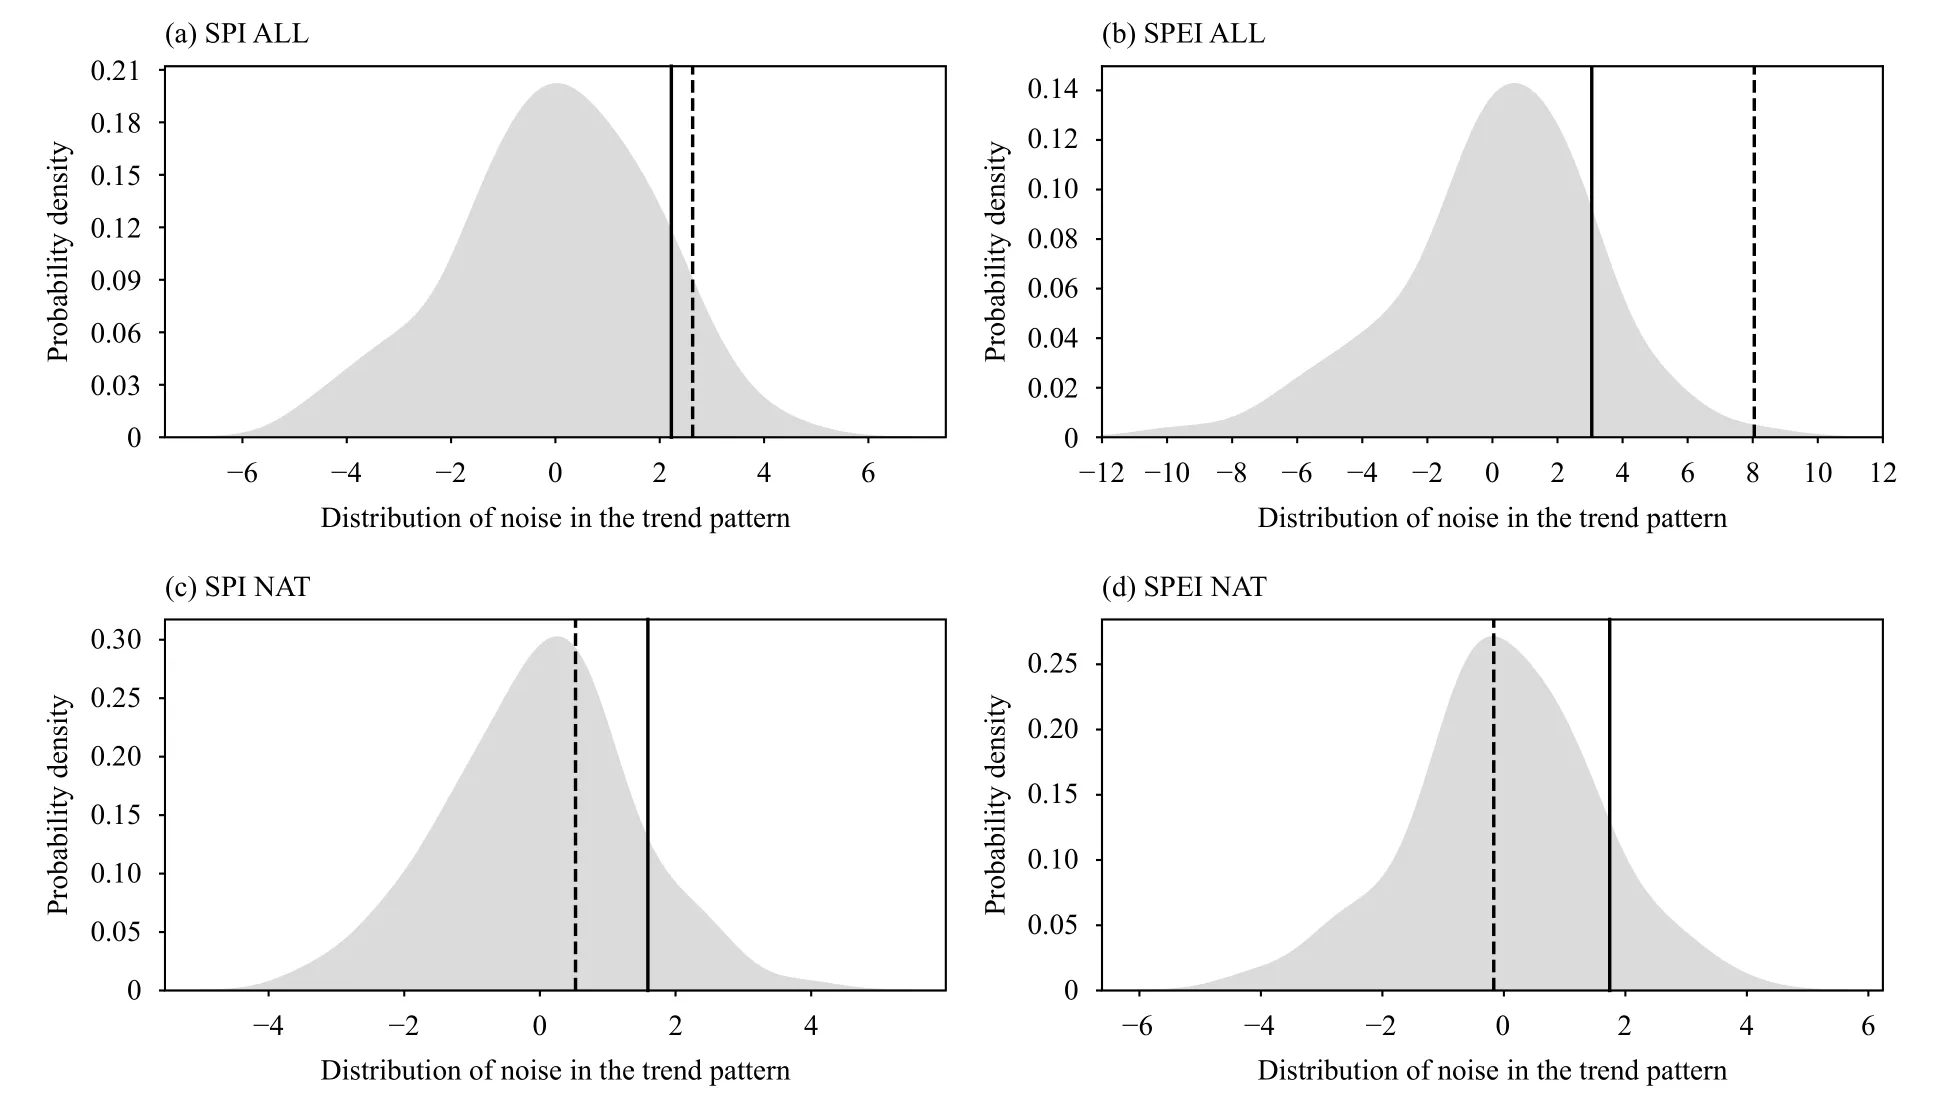
Fig. 3. The detection in OBS of the (a) SPI and (b) SPEI trend signal (from 1961 to 2014) for whole China’s autumn drought. The abscissa is the range of noise calculated as a dot product of the fingerprint (the trend pattern of ALL) and the control simulation without identifiable signals.The gray shading indicates the probability density distribution of the noise, with the 90th percentile marked by the solid vertical line. The dashed vertical line indicates the detection variable (calculated in the same way as the noise, but from the observation) of the signal in ALL (all-forcing simulation). Panels (c) and (d) are the same, but for NAT (natural forcing simulation).
We also performed the same fingerprint signal detection for every single model. The results are shown in Table 2 with the detection variable and the threshold of 90% probability. The detection for each individual model aims to examine whether the conclusion of the ensemble detection is robust. As listed in Table 2, 7 of the 11 models can successfully detect the signal of SPI trend pattern.When it comes to SPEI detection results, all models can detect the right signal. The number of successful models increases from 7/11 for SPI to 100% in SPEI, which reflects the fact that the more robust temperature variation makes the detection variable easier to pass the threshold of noise. It indicates that the temperature tends to make more contribution to the autumn droughts in China than precipitation does.

Table 2. Results of the fingerprint signal detection in 11 climate models
3.3 Changing risk of extreme droughts
Let us now examine the attribution issue of extreme droughts with the commonly used concept of probability ratio (PR) or risk ratio (Allen, 2003; Stott et al., 2004;Fischer and Knutti, 2015). Here, we consider SPI and SPEI below -2 as extreme droughts and we calculate PR for each grid point in China. The results are shown in Fig. 4 in the form of geographic distribution across China.
In Fig. 4a, PR in most areas is greater than 1, with only a few exceptions in NWC. It is clear that autumn extreme droughts in most areas of China (except NWC)are enhanced by precipitation changes attributable to human activities (ALL versus NAT), although precipitation (Fig. 1c) and SPI (Fig. 2c) show both increasing trend in vast areas of China in the north of 35°N and in a small region in South China. Figure 4a also shows that the PR values in SWC and SEC are especially high. Constructed with extreme droughts of SPEI, Fig. 4b shows that PR is generally greater than 1 across whole China except a few insignificant areas. It is clear that the synergistic effect of precipitation variation and temperature increase enhances the probability for autumn extreme droughts to occur across China.
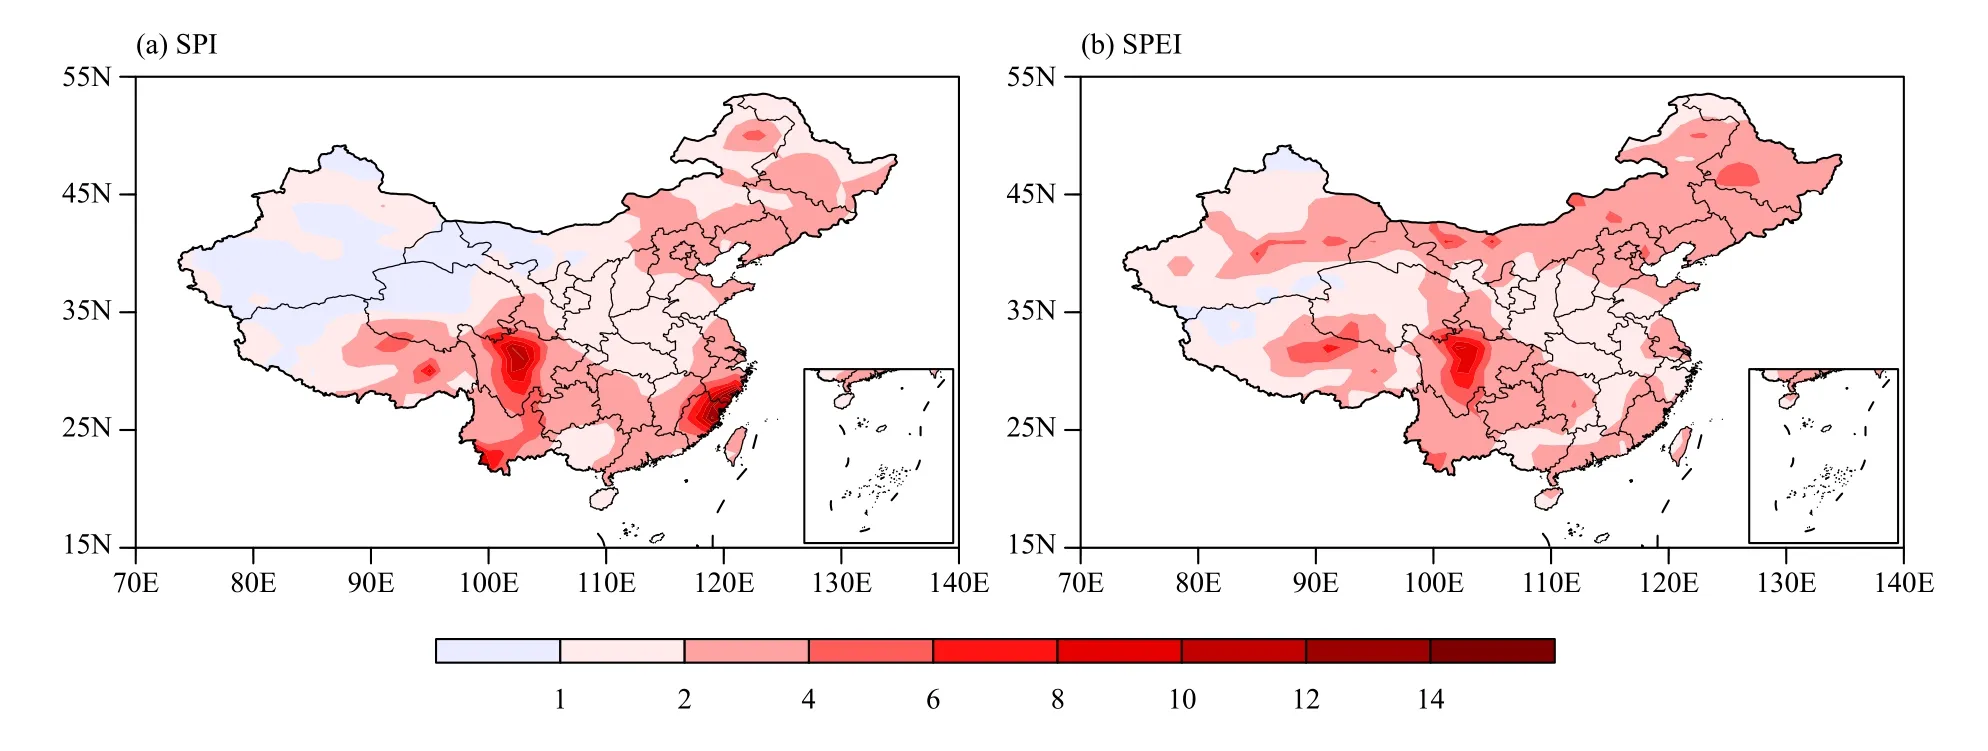
Fig. 4. Geographic distributions of probability ratio for autumn extreme droughts in (a) SPI and (b) SPEI.
A closer inspection on Figs. 4a and 4b reveals subtle differences between SPI- and SPEI-based extreme droughts. They show different behaviors in the south and north of 35°N. We inspect firstly the south. From SPI to SPEI, PR gets minor decrease in SWC, but significant decrease in SEC. This means that the autumn extreme droughts in SWC and SEC are dominated by effect of precipitation and temperature effect reduces that of precipitation to some extent. In the north of 35°N, the increase of PR from SPI (Fig. 4a) to SPEI (Fig. 4b) is obvious. Most NWC areas end up with PR values greater than 1 and NEC also rises to higher values. It is clear that temperature rise plays an important role leading to autumn extreme droughts in northern China. In summary, the role of anthropogenic activity in autumn extreme droughts is beyond any reasonable doubt, and effects of precipitation and temperature show subtle differences in southern and northern China.
4. Conclusions
The objective of this work is to assess how well climate models from the latest CMIP6 project can simulate trends of autumn drought in China in the recent historical period from 1961 to 2014. We also attempt to examine if the fingerprint of drought trend produced by anthropogenic climate change can be detected in observation. We extracted data from 11 CMIP6 models to explore the multimodel ensemble average. The simulation piControl without any external forcing is used to establish the background noise distribution. The simulations ALL (with all forcings) and NAT (with only natural forcing) are used to evaluate the signal of autumn drought. We use both SPI and SPEI to assess drought. The former is a transformation of precipitation rate, and the latter furthermore takes into account the potential evapotranspiration PET, which is calculated with the TH method, a simple formula, but helpful for us to compare the effects of precipitation and temperature. We can draw some conclusions as follows:
(1) The simulated spatial pattern of drought trend for either SPI or SPEI in ALL is very close to that of OBS,which shows a good performance of CMIP6 models,taken as an ensemble. For SPI, the north of 35°N mainly shows wetting trend but drying trend is mainly manifested in the south. For SPEI, almost whole China shows drying trend.
(2) The trend pattern signal in ALL can be significantly detected in OBS no matter whether we consider the influence of temperature or not. However, the signal detected in temperature-considered SPEI is more robust and stronger than in SPI. In most individual models, we can draw the same conclusion.
(3) We also investigated the probability of occurrence for extreme droughts with the index SPI or SPEI smaller than -2. We use the NAT and ALL simulations to calculate their respective probability and the results are presented in terms of PR (probability ratio or risk ratio)between the two simulations: probability in ALL over probability in NAT. There is a general increase of probability in ALL across China, making the risk ratio larger than 1. A few areas show PR smaller than 1 in Northwest China for SPI. If we compare PR between the two indices SPI and SPEI, we can note an imaginary demarcation line around 35°N, with two different behaviors. The increasing precipitation plays a leading role in the south,just as the temperature increase does in the north.
Finally, we recognize some limitations of our work that we need to deal with in future, including the only focus on autumn drought and on single drought index(whatever SPI or SPEI). We need to extend our work to other seasons and to more comprehensive drought index in combination with other climate extreme phenomena.Another issue that we would pursue in the future would be on the search of physical mechanisms responsible for the variation of droughts in the changing world. It is also to be noted that we are planning, in our future work, to investigate separately the role of greenhouse gases and aerosols, both relevant to anthropogenic activities.
 Journal of Meteorological Research2022年2期
- Journal of Meteorological Research的其它文章
- An Updated Review of Event Attribution Approaches
- CMIP6 Projections of the “Warming–Wetting” Trend in Northwest China and Related Extreme Events Based on Observational Constraints
- Deep Learning for Seasonal Precipitation Prediction over China
- Contribution of Winter SSTA in the Tropical Eastern Pacific to Changes of Tropical Cyclone Precipitation over Southeast China
- Diagnostic Quantification of the Cloud Water Resource in China during 2000–2019
- Factors Influencing Diurnal Variations of Cloud and Precipitation in the Yushu Area of the Tibetan Plateau
