Early life migration and population discrimination of the small yellow croaker Larimichthys polyactis from the Yellow Sea: inferences from otolith Sr/Ca ratios*
Dade SONG , Ying XIONG , Tao JIANG , Jian YANG , Xiaming ZHONG ,Jianhua TANG
1 College of Marine Sciences, Shanghai Ocean University, Shanghai 201306, China
2 Jiangsu Marine Fisheries Research Institute, Nantong 226007, China
3 Key Laboratory of Fishery Ecological Environment Assessment and Resource Conservation in Middle and Lower Reaches of Yangtze River, Freshwater Fisheries Research Center, Chinese Academy of Fishery Sciences, Wuxi 214081, China
Abstract The small yellow croaker Larimichthys polyactis is a benthic marine f ish species of high ecological and commercial importance and is widely distributed in the northwestern Pacif ic Ocean, especially in the Chinese coastal waters of the Bohai, Yellow, and East China Seas. As a highly migratory species, the whole life migration of L. polyactis has been intensively studied. However, knowledge about its early life migration is scarce, and population divisions are inconsistent, limiting the ability of f ishery scientists and administrators to evaluate the design and potential benef its of thorough conservation and resource-management strategies.In the present study, otolith Sr/Ca was analyzed to investigate the early migratory patterns and discriminate the populations of L. polyactis in the Yellow Sea, including two spawning groups and one overwintering group. The variation in Sr/Ca ratios of ontogenetic growth zones, including the nucleus (N), larval (L),metamorphosis (M), juvenile (J), and edge (E) zones, was measured by electron probe microanalysis. The variation in Sr/Ca ratios in early developmental growth zones was generally characterized by an evident downward trend from the N to J zone, which suggests that the early migratory pattern of L. polyactis might be from inshore to nearshore water. Canonical discriminant analysis, based on the otolith Sr/Ca ratios of the N, L, M, and J zones, allowed the successful discrimination of the two populations, namely, the northern and southern Yellow Sea groups, whose diff erences were mainly ref lected in the L and J zones. Compared with previous studies, the traditional geographic boundaries (34°N) separating these two populations might be moving northward. The application of otolith Sr/Ca ratios based on ontogenetic stage could improve our understanding of the migration and population discrimination of L. polyactis from the Yellow Sea.
Keyword: otolith microchemistry; Larimichthys polyactis; early life migration; population discrimination;the Yellow Sea
1 INTRODUCTION
The benthic small yellow croakerLarimichthyspolyactis(family: Sciaenidae) is endemic to the northwestern Pacif ic Ocean, including the Bohai,Yellow, and East China Seas (Fishbase, 2019). This species is a multiple spawner with persistent and directional movement annually (Lee et al., 2020).Inshore or coastal waters are major spawning and nursery areas, and overwintering grounds are located in off shore areas (Lim et al., 2010). Previous studies have focused on the population division and migration ofL.polyactisowing to its high ecological and commercial importance (Wang et al., 2013, 2016a;Zhang et al., 2014, 2020; Xiao et al., 2015; Xiong et al., 2016;). Although progress has been made regarding the whole life migration (Lin, 1987; Liu,1990; Lee et al., 2020), the larval-dispersal component of connectivity remains unclear, limiting our understanding of population dynamics. Previous studies revealed that the spawning grounds ofL.polyactishave expanded from nearshore to off shore waters based on environmental DNA (Wang et al.,2020) and catch data (Lin et al., 2008). Previous studies based on catch data, otolith morphology, and population genetics have generated inconsistent results for population division, especially regarding theL.polyactisin the Yellow Sea (Xiong et al., 2021).In addition, the natural resources ofL.polyactishave severely decreased since the 1970s due to increasing f ishing eff orts (Xiong et al., 2017b; Ma et al., 2020).Comparing its historical biological characteristics,distinct trends in biological parameter changes have been observed, such as miniaturization, younger age,and earlier maturation, but with f ishing eff ort remaining at a high level (Zhang et al., 2016; Lee et al., 2020; Li et al., 2020). Therefore, there is an urgent need to further our understanding of the early life migration and population discrimination ofL.polyactisto improve the sustainable utilization of this economically important f ishery resource.
Connectivity, the exchange of larvae, juveniles, or adults across a species’ range, plays a fundamental role in metapopulation dynamics, genetic diversity,and the resiliency of populations to human exploitation(Botsford et al., 2001; Cowen et al., 2007). It is necessary to obtain basic life history information(including migration, habitat selections, foraging and reproductive locations, home-range characteristics,and spatial-temporal dispersal) to understand the relationship between f ish and the environment they inhabit (Cooke et al., 2013). It is critical to identify the movement patterns among habitats during the lifespan of species, which determine the appropriate spatial scale for f ishery management (Gillanders,2005; Carlson et al., 2017). Accurately characterizing f ish migration and population structure is a longstanding goal for the management of sustainable f isheries because it is based on the understanding of f ish movement across complex oceanographic and inshore environments over large spatial scales (King and McFarlane, 2003; Ovenden, 2013). Furthermore,in many cases, it is impractical to directly observe their movements to estimate population connectivity in marine environments (Lowe and Allendorf, 2010).
The classif ication of diff erent migrant individuals or populations can be based on a number of techniques,including visual censuses of tagged individuals(Walker et al., 2011), electric tagging (acoustic sounding and satellite-tracking tags) (Sedberry and Loefer, 2001), and the autologous chemical markers,such as calcif ied otoliths (Jiang et al., 2017; Delerue-Ricard et al., 2019; Schulz-Mirbach et al., 2019).Otolith microchemistry is superior to the other approaches used to determine f ish migration patterns because every f ish is innately tagged. In addition, the traditional tagging methods only off er information on the location and time of capture and recapture,whereas otolith microchemistry can provide habitat environmental information over a lifetime.
The potential for using otoliths as a tool to identify and track diff erent populations is reliant on the elements, such as Sr/Ca, being incorporated into discrete layers of otolith material that form daily (Arai et al., 2019). Therefore, the otoliths provide a precise elemental log over the lifetime of a f ish. In previous studies, otolith ratios of Sr/Ca have been used as habitat environmental markers for wild diadromous f ish, even being successful in corresponding studies that used limited (e.g. <10) otolith samples (Chatterjee et al., 2015; Jiang et al., 2016; Chino et al., 2018). The otolith Sr/Ca ratio is inf luenced by environmental factors, including ambient water chemistry, salinity,and temperature (Elsdon and Gillanders, 2003;Taddese et al., 2019), with minor inf luence from diet(Milton and Chenery, 2001). The relationship can be predicted between ambient environmental variables and otolith Sr/Ca (Jiang et al., 2017), which can be used to reconstruct f ish movement patterns through environmental gradients based on otolith Sr/Ca ratios(Liu et al., 2011). Trace elements are not decomposed after daily deposition (Elsdon et al., 2008); hence, the chemistry of the otolith core represents the early life history and the otolith edge ref lects the water conditions during the most recent period of the f ishing area. Indeed, reconstructing migratory patterns (Dou et al., 2012; Tran et al., 2019), discriminating natal or nursery origins (Jiang et al., 2017; Rogers et al.,2019), and assessing the contributions of diff erent larval areas to adult populations (Zlokovitz et al.,2003; Delerue-Ricard et al., 2019) have been accomplished with otolith Sr/Ca ratios. Furthermore,Xiong et al. (2021) revealed temporal stability in the otolith Sr/Ca ratio ofL.polyactisin the southern Yellow Sea. Therefore, otolith Sr/Ca can be a useful indicator for tracking the migratory paths of f ish based on the reconstruction of environmental histories as recorded in the layers of the otolith (Reis-Santos et al., 2015; Avigliano et al., 2017).
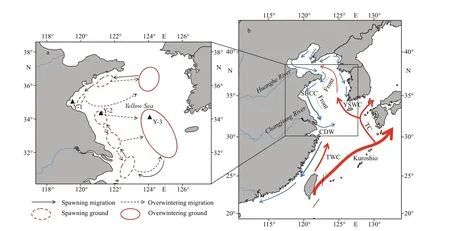
Fig.1 Sampling locations (▲) and migratory routes of Larimichthys polyactis in the Yellow Sea and major surface currents in winter
We hypothesised that the early life migration ofL.polyactiswas from inshore to nearshore waters in the Yellow Sea. To test this hypothesis, the otolith Sr/Ca ratio ofL.polyactiswas compared between diff erent growth zones to conf irm the shift in habitat and characterize early life migration. In the present study, we investigated three groups ofL.polyactisfrom spawning and overwintering grounds of the Yellow Sea, and attempted to do the following:(1) investigate the characteristics of early life migration using the otolith Sr/Ca ratios of diff erent growth zones, and (2) use the Sr/Ca ratio prof iles to discriminate populations further.
2 MATERIAL AND METHOD
2.1 Sample collection and otolith preparation
A total of 30 adultL.polyactiswere collected from spawning grounds along the coastal waters of the Yellow Sea and overwintering ground off the Yellow Sea, including 10 from Y-1, 10 from Y-2, and 10 from Y-3 (Table 1; Fig.1a) in 2017 and 2018. All f ish were randomly sampled from catches by commercial vessels operating the gill net (mesh size 50 mm). All samples were stored at -4 °C until further analysis in the laboratory. In all cases, all specimens were measured (body length in mm) and weighed (bodyweight in g) before being dissected. The sex and maturity of f ish gonads were determined by visual examination. Sagittal otoliths were extracted fromL.polyactis, dried, weighed, and stored in plastic tubes.Two experienced readers counted the number of annuli in the otolith to conf irm the age. By analyzing the gonad maturity and sampling location, theL.polyactisfrom Y-1, Y-2, and Y-3 were found to be in their pre-spawning, spawning, and wintering periods, respectively.L.polyactiscan reach sexual maturity at 1 year old (Lin et al., 2008), and thus, the life history of these adults covers one complete migration. Detailed information of samples for otolith microchemistry analysis is shown in Table 1.

Table 1 Detailed information of Larimichthys polyactis for otolith microchemistry analysis
2.2 Electron probe microanalysis method
The procedures for analyzing the otolith Sr/Ca ratios ofL.polyactisfor use in electron probemicroanalysis (EPMA) measurement followed those described by Jiang et al. (2017) and Xiong et al.(2021). All pre-prepared sagittal otoliths were mounted in clear epoxy resin (EpoFix; Struers,Copenhagen, Denmark) and thin-sectioned with a diamond cup wheel (Discoplan-TS; Struers,Copenhagen, Denmark) in the sagittal plane. Thin sections were adhered to glass microscope slides with AB glue and sanded to the core encircled by clear daily rings on both sides with 1 200-2 000 grit SiC paper and further polished with 0.3-μm alumina on an automated polishing wheel to remove major scratches(Labopol-35, struers, Copenhagen, Denmark).Thereafter, the otoliths were sonicated in an ultrasonic cleaner for 5 min and cleaned with deionized water.Finally, all samples were dried and carbon coated with a high vacuum evaporator (JEE-420, JEOL Ltd.,Tokyo, Japan) for further analysis.
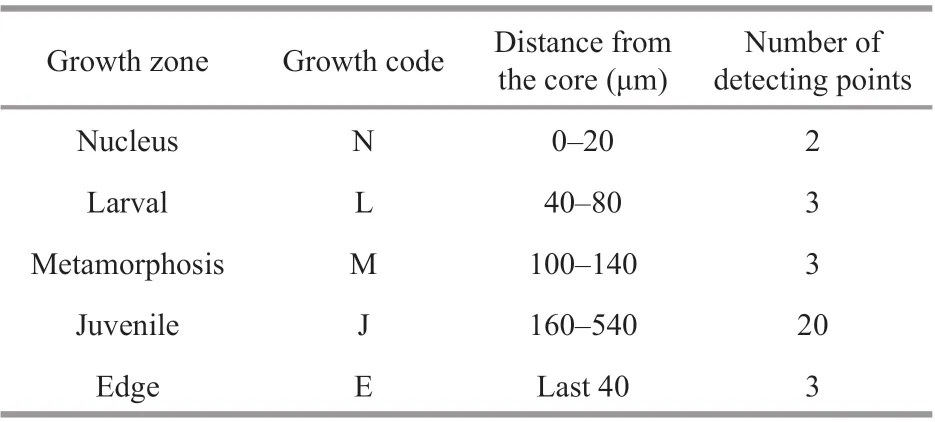
Table 2 Characteristics of the otolith Sr/Ca ratios of Larimichthys polyactis from Y-1, Y-2, and Y-3
Otolith sections for EPMA analysis were prepared following the procedure described by Jiang et al.(2017), but with a slight modif ication. Otolith Sr and Ca were measured along the longest straight line from the core to the edge (i.e. otolith radius) using an electron probe microanalyzer (JXA-8100; JEOL Ltd.). Quantitative analyses were performed under the following beam conditions: 20 nA for the beam current, 15 kV for accelerating voltage, and a 3-μm diameter circular scanning beam, with measurements spaced at 20-μm intervals. Commercial standards of tausonite (SrTiO3) and calcite (CaCO3) (Institute of Mineral Resources, Chinese Academy of Geological Sciences, Beijing, China) were used to calibrate the Sr and Ca concentrations in the otoliths.
2.3 Selection of diff erent developmental stages and signal processing
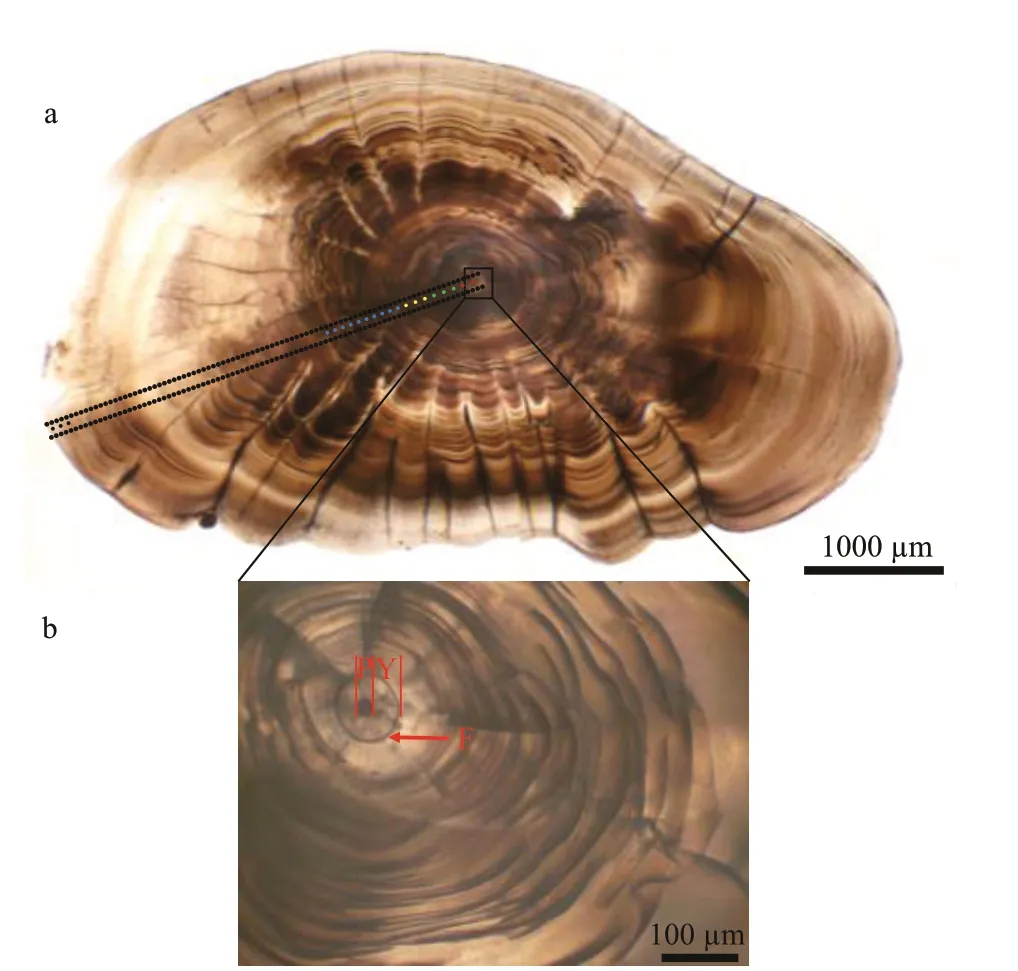
Fig.2 Larimichthys polyactis sagittal otoliths showing spots of otolith chemistry analysis and microstructure characteristics
Primary increments were validated as being daily inL.polyactis, and characteristic marks represent incubation, f irst feeding, and metamorphosis during the larval and juvenile stages (Li et al., 2013; Zhan et al., 2016; Xiong et al., 2017a; Zhang et al., 2019b).Based on the above-cited studies and focusing on the relationship between otolith microstructure and growth increment ofL.polyactis, f ive zones along the transect analyzed were isolated to measure the Sr/Ca ratios (Table 2; Fig.2a): (1) the “nucleus” (N)zone is the area within hatching increments that are associated with the embryonic stage comprising the primordium and yolk sack (Zhan et al., 2016). As shown in the Fig.2b, the f irst feeding check appeared on the 4thincrement with a distance of 20.67±2.28 μm to the central nucleus, displaying larger width, deeper color, and high clarity (Li et al., 2013; Zhang et al.,2019b); (2) the “larval” (L) zone is associated with the larval phase, during whichL.polyactisbegan to feed on the zooplanktivorous Copepoda,Euphausiacea, and Mysidacea (Xue et al. 2005;Xiong et al., 2017a); (3) the “metamorphosis” (M)zone corresponds to the metamorphosis period characterized by the presence of sub-daily increments(Zhang et al., 2019b) and transition from larval to juvenile (Li et al., 2013). The sub-daily otolith increments ofL.polyactisduring the early life history display irregularity and incompleteness compared with daily increments, particularly from the L zone to J zone, which caused diffi culties in the integration of daily increments to investigate the early life migration; (4) the “juvenile” (J) zone just after metamorphosis ref lects the signature of the nursery ground colonized at demersal settlement with a change in the feeding strategy to mainly feeding on demersal shrimp and f ish (Xue et al., 2005; Xiong et al., 2017a); (5) the “edge” (E) zone corresponds to the last weeks before being captured, representing the signature of the sampling location.

Fig.3 Sr/Ca ratio variation in diff erent growth zones for Larimichthys polyactis from Y-1, Y-2, and Y-3
2.4 Data analysis
In conventional otolith research, otoliths were analyzed for Sr and Ca and reported as ratios of Sr to Ca amplif ied by 1 000 by a conversion based on the molecular mass of CaO and SrO. Statistical analyses were performed using Origin 2021 (Originlab,Northampton, MA, USA). In addition, a sequential regime shift algorithm was used to determine signif icant changes in the mean Sr/Ca ratio during the lifespan according to Rodionov and Overland (2005).The parameters of the regime shift algorithm were set as follows: cut-off length: 5, Huber’s weight parameter: 1, and probability level: 0.5.
One-way analysis of variance (ANOVA) was applied to determine the diff erences in otolith Sr/Ca ratios of (1) the same growth zone ofL.polyactisamong the three sampling groups, and (2) diff erent growth zones in the same sampling group. In order to meet the assumptions for normality and homogeneity of variance for data analysis, the averaged data for each otolith were computed and subsequently log10 transformed. To evaluate the use of Sr/Ca ratios of diff erent growth zones as a predictive tracer for f ish groups, canonical discriminant analysis (CDA) was carried out. Cross-validated classif ication accuracy was analyzed for each group. Considering that the capture date ofL.polyactisfrom the three sampling locations was not consistent, the Sr/Ca ratios of the E zone were not applied to CDA.
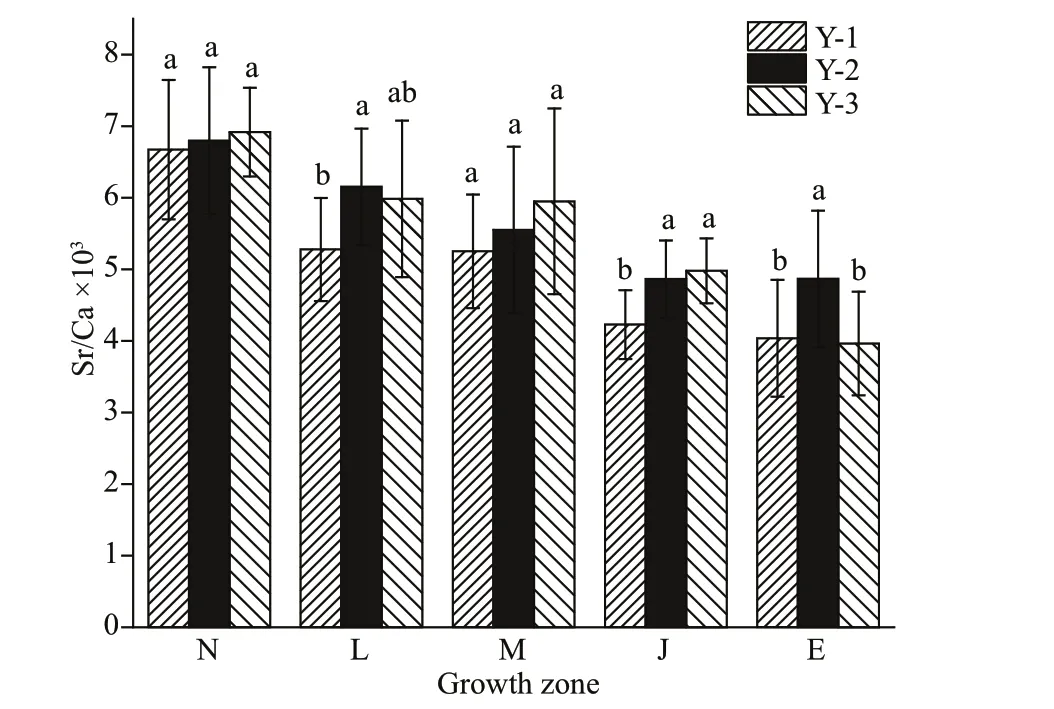
Fig.4 Sr/Ca ratio variation in the same growth zones for Larimichthys polyactis from Y-1, Y-2, and Y-3
3 RESULT
3.1 Temporal and spatial variation in otolith Sr/Ca ratios
The 30 specimens ofL.polyactisfrom Y-1, Y-2, and Y-3 shared a common feature: the Sr/Ca ratios were higher in the N zone, and then decreased sharply to the E zone (Fig.3). Values in the N zone were signif icantly higher than those in the other zones (P<0.05). No signif icant diff erences were observed in the Sr/Ca ratios between the L and M zones in Y-1, Y-2, and Y-3 (P>0.05);nevertheless, there was a signif icant diff erence between the M and J zones in Y-1, Y-2, and Y-3 (P<0.05),suggesting that the variables of the environment inhabited byL.polyactisremained unchanged from the L zone to M zone but changed from the M zone to J zone.
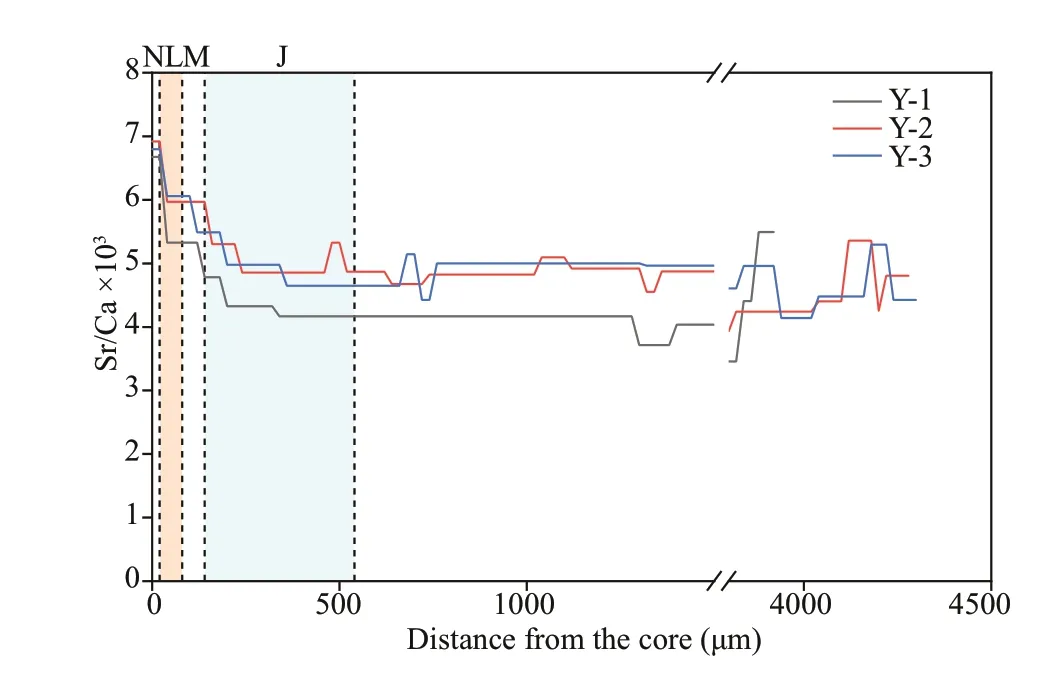
Fig.5 Fluctuations in weighed otolith Sr/Ca ratios along the line transects from the core (0 μm) to the edge in the sagittal plane of Larimichthys polyactis
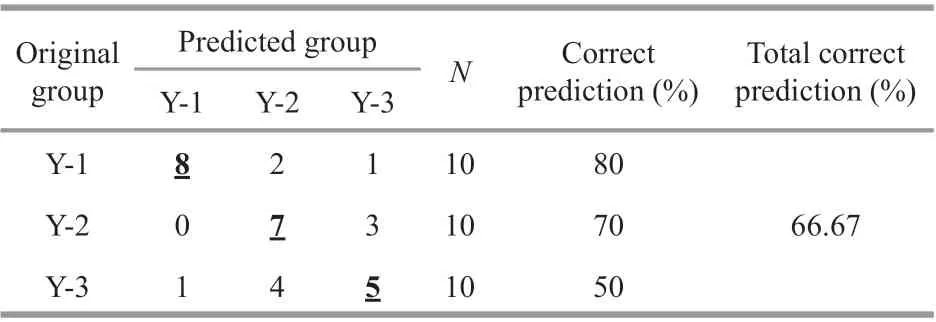
Table 3 Percentage of individuals assigned to diff erent groups of Larimichthys polyactis based on the canonical discriminant analysis by using the Sr/Ca ratios of N, L, M, and J zones
By analyzing the spatial diff erences between Y-1,Y-2, and Y-3, the Sr/Ca ratios of the L, J, and E zones in Y-2 were found to be signif icantly higher than those of Y-1 (Fig.4,P<0.05). Although the Sr/Ca ratios of the L zone showed no signif icant diff erences between Y-3 and Y-1, the Sr/Ca ratios of Y-3 were evidently higher than those of Y-1. The Sr/Ca ratios of the J zone in Y-3 were signif icantly higher than those of Y-1 (Fig.4,P<0.05). The Sr/Ca ratios of the N, L, M,and J zones showed no signif icant diff erences between Y-2 and Y-3 (Fig.4,P<0.05).
3.2 Regime shift of otolith Sr/Ca ratios during predevelopmental stage
The Sr/Ca ratio (mean±SD) of Y-1, Y-2, and Y-3 during the pre-developmental stage, including N, L,M, and J zones, was 4.33±0.58, 5.04±0.52, and 5.03±0.52, respectively. There was no signif icant diff erence between Y-2 and Y-3 (P>0.05), whereas signif icant diff erences were observed between Y-1 and Y-3, and between Y-1 and Y-2 (P<0.05). By analyzing the Sr/Ca ratios based on the aforementioned sequential regime shift algorithm, two distinct Sr/Ca shifts were observed between the N and L zones, and between the M and J zones, suggesting that the environmental variable or ontogenetic stage had changed (Fig.5).
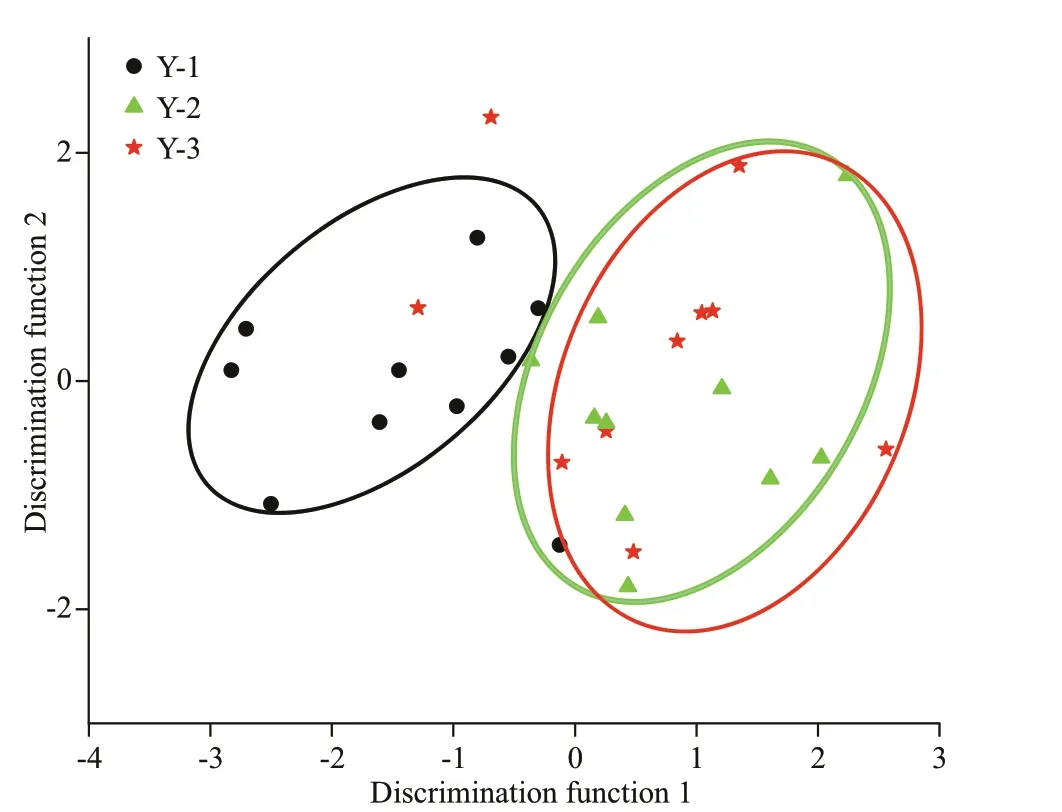
Fig.6 Scatter plot of canonical discriminant analysis showing the separation of Larimichthys polyactis from Y-1, Y-2, and Y-3
3.3 Population discrimination
Overall, spatial diff erences were ref lected in the assignment to individual groups. The percentage of good assignment of these samples to their actual group with CDA (jackknife cross-validation) was 80% for Y-1, 50% for Y-3, and 70% for Y-2. The overall accuracy of discrimination was 66.67%.Furthermore, 40%L.polyactisof Y-3 and 30% of Y-2 were misjudged as belonging to the opposite groups(Table 3), and a strong overlap in Sr/Ca ratios was observed between Y-3 and Y-2 (Fig.6). The discriminant analysis provided a visual separation among Y-1, Y-3, and Y-2 (Fig.6), in which the f irst canonical variable explained 94.31% of the variance,and the second canonical variable explained 5.69% of the variance. A total of 30 individuals from three locations were clearly divided into two groups,namely, the northern Yellow Sea group represented by the Y-1 group and the southern Yellow Sea group represented by the Y-3 and Y-2 groups.
4 DISCUSSION
To fully understand population connectivity, it is vital to develop a process-based understanding of dispersal, which explores how hydrodynamic and biological processes interact to disperse the larvae at diff erent spatiotemporal scales (Cowen et al., 2007).Nevertheless, the combination of otolith chemistry and process-oriented approaches promises a truly predictive understanding of larval dispersal and connectivity (Cowen et al., 2007). Our results revealed how the Sr/Ca ratios vary from the N zone to J zone in the otoliths and the diff erences in the same growth zone among Y-1, Y-3, and Y-2, combined with environmental variables (salinity, temperature, and currents) to explore how this phenomenon has arisen.Clustering the Sr/Ca ratios of the N, L, M, and J zones pointed to two groups, verifying the existence of largescale spatial connectivity (>350 km) between the spawning and overwintering grounds ofL.polyactis.
4.1 Variation in Sr/Ca ratios and the possible factors
Natal homing, or philopatry, is a life history characteristic shared by many f ishes (Cowen et al.,2007). Natal f idelity has important ramif ications for population connectivity, population persistence, and the potential management of f ish populations(Gahagan et al., 2012). Hence, attention should be paid to the phenomenon that eggs, yolk-sac, and pref lexion larvalL.polyactiswere mainly distributed in Chinese inshore waters at depths >30 m, whereas post-f lexion larvae and juveniles were mainly distributed in the relatively shallow waters at depths of approximately 10 m (Lin et al., 2018). The pelagic larval developmental stage is a vital phase in marine f ish during ontogenetic migration and can inf luence population recruitment, including connectivity,dispersal, and survival (Cowen et al., 2007). Owing to their lack of suffi cient swimming ability, pre-f lexion larvae usually passively drift with ocean currents(Miller and Kendall, 2009). Usually, pre-f lexion larvae are located “down-stream” of ocean currents from natal sites (Lin et al., 2018). The inshore abundance ofL.polyactiscould be recruited by planktonic larvae from distant places by coastal currents such as the Lubei Coast Current (LBCC), the Subei Coastal Current (SBCC), and the Yellow Sea Warm Current (YSWC) (Xiong et al., 2017a; Zhang et al., 2020). Post-larvae and juveniles are known to be able to actively migrate to nurseries (Zhan et al.,2016). The shallower waters used as nursery grounds could provide suffi cient nutriment for foraging until the f ish develop suffi cient swimming ability to avoid predation (Lin et al., 2008).
In the present study, the otolith microstructure comprised the N, L, M, and J zones during the early developmental stages. The Sr/Ca ratios of early developmental stages were generally characterized by a downward trend from the N zone to J zone, which is consistent with the results of Xiong et al. (2017a).Elements that are incorporated into otoliths are likely derived from either water or diet (Milton and Chenery,2001; Elsdon and Gillanders, 2003; Taddese et al.,2019). Sr/Ca ratios are believed to be negatively correlated with ambient temperature and positively correlated with ambient water salinity (Arkhipkin et al., 2004; Liu et al., 2011). Taking the Changjiang(Yangtze) River estuary and adjacent waters as an example, before the occurrence of juveniles (i.e. early April to June), the SST gradually increases from low(9-12 °C; Lin et al., 2018) to high (21-25 °C; Dai et al., 2018), and from deeper waters at depths >30 m to the shallower waters at depths of about 10 m, the sea surface salinity (SSS) gradually decreased from high(25-30; Lin et al., 2018) to low (5-15; Lin et al.,2018). The decreasing Sr/Ca ratios from the embryonic stage to juveniles may be explained by an increase in SST and a decrease in SSS. Moreover, a signif icant diff erence was observed between the N, M, and J zones among three sampling locations (P<0.05). The time of metamorphism from larvae to juvenileL.polyactis, corresponding to the M zone in the present study, occurred at the mean age of 37 days in the Lvsi spawning ground (Li et al., 2013) when the f irst otolith secondary primordium had formed. The small yellow croaker experiences a shift in hydrodynamic habitat from the larval to juvenile stages (Xiong et al., 2017a), and the diet changes at a body length of 20-29 mm, which is equal to the length during the juvenile stage (Guo et al., 2010). The Sr/Ca ratios of the E zone forL.polyactisin Y-2 were higher than those in Y-1 (P<0.05), which can be further verif ied by the capture time and location of Y-2 (i.e.April, inshore) and Y-1 (i.e. May, nearshore) (Fig.1a;Table 1). In summary, the early migratory route ofL.polyactismight be from inshore to nearshore waters. Although the migratory route from the embryonic stage to juvenile ofL.polyactisis clear,the detailed migratory route from overwintering to spawning grounds remains unclear. Combined with the maturity of f ish gonads and sampling location ofL.polyactisfrom Y-1 (pre-spawning period) and Y-2(spawning period), we inferred that its spawning migration might be from the overwintering grounds to the nearest nearshore waters of the Shandong Peninsula, then southwards along the Lubei Coast Current (LBCC), ending in inshore waters for spawning.
It is worth noting that the Sr/Ca ratios of the embryonic stage were generally higher than those of larvae and juveniles, which is consistent with the phenomenon found inCollichthyslucidus(Liu et al.,2015),Anguillajaponica(Tzeng, 1996; Tsukamoto and Arai, 2001), andMiichthysmiiuy(Xiong et al.,2015). Three reasons likely led to such a high Sr concentration in the N zone. First, the high element concentration within otoliths is thought to be due to the ontogenetic stage. Changes in the life history of f ish result in changes to both the morphology and physiology of individuals, for example, ingestion from endogenous to exogenous nutrition and growth from egg to larvae (Elsdon and Gillanders, 2003).Yatsu et al. (1998) revealed that the element concentrations of Sr and Ca in otolith cores ofOmmastrephesbartramiiwere probably diff erently aff ected during the embryonic stage compared with other ontogenetic stages.L.polyactisconsumed the yolk sac completely on the 6thday after hatching, and subsequently, initially fed on the exogenous nutrition with a weak feeding ability (Zhan et al., 2016).Second, these specimens were caught from wild groups, and therefore, environmental variables of Sr/Ca ratios that could cause this change (i.e. salinity and temperature) cannot be ruled out.L.polyactismainly spawn in inshore seas at depths >30 m where the SSS is 25-30, and the SST is 9-12 °C (Dai et al., 2018;Lin et al., 2018). The interaction of lower temperature and higher salinity may lead to a high Sr/Ca ratio in the N zone. Third, a previous study suggested that the otolith core may require large amounts of protein during the calcif ication process (Murayama et al.,2004), and another study suggested that the otolith core has a lower Ca concentration than the edge(Dove et al., 1996). Higher concentrations of protein and lower concentrations of Ca could lead to high concentrations of other elements related to Ca.Elements that replace Ca in the calcium carbonate matrix as their primary inclusion method in otoliths,such as Sr (Campana, 1999), may lead to a high Sr/Ca ratio in the N zone. The third reason is likely to result in changes of the elemental composition of the otolith inf luenced by the biomineralization process. Although the habitat environment is often assumed to be the most important factor aff ecting the otolith elemental signatures, certain extrinsic and intrinsic factors can confuse the simple correlations between them(Walther, 2019).
4.2 Populations of Larimichthys polyactis in the Yellow Sea
The signif icant f inding in the present study was the compelling support for the spawning group of Y-2 and the overwintering group of Y-3 being the same group representing the southern Yellow Sea and the spawning group of Y-1 being another group representing the northern Yellow Sea. These results were also demonstrated by the f indings of Lin (1987),Liu (1990), and Zhang et al. (2014). According to the above studies, 34°00′N has traditionally been regarded as the geographic boundary separating the northern Yellow Sea group and the southern Yellow Sea group ofL.polyactis(Liu, 1990; Zhang et al., 2019a; Zhu et al., 2020). In the present study, Y-1 (35°00′N,119°30′E) located in Haizhou Bay exhibited signif icant diff erences in the Sr/Ca ratios of early developmental stages compared with Y-2 (34°21′N,121°10′E) and Y-3 (34°05′N, 124°05′E), and the Y-2 and Y-3 groups were clustered as one group.Consequently, compared with the results ofL.polyactisreported in the 1990s (Liu, 1990), the northern geographical distribution boundary of the southern Yellow Sea group might have potentially moved northward. This phenomenon is also supported by the f inding that the northern and southern Yellow Sea groups co-exist in Haizhou Bay (Y-1) (Jiang et al., 2019; Zhang et al., 2014).
The diff erences in geographical and water environments in the Yellow Sea may lead to the division ofL.polyactis. First, the Yellow Sea is a typical semi-enclosed shallow sea located between the eastern part of Chinese mainland and the Korean Peninsula (31°40′-39°50′N, 119°35′-126°50′E). The northern, and southern Yellow Sea covers an area of approximately 80 000 km2at an average depth of 38 m and 300 000 km2at an average depth of 45.3 m,respectively (Liu, 2013). The deepest areas of the northern and southern Yellow Sea are off Bailingdao Island and Cheju Island, respectively (Liu, 2013).Second, water masses vertically mixed under the inf luence of strong wind and formed a mass of lowtemperature cold water in winter in the central, deeper part of the Yellow Sea, and the mass of lowtemperature cold water remains under a thermocline at 15-30-m depth in summer (Liu, 2013). The lowtemperature properties of the YSCWM in summer protect the cold-adapted fauna (Sun et al., 2010), such asCalanussinicusandEuphausiapacif ica, serving as food for diff erent growth stages ofL.polyactistoward the over-wintering grounds (Xue et al., 2005). Third,the hydrodynamic conditions of the Yellow Sea are mainly inf luenced by continental runoff and costal current, particularly in the western coastal waters,where the seasonal variation in salinity, temperature,and currents is distinct. In winter and early spring, the YSWC deriving from the northward Kuroshio and Taiwan Warm Current invades into the central Yellow Sea (Lin et al., 2011) (Fig.1b). Two frontal waves emerged in off shore areas, one off Shandong Peninsula and the other off northern Jiangsu Province (Huang et al., 2018) (Fig.1b). The frontal wave was sharply contrasted between the warm saline YSWC and cold fresh LBCC and SBCC, which may result in the distribution of southern and northern Yellow Sea groups ofL.polyactis(Huang et al., 2018). In the present study, clear otolith Sr/Ca diff erences were found between the southern Yellow Sea group (Y-2 and Y-3) and the northern Yellow Sea group (Y-1),which might be attributed to the geographical environment, water mass, and hydrological front.
In recent decades, genetic data from putatively neutral markers and genome scan approaches have been extensively used to understand the population genetics ofL.polyactis. However, these applications have demonstrated the main limitations in charting the population structure. These subpopulations may have relatively recently expanded but require suffi cient time to diff erentiate. Alternatively, this species may be able to overcome the eff ects of genetic drift due to its high migration capability (Wang et al.,2013; Zhang, 2019). Recent otolith morphometric studies, discriminating theL.polyactisalong the Chinese coast, showed an overall classif ication success rate of 80.0% and 82.0% obtained using the elliptic Fourier transform and discrete wavelet transform, respectively (Song et al., 2018). In a recent otolith chemistry study, Wang et al. (2016b) compared the stable isotopes of δ18O and δ13C in otoliths ofL.polyactisfrom the Yellow Sea and the Bohai Sea,and successfully discriminated the population group with 85.7% classif ication accuracy. The results of the present study provide further evidence that otoliths could be a valuable tool for delineating population structure. In conclusion, the results of the present study verif ied the assumption that otolith Sr/Ca ratio probed by EPMA is a credible scalar for charting the life migration and discriminating populations ofL.polyactis. The present study preliminarily revealed the characteristics of population discrimination ofL.polyactisin the Yellow Sea. In following work, we intend to investigate the elemental composition of the nucleus using laser ablation inductively coupled plasma mass spectrometry (LA-ICPMS) for population identif ication ofL.polyactissimilar to work carried out in previous studies (Wang et al.,2009; Avigliano et al., 2017).
5 CONCLUSION
The Sr/Ca ratios of early developmental stages were generally characterized by a downward trend,which suggests thatL.polyactisspawn in inshore waters and feed in nearshore waters, and the three groups analyzed were divided into two populations,namely, the northern Yellow Sea group (Y-1) and the southern Yellow Sea group (Y-2 and Y-3), which verif ies the existence of large-scale spatial connectivity(>350 km) between spawning and overwintering grounds. The application of the Sr/Ca ratio based on ontogenetic stage is recommended for early life migration analysis and population discrimination.
6 DATA AVAILABILITY STATEMENT
The data generated and/or analyzed in this study are available from the corresponding author upon reasonable request.
7 ACKNOWLEDGMENT
The authors are grateful to all scientif ic staff and crew for their assistance with sample collection and experimental implementation.
 Journal of Oceanology and Limnology2022年2期
- Journal of Oceanology and Limnology的其它文章
- Identif ication of Antarctic minke and killer whales with passive acoustic monitoring in Prydz Bay, Antarctica*
- Eff ects of dissolved oxygen and nutrients from the Kuroshio on hypoxia off the Changjiang River estuary*
- Methane in the Yellow Sea and East China Sea: dynamics,distribution, and production*
- Longitudinal genetic analysis of growth-related traits in red swamp crayf ish Procambarus clarkii (Girard)*
- A new oil spill detection algorithm based on Dempster-Shafer evidence theory*
- The phycocyanin-chlorophyll-protein complexes isolated from Chroomonas placoidea*
