Longitudinal genetic analysis of growth-related traits in red swamp crayf ish Procambarus clarkii (Girard)*
Hui WANG , Yi ZHANG , Guoliang CHANG , Nan WU , Zhiqiang XU , Jianqing TANG
1 Jiangsu Engineering Laboratory for Breeding of Special Aquatic Organisms, Life Science School of Huaiyin Normal University,Huai’an 223300, China
2 Jiangsu Freshwater Fisheries Research Institute, Nanjing 210017, China
Abstract The red swamp crayf ish, Procambarus clarkii, is an economically important species especially in China. Their exoskeleton places serious constraints on growth and culture management. Their growth is achieved through intermittent molting/ecdysis. The longitudinal genetic dynamics for growth-related traits at diff erent ecdysial points in P. clarkii has been unclear to date. In this study, conditional genetic analysis was carried out for growth-related traits (body weight, body length, chela length, and cephalothorax length)based upon a mixed genetic model with conditional additive, dominance, and genotype by environment eff ects in P. clarkii. A complete diallel cross was made among three geographic populations of P. clarkii for the genetic mating design. Results of the conditional genetic analysis showed that from 4 th molt to 9 th molt the conditional additive variations were increased signif icantly whereas the conditional non-additive genetic variations (dominance and genotype by environment interaction) were decreased signif icantly for these growth-related traits. This indicated that lots of new expression of additive eff ect genes for body weight,body length, chela length, and cephalothorax length occurred during ontogeny, and environment played a signif icant role in the expression of genes aff ecting these growth-related traits. Growth of the four traits was mainly aff ected by non-additive genetic eff ects in early developmental stage (prior to 4 th molt). The cumulative conditional additive variation for the growth-related traits from 4 th molt to 9 th molt accounted for a large majority of the total conditional additive variations from 2 nd molt to 9 th molt, indicating that this period was very important for the growth of this species. Using the conditional analysis method, dynamics of growth-related traits during an important ontogenetic phase of red swamp crayf ish was uncovered. Our results provide valuable insights into ref ining production of this species.
Keyword: mating design; conditional genetic analysis model; Procambarus clarkii; genetic eff ect;conditional variance component; longitudinal genetic analysis
1 INTRODUCTION
As is well known that a quantitative trait is aff ected by polygenes. When these polygenes at many loci segregate simultaneously, genetic variability of the quantitative trait will be modif ied by non-genetic interactions such as intra-locus (dominance) and inter-locus interaction (epistasis) (Lynch and Walsh,1998; Lutz, 2001). In conjunction with the modif ication by environment, the underlying genetic control of a quantitative trait may change signif icantly during ontogeny of organisms (Walsh and Lynch,2018). For example, Vasemägi et al. (2016) reported that a substantial proportion of growth-related quantitative trait Loci (QTLs) detected in farmed conditions had no eff ect onSalmosalargrowth in the wild. Similar results were documented inSalvelinusalpinusby Chiasson et al. (2013). Accordingly, the genetic assessment for a population should be carried out in a dynamic manner. Based upon the individual animal model, researchers have conducted the genetic assessment in some populations of aquatic animals,such asOncorhynichusmykissandSalmotrutta(Bonnet et al., 1999),Oreochromisniloticus(Lozano et al., 2011),Megalobramaamblycephala(Luo et al.,2014; Zhao et al., 2016),Crassostreagigas(Kong et al., 2015), andScophthalmusmaximus(Wang et al.,2019b). Furthermore, environmental eff ects were eliminated from phenotypic variation when genetically evaluating the population ofO.niloticus(Trọng et al., 2013), and ofSparusaurata(García-Celdrán et al., 2015). Predicated upon the genetic model with additive, dominance and genotype by environment interaction, non-genetic eff ects such as dominance and dominance by environment interaction were removed from phenotypic variation inProcambarusclarkii(Wang et al., 2019a).Nevertheless, these assessments of genetic variability were undertaken only using the phenotypes at a specif ic temporal point of ontogeny. For instance, He et al. (2011) utilized the phenotypic values obtained at 150 days of age to evaluate the genetic variability inFenneropenaeuschinensiswhile Lozano et al. (2013)assessed the genetic variability using the phenotypes at 53 days of age inO.niloticus. The genetic variation revealed by analyzing the phenotypic values in the above studies can provide knowledge about accumulated genetic eff ects only suitable for a specif ic developmental phase. In this case, the dynamic changes in genetic variability cannot be embodied,since the actions and interactions of genes vary over time (Walsh and Lynch, 2018).
To understand the longitudinal changes in genetic variability, researchers have examined the variations of genetic eff ects with time (day/month or generation)in some populations of aquatic animals, such asPenaeusvannamei(Campos-Montes et al., 2013),Haliotisrufescens(Brokordt et al., 2015),Macrobrachiumrosenbergii(Luan et al., 2015), andS.salar(Thorland et al., 2020). For example,Domingos et al. (2013) evaluated the genetic variability for traits (weight, standard length, body depth, Fulton’s condition factor, and body shape index) at 62 and 273-469 days post hatch inLatescalcarifer. The genetic variability was examined only at several isolated time points in these studies, and no information attained at prior time points was used upon conducting the genetic evaluation. Due to existence of a common genetic base, there exist a correlation to varying extents between the same traits measured at diff erent time points (Zhu, 1996; Atchley and Zhu, 1997; Lynch and Walsh, 1998; Wang et al.,2006, 2015). When the information derived at prior time point(s) is used, the dynamics of genetic variability at a posterior time point would be more accurately exhibited (Zhu, 1996; Wang et al., 2006,2015).
Procambarusclarkiiis a species that is widely distributed over the world, occupying diff erent kinds of habitats, including subterranean situations, wet meadows, seasonally f looded swamps and marshes,and permanent lakes and streams (Lutz, 2001;Holdich, 2002; Longshaw and Stebbing, 2016). As with all other crustaceans, crayf ish are protected by their jointed exoskeleton. This seriously constrains growth or ultimate size, since any permanent increase in size is only possible after shedding the rigid exoskeleton. Meanwhile, it also imposes important constraints on management practices involved in their culture. Crayf ish thus grow not continuously, but stepwise morphologically. Hence, the growth process of crayf ish involves periodic molting interspersed with intermolt periods. The exoskeleton and its molting cycle dominate the life of these animals.Molting means growth. That is, molting is the crucial growth point over ontogeny of this species. Increase in size depends on both growth/molt (growth increment) as well as molt frequency. Crayf ish require at least eleven molts to sexual maturity (Holdich,2002; Longshaw and Stebbing, 2016). Under optimum conditions, for example, crayf ish can increase up to 15% in length and 40% in weight in a single molt,depending on temperature and food abundance(Holdich, 2002; Longshaw and Stebbing, 2016). InP.clarkii, genetic evaluation for growth-related traits has been documented by Lutz and Wolters (1999), Li et al. (2016), and Wang et al. (2019a), but these genetic evaluations are carried out using only the phenotypes measured at 150 days of age.
Red swamp crayf ish are now commercially very important in China. Its total production has reached one million tons with a gross output value of ca.$40 billion (Wang et al., 2019a). Due to indeterminate growth, crayf ish continue to molt throughout their lives (Holdich, 2002; Longshaw and Stebbing, 2016).A knowledge of the genetic dynamics underlying the growth-related traits at important molting points is fundamental to the production of this species. Since the causal components of phenotypic variability in a population is usually analyzed by genetic variance components for the traits of interest (Zhu, 1996;Atchley and Zhu, 1997; Lynch and Walsh, 1998; Lutz,2001; Walsh and Lynch, 2018), the causal genetic components of phenotypic variability for four growthrelated traits measured at diff erent molting times inP.clarkiiare examined in this study. The objective of the present study is to clarify the longitudinal dynamics of genetic eff ects for the growth-related traits measured at diff erent molting points by using a conditional genetic analysis method. Based upon the architecture and characteristics of the conditional genetic and non-genetic eff ects obtained, the genetic changes over the ontogeny ofP.clarkiiwould be elucidated. Results would provide valuable information for commercialized production of the red swamp crayf ish.
2 MATERIAL AND METHOD
2.1 Broodstock sourcing
In the crayf ish cultivation base, Huai’an Xindayun Eco-Fisheries Development Co., Ltd., which is located in Huaihe Town, Xuyi County, Huai’an City,Jiangsu Province. There are three diff erent geographic crayf ish populations reserved: Guantan population,Yanghe population, and Dapu population. These populations were collected respectively from Guantan township of Xuyi county, Yanghe township of Suqian city, and Dapu township of Yixing city of Jiangsu Province, China. Suffi cient femaleP.clarkiithat had displayed moderate to advanced cement gland development were chosen from each population in May of 2019, and were held individually in partitioned 50-L polyethylene tanks supplied with aerated tap water recirculated through a biological f ilter in our laboratory (Jiangsu Engineering Laboratory for Breeding of Special Aquatic Organisms). Together with the females, mature males from each geographic population were also chosen for reproduction. These broodstocks were acclimated in our laboratory for one week. Over the acclimation, broodstocks were given a commercial pelleted feed (40% crude protein,9% lipid), supplemented with the aquatic weeds,Alternantheraphiloxeroides(Mart.) Griseb andElodeanuttallii. Temperature was 25- 27 °C.
2.2 Mating design
The diallel cross mating design was used in our study. Since late May 2019, a complete diallel cross(male: female=1:4 within each mating combination)among these geographical populations ofP.clarkiiwas conducted in our laboratory to construct the off spring populations of red swamp crayf ish. There were a total of 9 off spring populations produced, 3 for within-population combinations, and 6 for reciprocal combinations. Each mating combination was conducted in a polyethylene tank (120 cm×100 cm×60 cm, water depth 10- 15 cm). Several arc shaped tiles were placed at the bottom of each tank as nests to prevent cannibalism. Aeration was exercised continuously to provide enough dissolved oxygen.Broodstocks were fed once daily with the diet as given above. Feces were siphoned off daily. After mating, berried females were collected from the tank for each mating combination, and cultured individually in a round polyethylene tank (diameter 50 cm, height 60 cm) for hatching. Daily management for the berried females were the same as given above. When the larvae were hatched out and began to leave the brood females to fend themselves after larvae molted two times, the brood females were taken out from the round tank. Thus, third-instar larvae for each mating combination that were used for our experiment were obtained.
2.3 Identif ication of crayf ish
Polyethylene tanks (3.2 m×0.65 m×0.15 m, water depth 10- 15 cm) were each partitioned as small divisions (0.3 m×0.3 m) using nylon net (mesh size 2 mm). Only one third-instar larva (0.04± 0.03 g) was cultured in each small division. For all practical purposes, third-stage (instar) crayf ish are miniature adults and are fully capable of living apart from their mother (Holdich, 2002; Longshaw and Stebbing,2016). A total of 450 third-instar larvae were used for the experiment, 50 third-instar larvae for each mating combination. Due to being individually partitioned,each crayf ish could be completely identif ied, and thus its ecdysis observed and recorded. Exuviated shells were removed timely to prevent from eating them after it had molted. The survival of crayf ish was monitored every day. Water ionic calcium content was regularly checked to ensure its levels were not lower than 2 mg/L (Longshaw and Stebbing, 2016).Other daily managements were the same as described above. The same experiment was carried out once more in May of 2020 in our laboratory.
2.4 Data measuring
Although an increase in growth and length occurs only at the molt, the internal physiological growth is continuous. Crayf ish growth is typically determined from external measurements of a known hard part or from weight increments at molt (Jussila and Evans,1998; Lutz, 2001). According to Holdich (2002) and Longshaw and Stebbing (2016), the number of molts from third-instar larvae to maturity in the red swamp crayf ish is nine. In our study, following four growthrelated traits over the entire experimental period(from third-instar larvae to maturity) were measured at diff erent molting points: total body weight (BW, g),body length (BL, mm, from tip of rostrum to hind edge of telson), chela length (CHL, mm, from tip of chela to hind edge of propodite), and cephalothorax length (CL, mm, from tip of rostrum to hind edge of cephalothorax). The four growth-related traits were measured after 2 days of each molting when the new cuticle was hardened (at this time the f inal shell layer,the thin and inner un-calcif ied membranous layer was complete). All measurements of the four growthrelated traits were obtained at nine molts each. Size traits were measured microscopically (Olympus,CX21) to 5thmolt, then measured using a Vernier caliper to 9thmolt. Body weight was measured using an electronic balance (Ohaus, AR224CN).
2.5 Genetic analysis model
For longitudinal data of a quantitative trait, the genetic eff ect at timetcan be broken down into two portions, the accumulated genetic eff ect at a prior timet- 1 and the incremental genetic eff ect from timet- 1 tot(Zhu, 1996; Atchley and Zhu, 1997). The phenotypic values observed at timetare to varying degrees correlated with the ones observed at timet- 1(Lynch and Walsh, 1998). In this study, the following matrix-form mixed genetic model with f ixed and random eff ects (additive, dominance, and genotype ×environment interactive eff ects) was used for analyzing the conditional phenotypic data attthmolt of red swamp crayf ish:

where P(t|t-1)is the conditional phenotypic value of the trait of interest attthmolt; b(t|t-1)is the conditional f ixed eff ect vector attthmolt, including conditional population mean and environmental eff ect (year) and tank eff ect. X is the incidence matrix of conditional f ixed eff ects with coeffi cients 1 or 0. eA(t|t-1)is the random conditional additive eff ect vector attthmolting, eA(t|t-1)~ (0,σ2A(t|t-1)I). UAis the incidence matrix of conditional additive eff ect. eD(t|t-1)is the random conditional dominance eff ect vector attthmolt, eD(t|t-1)~ (0,σ2D(t|t-1)I). UDis the incidence matrix of conditional dominance eff ect. eAE(t|t-1)is the random conditional additive × environment eff ect vector attthmolt, eAE(t|t-1)~ (0,σ2AE(t|t-1)I). UAEis the incidence matrix of conditional additive × environment eff ect.eDE(t|t-1)is the random conditional dominance ×environment eff ect vector attthmolt, eDE(t|t-1)~ (0,σ2DE(t|t-1)I). UDEis the incidence matrix of conditional additive eff ect. eε(t|t-1)is the random conditional error eff ect vector attthmolt, eε(t|t-1)~ (0,σ2ε(t|t-1)I). I is an identity matrix.
The conditional variance components included in the above analysis model were estimated using the approach of minimum norm quadratic unbiased estimation (MINQUE) (Zhu, 1996), and their standard errors were estimated using the Jackknife method(Zhu, 1996; Lynch and Walsh, 1998). With the standard errors estimated, signif icance of various conditional variance components was given by the Student’st-test. Using the method of Zhu (1996), the conditional variance components from a certain timetto f inal timef,σ2(f|t), were also estimated to understand the net genetic eff ects expressed during the period(from a prior timetto the f inal observation timef).
3 RESULT
3.1 Trait descriptive
InP.clarkii, the newly hatched crayf ish is basically equipped with all the parts necessary for survival, but it must remain with its mother and undergo two molts before it can fend for itself.
During this early period, larvae are attached to their mother’s pleopods. Certain death awaits a young crayf ish that becomes detached from the mother, as it is unable to take care of itself. For this reason, the larvae before the two molts were excluded, and only third-instar larvae were used in our study. Survival rates were recorded to range between 76% and 84%for diff erent mating combinations among three geographic populations ofP.clarkii. The numbers of survived crayf ish that completed nine molts during 106 days of experiment (from stocking of third-instar larvae to completion of 9thecdysis) were observed to vary from 29 to 38 for diff erent mating combinations.Since the experiments were rigorously controlled,these crayf ish molted basically at the same time. The time was 10 days for each intermolt from 1stto 4thmolt, 15 days for each intermolt from 5thto7thmolt,and 14 days for each intermolt from 8thto 9thmolt.Variations in phenotypic grand means (± SD) of 4 traits at varying molting points for the wholeF1off spring population of three intra-population and six reciprocal cross combinations are presented in Fig.1 for body length, chela length, cephalothorax length,and body weight. It could be found that there occurred diff erent patterns with the growth curves between body weight and 3 morphological traits. Body weight increased slowly before 4thmolt, and thereafter increased rapidly. The three size traits grew in nearly a linear manner from 1stmolt to 9thmolt. It was necessary to point out that since those crayf ish had yet to mature after 9thmolt, the diff erence in growth between two sexes could be dismissed (Holdich,2002). Thereby sex was not put into our model for analysis as a factor. In addition, the tank eff ect was found nonsignif icant.
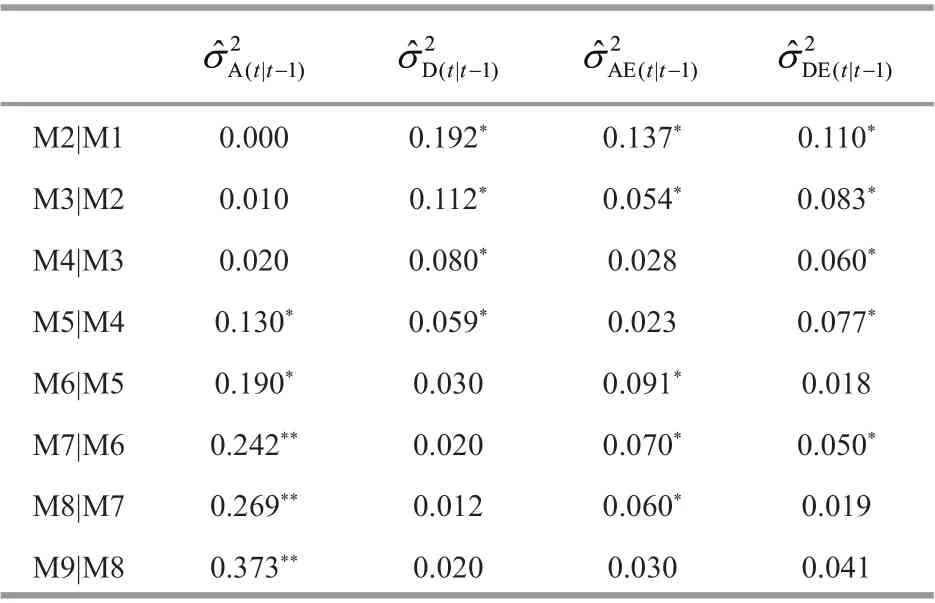
Table 1 Conditional variance component estimates for body weight (g) at a molt time conditional on the prior molting in Procambarus clarkii
3.2 Conditional variance components at a molt conditional on the prior one molt
The conditional variance components (additive,dominance, and genotype × environment) for body weight are given in Table 1, where the genetic eff ects were conditional on the gene expression of the traits at a prior molt. The new genetic eff ects at a molt conditional on the causal genetic eff ects at the prior molt were independent of the causal genetic eff ects during the intermolt. Thus, body weight at second molt was conditional on body weight at f irst molt,body weight at third molt on body weight at second molt, and the like.
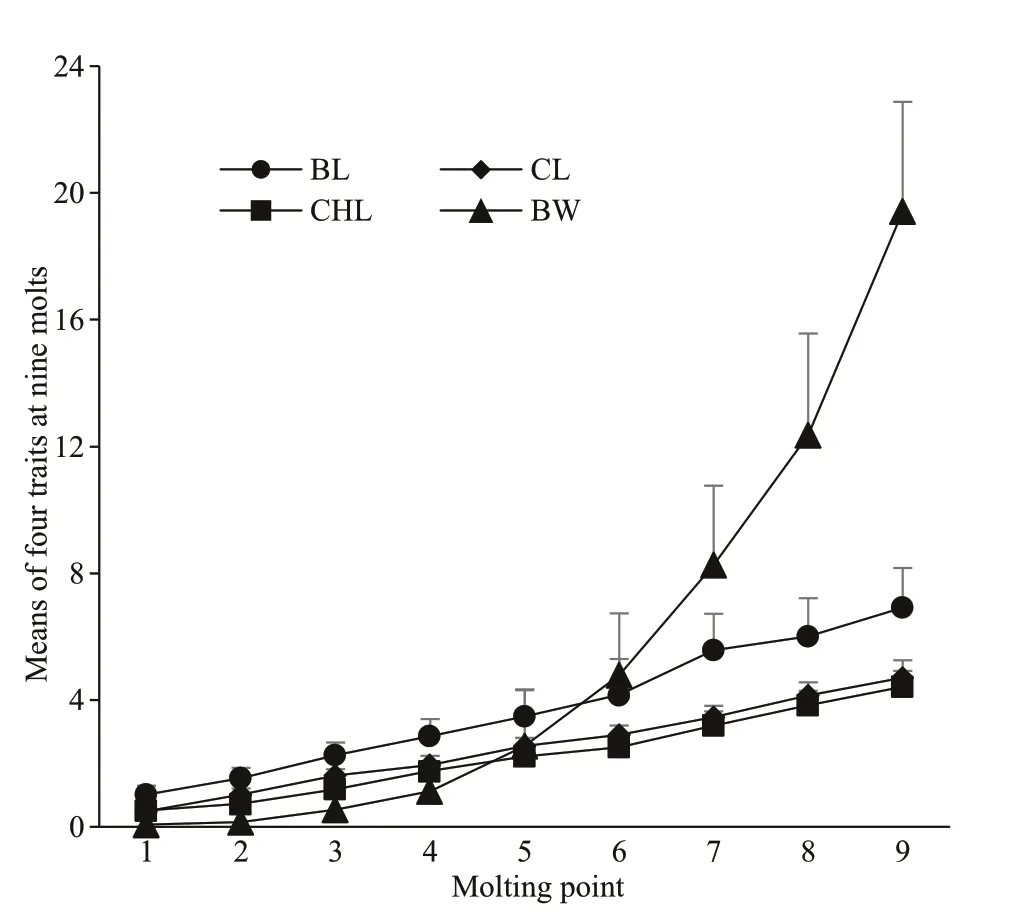
Fig.1 Ontogenetic variations in means (± SD) of body length (BL, mm), cephalothorax length (CL, mm),chela length (CHL, mm), and body weight (BW,g) at diff erent molting points for the off spring population of intra-population and reciprocal cross combinations in Procambarus clarkii
For body weight (Table 1), the conditional additive variance components were not detected at 2ndmolt.They were detected at 3rdand 4thmolt, but not signif icant. Since 5thmolt, the conditional additive variance components became signif icant, and peaked at 9thmolt. This suggested that there had been new expression of additive eff ect genes from 5thmolt to 9thmolt, especially from 7thmolt to 9thmolt. Conditional dominance variances were found signif icant from 2ndmolt to 5thmolt, and then decreased to nearly zero at 9thmolt. Genotype × environment interaction variances, including additive × environment and dominance × environment, were decreased gradually to nearly zero at the f inal molt. This showed that diff erent environments in two years (2019 and 2020)had signif icant inf luences on the expression of additive eff ect genes and on body weight.
For body length (Table 2), the additive conditional variances were not detected prior to 4thmolt. They were detected since 5thmolt, and peaked at the f inal molt (9thmolt), demonstrating that additive eff ect genes were signif icantly expressed at this interval,especially from 7thmolt to 9thmolt. Conditional dominance variances were found signif icant from 2ndmolt to 5thmolt, and then decreased to nearly zero at 9thmolt. Additive × environment and dominance ×environment interaction variances were signif icant before 5thmolt, and then decreased gradually to nearly zero at the f inal molt. Considering that crayf ish were very small in size, and were sensitive to environmental changes, resulting in signif icantG×Einteraction. This showed that diff erent environments in two years(2019 and 2020) had signif icant inf luences on the expression of additive eff ect genes and on body length.
For chela length (Table 3), the conditional additivevariances were not detected at 2ndand 3rdmolt. They were signif icant at 4thand 5th, and highly signif icant from 6thto 9thmolt. The conditional additive variance components peaked at 9thmolt. This suggested that there have been new expression of additive eff ect genes from 4thmolt to 9thmolt, especially from 6thmolt to 9thmolt, showing that the expression of additive eff ect genes was turned on over this period.Conditional dominance variances were found signif icant from 2ndto 4thmolt, decreased to nearly zero at 5thmolt, and then increased at 6thand 8thmolt,showing a f luctuating pattern. Additive × environment interaction variance was signif icant at 4thand 5thmolt,and nonsignif icant at other molts. Dominance ×environment interaction variance was detected from 2ndto f inal molt, and not detected at 8thand 9thmolt.This showed that the expression of additive eff ect genes aff ecting chela length varied with diff erent environments.
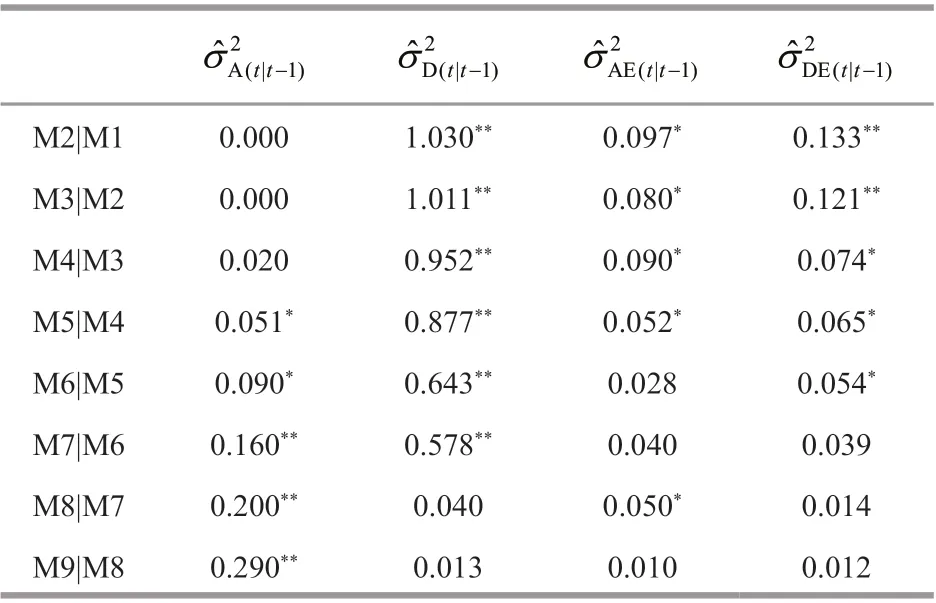
Table 2 Conditional variance component estimates for body length (mm) at a molt time conditional on the prior molting in Procambarus clarkii
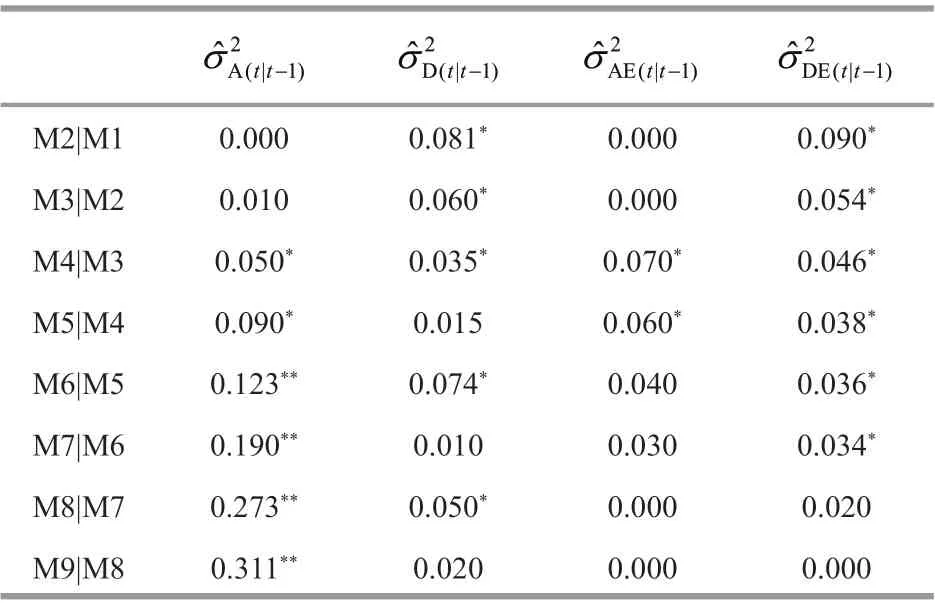
Table 3 Conditional variance component estimates for chela length (mm) at a molt time conditional on the prior molting in Procambarus clarkii
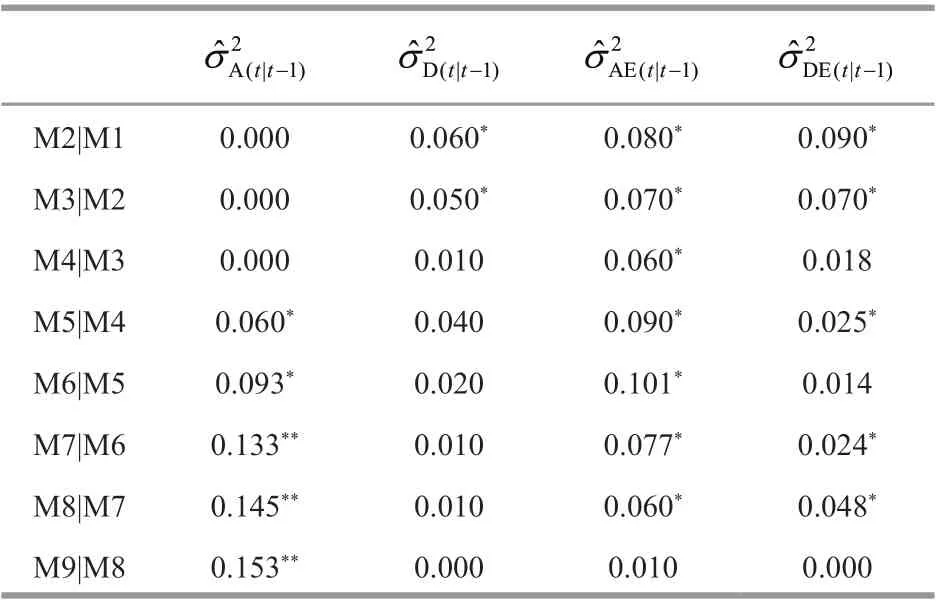
Table 4 Conditional variance component estimates for cephalothorax length (mm) at a molt time conditional on the prior molt in Procambarus clarkii
For cephalothorax length (Table 4), the conditional additive variance components were not detected before 5thmolt. They occurred at 5thand 6thmolt, and highly signif icant from 7thto 9thmolt. The conditional additive variance components peaked at 9thmolt. This suggested that there had been new expression of additive eff ect genes from 5thto 9thmolt, especially from 7thto 9thmolt that gave rise to new additive genetic variability. Conditional dominance variances occurred at 2ndand 3rdmolt, and then decreased to zero at 9thmolt. Additive × environment interaction variance occurred from 2ndto 8thmolt, and were decreased to zero at the f inal molt; it peaked at 6thmolt. Dominance × environment interaction variance occurred at 2nd, 3rd, 5th, 7th, and 8thmolt; it peaked at 2ndmolt, signif icantly increased at 8thmolt (2ndpeak), and then decreased to zero at 9thmolt. This showed that the expression of additive genes for cephalothorax length was signif icantly inf luence by environmental eff ects.
3.3 Conditional variance components at 9 th molt conditional on prior molts
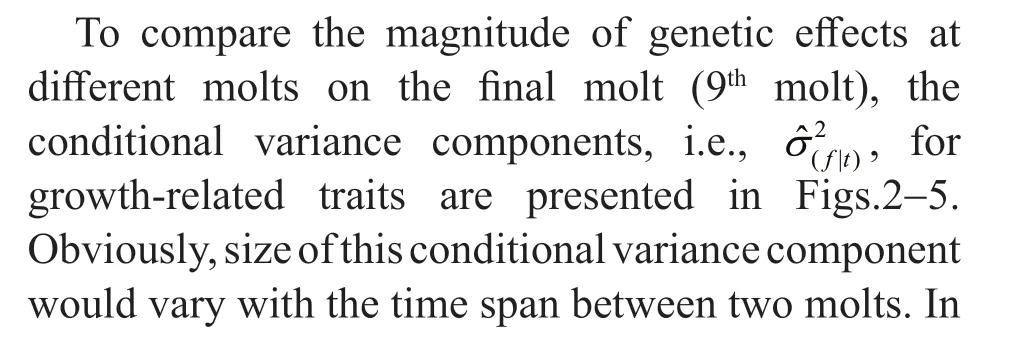
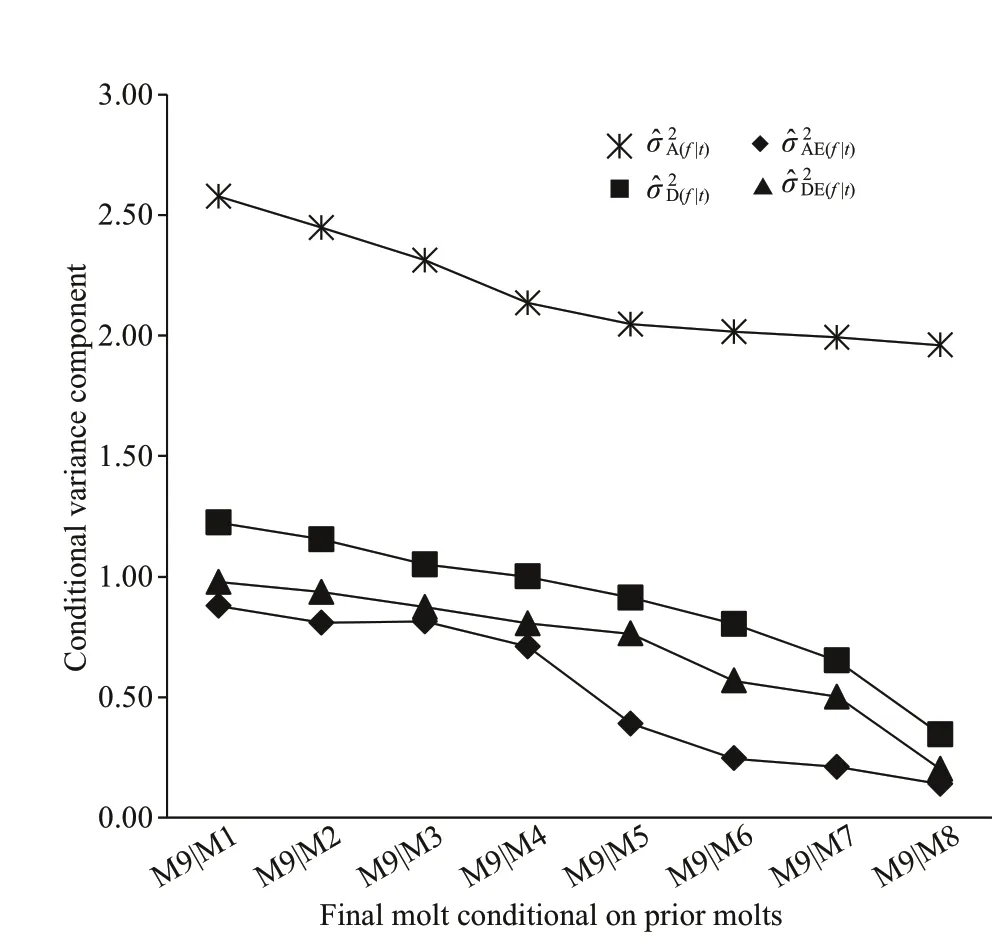
Fig.2 Changes in estimated conditional variance components at 9th molt ( f) given the observation at diff erent prior molts for total body weight (g) in Procambarus clarkii
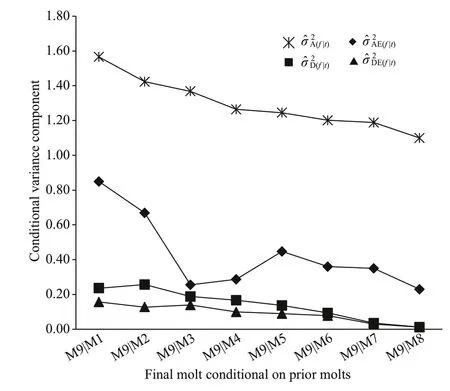
Fig.3 Changes in estimated conditional variance components at 9 th molt ( f) given the observation at diff erent prior molts for body length(mm) in Procambarus clarkii
M9|M1 signif ies 9thmolt subject to 1stmolt, and so on.this sense, the conditional genetic variances at 9thmolt for growth-related traits would be the largest when conditional on 1stmolt. For body weight (Fig.2),it could be clearly found that the various conditional variances at 9thmolt gradually decreased as the time span between a prior molt and the f inal molt was decreased. The conditional additive variance was numerically higher than other conditional nonadditive variances. From 5thto 9thmolt, conditional additive variance decreased very slowly, but the other conditional non-additive variances decreased rapidly,nearly to zero at 9thmolt.
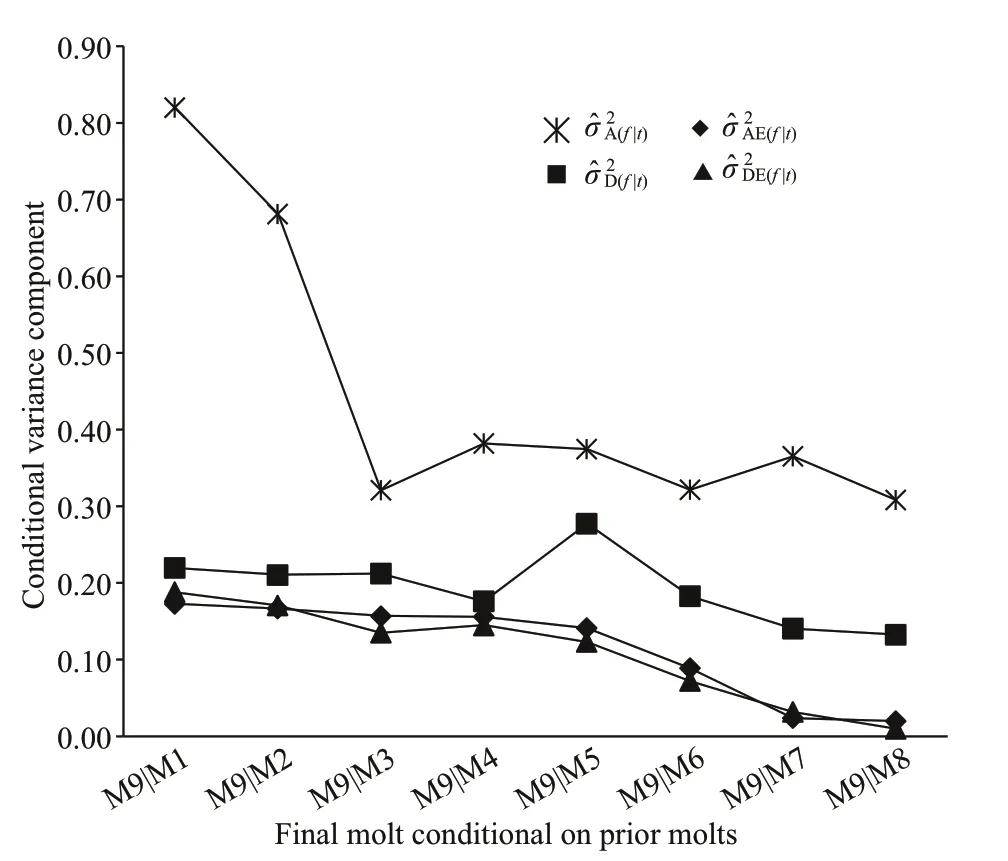
Fig.4 Changes in estimated conditionalvariance components ()at 9 thmolt ( f) given the observation at different priormolts for chelalength(mm) in Procambarus clarkii
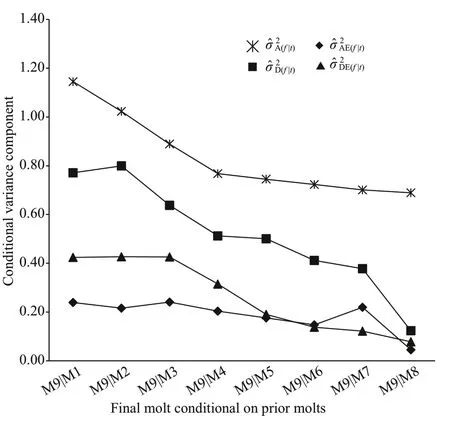
Fig.5 Changes in estimated conditional variance components () at 9th molt ( f) given the observation at diff erent prior molts for cephalothorax length (mm) in Procambarus clarkii
For the other morphological traits: body length,chela length, and cephalothorax length (Figs.3- 5), the values of conditional additive variance components were all higher than those of other conditional nonadditive variances. The change in the conditional additive variances for body length was very similar to that in cephalothorax length, and decreased very slowly from 4thto 9thmolt. In contrast to the conditional additive variances for body length and cephalothorax length, the conditional additive variances for chela length were decreased sharply from 1stto 3rdmolt, and then decreased very slowly from 4thto 9thmolt. The conditional dominance variance for body length was analogous to that of cephalothorax length, albeit the rates of change being diff erent. The conditional dominance variance for chela length was decreased slowly from 1stto 4thmolt, but signif icantly increased at 5thmolt, and then again decreased slowly to 9thmolt. The conditional additive × environment interaction variances for chela length and cephalothorax length were similar, all decreased slowly from 1stto 9thmolt. In contrast, the conditional additive × environment interaction variance for body length peaked at 1stmolt, decreased rapidly to 3rdmolt, again increased to its second peak at 5thmolt,and then decreased to 9thmolt. The conditional dominance × environment interaction variances for the three morphological traits were all decreased slowly from 1stto 9thmolt.
4 DISCUSSION
Quantitative traits such as body weight consist of many diff erent constituents morphogenetically, the growth patterns of which may vary considerably with distinct ontogenetic phases (Lynch and Walsh, 1998;Walsh and Lynch, 2018). For instance, in crayf ish male chelae and female abdomens grow faster relative to other somatic parts (Lutz, 2001). As in many other decapods, growth of the abdomen in juvenile and male crayf ish is nearly isometric throughout, but females display positive allometry prior to puberty and a pronounced increase in relative abdominal width at the puberty molt. This brings it to functional size (egg carrying) when needed (Holdich, 2002;Longshaw and Stebbing, 2016). In contrast, chelar growth is nearly isometric in juveniles and females,but in males, the level of allometry increases at the pre-puberty molt. There is a further marked increase in relative size of the chelae at the puberty molt.Allometric growth of the chelae continues after the puberty molt (Lutz and Wolters, 1999; Holdich, 2002;Longshaw and Stebbing, 2016). The result of the diff erential growth of males and females has commercial implications, in that male crayf ish have more muscle (meat) in their chelae than females,whereas females have more tail meat in their abdomens than males.
The underlying governing agents for diff erential growth patterns over ontogeny can be molecularly demonstrated by the diff erent temporal and spatial changes in expression of related genes (Walsh and Lynch, 2018). Due to quantitative diff erences are usually aff ected by gene diff erences at a multiplicity of loci, the individual genes cannot be discerned by their segregation and transmission (Lynch and Walsh,1998; Lutz, 2001). However, as genome research has provided new techniques for constructing highdensity genetic linkage maps, major genes that aff ect a quantitative trait can be located on specif ic regions on chromosomes (Martyniuk et al., 2003; Gutierrez et al., 2012; Chiasson et al., 2013; Vasemägi et al., 2016;Kodama et al., 2018). For example, using a highdensity genetic linkage map, Wang et al. (2019c)located 1 major and 19 suggestive QTLs for 4 growthrelated traits (body length, body height, head length,and body weight) inHypophthalmichthysmolitrix.The eff ects of QTLs in early growth stages (6 and 12 months post hatching) were signif icantly diff erent from those of the QTLs detected in the middle and later growth stage (18 months post hatching). Eff ects of these QTLs explained 10.2%- 19.5% of phenotypic variation. This indicates that the number of QTLs involved and size of QTL eff ects vary with ontogenetic stages in modulating the growth in this species.Similar results were also reported inOncorhynchusmykiss(Martyniuk et al., 2003) and inS.salar(Gutierrez et al., 2012). In red swamp crayf ish, since no genetic linkage map has been constructed, so growth-related QTLs cannot be mapped to date in this species. However, according to the temporal dynamics of conditional additive variance components at diff erent molting points for the growth-related traits in our study (Tables 1- 4 & Figs.2- 5), it can be speculated that there should be signif icant expressions of new related genes especially from 4thmolt to maturity, albeit the number and eff ect of the genes unknown.
For body weight, there is a consistent increasing pattern for the conditional additive genetic variance from 2ndmolt to 9thmolt. The conditional additive genetic variability is slightly increased from 2ndmolt to 4thmolt, but precipitously increased from 4thmolt and reached its maximum (0.373) at 9thmolt (Table 1). For example, the conditional additive variance from 4thmolt to 9thmolt accounted for 97.57% of total conditional additive variability from 2ndmolt to 9thmolt, and 38.45% of phenotypic variability from 2ndmolt to 9thmolt. Thus, the conditional genetic variance from 2ndmolt to 9thmolt was almost completely explained by the conditional additive genetic variance from 4thmolt to 9thmolt. Between 2ndand 4thmolt there was new conditional additive genetic variance that accounted for ca. 0.81% of phenotypic variability.On the other hand, it can be clearly seen in Table 1 that the conditional additive variance was slowly decreased from 4thmolt to 8thmolt when conditional on 9thmolt. For example, the conditional additive variance was decreased by only 8.24% from 4thmolt to 8thmolt when conditional on 9thmolt. These show that the newly produced additive genetic variability after 4thmolt may probably be the result of high expression of genes inf luencing body weight. InP.clarkii, intermolts at later ontogenetic stage are typically much longer than those in early stage(Holdich, 2002; Longshaw and Stebbing, 2016),accordingly the additive genetic variability is more accumulated in later growth stage. The changes in additive genetic variability for body weight depend upon species. For example, decreasing trend for the additive genetic variation for body weight was documented by Atchley and Zhu (1997) in mice (Musmusculusalbus). Wang et al. (2006) detected the additive genetic variation only at two time points over ontogeny inCyprinuscarpio, whereas Wang et al.(2015) reported that the additive genetic variation changed over time in a nonlinear way inScophthalmusmaximus. Compared with these studies, the additive genetic variation for body weight in our study was diff erent. Species should be responsible for this diff erence.
In contrast, the patterns of conditional additive genetic variances of three morphological traits (body length, chela length, and cephalothorax length) were analogous to that of body weight in this study. When conditional on the variation at the prior one molt,there is still considerable new variability being introduced (Tables 2- 4). For example, the conditional additive variance was increased from 0.05 at 4thmolt to 0.311 at 9thmolt for chela length, with the conditional additive variance accounting for 99.9% of total conditional additive variance from 2ndmolt to 9thmolt, and 30.22% of phenotypic variability from 2ndto 9thmolt. When conditional on 9thmolt, from 4thmolt to 8thmold there was a signif icant introduction of up to 49.02%- 57.93% new additive genetic variability for the three length traits not explained by the previous intervals (Figs.3- 5). The age-dependent changes in additive genetic variability for tail length were found to be gradually decreased in mice (Atchley and Zhu,1997), but were irregular for length traits inC.carpio(Wang et al., 2006) andS.maximus(Wang et al., 2015).
It should be pointed out that the conditional additive variances for 4 growth-related traits were higher than those conditional non-additive variances from 1stto 9thmolt in red swamp crayf ish (Figs.2- 5).During our experiment, several important factors such as temperature and food were held at suitable levels, this might provide better environmental conditions for the suffi cient expression of additive genes aff ecting the growth-related traits. On the other hand, our experiment is carried out under controlled conditions; environmental inf luences are small in principle. Thus,G×Eis relatively smaller.
In our study, the dominance eff ects were eliminated from phenotypic variability for growth-related traits.According to Lynch and Walsh (1998), Lutz (2001),this is very necessary in evaluating genetic variability of a population. Without dominance eff ect separated out, the additive genetic variability would be upwardly estimated (Walsh and Lynch, 2018). Wang et al. (2006) and Wang et al. (2015) also partitioned dominance eff ects out from phenotypic variability of growth-related traits. In the present study, the temporal changes in dominance eff ects for growthrelated traits were decreased consistently (Tables 1- 4& Figs.2- 5). This is similar to the report of Atchley and Zhu (1997), but not to the reports of Wang et al.(2006) and Wang et al. (2015), who did not document a regular pattern of dominance eff ects for growthrelated traits. Due to increased additive genetic variability for growth-related traits during later ontogenetic stage, the dynamic changes in gene expression led to decreased dominance variation(Zhu, 1996). It should be mentioned that maternal eff ect and epistatic eff ect, if any, were not partitioned out, i.e., maternal eff ect and epistatic eff ect may be confounded into the genetic eff ects for the growthrelated traits in our study.
Since all metabolic and developmental pathways are aff ected to some extent by aspects of the environment, it makes sense that the expression of most quantitative traits is not solely under genetic control (Lynch and Walsh, 1998; Lutz, 2001). For example, Vasemägi et al. (2016) reported 3 QTLs aff ecting growth-related traits (fork length and body mass) in the hatchery environment were not detected in the wild, and 2 QTLs observed in the natural environment were not detected in the hatchery environment, thus concluded that growth-related QTLs were environment-specif ic inS.salar. Genotype by environment interactions, mainly including additive by environment interaction and dominance by environment interaction, should be examined as an important component of phenotypic value of a quantitative trait upon undertaking genetic assessment(Walsh and Lynch, 2018). In our study, the genotype by environment interactions were removed from phenotypic variability, thereby the longitudinal changes in the additive genetic eff ects for growthrelated traits were more explicit. In the studies of Atchley and Zhu (1997) in mice, Wang et al. (2006) inC.carpio, and Wang et al. (2015) inS.maximus, due to environmental eff ect not checked, thus agedependent genotype by environment interactions were confounded into the genetic eff ects for growthrelated traits. In addition, Kodama et al. (2018)concluded that the interaction between QTLs aff ecting growth-related traits and sex occurred inOncorhynchuskisutch. In our study, the red swamp crayf ish used were still not mature at 9thmolt, so the eff ect of sex could be ignored.
5 CONCLUSION
Since the conditional variance components were obtained subject to variability at earlier molts,signif icant episodes in the new generation of gene expression at specif ic intermolts during ontogeny were clearly exhibited. The changes in conditional additive variance components manifest the new genetic eff ects of gene expression over a specif ic developmental stage. With the conditional nonadditive genetic variations removed from phenotypic variability, the conditional additive variations were increased signif icantly for the growth-related traits.The cumulative conditional additive variation from 4thmolt to 9thmolt (maturity) predominated, showing that this ontogenetic period was most important for the growth of this species. Results of this study aff ord useful knowledge about improving the culture management of this species.
6 DATA AVAILABILITY STATEMENT
The experimental data obtained and used during the present study can be provided by the corresponding author at the request of any interested readers.
 Journal of Oceanology and Limnology2022年2期
- Journal of Oceanology and Limnology的其它文章
- Identif ication of Antarctic minke and killer whales with passive acoustic monitoring in Prydz Bay, Antarctica*
- Eff ects of dissolved oxygen and nutrients from the Kuroshio on hypoxia off the Changjiang River estuary*
- Methane in the Yellow Sea and East China Sea: dynamics,distribution, and production*
- Early life migration and population discrimination of the small yellow croaker Larimichthys polyactis from the Yellow Sea: inferences from otolith Sr/Ca ratios*
- A new oil spill detection algorithm based on Dempster-Shafer evidence theory*
- The phycocyanin-chlorophyll-protein complexes isolated from Chroomonas placoidea*
