Determination of trophic levels of marine f ish in the Yellow Sea and northern East China Sea using nitrogen stable isotope(δ 15 N) analysis of otoliths*
Huaiyu BAI , Yukun WANG , Tingting ZHANG , Fangqun DAI , Lingfeng HUANG ,Yao SUN , 4, **
1 College of the Environment and Ecology, Xiamen University, Xiamen 361102, China
2 Yellow Sea Fisheries Research Institute, Chinese Academy of Fishery Sciences, Qingdao 266071, China 3 Key Laboratory of the Ministry of Education for Coastal and Wetland Ecosystems, Xiamen University, Xiamen 361005, China 4 Laboratory for Marine Fisheries Science and Food Production Processes, Pilot National Laboratory for Marine Science and Technology (Qingdao), Qingdao 266071, China
Abstract Fish otolith δ 15 N (δ 15 N oto) is a demonstrated source of information of dietary history for marine f ish as it is available in otolith archives and sedimentary deposits unlike white muscle tissue (WMT). WMT and stomach content data are insuffi cient for trophic level (TL) data of past f ishes which is important for the changes of marine f ishery resources over long time scales. To determine the correlation between δ 15 N oto and f ish WMT δ 15 N (δ 15 N wmt) and the feasibility of using δ 15 N oto in characterizing the TLs of marine f ishes, we conducted nitrogen stable isotope analysis (SIA) in the otolith and WMT of 36 marine f ish species sampled from the Yellow Sea and northern East China Sea in 2011-2014. Both δ 15 N oto and δ 15 N wmt were analyzed using an elemental analyzer coupled with an isotope ratio mass spectrometer (EA-IRMS). Multiple otoliths were combined to make each otolith measurement and were analyzed as-is without a carbonate dissolution pre-processing step. δ 15 N oto and δ 15 N wmt comparisons for species in the Yellow Sea and northern East China Sea are currently lacking and would be helpful for both regional studies and for increasing the number of species for which δ 15 N oto and δ 15 N wmt have been compared. Additionally, to determine the relative accuracy of trophic level calculated using δ 15 N oto, we compared TL calculated from δ 15 N oto to traditional trophic level metrics calculated using δ 15 N wmt. The results showed a positive and highly signif icant correlation ( R=0.780,P <0.001) between δ 15 N oto and δ 15 N wmt. Trophic level estimation using WMT (TL wmt) and otolith (TL oto)showed congruence in our study, which is not entirely surprising given that δ 15 N oto was regressed against δ 15 N wmt and the resulting regression coeffi cient was used to convert δ 15 N oto to δ 15 N wmt prior to calculating TL oto. This conversion was required in order to be consistent with previous δ 15 N wmt-based calculations of TL for comparison. TL oto calculations resulted in TL values that were largely within 5%-10% of TL values calculated with δ 15 N wmt. Our f indings show that δ 15 N oto is a feasible technique for characterizing the TLs of marine f ish and can also assist in food web and marine ecosystem studies.
Keyword: stable isotope analysis; δ 15 N; otolith; trophic level
1 INTRODUCTION
Fishes are one of the most crucial species in the ocean that provide a rich source of nutrition, and economic income (e.g., seahorses as traditional Chinese medicine; cod-liver oil providing Vitamin A and E) for human beings. At the same time, they maintain stability and balance in marine ecosystems(Luong et al., 2020). The excessive exploitation of marine resources in the past decades has heightened the demand for the restoration of f ishery resources and the protection of marine ecosystems. The interest in marine restoration has increased the importance of understanding f ish functional roles in their ecosystems(Zhao et al., 2016). In addition, overf ishing is likely to alter trophic levels in marine f ishes (Greenstreet and Rogers, 2006; Maitra et al., 2018).
Trophic level (TL) refers to the trophic position in which one organism is placed in the food chain of an ecosystem. Marine ecosystems are complex and are supposed to have a structure of multiple trophic levels(Qu et al., 2016). Understanding trophic levels and their alteration of every kind of marine organisms,especially f ishes, is one of the fundamental goals of modern marine ecology (Du et al., 2020). Traditionally,f ish TLs were estimated by means of stomach content analysis (SCA). In this method, the f ish gut is examined and the various taxa preyed upon by the f ish are identif ied and quantif ied (e.g., Varela et al.,2018).
Stable isotope analysis (SIA) is another method of determining TLs by making use of the ratio15N/14N,which increases with increasing trophic level and can be measured in f ish tissue as described below(Greenstreet and Rogers, 2006; Varela et al., 2018; Du et al., 2020). SIA is a widely used approach in describing trophic interactions in natural systems and in def ining time-integrated feeding relationships within an ecosystem (Ohshimo et al., 2019). It is also considered one of the most eff ective methods for determining trophic levels in any food web (Dame and Christian, 2008), and has become an important approach for investigating trophic interactions in food webs in the past few decades (Post, 2002). This method typically uses the white muscle tissue (WMT)because of the small amount needed for analysis(generally 1 mg) (Varela et al., 2018). However, the WMT δ15N (δ15Nwmt), which is commonly used for ecological studies, only provides a very limited temporal scope, in particular, a span of months to years for f ishes (Madigan et al., 2012).
The otolith, which is one of the unique organs of teleosts, records information of the entire lifespan of most teleosts. Calcium carbonate precipitates from the endolymphatic f luid onto a protein matrix inside the otolith to form an aragonitic crystal. The protein matrix, which can regulate crystal growth, has an abundance of aspartic and glutamic acids and is partly glycosylated (Miller et al., 2006). New material is deposited daily on the outside edge of otolith which makes it ideal for dietary analysis (Elsdon et al.,2010). Fish gills sieve outside waters and absorb the elements present in it. These are then deposited to form the otoliths. Once deposited, they are rarely dissolved and also remain protected from the metabolism of the f ish, which means changes seldom occur inside the otolith (Campana and Thorrold,2001). Its metabolic inertness thus helps record ontogenetic information dating back to f ishes’ juvenile stage (Brown et al., 2019). For the afore-mentioned reason, scientists often use otolith chemistry to reconstruct the movement or origin of migratory f ishes (e.g., the Australian bass,Percalatesnovemaculeata, Cameron et al., 2016). This reconstruction is made possible by the chemical“f ingerprints” that estuaries, rivers, or oceanic areas leave on the otolith (Sturrock et al., 2012). Apart from that, otolith contains protein in the “organic matrix(OM)” (e.g., Miller et al., 2006), thus allowing stable nitrogen isotope analysis of the otolith. For instance,the otolith δ15N (δ15Noto) may allow for reconstruction of f ish trophic history and changes in food webs(Lueders-Dumont et al., 2020).
The Yellow Sea and the East China Sea are important regions of commercial f isheries in China. Some of the most important commercial f ishes are large yellow croaker (Pseudosciaenacrocea), small yellow croaker(Larimichthyspolyactis), and largehead hairtail(Trichiurushaumela); and important non-f ish species include cuttlef ish (Sepiellamaindroni) and swimming crab (Portunustrituberculatus) (Zhao et al., 2016; Ma et al., 2019). In the past decades, f ishery resources have declined due to overf ishing and environmental destruction. Small and low-value f ish account for more than 80% to 90% of the marine f ish landings in the present (Zhao et al., 2016). The government of China has gradually recognized the seriousness of this problem. It has started programs aimed at both ecological restoration and protecting f ishery resources(Liang et al., 2020). The information on TLs of marine f ishes may assist in the formulation of management plans and serve as reference for conservation.
Previous research has found that δ15Notoand δ15Nwmtare highly correlated, which has been shown within individual species (Grønkjær et al., 2013; Lueders-Dumont et al., 2018) and also across a diversity of diff erent species (Lueders-Dumont et al., 2020). The relationship between δ15Notoand δ15Nwmtfor f ish in the Yellow Sea and northern East China Sea has never been investigated as the previous study focused on aquaculture and Atlantic Ocean species. In the current study, we used an EA-IRMS (elemental analyzer coupled with an isotope ratio mass spectrometer),which is an instrument commonly used in ecological studies. In contrast, the previous study comparing δ15Notoand δ15Nwmtof multiple species (Lueders-Dumont et al. 2020) measured δ15Notousing a specialized method with limited availability in ecological laboratories.
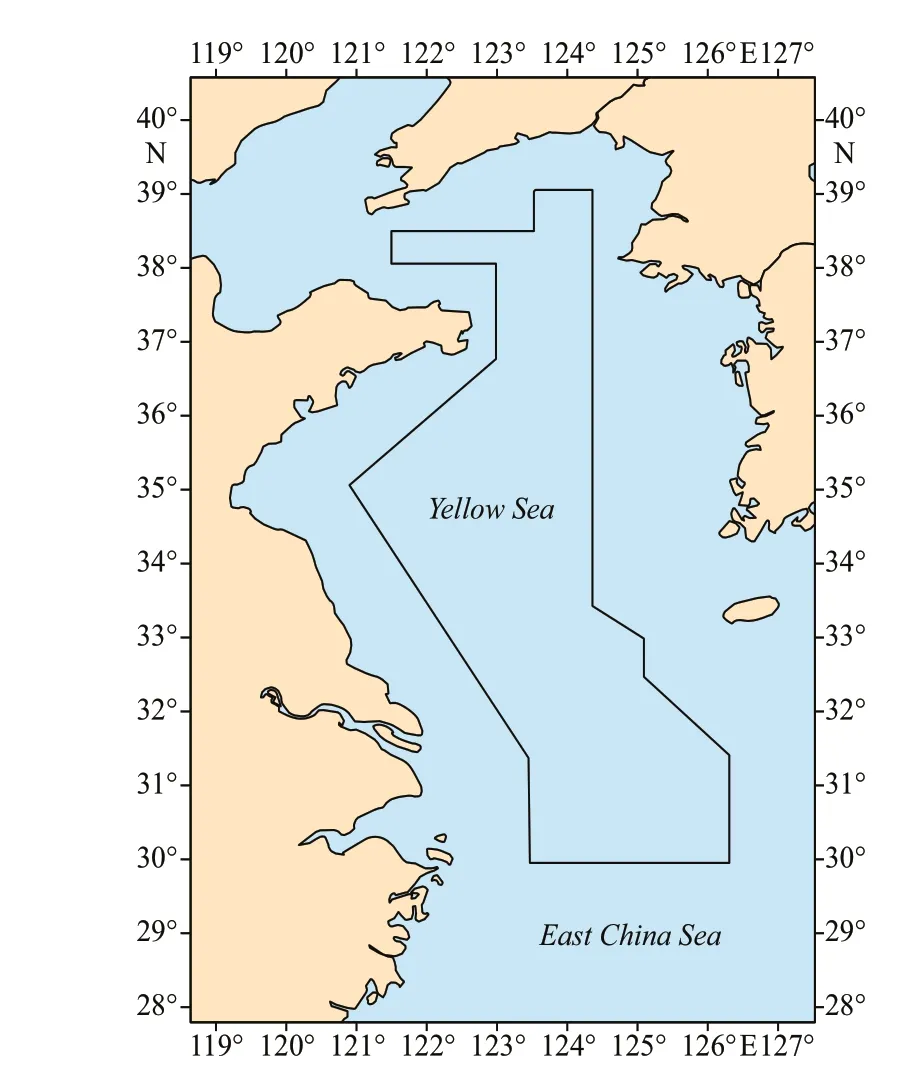
Fig.1 The sampling region represented by irregular polygon at the center
The goals of the present study were to explore the scientif ic value of f ish otolith δ15N (δ15Noto) for SIA and TL analysis, and to assess the potential of otolith as a standard specimen for marine f ish TL analysis.We, specif ically, aimed to answer the following questions while conf irming and expanding previous f indings: (1) is there any parallel correlation between δ15Notoand δ15Nwmtfor the species in the current study?(2) how do TL estimates based on δ15Noto(TLoto)compare to TL estimates based on δ15Nwmt(TLwmt)from the same f ish?
2 MATERIAL AND METHOD
2.1 Sample collection
Thirty-six species of marine teleost f ishes were collected from 2011 to 2014 in the Yellow Sea and northern East China Sea (30.0°N-39.1°N,120.8°E-126.3°E) during the investigation of the R/VBeidouwhich belonged to the Yellow Sea Fisheries Research Institute, Chinese Academy of Fishery Sciences. Both juvenile and adult f ishes were selected randomly from the trawl survey sampling program.The sampled region covers a total area of 2.94×10⁵km2(Fig.1). We established a total of 104 sampling stations. The voyages were held during the autumn of 2011 (October and November), summer of 2013 (July and August), and summer of 2014 (July and August).The whole f ishes were directly frozen upon collection.All the f ishes were identif ied to species level while on the vessel. Three to f ive individual f ishes were sampled for every species used in our analysis.
2.2 Otolith and WMT processing
Sagittal otoliths were removed with scalpel and forceps before being soaked in 30% hydrogen peroxide (H2O2) for 24 h to remove organic matter from otolith surfaces. The otoliths were then washed with distilled water before being dried. WMT was collected from the dorsal side of the f ish with a scalpel. The otoliths and tissue samples were then dried at 60 °C for 48 h in the same clean drying oven.After that, otoliths and tissue samples were crushed and ground into powder using mortar and pestle for SIA. For a given species and measurement type(otoliths or WMT), multiple samples were combined to get a single measurement.
2.3 Stable isotope analysis (SIA)
The SIA was conducted at the Institute of Environment and Sustainable Development in Agriculture, Chinese Academy of Agricultural Sciences. Sample powder (otoliths ~70 mg, WMT~2 mg) was weighed into tin capsules before being analyzed using an EA-IRMS (IsoPrime 100,Elementar, UK) without being acidif ied. δ15N was calculated using the following equation:

Rrepresents the ratio,15N/14N;Rstandardis the δ15N of N2in the air. The SIA was run such that for every f ive specimens analyzed, an analysis of the standard followed. The samples were calibrated with USGS40(δ15N =-4.52‰±0.06‰) and USGS41a (δ15N=47.55‰±0.15‰). For every 10 specimens, one specimen was randomly selected for repeat analysis of 2 or 3 times.The precision of the instrument was 0.2‰ for δ15Nwmtand 0.3‰ for δ15Noto.
2.4 Trophic level estimation
The TLs of f ishes were estimated from δ15Nwmtusing the formula suggested in Cai et al. (2005):

The value 2.5 refers to the trophic enrichment factor (in ‰), and δ15Nbaselinerefers to the baseline δ15N used for the estimation of trophic level. δ15Nbaselineinthe formula of Cai et al. (2005) was 6.05‰, which was the δ15N ofMytilusedulis.M.edulisis a mussel species present in the Yellow and East China Seas.Since the current research was more of a theoretical exercise, where the authors were interested in roughly comparing otolith-derived TL to muscle-derived TL and we had identical sampling areas and similar research aims as Cai et al. (2005), no extra baseline δ15N was measured here.
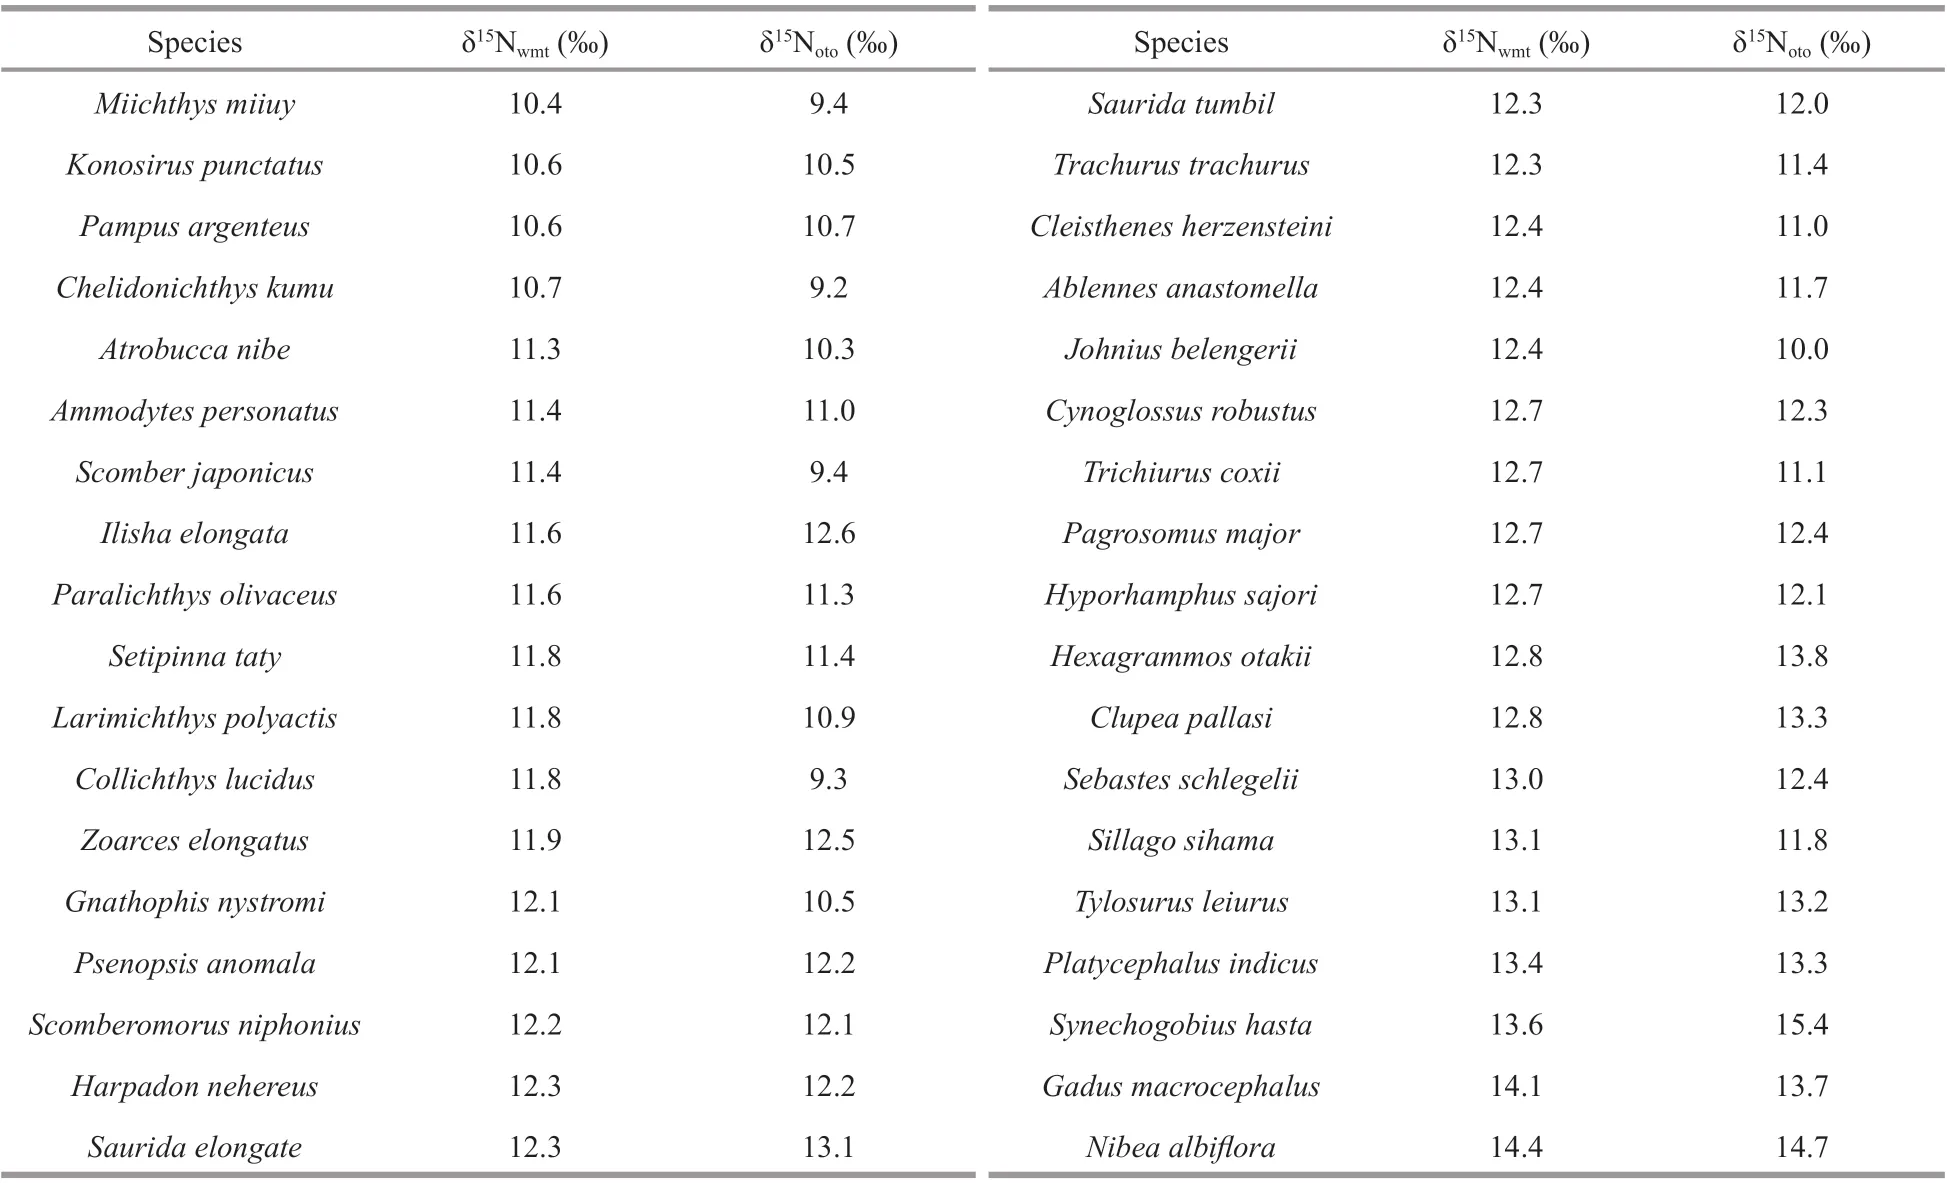
Table 1 δ 15 N wmt and δ 15 N oto values of 36 marine f ish species (from the lowest δ 15 N wmt to the highest)
2.5 Data analysis
We performed Pearson Correlation Analysis to test for the association between paired δ15Notoand δ15Nwmtsamples and the strength of the relationship between the two variables. Regression analysis was used to investigate the slope,y-intercept, and variability between δ15Notoand δ15Nwmt. The most suitable regression relation was selected from 11 regression models in SPSS and the results were subsequently used in the TLotoformula (Eq.4). Statistical analyses were conducted using Excel 2013 and SPSS 19.0.
3 RESULT
3.1 δ 15 N analysis
δ15Nwmtranged from 10.4‰ (Miichthysmiiuy) to 14.4‰ (Nibeaalbif lora) on average (mean±SE) of 12.2‰±0.9‰. δ15Notoranged from 9.2‰(Chelidonichthyskumu) to 15.4‰ (Synechogobiushasta), with an average (mean±SE) of 11.7‰±1.4‰.Ten of the 36 f ishes had a lower δ15Nwmtthan δ15Noto,and the other 26 species had a higher δ15Nwmtthan δ15Noto. Our f indings doubled the number of species for which this relationship has been investigated.Diff erences (δ15Noto-δ15Nwmt) ranged from -2.5‰(Collichthyslucidus) to1.8‰ (S.hasta), with an average of -0.4‰. Species with high δ15Nwmtvalues likeS.hastaandN.albif loraalso obtained high δ15Noto. Others such asM.miiuyandC.kumuhad low values in both (Table 1). δ13C data for WMT and otoliths can be found in Supplementary Table S1.
Pearson correlation analysis results (R=0.780,P<0.001) showed that δ15Nwmtand δ15Notohad a highly signif icant positive correlation. We applied the result of linear regression analysis (Fig.2) to the following trophic level analysis. The regression analysis for δ15Nwmtversus δ15Notois:
δ15Nwmt=0.487δ15Noto+6.507 (R2=0.609,F=52.858). (3)
3.2 Trophic level

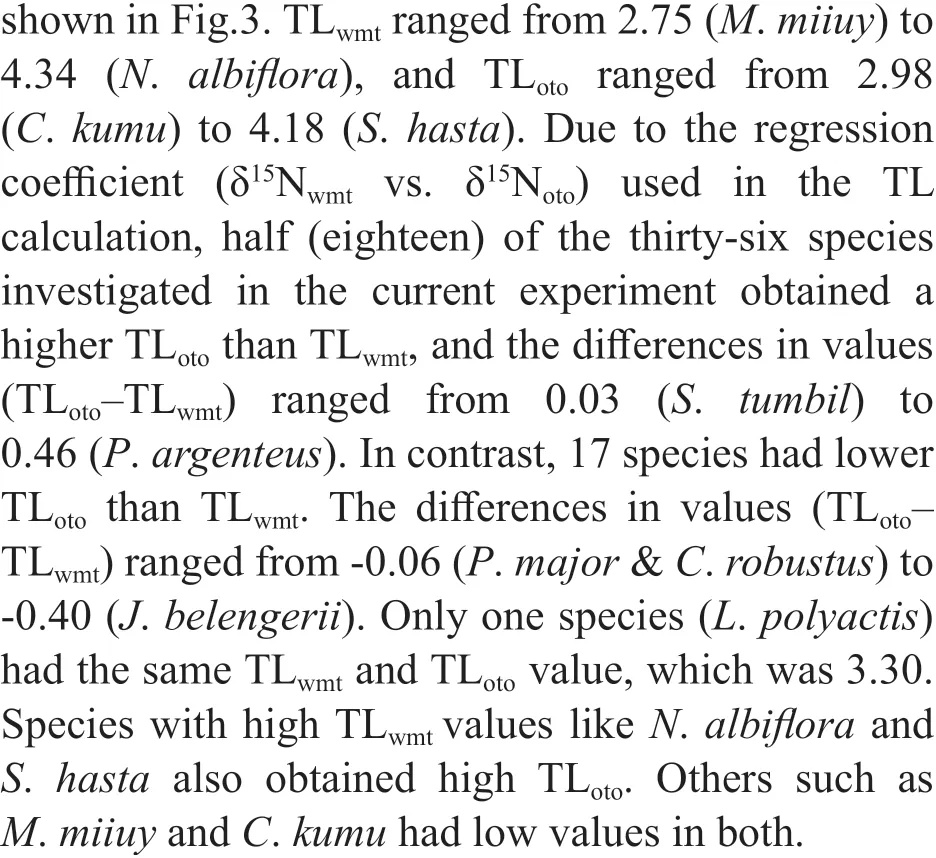
Fig.2 Linear regression between δ 15 N wmt and δ 15 N oto( R 2=0.609)
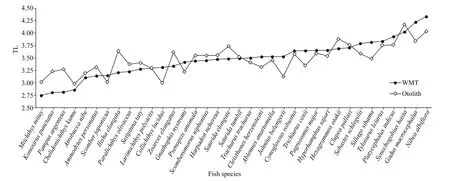
Fig.3 The trophic level estimates based on WMT (δ 15 N wmt) and otolith (δ 15 N oto) analyses of 36 f ish species
4 DISCUSSION
4.1 δ 15 N analysis
As the N content in the otolith was very low in our samples, we combined multiple otoliths (otolith powder ~70 mg) that was prepared to obtain a single measurement for SIA. In contrast, Lueders-Dumont et al. (2018) used only 2-4 mg of powder for the δ15N analysis of the modern and fossil otolith of the Atlantic cod,Gadusmorhua. These diff erences in the weight of otolith powder could be due to the diff erent SIA methods employed. Some other methods reduced the minimum mass of the otoliths required for analysis to as low as 2 mg (Cheng et al., 2018; Lueders-Dumont et al., 2018), unlike the methods in our study.
We compared the regression result with that of Lueders-Dumont et al. (2020) in which the slope of the line was close to 1 and they-intercept was indistinguishable from 0. Although the dependent and independent variables were switched in our study (i.e.Eq.3; Fig.2) aiming to get the TLotoequation (Eq.4),the slope andy-intercept were diff erent from Lueders-Dumont et al. (2020) even if the two variables were switched. It could be related to the specif ic species used in each study, or to diff erences in age and life history stage between the two studies because only large, commercially-harvested f ish species were used in the 2020 study.
Fish muscle tissue has a turn-over of only several months, which is mainly dependent on metabolism(Mohan et al., 2016). Therefore, a more recent life history information is recorded in WMT. In contrast,the otolith is continuously accruing new material;hence, it becomes a record of the entire life history of the f ish. In our study, some δ15N components in the otolith were from the f ish’s early life whereas δ15N in the WMT recorded recent δ15N deposition. Thus, most species (26 species) had higher δ15Nwmtthan δ15Noto.However, the other 10 species had lower δ15Nwmt. The reason could be diet shift in their life history which had changed their δ15Nwmtvalues, and otolith surface was also increasing continuously as the otolith grew which led to the possibility that the otolith mass was,like WMT, “weighted” toward the recent life history.
δ15Nwmtand δ15Notoshould not necessarily be identical as diff erent amino acids and proteins can be used in the development of diff erent f ish body components (McMahon et al., 2011; Lueders-Dumont et al., 2018). Diff erences in δ15Nwmtand δ15Notovalues could also be attributed to the diff erences in amino acid concentrations and in the degree of amino acid routing to various tissues (Macko et al., 1986;McMahon et al., 2010; Mohan et al., 2016). Moreover,diff erences arose across diff erent f ish species.Lueders-Dumont et al. (2020) found that f ish producing large otolith tended to have δ15Nwmt>δ15Notowhereas f ish producing small otoliths tended to have δ15Nwmt<δ15Noto. Fishes with small otoliths (e.g.,Clupeapallasi) in our study, had lower δ15Nwmtcompared to δ15Noto, and f ishes with large otoliths(e.g.,Johniusbelengerii,Gadusmacrocephalus)showed higher δ15Nwmtthan δ15Noto, which was similar to the otolith-size-based results from Lueders-Dumont et al. (2020).
4.2 TL estimation
We used the TL Eq.2 and δ15Nbaselinefrom Cai et al.(2005). We found that these were applicable in our case since both studies focused on the same areas and on f ishes. Furthermore, this formula and parameters were obtained based on a long-term study. However,Wan et al. (2010) argued that the research results of Cai et al. (2005) followed a study of a lake food web(Vander Zanden et al., 1997), which might be less applicable to pelagic areas. Nevertheless, Cai et al.(2005) used the δ15N baseline value (δ15Nbaseline) for the estimation of TL from the common mussel,M.edulis,which is a representative marine species in our study areas.
We wished to compare δ15N and TL data to previously published data. Converting δ15Nototo δ15Nwmtwas the way to achieve this comparison.About 53% (19 species) of the 36 species’ TLwmtand TLotoshowed congruence within the TL range of ±5%,and 89% (32 species) of them showed congruence within the TL range of ±10%. Only one species,Pampusargenteus(16.19%), was out of the TL range of ±15%. This suggests that δ15Notois a feasible technique for characterizing the TLs of marine f ishes.
δ15Notoprovides a record of the whole life history whereas δ15Nwmtrecords the very recent δ15N (Section 4.1). Fishes tend to prey on larger prey from higher TLs as they grow. As a consequence, TLotoref lects the average TL of the entire life history. Therefore, TLwmtcan be assumed to be higher than TLotofor any f ish.However, this was not the case for 18 species which had lower TLwmtthan TLoto(Section 3.2). This could be due to the fact that some species hunt diff erent prey over their whole life history. As a result, they obtain diff erent δ15N in their various growth stages.Environmental and ecological changes can also cause change in prey availability, which, in turn, can impact the consumer’s δ15N. Many species experience diet shifts, even sharp shifts, in their lives likeEthmalosaf imbriata,Sarotherodonmelanotheron,Gaduschalcogrammus, andMallotusvillosus(Gning et al.,2008; Marsh et al., 2017). Thus, the inconsistent changes in the TLwmtand TLotovalues could be explained by the potential inf luence that diet shifts have on δ15N. Lueders-Dumont et al. (2020) argued that phylogeny and life history were not the main cause for the observed variation in the diff erence between δ15Nwmtand δ15Noto, which stood for TLwmtand TLoto. The discrepant point of view from ours could be due to diff erent study areas and diff erent target species.
Diff erent TL values suggest predator-prey relationships in the food web (Qu et al., 2016; Du et al., 2020). Based on our study,N.albif loraandS.hasta(f ishes with the highest TLwmtand TLotovalues, respectively) are top predators, whileM.miiuyandC.kumu(f ishes with the lowest TLwmtand TLotovalues, respectively) could be prey f ishes.
We compared our TL estimation results of 18 species to those of Cai et al. (2005). We found that the TLwmtofM.miiuyandS.niphoniusdeclined in the past several years. There might be two reasons for this. First, the increasing f ishing pressure reduced the landing sizes of commercial f ishes, and smaller sizes meant lower TLs. Pauly et al. (1998) once described a process, “Fishing down marine food webs”. The observations in the current study were consistent with results showing changes to the trophic structure of marine food webs. Second, we were uncertain if all f ish samples were adult individuals. The latter can inf luence our TL estimation since adults and juveniles can be expected to have diff erent TL values.
Some of the species had raised TLwmtlikeH.nehereusandS.hasta. We could not ignore that human activities, especially overf ishing, have been impacting the marine ecosystem (Greenstreet and Rogers, 2006; Luong et al., 2020). The dominant species which used to be top predators in a system are constantly replaced along with the changes in the food web. If top predators have decreased, it is possible that prey species could have increased population sizes. Moreover, decreased densities of top predators in the ecosystem could lead to the prey f ish species growing to larger sizes (Cai et al., 2005).As a result, the TLs of prey species increase.
4.3 Future application of δ 15 N oto and TL oto
The nitrogen concentration of otolith-bound OM in our specimens is very low. The utility of δ15Notoanalysis is limited by the low N content of otoliths.Highly sensitive analytical instruments or methods(e.g., peroxodisulphate oxidation-bacterial conversion method, Cheng et al., 2018) are needed to allow processing of smaller quantities that can provide reliable results. Our results show that measuring otoliths (~70 mg) is nonetheless possible using EAIRMS techniques.
Grønkjær et al. (2013) found that separating the soluble from insoluble organic matter resulted in diff erent δ15N results. The comparison of the soluble vs. insoluble δ15N patterns could be another future direction, to examine whether the relationship between δ15Notoand δ15Nwmtdepends upon using soluble, insoluble, or bulk organic matter in future studies.
In addition, otoliths do not decompose easily compared to WMT. Fossilized otoliths in sedimentary deposits can be specimens that record information of f ishes in the past, or even that of ancient f ishes(Lueders-Dumont et al., 2018).
In summary, otoliths are useful repositories of information that can be useful for ecological investigations, including trophic level estimation or the determination of diff erences in baseline experienced by diff erent species or groups of the same species.
5 CONCLUSION
A total of 36 species of marine f ishes were sampled from the Yellow Sea and northern East China Sea in 2011-2014. Our results show that there was a positive and highly signif icant correlation (R=0.780,P<0.001)between δ15Notoand δ15Nwmtvalues of the f ishes, of which 89% showed congruence with a TLotorange that fell within ±10% of TLwmt. TLwmthad changed through recent decades compared with previously published research. The use of δ15Notois a feasible technique in characterizing the TLs of marine f ishes and could therefore be used in marine ecosystem studies. We expected that more applications can be derived from the δ15Notoand TLototechniques in the future.
6 DATA AVAILABILITY STATEMENT
The datasets generated during and/or analyzed during the current study are available from the corresponding author on reasonable request.
7 ACKNOWLEDGMENT
We are grateful to Xijie ZHOU and Bin XIE of Xiamen University for their recommendations in the design of the research. We appreciate Qian YANG and Hongxia QIU of Yellow Sea Fisheries Research Institute, Chinese Academy of Fishery Sciences for their help in the process of specimens. We also would like to express our gratitude to the crew of Beidou f ishery research vessel.
Supplementary Table S1 δ13Cwmtand δ13Cotovalues of 36 marine f ish species (from the lowest δ15Nwmtto the highest as Table 1)
The reference is Pee Dee Belemnite.
?
 Journal of Oceanology and Limnology2022年2期
- Journal of Oceanology and Limnology的其它文章
- Identif ication of Antarctic minke and killer whales with passive acoustic monitoring in Prydz Bay, Antarctica*
- Eff ects of dissolved oxygen and nutrients from the Kuroshio on hypoxia off the Changjiang River estuary*
- Methane in the Yellow Sea and East China Sea: dynamics,distribution, and production*
- Longitudinal genetic analysis of growth-related traits in red swamp crayf ish Procambarus clarkii (Girard)*
- Early life migration and population discrimination of the small yellow croaker Larimichthys polyactis from the Yellow Sea: inferences from otolith Sr/Ca ratios*
- A new oil spill detection algorithm based on Dempster-Shafer evidence theory*
