Distribution and phenogenetic diversity of Synechococcus in the Bohai Sea, China*
Ting WANG , Xi CHEN , Jialin LI , Song QIN
1 College of Environmental Science and Engineering, Ocean University of China, Qingdao 266100, China
2 Key Lab of Coastal Biology and Biological Resource Utilization, Yantai Institute of Coastal Zone Research, Chinese Academy of Sciences, Yantai 264003, China
3 College of Marine Life Science, Ocean University of China, Qingdao 266005, China
4 Center for Ocean Mega-Science, Chinese Academy of Sciences, Qingdao 266071, China
Abstract Synechococcus is one of the most abundant picocyanobacteria in marine ecosystem, and the absence of Prochlorococcus would make it indispensable as a primary producer in the Bohai Sea, North China. However, the abundance distribution and genetic diversity of Synechococcus in this region have rarely been reported. In this study, the distribution pattern of Synechococcus abundance was investigated during four cruises in April, June, August, and November from 2018 to 2019, moreover, its phenogenetic diversity was studied based on high-throughput sequencing of the cpe BA operon. The results demonstrate that phycoerythrin-containing Synechococcus was most abundant in August when temperature was high and oxygen saturation was low. During this period, Synechococcus pigment type (PT) 2 was abundant in the Bohai Bay and Laizhou Bay under conditions of high nutrient concentration, temperature, and turbidity. In comparison, PT3, especially those clusters characterized with high or variable ratio of phycourobilin and phycoerythrobilin, was predominant in the Bohai Strait and Liaodong Bay under conditions of high salinity,pH, and oxygen saturation. Furthermore, co-occurrence correlations using network analysis revealed that Synechococcus PTs were related to 15.37%- 43.48% of the prokaryotic genera. Synechococcus PT3c/PT3d and PT2 were the most important PTs in the network. The hierarchical clustering revealed that taxa cooccurred with Synechococcus PTs diff ered among samples. It could be attributed to the substance exchange and the environmental impact, which calls for more studies in the future.
Keyword: Synechococcus; phenogenetic diversity; co-occurrence network; coastal ecosystem; Bohai Sea
1 INTRODUCTION
Picocyanobacteria are among the most abundant picoplankton and important primary producers in the marine environment, which mainly consist ofSynechococcusandProchlorococcus(Flombaum et al., 2013; Guidi et al., 2016).Prochlorococcusdominates in the euphotic zone of tropical and subtropical open oceans and rapidly declines at latitudes beyond 40°N and 40°S, as well as at depths below 150 m and temperatures below 15 °C (Johnson et al., 2006). In contrast,Synechococcusis much more widely distributed, existing in ecosystems from equatorial to polar oceans and from estuary to open ocean (Partensky et al., 1999). In particular,Synechococcus is more abundant in coastal (Li, 1998)and upwelling areas (Cuevas and Morales, 2006). The highest abundance so far has been reported in the strong upwelling areas of the Costa Rica Dome,reaching 106cells/mL (Saito et al., 2005). By estimates of hourly carbon f ixation rates, Flombaum et al.(2013) predicted thatSynechococcuswas responsible for 16.7% of ocean net primary production, which is nearly double ofProchlorococcus(8.5%). Recent studies showed thatProchlorococcuswas undetected in sea areas including the north part of the Yellow Sea(Zhao et al., 2019) and Bohai Sea (Yan et al., 2020) in China.Synechococcuswas the dominant picocyanobacteria in the studied area, which may play a more important role in building microbial food webs of the ecosystem.
Phylogenetically, marineSynechococcuscan be classif ied into three subclusters (Herdman et al.,2001), each of which can be further divided into diverse clades (Scanlan, 2012). The genotype ofProchlorococcusis clearly associated with specif ic environmental characteristics, while the biogeography ofSynechococcus’s genotype is ambiguous owing to the parallel evolution ofSynechococcusclades and pigment types (PTs) (Kent et al., 2019). Compared to arbitrary clade delineation,SynechococcusPTs are more directly associated with microbial traits, which can be referred for better investigating the distribution pattern and niche division ofSynechococcus(Martiny et al., 2013). In terms of phenogenetic diversity corresponding to PTs,Synechococcuscan be divided into three main categories, PT1, PT2, and PT3, based on the diff erences in the compositions of phycobiliprotein (PBP) (Everroad and Wood, 2012).SynechococcusPT1 is known to consist of phycocyanin only (PC, encoded by thecpcBA operon), and the rods are composed of phycocyanobilin(PCB,Amax=620 nm) only.SynechococcusPT2 contains both PC and phycoerythrin-I (PE-I, encoded bycpeBA). Its PBP rods consist of both PCB and the phycoerythrobilin (PEB,Amax=550 nm).SynechococcusPT3 is more complex that possesses PC, PE-I, and phycoerythrin-II (PE-II, encoded bympeBA) whose robs bind PCB, PEB, and phycourobilin (PUB,Amax=495 nm). Based on the ratio of PUB:PEB, PT3 has been categorized into at least four subtypes, PT3a (PUB:PEB<0.6), PT3b(0.6<PUB:PEB < 1.6), PT3c (PUB:PEB≥1.6), and PT3d (variable PUB:PEB). Generally, PT1 is conf ined to estuaries and low salinity surface waters dominated by red light, which is almost absent in the oceanic waters (Wood et al., 1998). PT2 appears in transition zones between brackish and oceanic areas or coastal shelf waters (Chung et al., 2015), while PT3 shows an increasing PUB:PEB ratio along the gradient of onshore mesotrophic waters to off shore oligotrophic waters (Larsson et al., 2014). Sequencing methods based on the PBP-encoding genes, such ascpcBA(Haverkamp et al., 2009) andcpeBA (Everroad and Wood, 2006), have been used to distinguish the PTs.ThecpcBA operon can detect PT1, PT2, and PT3 simultaneously, but it almost cannot distinguish the subtypes of PT3. In comparison, thecpeBA operon cannot distinguish PT1 but can identify PT2 and more diverse PT3 subtypes, including 3a, 3c/3dB, and 3b/3dA. It is needed to roughly assess the variety of PTs according to geographical characteristics of the studied sea area, andcpeBA operon was selected to obtain the accurate category information in the Bohai Sea.
As one of the most ubiquitously distributed primary producers,Synechococcusplays important biogeochemical roles in the marine ecosystem(Flombaum et al., 2013; Dvořák et al., 2014).Photosynthesis is the basis of material exchange and energy f low betweenSynechococcusand the ecosystem (Guidi et al., 2016).Synechococcusis also a mixotroph directly incorporating organic resources including amino acids (Paerl, 1991),dimethylsulfoniopropionate (DSMP) (Ruiz-González et al., 2012), and sugars (del Carmen Muñoz-Marín et al., 2017). Via interactions with other microorganisms,Synechococcuscan be indirectly involved in more metabolic activities, which amplify its ecological eff ects (Tai et al., 2009). For example,Synechococcusproduces biomass and ultimately converts it into particulate or dissolved organic matter (DOM)(McCarren et al., 2010). Interactions betweenSynechococcusand heterotrophs targeting DOM supply carbon and energy to marine food webs(Christie-Oleza et al., 2017; Zheng et al., 2020). If these heterotrophic bacteria can metabolize certain substances, the interactions between them will inevitably contribute to the biogeochemical cycle of these substances. Therefore, the unveiling of the relationship between microbes andSynechococcusmay help us better understand the role ofSynechococcusin biogeochemical cycles.
The Bohai Sea is the northernmost off shore of China, which has a typical temperate monsoon climate with obvious seasonal changes. It is composed of the Bohai Bay (BHB), Laizhou Bay (LZB),Liaodong Bay (LDB), and the central area (CA)connected to the Yellow Sea via the Bohai Strait (BS).The three bays are more inf luenced by anthropogenic activity than CA and BS (Lü et al., 2015; Zhang et al.,2015). Variations in environmental conditions between geographical regions may result in the diff erence in the biological distribution of the Bohai Sea. LZB and CA had the maximum annual mean biomass and primary production, while BHB had the lowest values (Wei et al., 2004). Besides, the annual cycle distribution pattern of phytoplankton was changed possibly based on the deepening of human inf luence. In recent years, diatoms were gradually replaced by dinof lagellates in the Bohai Sea. The semi-enclosed geographical location, combined with anthropogenic pollution, might also aff ect the distribution ofSynechococcusin the Bohai Sea.However, its assembly composition and distribution pattern based on molecular methods remain unclear.Furthermore, the presence of various highconcentration pollutants also makes it meaningful to study the co-occurrence relationships betweenSynechococcusand other microbes in this coastal ecosystem.
2 MATERIAL AND METHOD
2.1 Sampling site and strategy
Four cruises were conducted in the Bohai Sea(37°N-41°N, 117°E-121°E) from 2018 to 2019(Supplementary Fig.S1 & Supplementary Table S1).In each cruise, 6- 10 stations were selected in each cruise according to the cruise plan. At each station,seawater was collected in Niskin bottles carried by a CTD rosette sampler (Sea-Bird Electronics Inc.,Bellevue, WA, USA).
2.2 Environmental variable
Physicochemical parameters, including salinity,temperature, turbidity, and depth were recorded in situ using sensors of the CTD sampler (Sea-Bird Electronics Inc., Bellevue, WA, USA). Oxygen saturation, pH, as well as chlorophyll-acontent were measured on boat with a probe (Hydrolab MS5;HACH, Loveland, CO, USA). The nutrient concentrations, including ammonium (NH4+), nitrite(NO2ˉ), nitrate (NO3ˉ), silicate (SiO44ˉ), and phosphate(PO43ˉ) concentrations, were determined using standard colorimetric methods with an AA3 segmented f low analyzer (Seal Analytical GmbH,Germany) (Dafner, 2015). The method detection limits are 0.03 μmol/L for NH4+, 0.008 μmol/L for NO2ˉ, 0.02 μmol/L for NO3ˉ, 0.02 μmol/L for SiO44ˉ, and 0.01 μmol/L for PO43ˉ.
2.3 Flow cytometry for analyzing Synechococcus abundance
In four cruises, seawater samples were collected every 5 m from the surface (0 m) to near the bottom(B) depending on the water depth. Owing to the cruise plan and the limited number of the sampler, 171 samples were collected in quintuplicate (Fig.1).Seawater (1.40 mL) was f ixed with paraformaldehyde(f inal concentration, 0.5%) immediately after collection and then rapidly frozen in liquid nitrogen(Li et al., 2019a). The abundance of PEcontainingSynechococcuswas counted using a BD FACSAriaTMf low cytometer under the f low rate of 6 for 180 s. Fluorescence signals from PE f luorescence,chlorophylla(excited by 488 nm), and PC (excited by 635 nm), as well as side scatter signals were collected. Yellow-green f luorescent beads (2.0 μm,Polysciences, Warrington, PA, USA) were added to each sample as the instrument internal standard (Zhao et al., 2016).Synechococcuswas diff erentiated from the eukaryotic picoplankton based on their red f luorescence signal at 488 nm. In addition, PEcontainingSynechococcuswas distinguished from PC-richSynechococcusandProchlorococcusaccording to their orange f luorescence signal(Supplementary Fig.S2) (van den Engh et al., 2017).
2.4 DNA extraction, PCR, and sequencing
Considering the most abundance ofSynechococcusin August (Yan et al., 2020), analyses of phenogenetic diversity were designed from 29 samples collected during the August 2018 cruise. Seawater was f iltered through 48-μm nylon mesh and 0.22-μm polycarbonate membrane successively (Millipore Co., Bedford,MA, USA). The acquired membranes were stored in liquid nitrogen. After returning to the laboratory, a Fast DNA spin kit (MP BIO, USA) was used to extract DNA from the membrane (Li et al., 2019b). All collected samples were amplif ied via PCR (95 °C for 5 min, followed by 35 cycles at 95 °C for 30 s, 55 °C for 30 s, and 72 °C for 45 s and a f inal extension at 72 °C for 10 min) using primers peBF (5'-barcode-GACCTACATCGCWCTGGGYG-3') and peAR(5'-CCMACAACCARGCAGTAGTT-3') targetingSynechococcusPT2 and PT3, where the barcode is an eight-base sequence unique to each sample (Xia et al.,2018). Purif ied PCR products were quantif ied using Qubit®3.0 (Life Invitrogen) and every 24 amplicons with varying barcodes were mixed equally. The pooled DNA product was used to construct the Illumina pair-end library following Illumina’s genomic DNA library preparation procedure. Then the amplicon library was paired-end sequenced(2×250 bp) by the Biozeron Biological Technology Co., Ltd. (Shanghai, China) using the PE250 Illumina Hiseq sequencing platform (Zhang et al., 2019).Fourteen samples from the surface and bottom layers were selected to conduct the microbial co-occurrence network by amplifying the 16S rRNA gene using primers 515F and 806R (Walters et al., 2016). The purif ied products of the 16S rRNA gene were sequenced at the Majorbio Co., Ltd. (Shanghai,China) using the PE300 Illumina MiSeq sequencing platform.
2.5 Processing of sequencing data
The standard procedure, including quality control(Brown et al., 2017), f iltering of chimeras (Edgar et al., 2011), and elimination of redundancy (Bokulich et al., 2013), was used for processing the raw data of high-throughput sequencing. Only the front-end sequence ofcpeBA operon was selected to analysis.Raw FASTQ f iles were f irst demultiplexed using inhouse Perl scripts according to the barcode sequence information for each sample with the following criteria: f irstly, the 250-bp reads were truncated at any site receiving an average quality score <20 over a 10-bp sliding window, discarding the truncated reads that were shorter than 50 bp. Then, exact barcode matching, two nucleotide mismatch in primer matching, and reads containing ambiguous characters were removed. Sequences were grouped into operational taxonomic units (OTUs) at a dissimilarity of 0.03. ForcpeBA sequences, the representative sequences of 94 OTUs occupying more than 0.1% of all sequences (covered 88% of total reads on average) were selected and aligned with the reference sequences (Supplementary Table S2). The maximum likelihood genetic tree was constructed using Mega 7.014 with the model GTR+G+I and 200 bootstraps (Kumar et al., 1994).The online tool iTOL was used to draw the genetic tree (Letunic and Bork, 2019). For 16S rRNA sequences, the Greengenes v.135/16S database was used to obtain the taxonomic information. The function of the 16S rRNA sequencing data was annotated using the FAPROTAX database in Python v.2.7 (Louca et al., 2016).
2.6 Statistical analysis and visualization
The geographic information and the abundance ofSynechococcusin each station were visualized using the software ODV (Ocean Data View) v5.1.7(Schlitzer, 2002). Statistical analyses were conducted using the SPSS (Statistical Product and Service Solutions) software v17.0 and R language v3.6.1(Ihaka and Gentleman, 1996). All variables were standardized and scaled using R. Analysis of variance(ANOVA) with a post-hoc test (LSD Test) was performed to evaluate the temporal and spatial variation in the abundance and environmental parameters. Pearson correlation matrixes amongSynechococcusabundance and environmental parameters were calculated (one-tailed test). Package car in R was used to calculate variance inf lation factor(VIF) of environmental factors (Fox and Weisberg,2019). Package vegan in R was used to calculate α diversity (represented by Shannon diversity), principal co-ordinates analysis (PCoA), redundancy analysis(RDA), and Pearson correlation matrixes among prokaryotic genera andSynechococcusPTs (Oksanen et al., 2019). Gephi v0.9.2 (Bastian et al., 2009) was used to sketch the co-occurrence network. The hubba(key) score in each network was calculated using a plugin, CytoHubba, in the Betweenness method in software Cytoscape v3.8.0 (Chin et al., 2014).
3 RESULT
3.1 Seawater environmental parameters
The highest mean salinity, turbidity, oxygen saturation, and NO3ˉ and PO43ˉ contents were recorded in April 2018 (hereafter APR) (Table 1). The highest mean temperature, NO2ˉ content, and SiO44ˉ content appeared in August 2018 (hereafter AUG). The mean pH and NH4+content were highest in June 2019(hereafter JUN). The chlorophyll-acontent did not vary signif icantly between the four cruises.
Spatially, samples from bay stations had high levels of NO2ˉ and PO43ˉ and turbidity owing to the exogenous input. In contrast, samples from BS1 and BS2, located in the junction of the Bohai Sea and Yellow Sea, had higher pH and salinity and lower nutrient concentration owing to good exchange of water. Vertically, the chlorophyll-acontent increased signif icantly with water depth from 0-m layers to>30-m layers.
3.2 Temporal and spatial distribution of Synechococcus abundance
The average abundance ofSynechococcusin the Bohai Sea was highest in AUG (9.4×10³cells/mL),followed by that in JUN (4.3×10³cells/mL),November 2019 (hereafter NOV) (1.9×10³cells/mL),and APR (2.6×10²cells/mL) (Fig.1a).
In the APR cruise,Synechococcusabundance was 102cells/mL on an average, with the exception of higher f luctuations in the BHB, where the abundanceranged from several cells/mL (BHB5-5m, LDB1-5m,and LDB1-10m) to 103cells/mL (BHB1-15m, BHB4-15m). In AUG, the averageSynechococcusabundance was more than 30 times of that in APR. Higher abundances (>104cells/mL) were observed in BHB1,BHB2, CA2, and BS2. In particular, the abundance was highest in CA2-10, reaching 8.4×10⁴cells/mL.Higher abundance was always found in the lower andbottom water layers in the water column. In JUN, the highest abundance was detected in LZB2, ranging from 1.5×10⁴cells/mL to 1.6×10⁴cells/mL. Unlike the other Bohai Sea areas, the abundance in LDB was maximum in JUN. In the NOV cruise, in BS2, the abundance was more than 103cells/mL in 5 m to 15 m water layers, while it was only 102cells/mL in other remaining layers.
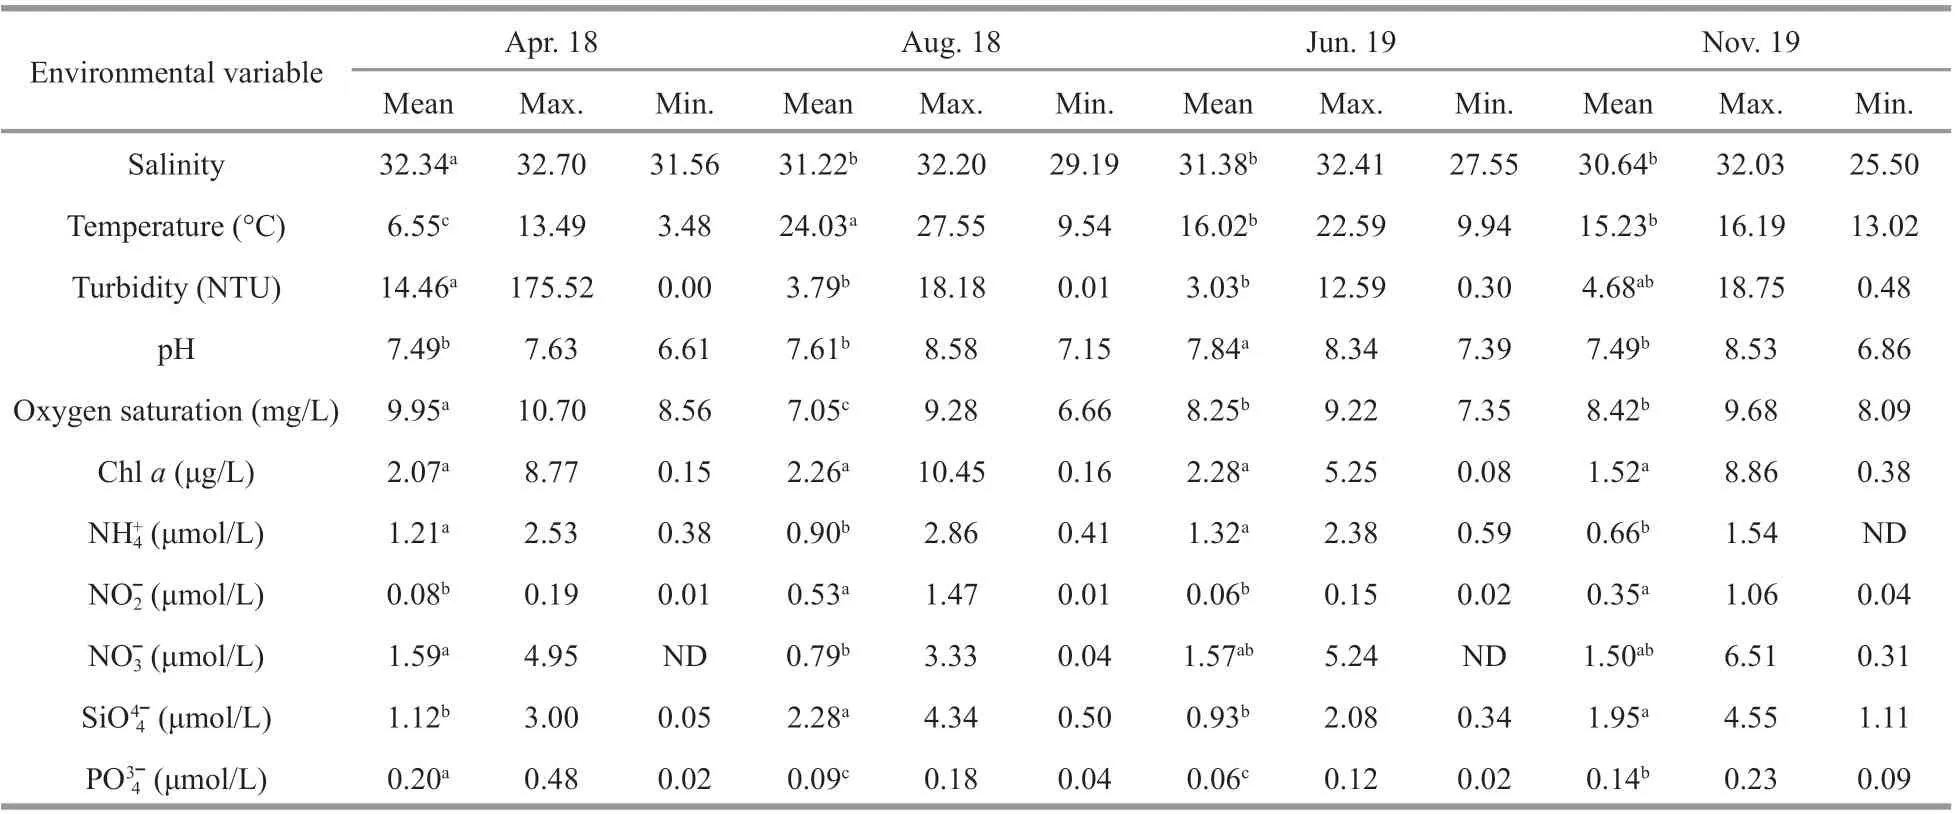
Table 1 Mean, maximum, and minimum values of environmental variables in the Bohai Sea of four cruises
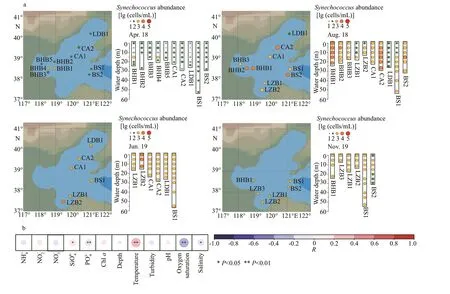
Fig.1 Temporal and spatial distribution of Synechococcus abundance in the Bohai Sea during four cruises (a) and the Pearson correlations between Synechococcus abundance and environmental variables of four cruises (b)

Table 2 RDA with the permutation test between Synechococcus PTs and environmental variables
Based on the calculation of Pearson correlation,PO43ˉ and SiO44ˉ contents, temperature, oxygen saturation, and salinity were found correlated withSynechococcusabundance (Fig.1b). In particular,temperature (R=0.36,P<0.01) and oxygen saturation(R=-0.36,P<0.01) showed the most correlation.
3.3 Phenogenetic diversity of Synechococcus in AUG
The high-throughput sequencing ofcpeBA generated 1 286 538 qualif ied sequences from 29 samples. The Good’s coverage of each sample was >99.9%, indicating adequate assessment in each sample. The OTU number and community diversity(Shannon index) ofSynechococcusPTs always showed strong variation with depth. The minimum detected OTUs and Shannon index appeared in BS1-B. The most diverseSynechococcusPTs were found at station BHB3 where the mean content of NO2ˉ and turbidity were also highest (Fig.2a). The PCoA with Permanova test demonstrated that along the PC1, samples from LZB and BHB were separated from the others (Fig.2b). Along with the PC2, samples from BS were varied signif icantly from those of CA.However, they were not always separated with their geographical patterns; for example, BHB2 located near BHB3 was clustered with CA1 and LDB1.
The maximum-likelihood (ML) tree constructed usingcpeBA sequences showed thatSynechococcusPT2 and PT3a were well classif ied, whileSynechococcusPT3c and 3d formed one clade(Supplementary Fig.S3). In samples of BHB and LZB, PT2 was the majority, with the proportion more than 50%, meanwhile, the percentages of PT3a and PT3c/PT3d were relatively lower (Fig.3). In stations BHB3 and LZB1, PT3c/PT3d rarely occurred with certain unclassif ied sequences. PT3a was most abundant in station BS1, while PT3c/PT3d was most abundant in stations BS2 and LDB1. Besides, a strong vertical variation in the composition ofSynechococcusPTs was detected in station BS1. The percentages of PT2 and PT3a decreased with water depth, and the lowest value of PT2 percentage of this cruise was observed in BS1-B (1.01%). On the contrary, the percentage of PT3c/PT3d increased with depth, and the highest PT3c/PT3d percentage of this cruise was reached in BS1-B (77.19%).
The analysis of VIF f iltered out three environmental variables, pH, temperature, and oxygen saturation.The remaining ten factors, includingSynechococcusabundance, totally constrained 71% community variation ofSynechococcusPTs (P<0.01), according to the RDA with the permutation test (Table 2).Contents of NO2ˉ and chlorophylla, as well asSynechococcusabundance were factors that correlated signif icantly with the composition ofSynechococcusPTs.
Pearson correlation between environmental variables and PTs ofSynechococcusdemonstrated that eachSynechococcusPT was associated with diff erent environmental parameters (Fig.4).SynechococcusPT2 signif icantly correlated with nine environmental parameters, covering six positive relationships and three negative relationships.SynechococcusPT3a signif icantly correlated with f ive environmental parameters, including contents of NO2ˉ, NO3ˉ, PO43ˉ, SiO44ˉ, and chlorophylla(all were negatively correlated).SynechococcusPT3c/PT3d also signif icantly correlated with nine environmental parameters, while the correlation tendency was generally opposite to that of PT2. In addition,compared with PT2,SynechococcusPT3c/PT3d correlated to depth, while did not correlate to the content of chlorophylla. Other unclassif iedSynechococcusPT correlated signif icantly only to the NO3ˉ content.
3.4 Microbial co-occurrence with Synechococcus PTs
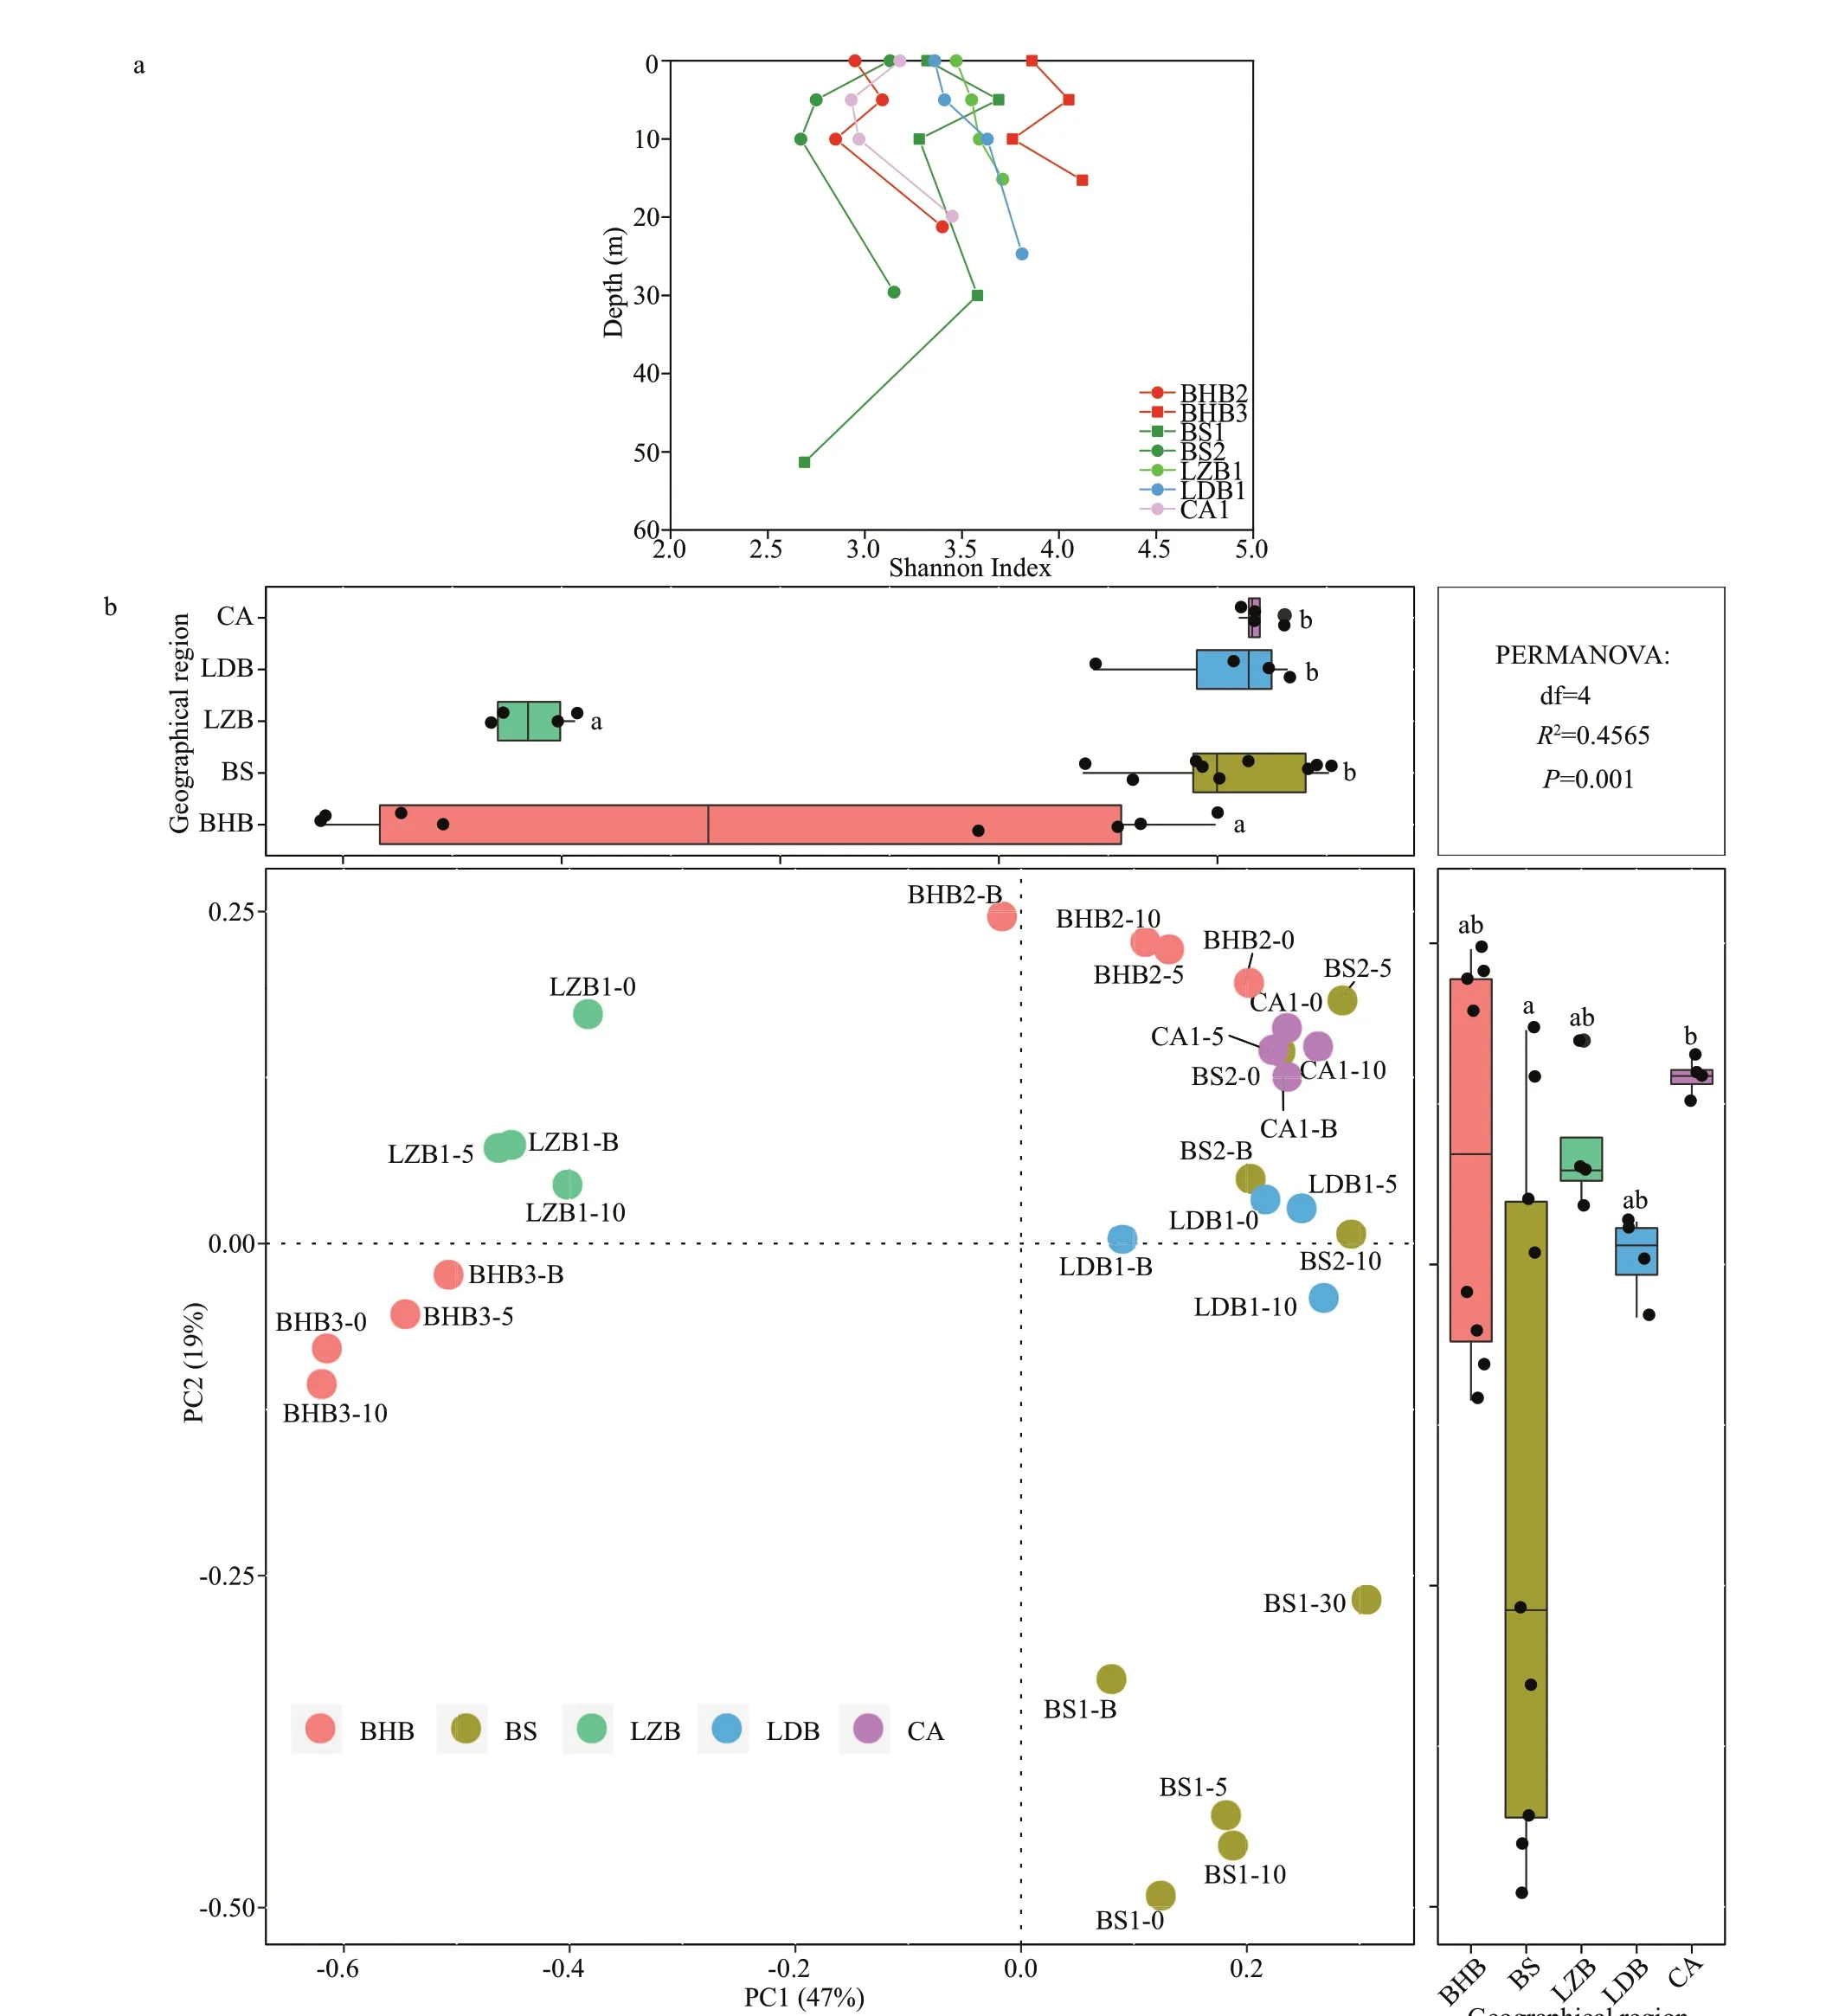
Fig.2 Alpha diversity at OTU level (representative by Shannon index) (a) and the PCoA with Permanova Test at OTU level (b)
The 16S rRNA gene generated 61 317 quality sequences per sample with the Good’s coverage of more than 99.9%. The Shannon index of the prokaryotic community ranged from 2.75 (0-m layer of CA1 (CA1-0)) to 5.03 (bottom layer of BS1 (BS1-B))(Supplementary Fig.S4). In total, 12 phyla were detected with a relative abundance of more than 1% in all samples (Supplementary Fig.S5). Taxa belonging to the phyla Proteobacteria, Actinobacteria, and Cyanobacteria were the most dominant. Cyanobacteria mainly contained the genusSynechococcusaccounted for 2.06% (LZB1-B) to 59.18% (CA1-0) of the prokaryotic community.Prochlorococcuswas not detected. Noticeably, the relative abundance ofSynechococcuscan be heavily underestimated because of the multiple copies of 16S rRNA genes in the genomes of heterotrophic bacteria (Zheng et al., 2020).
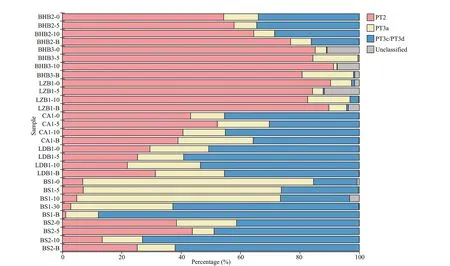
Fig.3 Composition of Synechococcus PTs

Fig.4 Pearson correlation between environmental variables and PTs of Synechococcus
In the co-occurrence network combining the prokaryotic community andSynechococcusPTs,genetic correlation linked 829 nodes via 39 648 connections, corresponding to 39 377 positive and 271 negative correlations (Fig.5). Each node represented a prokaryotic genus orSynechococcusPT. In total,SynechococcusPTs were directly connected to 243 genera, which could be classif ied into 22 phyla. These taxa occupied 15.37%- 43.48%of the whole prokaryotic community. The most abundant phyla related toSynechococcusPTs were Proteobacteria (10.70% on average), Actinobacteria(7.76%), Firmicutes (3.89%), Planctomycetes(2.25%), Bacteroidetes (1.61%), and Verrucomicrobia(1.12%). PT3c/PT3d correlated with most prokaryotic genera (110), followed by PT2 (76) and PT3a (64).Other unclassif ied PTs only correlated with 49 genera.The cytoHubba analysis revealed that PT3c/PT3d(hubba score was 7 304 and rank was 9 of 829 nodes)and PT2 (hubba score was 6 031 and rank was 13 of 829 nodes) were the most important PTs in the network (Supplementary Table S3). In addition,hierarchical clustering of prokaryotic phyla related toSynechococcusPTs demonstrated that BS1 was farthest from other samples.
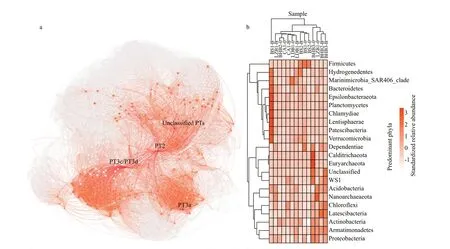
Fig.5 Microbial community co-occurrence network associated with Synechococcus PTs (a) and the heat map showing the scaled relative abundance of predominant phyla associated with Synechococcus PTs using color legend (b)
4 DISCUSSION
During the four cruises, the abundance ofSynechococcusexhibited seasonal variations of AUG> JUN > NOV > APR (Fig.1), which is in accordance with the biomass of autotrophic picoplankton in the Bohai Sea in 2015 (Yan et al., 2020). By comparison,the abundance in August ofSynechococcusdetected in 2015 was two orders of magnitude higher than the result in this study. In addition to the inter-annual changes, the absence of some high-abundance stations might be responsible for the lower abundance.Previous studies have observed thatSynechococcusabundance in southeastern CA was as high as 106cells/mL, which was close to the highest knownSynechococcusabundance in the world (Saito et al.,2002). This area was not sampled due to the cruise plan. In terms of abundance range,Synechococcusin Bohai was more similar to that in the Yellow Sea and East China Sea. The averageSynechococcusabundance ranged from 104cells/mL from August to October in the Yellow Sea (Li et al., 2006), which decreased to 3.5×10²cells/mL and 7.49×10³cells/mL during the 2007 spring bloom (Zhao et al., 2013).From May to August, the abundance in the East China Sea was between 2.5×10²cells/mL to 2.9×10⁴cells/mL and 2.6×10²cells/mL to 1.4×10⁵cells/mL for the non-bloom and bloom forms, respectively (Zhao et al., 2016). Spatial variations inSynechococcusabundance were followed the trend CA (7.7×10³cells/mL) > BHB (4.9×10³cells/mL) > LZB (4.0×10³cells/mL) > BS (2.6×10³cells/mL) > LDB (1.1×10³cells/mL). This demonstrated that there were regional characteristics in the abundance distribution ofSynechococcusin the Bohai Sea.
The common assumption of the marine geographic distribution ofSynechococcusPTs was that various PTs often co-occur but with one type of dominants(Haverkamp et al., 2009).Synechococcusphenogenetic diversity was markedly diff erent along two turbidity gradients in the South and East China Seas:SynechococcusPT2 dominated in the coastal waters of the South China Sea with high turbidity;SynechococcusPT3c/PT3d were predominant in oceanic waters of the South China Sea, while PT3a was the major pigment type throughout the transect of the East China Sea (Xia et al., 2018). Consistent with the assumption, a more complex distribution pattern was demonstrated in the Bohai Sea. PT2 was abundant in the BHB and LZB but less in the BS, which could be severely aff ected by the input of exogenous substances. PT3 showed an opposite distribution trend, which was predominant in the BS, CA, and LDB and rare in the BHB and LZB. In particular,PT3a (green-light specialists) with low PUB:PEB(<0.6) was the most abundant in the BS1, while the others (blue-light specialists or chromatic acclimation)were dominant in the LDB and BS2. It should be noted that thecpeBA gene cannot identifySynechococcusPT1 with PC-only. However, from the Tara Oceans database, PT1 was almost absent in oceanic waters (Grébert et al., 2018). The distribution pattern ofSynechococcusPTs is determined by multiple factors, including geographical region and environmental parameters. The correlation analysis between PTs and environmental variables further demonstrated that PT2 occupied regions with high nutrient concentration, temperature, and turbidity;PT3, especially those that possessed high or variable PUB:PEB, acclimated in seawaters of high salinity,pH, and oxygen saturation (Fig.4). Over the past few decades,SynechococcusPTs distribution and their constraints were investigated worldwide, including the Chesapeake Bay (Chen et al., 2004), the Martha’s Vineyard coastal observatory (Hunter-Cevera et al.,2016), the Baltic Sea (Larsson et al., 2014), the oceanic water of the Atlantic (Olson et al., 1988), and the Black Sea (Wood et al., 1998). The coincided conclusion is that PT2 dominant in coastal shelf waters or the transition zones with intermediate optical properties, while PT3 is abundant over onshore mesotrophic waters (green-light dominance) to off shore oligotrophic waters (blue light penetrates the deepest). As the second-most abundant phytoplankton group in the global marine ecosystems, the contribution ofSynechococcusto global primary production and carbon cycling is a matter of interest for scientists worldwide (Guidi et al., 2016). Providing photosynthetic organic carbon as output materials,Synechococcuscan coexist via extensive interactions with various heterotrophic bacteria, such as Flavobacteria, Bacteroidetes, Phycisphaerae,Gammaproteobacteria, and Alphaproteobacteria(Christie-Oleza et al., 2015; Zheng et al., 2018, 2020).Based on the co-occurrence network, the relationship was constructed betweenSynechococcusand numerous prokaryotic genera in situ (Fig.5). These genera can be divided into 22 phyla, which occupied 15.37%- 43.48% of the whole prokaryotic community,highlighting the important role ofSynechococcusin the ecosystem. In addition, the result of cytoHubba analysis demonstrated that amongSynechococcusPTs, PT3c/PT3d and PT2 contributed more to the microbial community than others (Supplementary Table S3). AlthoughSynechococcuscan directly incorporate and release some substances (Moore et al., 2002; Bertilsson et al., 2003), labile cellular products released via viral-mediated cell lysis are the main materials that are interchanged with heterotrophic bacteria (Middelboe et al., 2003). In addition to cycle back into the atmosphere in the form of CO2, the carbon derived from cell lysates can be transported via the dissolved organic carbon (DOC)-bacteria-DOC loop (Talmy et al., 2019). Nitrogen, phosphorus,and other nutrients are regenerated as inorganic compounds during the degradation of cell lysates,which can also support localized microbial survival(Haaber and Middelboe, 2009; Zheng et al., 2021).Functional microbiota participating in nitrogen cycle activities identif ied using the FAPROTAX database,which is a powerful database relating species taxonomy to functional annotation based on 16S rRNA high-throughput sequencing (Louca et al.,2016). The result showed that the f ive genera participating in the nitrogen cycle and co-occurred withSynechococcusPTs wereKordia,Aeromonas,Stenotrophomonas, SUP05 cluster, andThauera(Supplementary Fig.S6). It is well known thatSynechococcusis photosynthetic oxygen-producing plankton, while the role ofSynechococcusin nitrogen cycles is ambiguous; hence, investigating how they are associated with bacteria in nitrogen reduction activities is worthwhile. The co-occurrence between them might be attributed to the degradation of nitrogen compounds from DOM ofSynechococcusby these microbes, but it needs to be verif ied using co-culture systems and more genomic data in further work.
5 CONCLUSION
The abundance ofSynechococcuswas investigated in the Bohai Sea during the four cruises using f low cytometry. The result revealed regional and temporal variations inSynechococcusabundance among the f ive regions of the Bohai Sea. The phenomenon may be attributed to the change of environmental factors,as temperature and oxygen saturation. Considering AUG as a representative, the genus composition ofSynechococcusPTs was studied based on highthroughput sequencing of thecpeBA operon,demonstrating that PT2 abundant in regions with high nutrient concentration, temperature, and turbidity;PT3 predominant in waters of high salinity, pH, and oxygen saturation in the Bohai Sea. The results showed the phenogenetic diversity ofSynechococcusin the Bohai Sea for the f irst time, which is prospective to explore the eff ects of human activities or environmental changes on the distribution characteristics and community composition of pico-plankton in the coastal sea. Besides, the correlationship betweenSynechococcusPTs and numerous prokaryotic genera was analyzed, which showed divergent composition between samples. The co-occurrence might be attributed to the interchange of substances and the impacts of environmental variables. The result suggested that co-occurred microbes may involve in nitrogen metabolism, which is a clue for the future research of the ecological function of eachSynechococcusPT in biogeochemical cycling.
6 DATA AVAILABILITY STATEMENT
The sequence data of this study were deposited in the sequence read archive of NCBI (US National Center for Biotechnology Information; https://www.ncbi.nlm.nih.gov/). A bio-project associated with this study was applied for and processed in NCBI with the accession number PRJNA 688318. All raw sequencing data were stored under this accession number.
7 ACKNOWLEDGMENT
The samples were collected by R/VChuangxin I.We acknowledge the assistance from the Engineering and Technical Service, Institute of Oceanology,Chinese Academy of Sciences, for organizing research voyages and sharing open data. We extend our gratitude to the journal reviewers for their comments and suggestions, which helped in signif icantly improving the manuscript.
 Journal of Oceanology and Limnology2022年2期
- Journal of Oceanology and Limnology的其它文章
- Identif ication of Antarctic minke and killer whales with passive acoustic monitoring in Prydz Bay, Antarctica*
- Eff ects of dissolved oxygen and nutrients from the Kuroshio on hypoxia off the Changjiang River estuary*
- Methane in the Yellow Sea and East China Sea: dynamics,distribution, and production*
- Longitudinal genetic analysis of growth-related traits in red swamp crayf ish Procambarus clarkii (Girard)*
- Early life migration and population discrimination of the small yellow croaker Larimichthys polyactis from the Yellow Sea: inferences from otolith Sr/Ca ratios*
- A new oil spill detection algorithm based on Dempster-Shafer evidence theory*
