Tidal currents in the coastal waters east of Hainan Island in winter*
Min LI , Lingling XIE ,**, Xiaolong ZONG , Junyi LI , Mingming LI ,Tong YAN , Ronglei HAN
1 Laboratory for Coastal Ocean Variation and Disaster Prediction, Guangdong Ocean University, Zhanjiang 524088, China
2 Key Laboratory of Climate, Resources and Environment in Continental Shelf Sea and Deep Sea of Department of Education of Guangdong Province, Guangdong Ocean University, Zhanjiang 524088, China
3 Marine Resources Big Data Center of South China Sea, Southern Marine Science and Engineering Guangdong Laboratory(Zhanjiang), Zhanjiang 524013, China
4 Institute of Marine Sciences, Shantou University, Shantou 515063, China
5 South China Sea Institute of Oceanology, Chinese Academy of Sciences, Guangzhou 510301, China
6 Southern Marine Science and Engineering Guangdong Laboratory (Guangzhou), Guangzhou 511458, China
7 Key Laboratory of Space Laser Communication and Detection Technology, Shanghai Institute of Optics and Fine Mechanics,Chinese Academy of Sciences, Shanghai 201800, China
Abstract Using the 25-h continuing hydrographic observations at three successive stations in February 2012 and the mooring time series of current observations from January to March 2015, the tidal currents and tidal energy f luxes in the coastal waters east of Hainan Island in the northwestern South China Sea were analyzed. The diurnal and semidiurnal (using K 1 and M 2 as proxies, respectively) tidal currents and associated isopycnal undulations were derived with harmonic analysis. Results show that the velocities of the diurnal and semidiurnal tides derived from the 25-h observations are comparable to those from the mooring series. The semi-major axes of the tidal ellipses were O(4-7 cm/s) for barotropic tides and O(2-4 cm/s)for baroclinic tides. The directions were in NE-SW at deeper stations to N-S at the shallowest station for the diurnal tide and from NW-SE to NE-SW for the semidiurnal tide. Both the diurnal and semidiurnal isopycnal f luctuations reached O(5 m), O(8 m), and O(10 m) at the cross-shelf stations (H03, H04, and H05) from 35 m, 45 m, to 55 m, respectively, showing insignif icant vertical variation, and the barotropic signals were predominate. The baroclinic diurnal tide showed f irst-mode structures at H03-05, as does the semidiurnal tide at H03. The semidiurnal tide at H04 and H05 exhibited higher-mode structures. The time series of both the alongshore and cross-shore components reveal the vertically propagation features of the baroclinic tidal phase and energy. The calculated horizontal energy f luxes of the diurnal and semidiurnal internal tides decreased from O(0.1 W/m) at H05 to O(0.01 W/m) at H03, implying a propagation and dissipation of energy from off shore to inshore.
Keyword: tidal current; barotropic tide; internal tide; energy f lux; east of Hainan Island
1 INTRODUCTION
Tidal currents, as a type of intrinsic motion and an important dynamic process in the ocean, play an important role in ocean circulation, mixing, and the ocean ecosystem (Munk and Wunsch, 1998; Egbert and Ray, 2000). Improving the understanding of tidal motions and related mechanisms, especially the tidal features in coastal regions, is crucial to engineering projects, f ishery production, and economic activities.The region east of Hainan Island (often called Qiongdong, the east of Hainan Island) is on the northwestern South China Sea (SCS) shelf and slope,with a rather f lat topography near the coast and a steep continental slope off shore. The isobaths in this area are nearly parallel to the coastline in the northeastsouthwest (NE-SW) direction. The shoaling features and existence of seasonal upwelling/downwelling near the coast (Xie et al., 2012; Hu and Wang, 2016;Xie et al., 2017) provide a complex dynamical environment for tidal currents, as well as the propagation and possible local production of internal tides.
Some early studies in the 1980s depicted the properties of the tidal current east of Hainan Island using model simulation. Ye and Robinson (1983)used a two-dimensional hydrodynamic model to show that the velocities of both the K1and M2tidal currents are less than 5 cm/s east of the island and approximately 5-10 cm/s in the northeast. Ding (1986) showed that the major axes of both the K1and M2tidal current ellipses are parallel to the isobaths in the north and are aligned across the isobaths in the south. The vector of the K1tide rotates clockwise, while that of the M2tide rotates anticlockwise. Fang (1986) combined simulation and observation to provide the cotidal chart and distribution of the velocity maxima of the K1and M2tides around Hainan Island. The results showed that the maximum velocity of the K1tide was approximately 10 cm/s in the east and more than 20 cm/s in the northeast; meanwhile, that of the M2tide is 10 m/s in the east and between 10 and 20 cm/s in the northeast. Cao and Fang (1990) and Fang et al.(1994) used the mean of K1and O1to represent the diurnal tide and showed the cotidal chart and tidal currents of the diurnal tide and M2tide, revealing that the major axes of the diurnal tidal ellipses in the east of Hainan Island are mainly in the NW-SE direction,while those of the M2tidal ellipses are nearly in the N-S direction. Fang et al. (1999) simulated the four principal tidal constituents and showed that the tide in the SCS is preserved by the tidal energy f lux from the Luzon Strait. Zu et al. (2008) analyzed the tides and dynamic processes in the SCS using a barotropic tide model in which the altimetry data were assimilated.Zhu (2009) and Yang et al. (2013) used the f initevolume coastal ocean model to simulate the tide and tidal currents in the northern SCS and China seas,respectively. Gao (2013) showed the tidal ellipses of the four primary constituents in the entire SCS using the adjoint assimilation method. The model simulations concentrated either on large domains with robust results in the shallow shelf region, or on specif ic regions in deep water, the tide condition on the shallow shelf east of Hainan Island remains uncertain.
Regarding the observational analysis of the tidal current east of Hainan Island, one of the areas east of Hainan Island that has received attention in the literature is the off shore region of Wenchang (Ke,2007; Xu et al., 2011; He et al., 2012). Analysis of mooring data for approximately six months at a station deeper than 100 m off shore Wenchang showed that the diurnal internal tide is prominent with semidiurnal internal tides arising intermittently (Ke,2007). Xu et al. (2011) analyzed a two-month time series obtained from the Acoustic Doppler Current Prof iler (ADCP) off shore the Wenchang station and found that the M2tide is the dominant barotropic tidal constituent. Although the diurnal tide was found to be mainly a f irst-mode tide, the semidiurnal tide exhibited a higher modal structure. However, He et al. (2012)showed that the clockwise O1tide is dominant east of Wenchang using a year-long time series at the surface layer. The velocities of the clockwise-rotating K1and anticlockwise-rotating M2are both weak (less than 2 cm/s). They also found that the tide type is mainly irregular diurnal on the northern shelf and slope and becomes diurnal in the deep region. The region near Xisha Island is also a research hotspot. Deng et al.(2013) analyzed a 21-d velocity time series obtained on the shelf near Xisha Island in July and found that the barotropic tide was dominant and the baroclinic tide was weak. The barotropic tide is mainly the K1tide, followed by the O1tide, both of which have clockwise-rotating ellipses. Yan et al. (2016)investigated the features of the tides northwest of Xisha Island using a f ive-year moored time series;their results revealed that the diurnal signals were dominant in both the barotropic and baroclinic tides.The barotropic velocity vectors of the four main constituents rotate clockwise except for that of the M2tide. The baroclinic K1tide appears to exhibit a semiannual variation with stronger signals in the summer and winter. Yan et al. (2020) presented the tidal ellipses of four principal constituents from moored time series in the northeast, southeast, and south of the Hainan Island approximately along the 50-m isobath. The results showed that the major axes of all the four constituents in the northeast are nearly in the N-S direction and the maximum velocity of the semidiurnal tide is 14.4 cm/s, which is about twice that of the diurnal tide. The ellipses in the southeast and south are approximately along the isobaths and the velocity of the diurnal tide is stronger than that of the semidiurnal tide.
Studies on the tidal current east of Hainan Island show limitations in the nearshore region. Particularly,intensive observations are rare to reveal the crossshelf variation of the tidal current on the shallow shelf. Moreover, previous studies have shown that the tide type east of Hainan Island is complicated, and it is the transition region of two tide/tidal current types,irregular semidiurnal tide/tidal current and irregular diurnal tide/tidal current (Editorial Board of Marine Atlas, 2006; Yan et al., 2020). Therefore, more works are necessary to sharpen our view of the tidal current in this region. In this study, we focus on the properties and variation of the tidal current using data obtained from three successive stations northeast of Hainan Island (off shore Bo’ao city) and a two-month moored time series from a seabed-based platform southeast of the island (off shore Wanning city). Section 2 introduces the data and methods used in this study and Section 3 provides background f ields, such as hydrography and wind, the properties of the barotropic tides, and the features and energy f lux of the internal tides, as well as their eff ects on the isopycnal f luctuations. Discussion and conclusion are provided in Section 4 and Section 5, respectively.
2 MATERIAL AND METHOD
2.1 Successive observation at three stations
During the cruise investigation in the winter of 2012, three successive stations (H03-05, Fig.1)across the shelf northeast of Hainan Island were implemented from 15:58 (local time), February 23 to 17:39 (local time), February 24. The depths of the three stations are 34 m (H03), 44 m (H04), and 54 m (H05), respectively, and the distance between two adjacent stations is 4.3 km. The observation order is H03-H04-H05, which means the observation was repeated beginning at H03 after f inishing at H05. Current and hydrographic prof iles were obtained from shipboard 300-kHz ADCP and a conductivity-temperature-depth (CTD) prof iler approximately every three hours at each station,resulting in nine observations for each station. The ADCP was set up at the side of the ship and maintained at 6-m depth. The depth bin was 4 m and the sampling interval was 30 s.
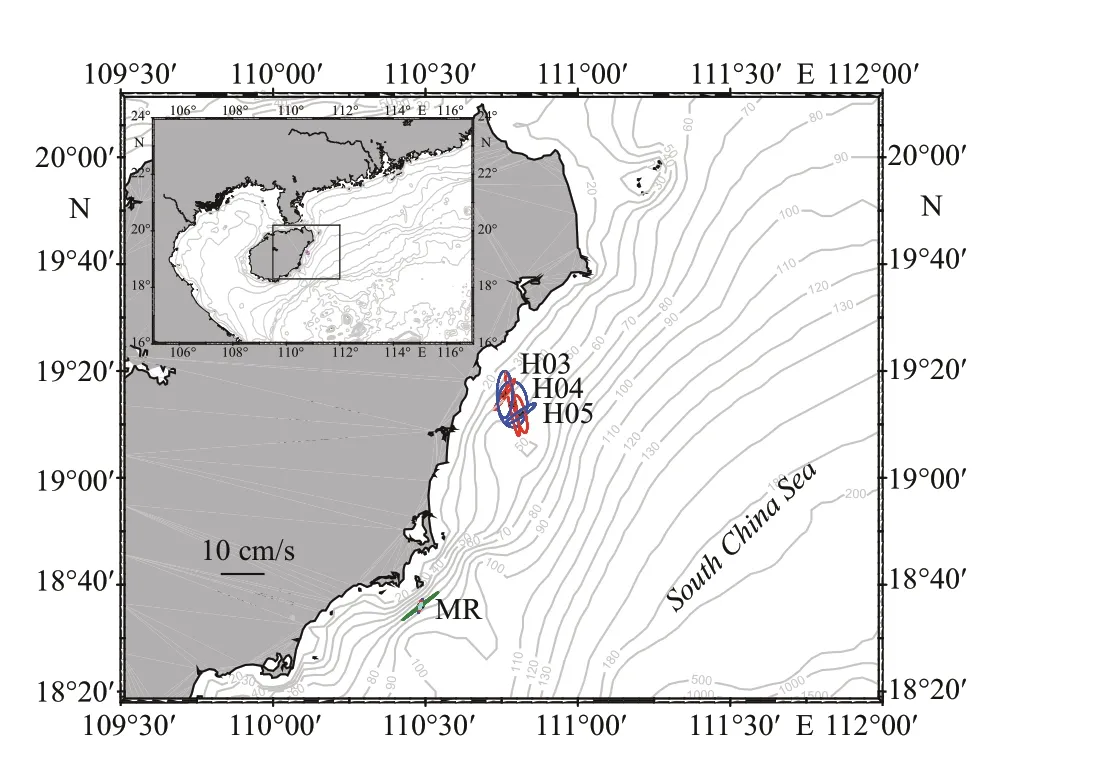
Fig.1 Bathymetry of northern South China Sea and zoomed-in study domain based on ETOPOv2 global topography
2.2 Mooring time series off shore of Wanning
A seabed-based monitoring platform system with an upward-looking ADCP was deployed off shore of Wanning, Hainan (18°36′N, 110°29′E) from January 6 to March 3, 2015 (MR, Fig.1). The data depths ranged from 4 m to 78 m, with temporal and vertical resolutions of 10 min and 2 m, respectively. The data were used to present the tidal current southeast of Hainan Island. Unfortunately, the hydrography or stratif ication information is unknown because there is no hydrographic sensor on the platform.
2.3 Methodology
To qualify the tidal current, the least square method is applied to extract the diurnal and semidiurnal tides from the barotropic and baroclinic currents at the three successive stations. Previous studies revealed that lunisolar tide (K1, period: 23.94 h) and principal lunar tide (M2, period: 12.42 h) are two primary tidal components northeast of Hainan Island (Fang, 1986).Note that the time series used here is not long enough to distinguish between the K1and O1tides or between the M2and S2tides. Therefore, we mainly focus on two major constituents, K1and M2, for the successive stations.

The vertically averaged current is regarded as the barotropic current:whereHdenotes the depth of the data and the subscript“bt” means barotropic. The barotropic current is regarded as the sum of the barotropic K1and M2tidal currents and the residual,

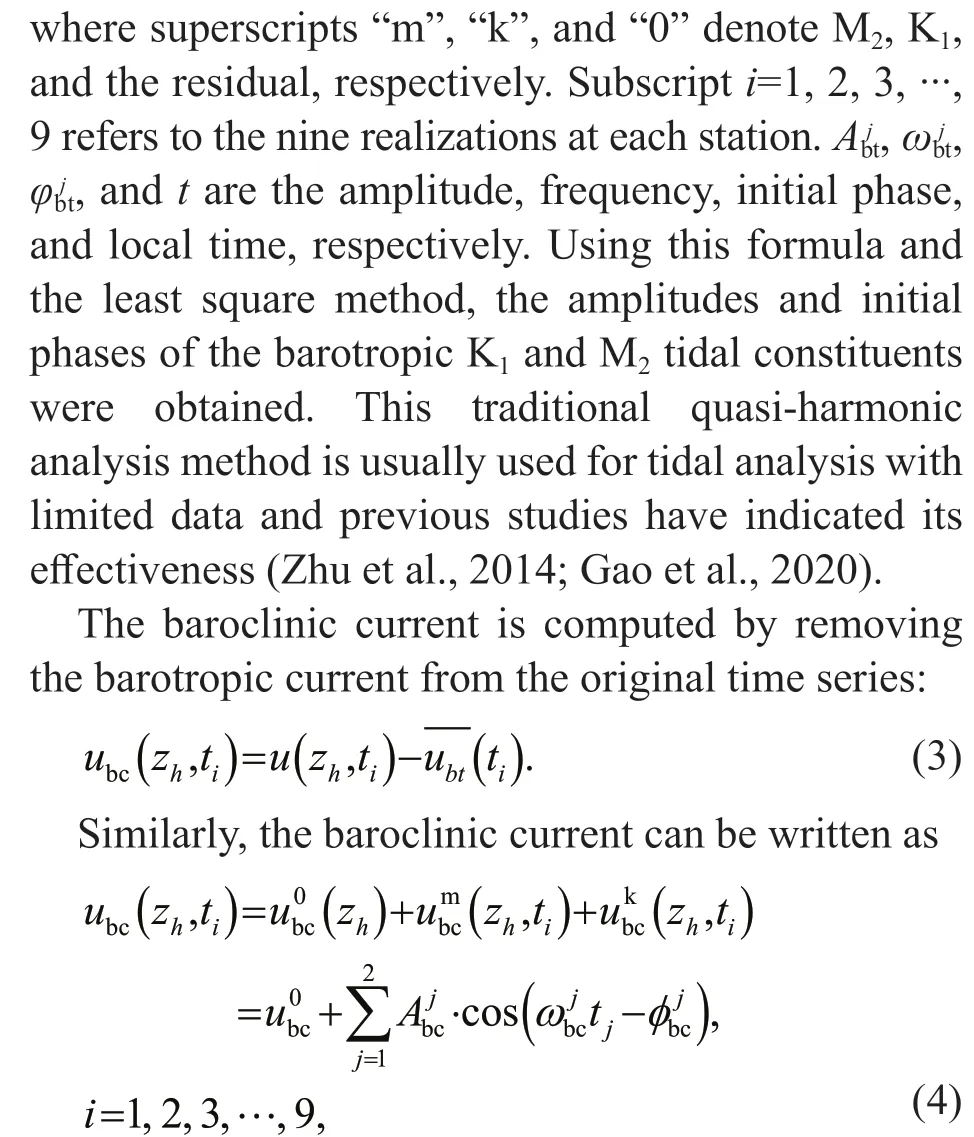
where subscript “bc” means baroclinic. The amplitudes and initial phases of the baroclinic K1and M2tidal currents were obtained using the same method and process.
Regarding the mooring data, the depth-average method is also used to obtain barotropic and baroclinic signals. The T-Tide harmonic analysis toolbox(Pawlowicz et al., 2002) was applied to the barotropic and baroclinic time series to extract the four major tidal components.
3 RESULT
3.1 Background f ield
3.1.1 Hydrography
The diff erence in potential temperatures at the upper and lower layers is approximately 1 °C at both H03 and H04 and approximately 2 °C at H05(Fig.2a-c). The depth of the thermocline is ~20 m at the two shallow stations and approximately 10 m deeper at the deep station. The isotherms reveal prominent rises and falls with time at the three stations(Fig.2a-c), with a gradually decreasing amplitude from H05 to H03 (i.e., from off shore to inshore).Unlike the temperature, the vertical gradient of salinity increases from off shore to inshore. At H03 and H05, the isohalines show periodic f luctuations(Fig.2d & f), a situation similar to the isotherm variation, although the salinity was uniform during the observation at H05 (variation below 0.1). The stratif ication is strong at almost all depths at H03 and H04, especially at 10-20 m (Fig.2g & h). At H05,there are two patches with low stratif ication of approximately 10-6/s2(Fig.2i), 18:00-00:00 below 30 m and 00:00-06:00 above 20 m, likely resulting from the enhanced mixing induced by the tidal and wind forcing, respectively.
3.1.2 Current
To investigate the current features related to the bottom topography, a new coordinate system is def ined in which thex-axis is across the shore (139°T)and they-axis is along the shore (49°T) with positive directions corresponding to the southeastward and northeastward directions, respectively. Note that the section was designed to be nearly perpendicular to the isobaths.
The barotropic current is dominant in the raw velocity f ield, which is shown as a strongly consistent feature with depth in Fig.3. The velocity maximum at H03 is approximately 10 cm/s and the currents are stronger at H04 and H05, reaching ~20 cm/s. The current in the cross-shore direction is prominently strong at H05, exhibiting a strong northwestward f low. The cross-shore velocity components at H03-05 are comparable to the along-shore components. The wind forcing is usually regarded as an important inf luence factor of the current structure and variability on the shallow continental shelf, which can also be seen later in Section 3.1.3. The cross-shore velocities at H03 reveal diurnal signal (Fig.3a), while the other scenarios of the velocities present remarkable semidiurnal signals (Fig.3b-f). Using the method mentioned above, the barotropic and baroclinic currents at all stations were computed (Fig.4). The velocity maxima of both the barotropic and baroclinic currents at H03 and H04 are ~10 cm/s and ~12 cm/s at H05. In addition, the percentages of barotropic current in the original current are calculated (numbers at the upper left of Fig.4a-c). The barotropic currents at all three stations present a periodic variation that is possibly caused by diurnal or semidiurnal signals,occupying a rather large portion (more than 60%) of the original current. The cross-shore baroclinic current at H03 displays a two-layer structure during the observation, while the along-shore component at H03 and both components at H04-05 present a highmode structure.
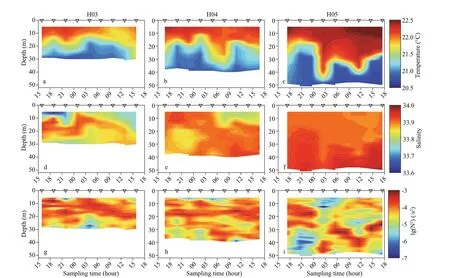
Fig.2 Potential temperature (a-c), salinity (d-f), and buoyancy frequency (g-i) at H03-05
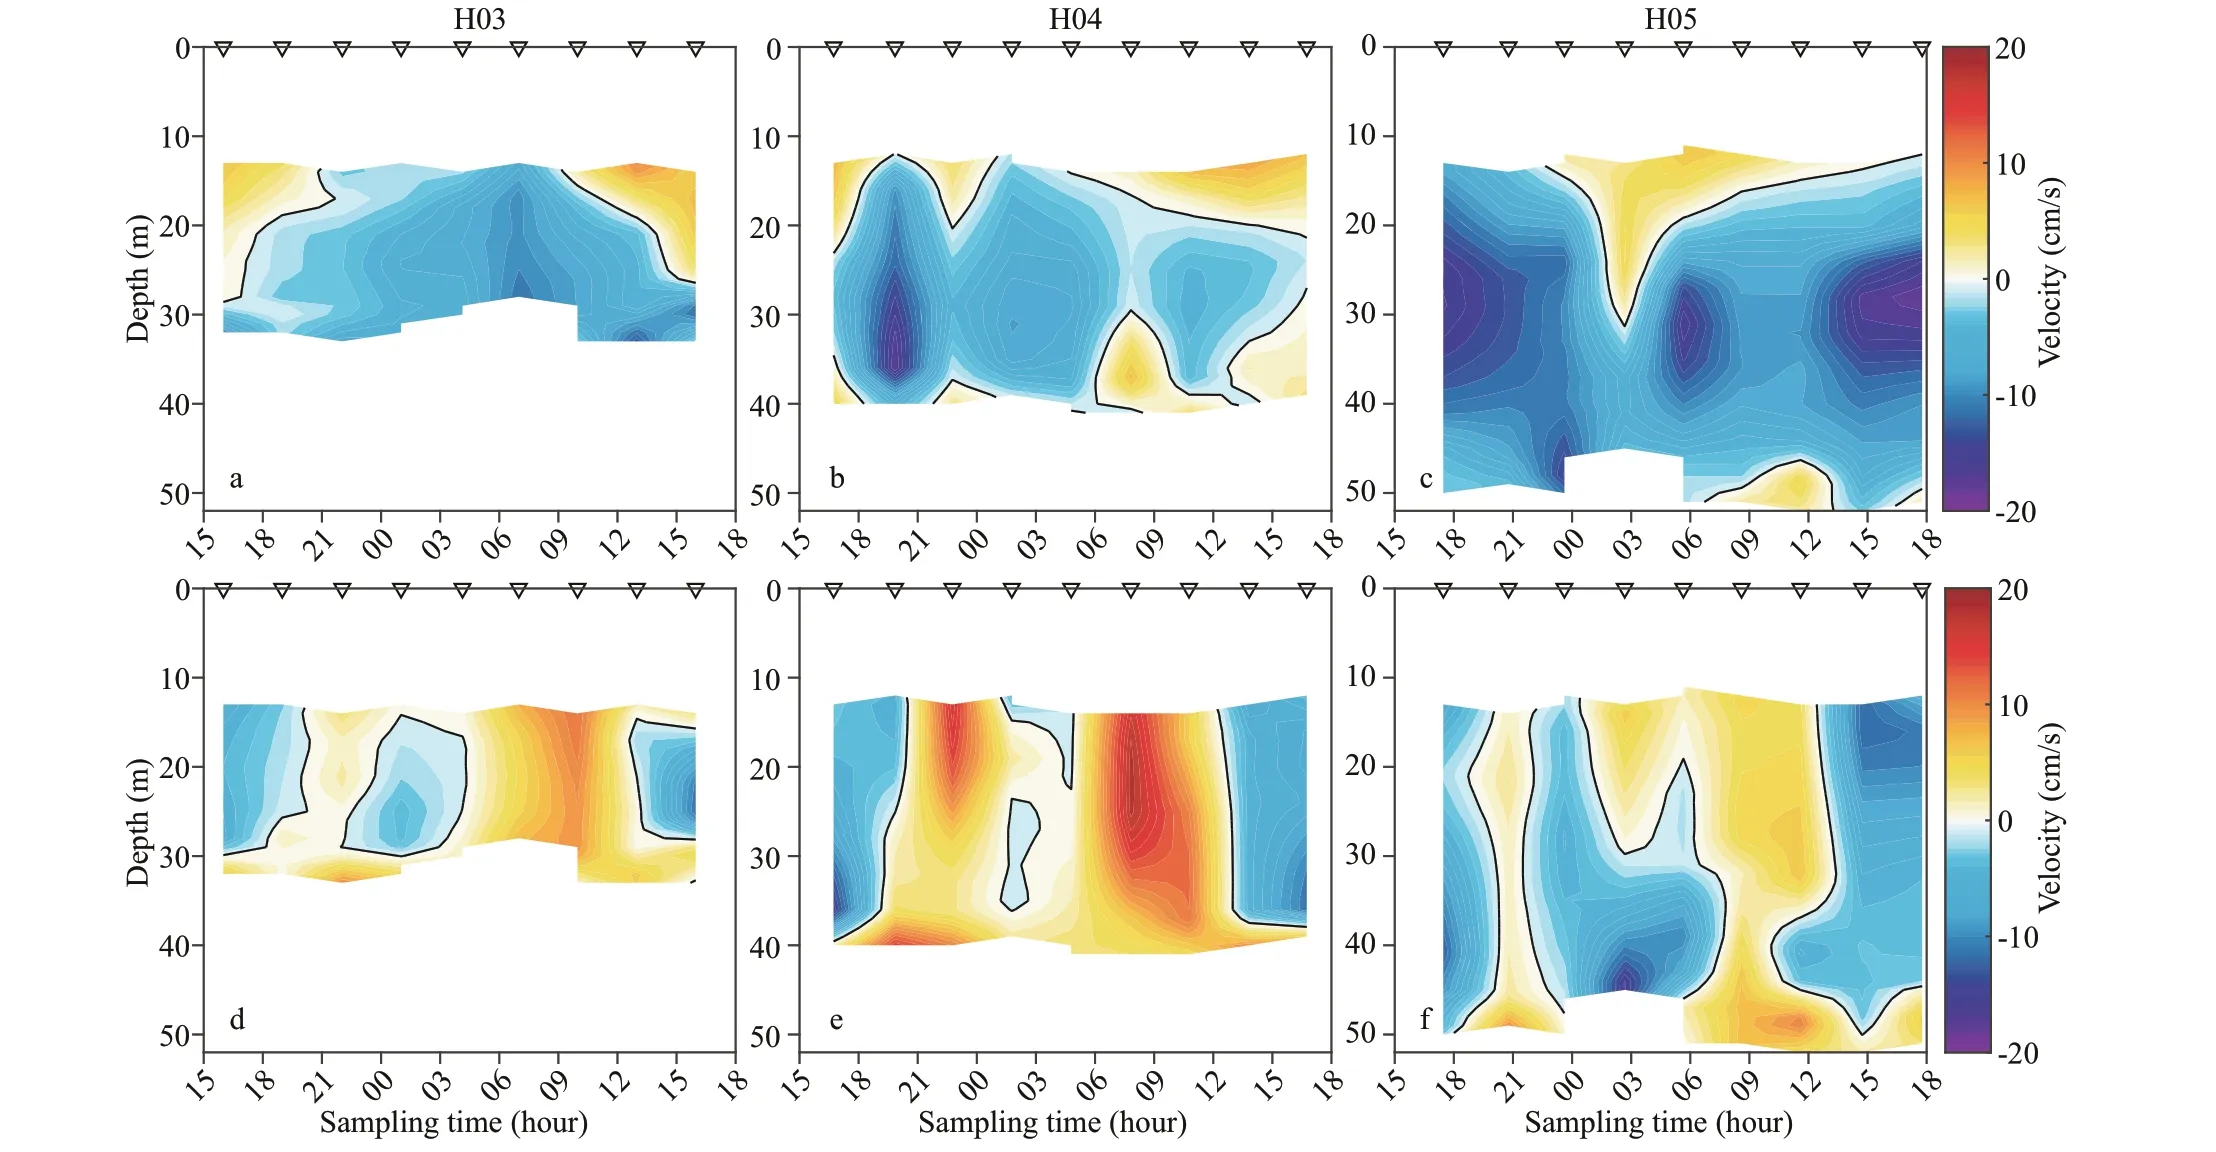
Fig.3 Variation of the raw current at three successive stations
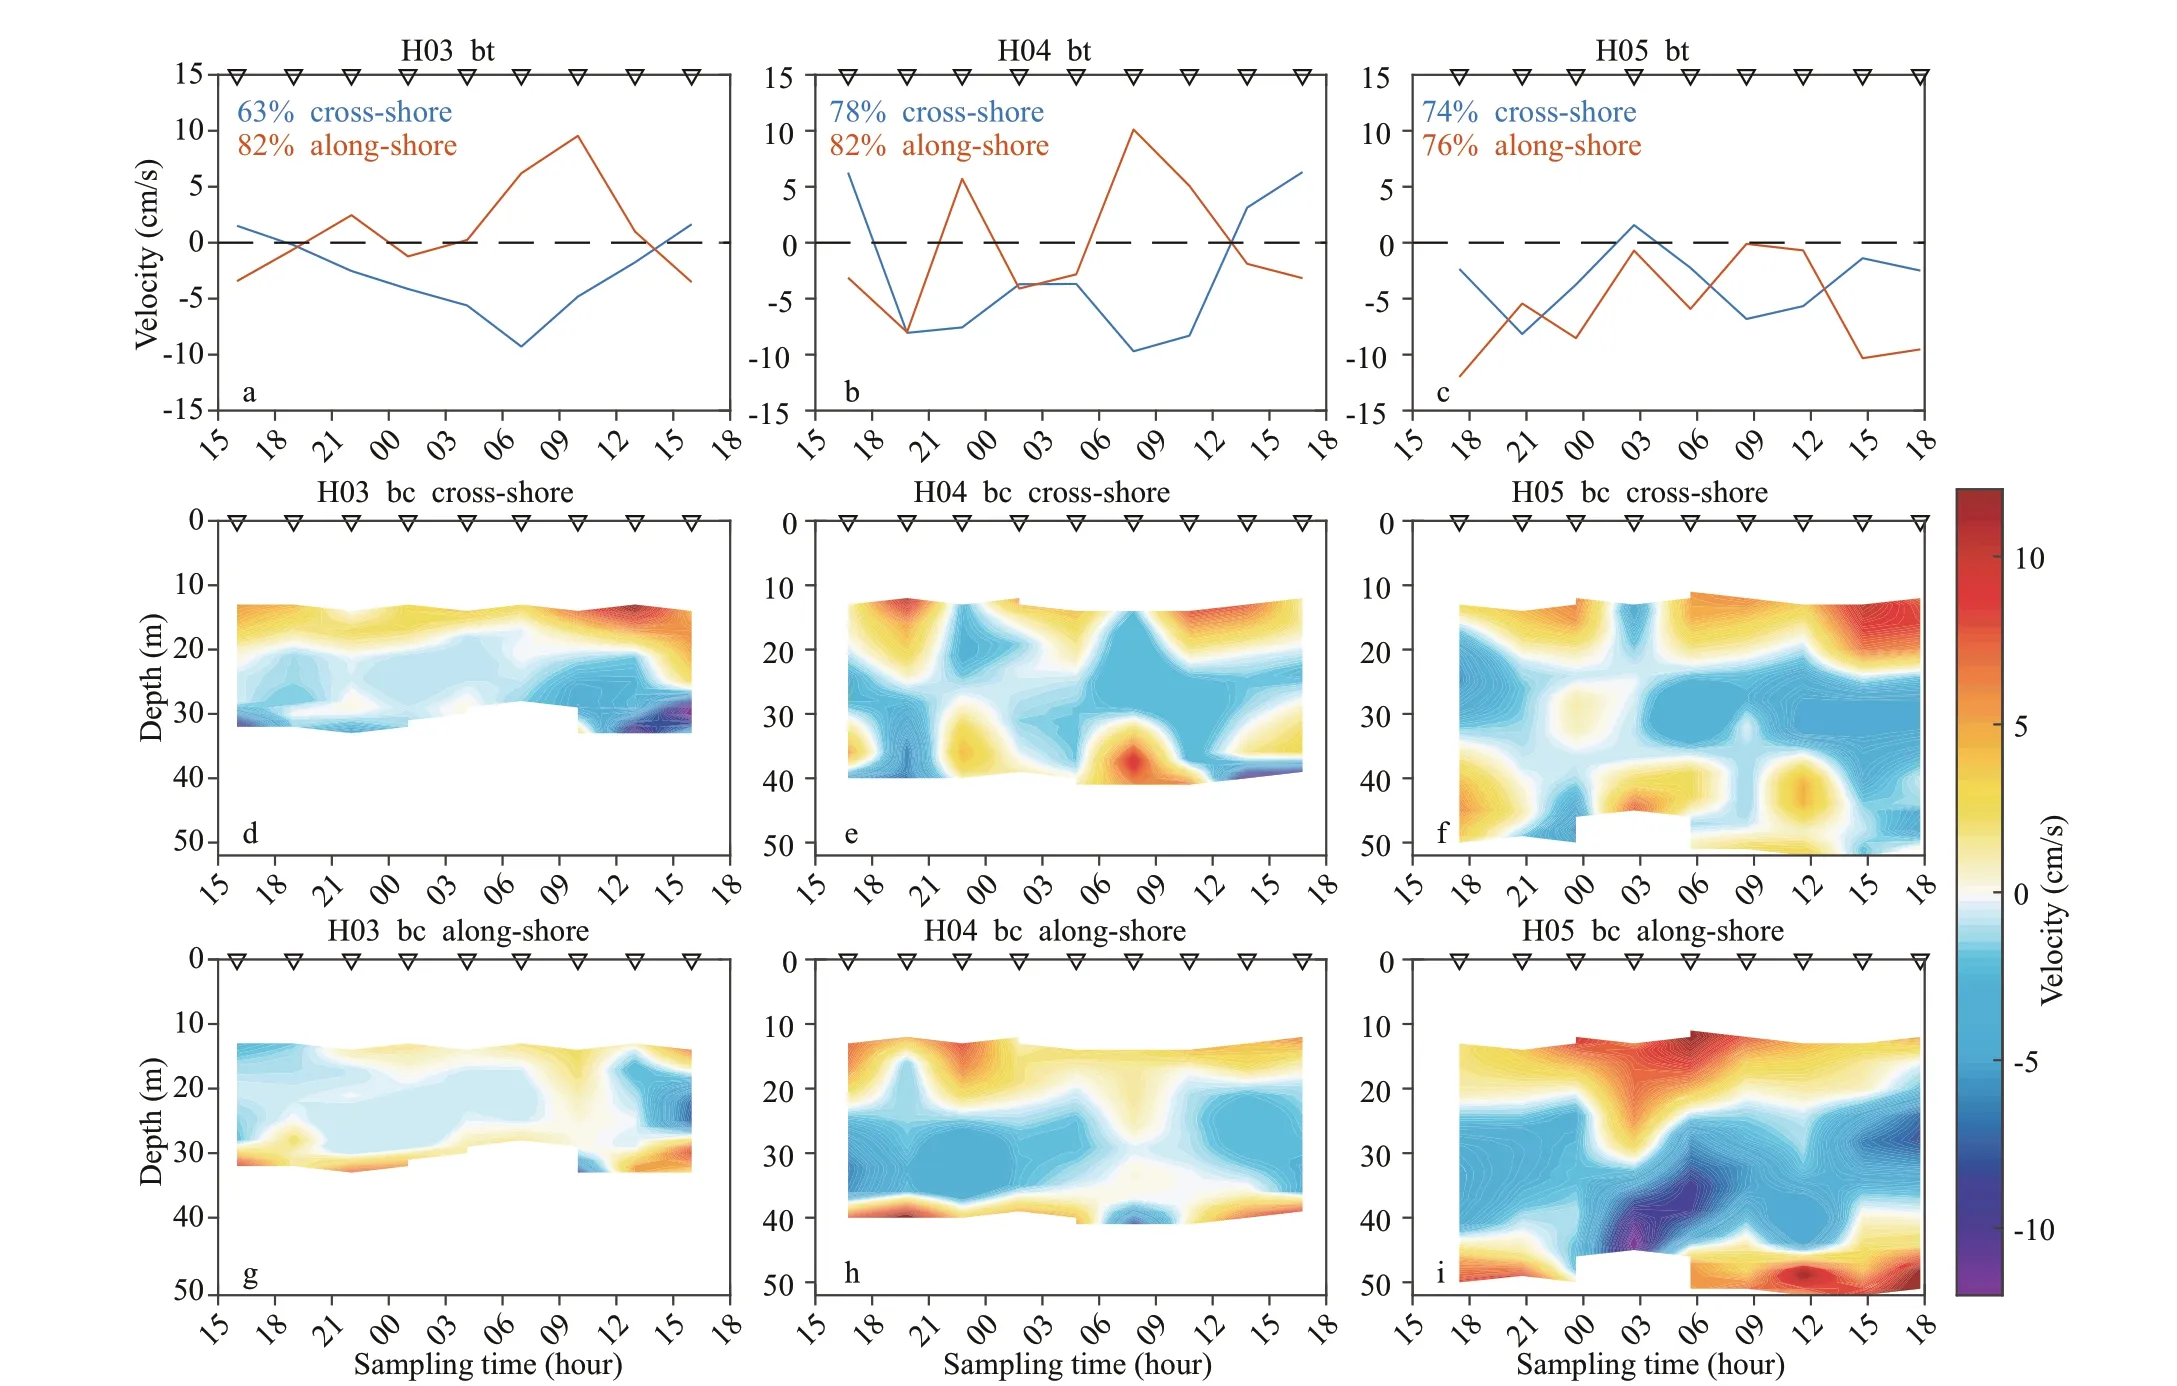
Fig.4 Barotropic velocities (a-c) and baroclinic velocities in cross-shore (d-f) and along-shore (g-i) directions at H03-05
The residual currents are obtained from the decomposition in Section 2.3. The total residual mainly f lows northeastward in the upper layer above 17 m and northwestward underneath at H03-04 (Fig.5). At H05,the current is weak above 20 m and strong westward underneath with a speed of greater than 10 cm/s. The barotropic residual f lows northwestward at H03-04 at a speed of 4 cm/s and southwestward at H05 with a slightly stronger speed of 6 cm/s. The baroclinic currents at all three stations are more likely shoreward below 20 m, with speeds changing from 5 cm/s(off shore) to 2 cm/s (inshore) and f low off shore above.The westward/northwestward f low probably results from southerly and southeasterly wind forcing during a wind shift event (see Section 3.1.3).
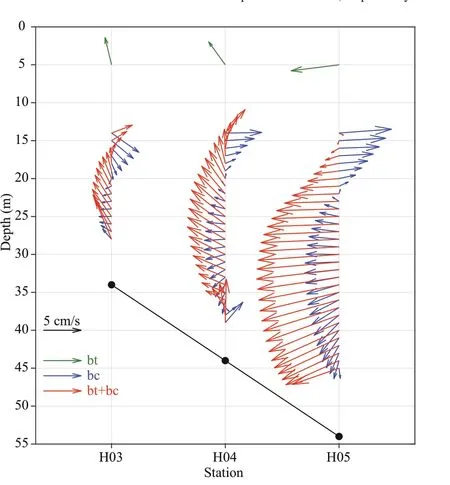
Fig.5 Residual current obtained from the least-squares method at H03-05
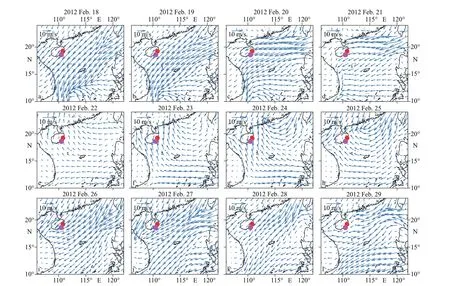
Fig.6 Wind f ield from Feb. 18 to 29 using the scale at the upper left of each f igure part
The diff erence of velocity prof iles at H03-05 is regarded as the combined eff ect from the shoaling bottom topography at H03-05. The observed bottom depth is added at the three stations in Fig.5. One can see that a remarkable bottom slope exists at the section. The westward barotropic current at H05 tends to veer to the northwest when it f lows from H05 to H03 with shoaling depths, following the potential vorticity conservation. The baroclinic currents at three stations reveal similar vertical structure, with a reversal at about 20 m, suggesting the mass balance between the shoreward current and the off shore current near the coastal boundary. In addition, cruise observations on the entire H-section with twelve stations (H01-12) from the inshore to the off shore shows remarkable temperature and salinity fronts at H03-05 (unpublished data), which might aff ect the baroclinic current as well. The dynamics, however,needs more investigation with support of observations on adjacent sections, which might be out of the scope of this study.
3.1.3 Wind f ield
Generally, the current variability on the shallow continental shelf is aff ected by local wind forcing.The northeasterly wind is climatically dominant in the SCS in winter, just as the wind f ield on February 18-19 (Fig.6). Notably, a wind shift event occurred on February 20, in which the wind veered f irst into the easterly wind and then into southerly and southeasterly winds over the following f ive days, during which observations were taken at the three successive stations (February 23-24). The wind speed decreased from 10 m/s before the event to less than 5 m/s afterward. The residual currents at H03, H04, and the upper layer of H05 are shown to be northwestward or westward (Fig.5), which is regarded to be aff ected by the shift in the wind. The wind data used here are from the European Center for Medium-Range Weather Forecast, six-hourly data with a spatial resolution of 0.125°.
3.2 Barotropic tide
The barotropic tidal current ellipses of K1and M2at the successive stations were obtained using the method described in Section 2.3 and are shown in Fig.1. The ellipse properties are listed in Table 1. The semimajor axis (or velocity maximum) of both barotropic K1and M2tides is approximately 2-5 cm/s,which is consistent with the results of Ye and Robinson(1983). For the K1tide, the major axis is in the NE-SW direction off shore (at H05 and MR) and aligns in the N-S direction onshore (at H03-04). The velocity vectors rotate clockwise at H03 and H04 and rotate anticlockwise at H05 and the MR site. The direction of the major axis of the K1tide is consistent with the result in Yan et al. (2020), while the rotation is opposite. With regard to the M2constituent, the direction of the major axis changes from NW-SE off shore (at H04-05) to NE-SW onshore (at H03) in the north; it is the same direction as the K1tide at the MR site. The vectors rotate clockwise at the three successive stations but anticlockwise at the MR site.The major axis is close to the direction of the isobaths at H03 but becomes more cross-shore at H04 and H05. The maxima of the K1and M2tidal currents are comparable at each station, although the currents are stronger at the northern sites H03-05 (4-8 cm/s) than that at the southern site MR (1-2 cm/s), where there is a prominently strong O1tidal constituent (approximately 5 cm/s) with a rectilinear ellipse parallel to the isobaths.
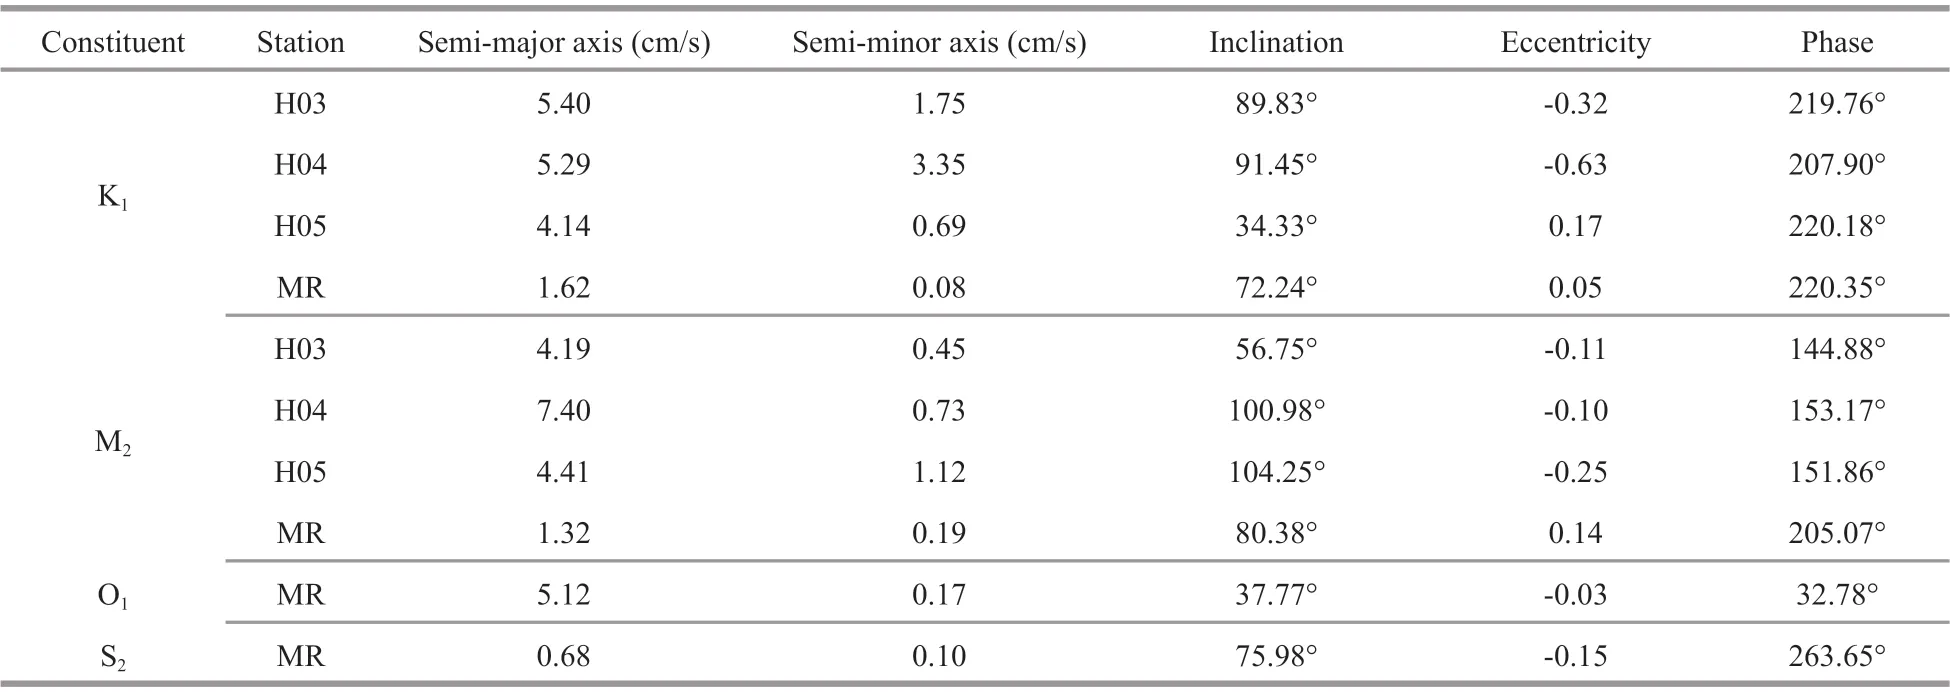
Table 1 Ellipse properties of major diurnal and semidiurnal barotropic tidal constituents
The tide type is characterized by the tidal type number (TN), which is def ined as the sum of the amplitudes of the major diurnal tides divided by the sum of the amplitudes of the major semidiurnal tides.The tide type is regarded as regular semidiurnal tide when the TN is less than 0.5, irregular semidiurnal tide when the TN is between 0.5 and 2, irregular diurnal tide when the TN is between 2 and 4, and regular diurnal tide when the TN is greater than 4.The tidal type numbers at H03-05 and MR are 1.3,0.7, 0.9, and 3.4, respectively, suggesting that the tidal current east of Hainan Island is mixed tide with irregular semidiurnal tide at H03-05 and irregular diurnal tide at the MR site.
For the results at the MR site, it is regarded to present the main features at the MR site since the twomonth time series is long enough to identify them. For the results at the successive stations, the authors do not have long time series to check the persistence of the feature, which is a pity. Nevertheless, the results of barotropic tidal ellipses are compared with previous numerical and observational studies. It is revealed that the maximum velocity of M2tide at the successive stations is consistent with previous numerical result(~5 cm/s) near this area in Fang et al. (1999).Furthermore, the tide type of mixed tide with irregular semidiurnal tide at H03-05 is consistent with the results in Editorial Board of Marine Atlas (2006).
3.3 Internal tide
3.3.1 Primary property
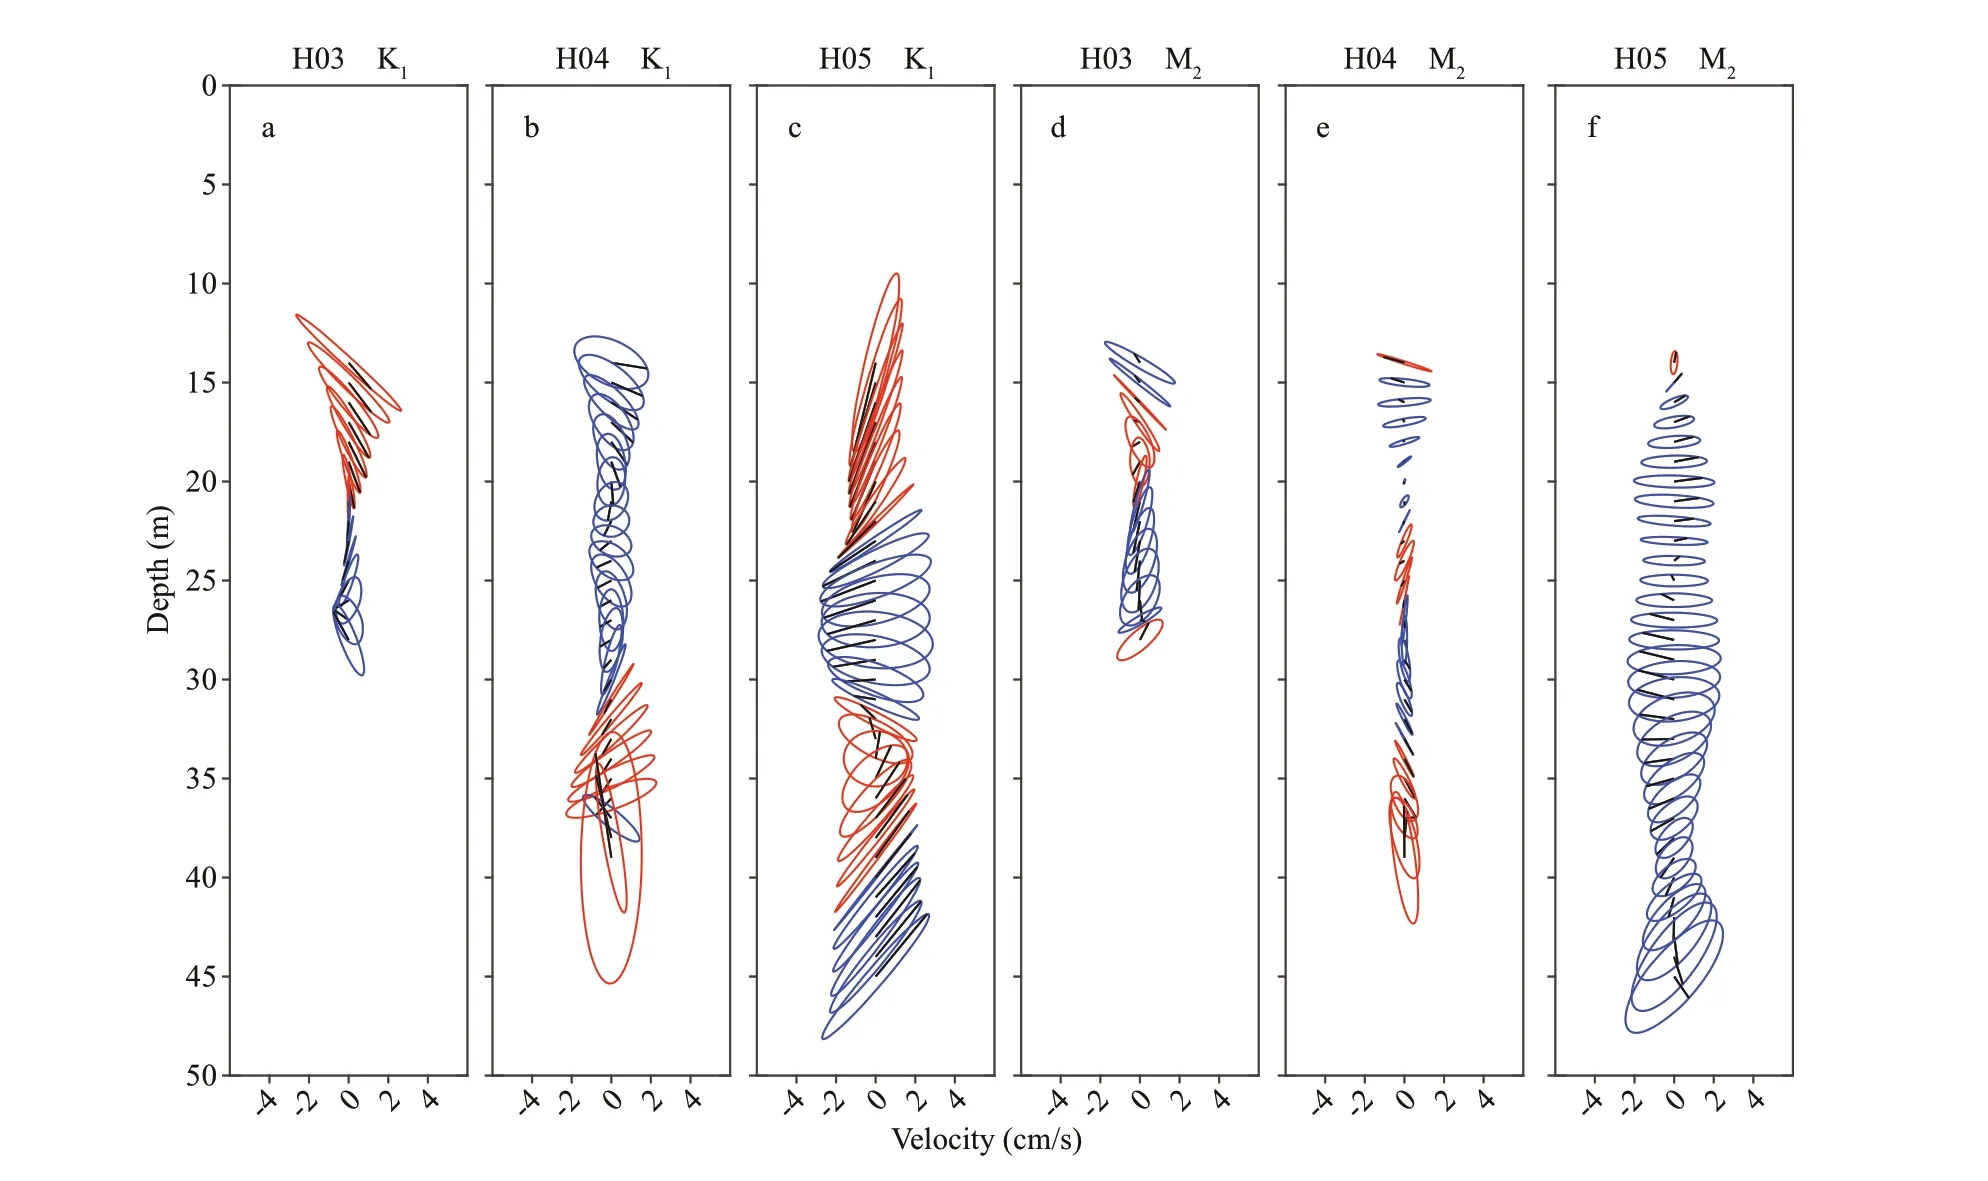
Fig.7 Baroclinic tidal ellipses of K 1 (a-c) and M 2 (d-f) constituents at H03-05
The tidal ellipses of the diurnal (K1) and semidiurnal(M2) constituents derived from the baroclinic currents at H03-05 observed in February 2012 are shown in Fig.7. Similar to the barotropic tides, the amplitudes of the two baroclinic tidal constituents are comparable(2-4 cm/s), which is diff erent from that in the northeastern continental shelf of the SCS, where the baroclinic K1tide is stronger than the M2tide (Gao et al., 2017). The K1tide shows a f irst-mode structure at the three stations, as does the M2tide at H03, as there is only one current reversal in the vertical. The transition depth is approximately 20 m at H03 and H04, and about 33 m at H05. However, the M2tide at H04 and H05 reveals a higher-mode structure with the transition depths of 26 m and 38 m at H04, and 24 m and 42 m at H05. Higher-mode structure of baroclinic tide in the northwestern South China Sea was previously reported in Xu et al. (2011). They showed that the baroclinic K1tide is dominated by f irst-mode structure while the M2tide presents a higher modal structure with prominent second-mode motions, using two-month (July-September) moored observations(the water depth is ~114 m) on the shelf of northwestern South China Sea east of Wenchang, which is consistent with the modal structure at H05. The transition depths at H05 are shallower than those in Xu et al. (2011) in which the transition depth of the f irst-mode K1tide is 45 m and those of the high-mode M2tide are around 35 m and 70 m. The diff erence of the transition depths is however understandable with regard for the diff erent bottom depth at the two sites and the possible eff ect from nonlinear bottom drag (Xu et al., 2011), which can also be speculated from the deepening of the transition depth of K1tide from 20 m at H03-04 to 33 m at H05. Except for that, the diff erent stratif ication and background current at two sites in diff erent seasons, which are generally regarded to inf luence the propagation of baroclinic tide, are also possible factors that aff ect the structure of the baroclinic tide (Xu et al.,2013). At H04, the amplitudes of the K1and M2tides vary similarly from shallow to deep, although the K1tide is stronger than the M2tide. At H05, K1is mainly in the N-S direction above 22 m and below 35 m and in the E-W direction in the middle layer. The M2tide is slightly weak relative to the K1tide, with a nearly E-W direction at 16-35 m. The rotations of the velocity vectors for the two constituents show an interchange between the clockwise and anticlockwise rotations with depth, except for the constancy of the anticlockwise rotation for the M2tide at H05.
At the MR site, all the four tidal constituents exhibited high-mode structures for the duration of early-January to early-March, 2015 (Fig.8). The O1tide is the dominant constituent with a maximum velocity of approximately 1.5 cm/s, although it is rather weak compared to the barotropic O1tide (refer to Table 1). The K1and M2tides (mostly less than 1 cm/s) are both weaker than the O1tide, but they have strong amplitudes (~1 cm/s) at the surface layer.The velocity vectors of the O1tide rotate mostly clockwise, while other tidal constituents exhibit rotation in varying directions.
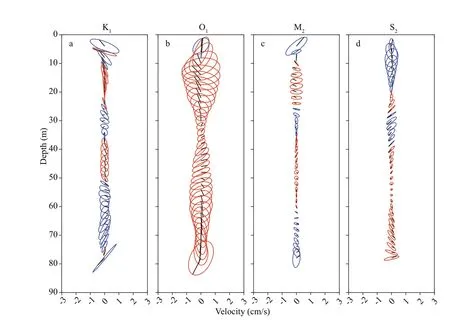
Fig.8 Baroclinic tidal ellipses of four major constituents at the MR site
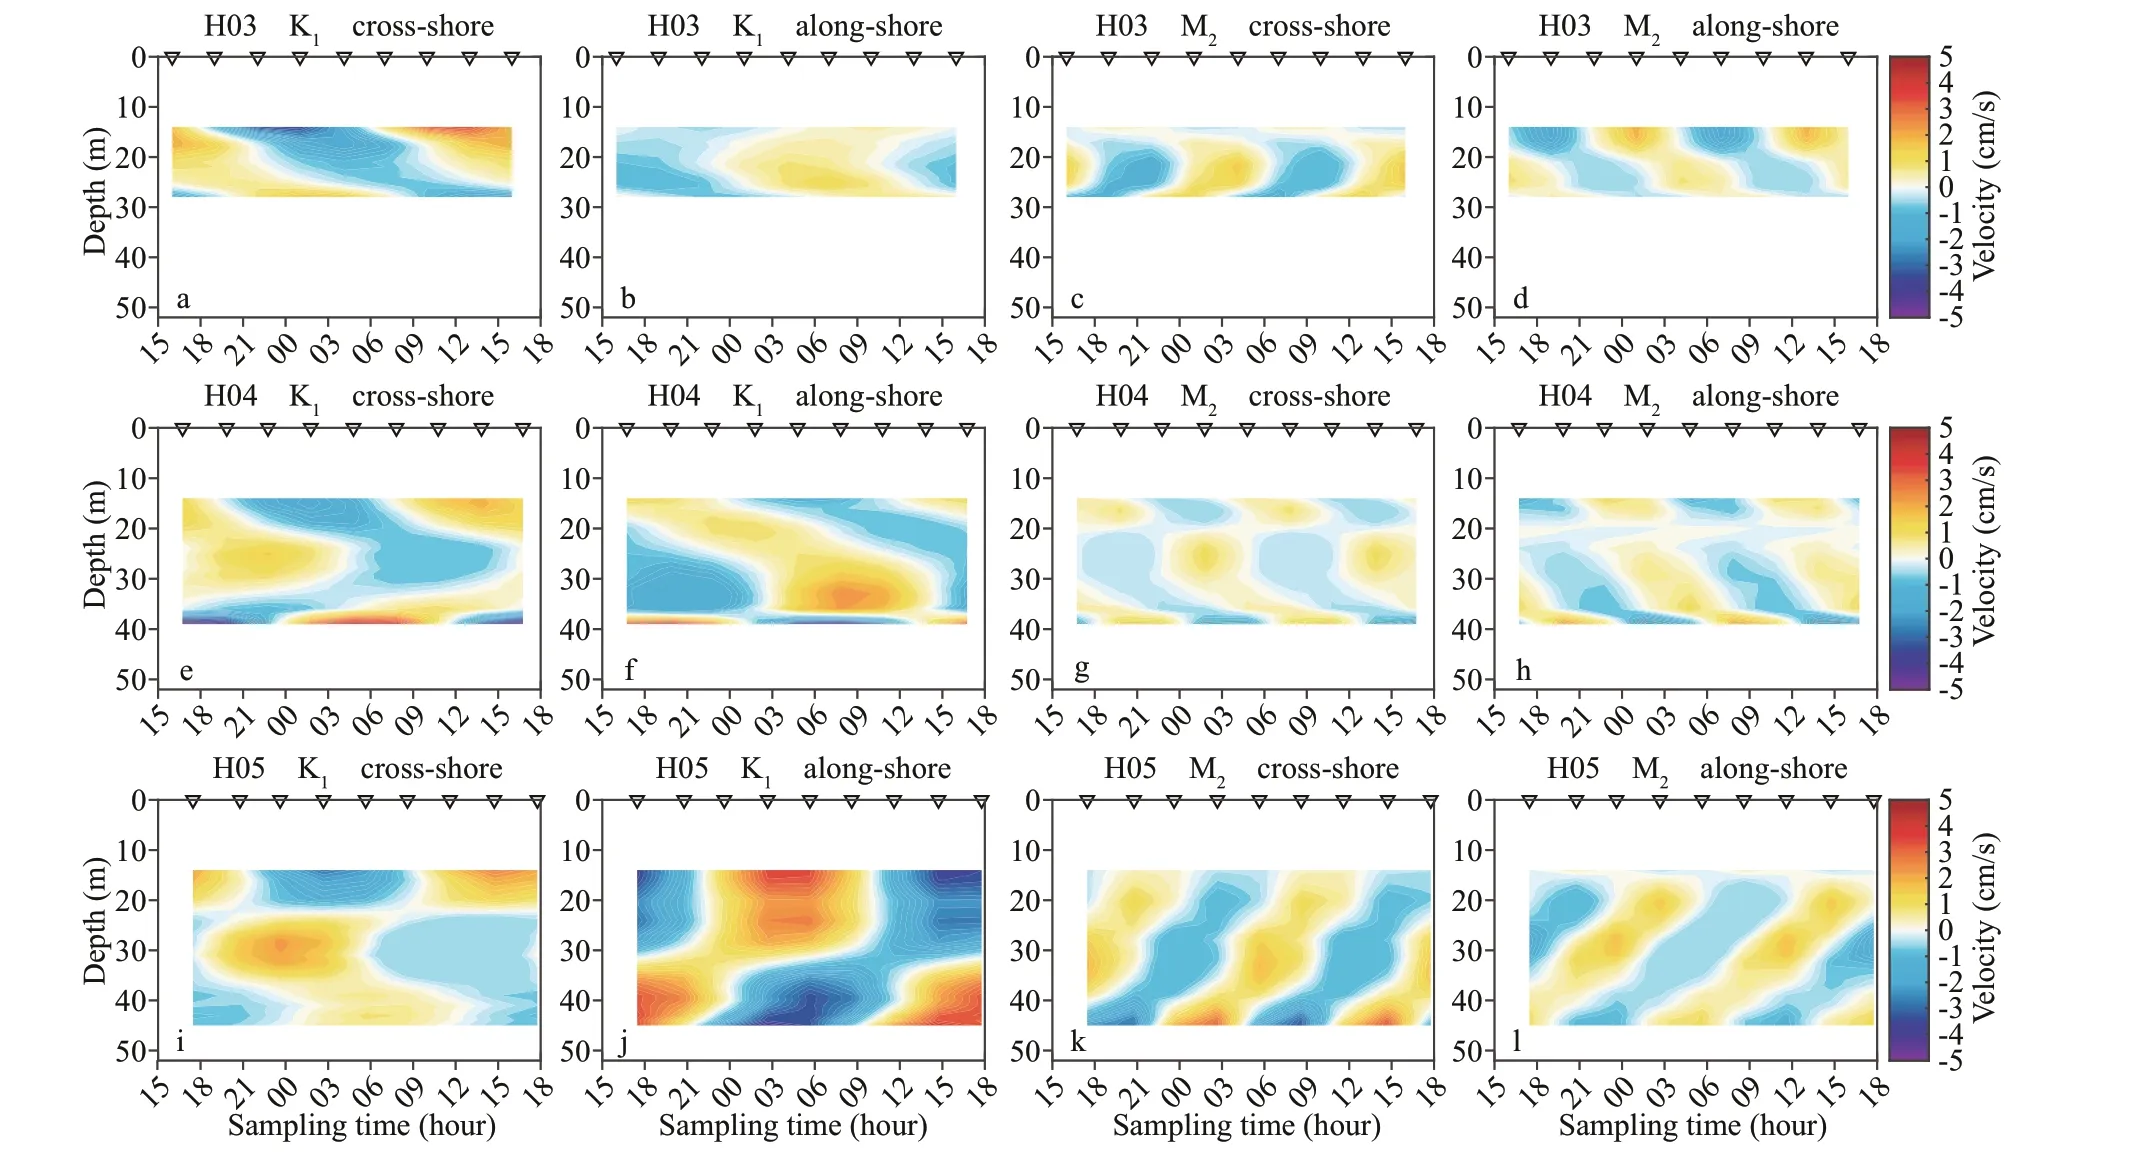
Fig.9 Cross-shore and along-shore velocities for the baroclinic K 1 and M 2 tides at H03-05
The baroclinic K1and M2tidal energies during the observation in February 2012 exhibit a vertically propagating feature in both the cross-shore and alongshore directions (Fig.9) where there is evidence of diff erent vertically propagating directions at various depth layers. This feature is consistent with the vertical variation of the phase in Fig.10, which denotes the delay of the tide with depth. The increasing(decreasing) phase with depth refers to the downward(upward) propagation of the phase, implying an upward (downward) energy propagation of the internal tide. The K1tide at H03 reveals a downwardpropagating phase and upward-propagating energy(Fig.10), which is consistent with the distribution of the cross-shore velocity of the K1tide (Fig.9). This implies that the cross-shore component is dominant in the K1baroclinic tidal energy, which can be seen at H04 as well, except for the transition below 37 m. The phase of the M2tide at H03 increased in the upper layer and decreased in the lower layer (Fig.10), which is identical to the propagation feature of the crossshore velocity (Fig.9). At H04, the phase propagation of the M2tide varies with depth and is likely related to both the cross-shore and along-shore velocities owing to similar variations in the two directions. The vertical structures of the velocities are also similar at H05, and the phase shows a consistent feature of upward propagation.
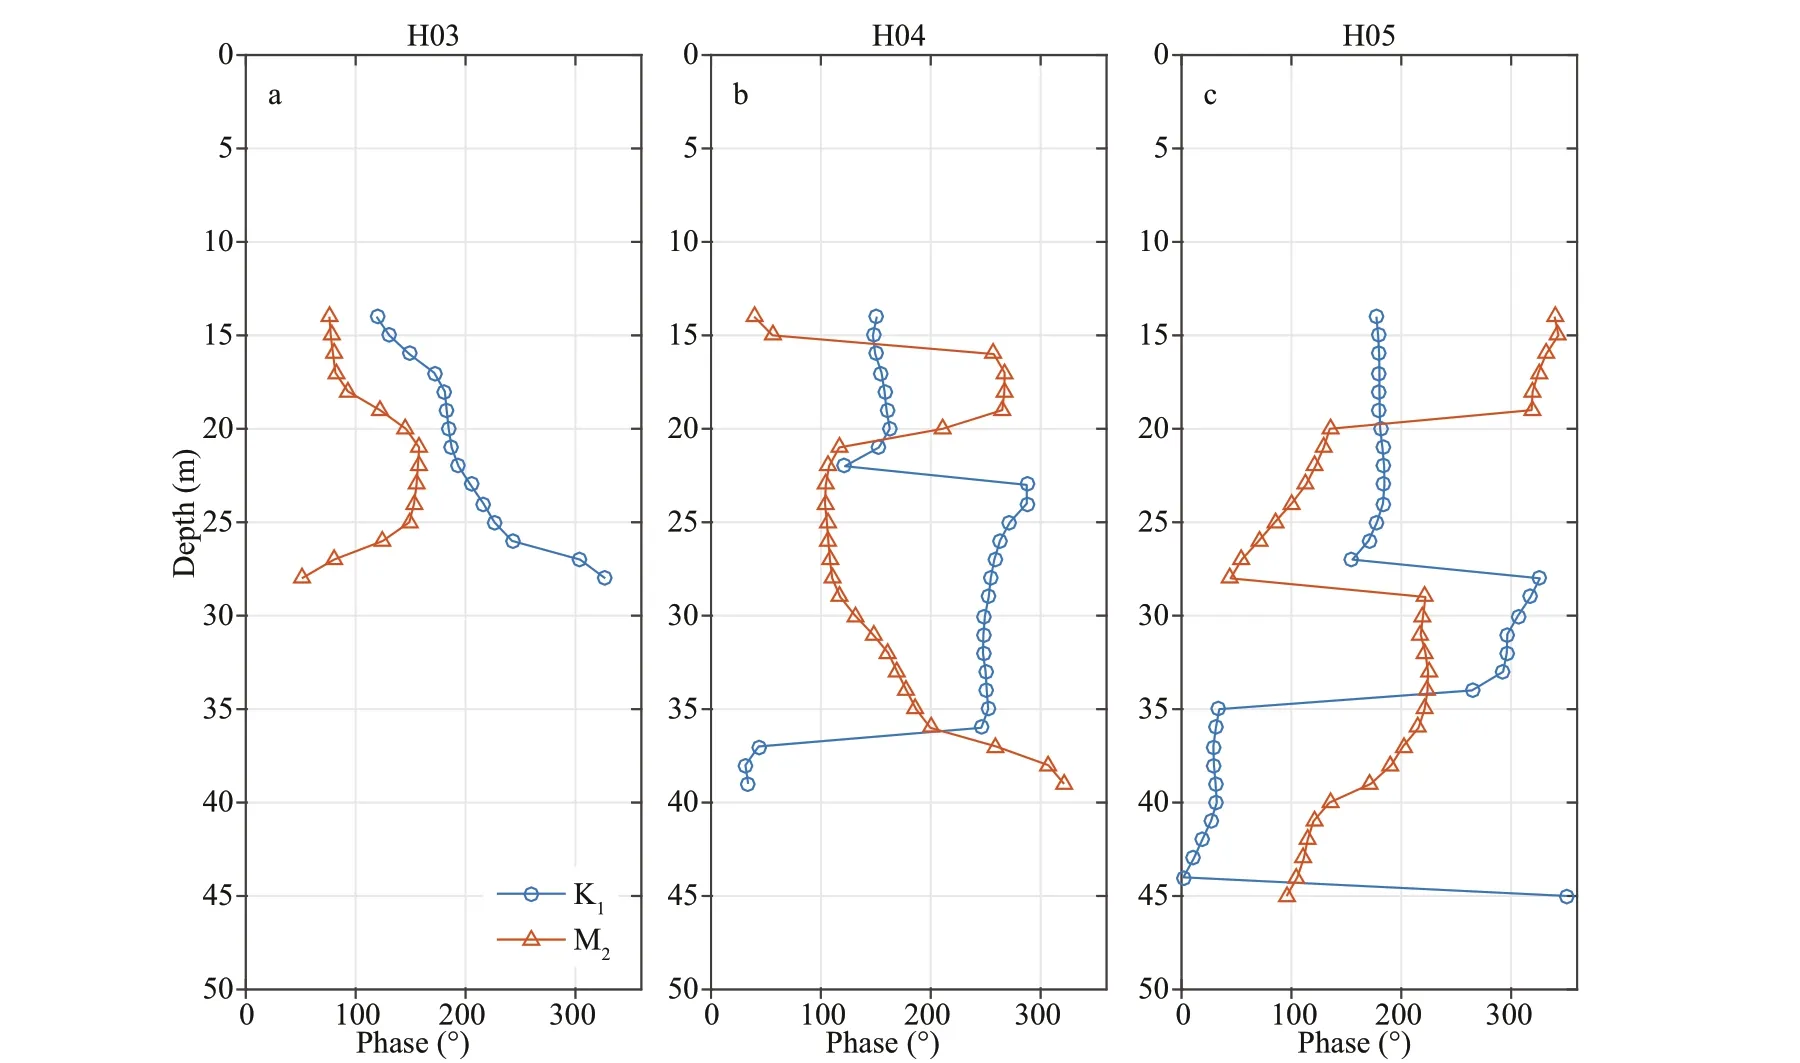
Fig.10 Variation of phase with depth at H03-05
3.3.2 Eff ect of tidal current on isopycnal f luctuation
The depth of the isopycnals (Fig.11a-c) revealed periodic features similar to those of the isotherm f luctuations (Fig.2a-c) during the observation in February 2012 with vertically opposite variations especially at H05, which probably results from the tidal motions. To further investigate the eff ects of diurnal and semidiurnal tides, the time series of isopycnal f luctuations was decomposed. Similar to the decomposition of the current in Section 2.3, the isopycnal f luctuations can be decomposed into diurnal(Fig.11d-f), semidiurnal (Fig.11g-i), and residual components using the least-square method. Both the diurnal and semidiurnal isopycnal f luctuations reachO(5 m) at H03,O(8 m) at H04, andO(10 m) at H05.The isopycnal f luctuations exhibit little vertical variation, as the barotropic signals dominate,supposedly resulting from barotropic tidal motions.Furthermore, the tidal eff ects weaken from the relatively deep H05 station to the shallow H03. The signals with a K1period are stronger than those with an M2period at H03 and H05. However, the eff ect on the f luctuation from the M2tide was dominant at H04.
3.3.3 Energy f lux of internal tide
3.3.3.1 Method to calculate energy f lux
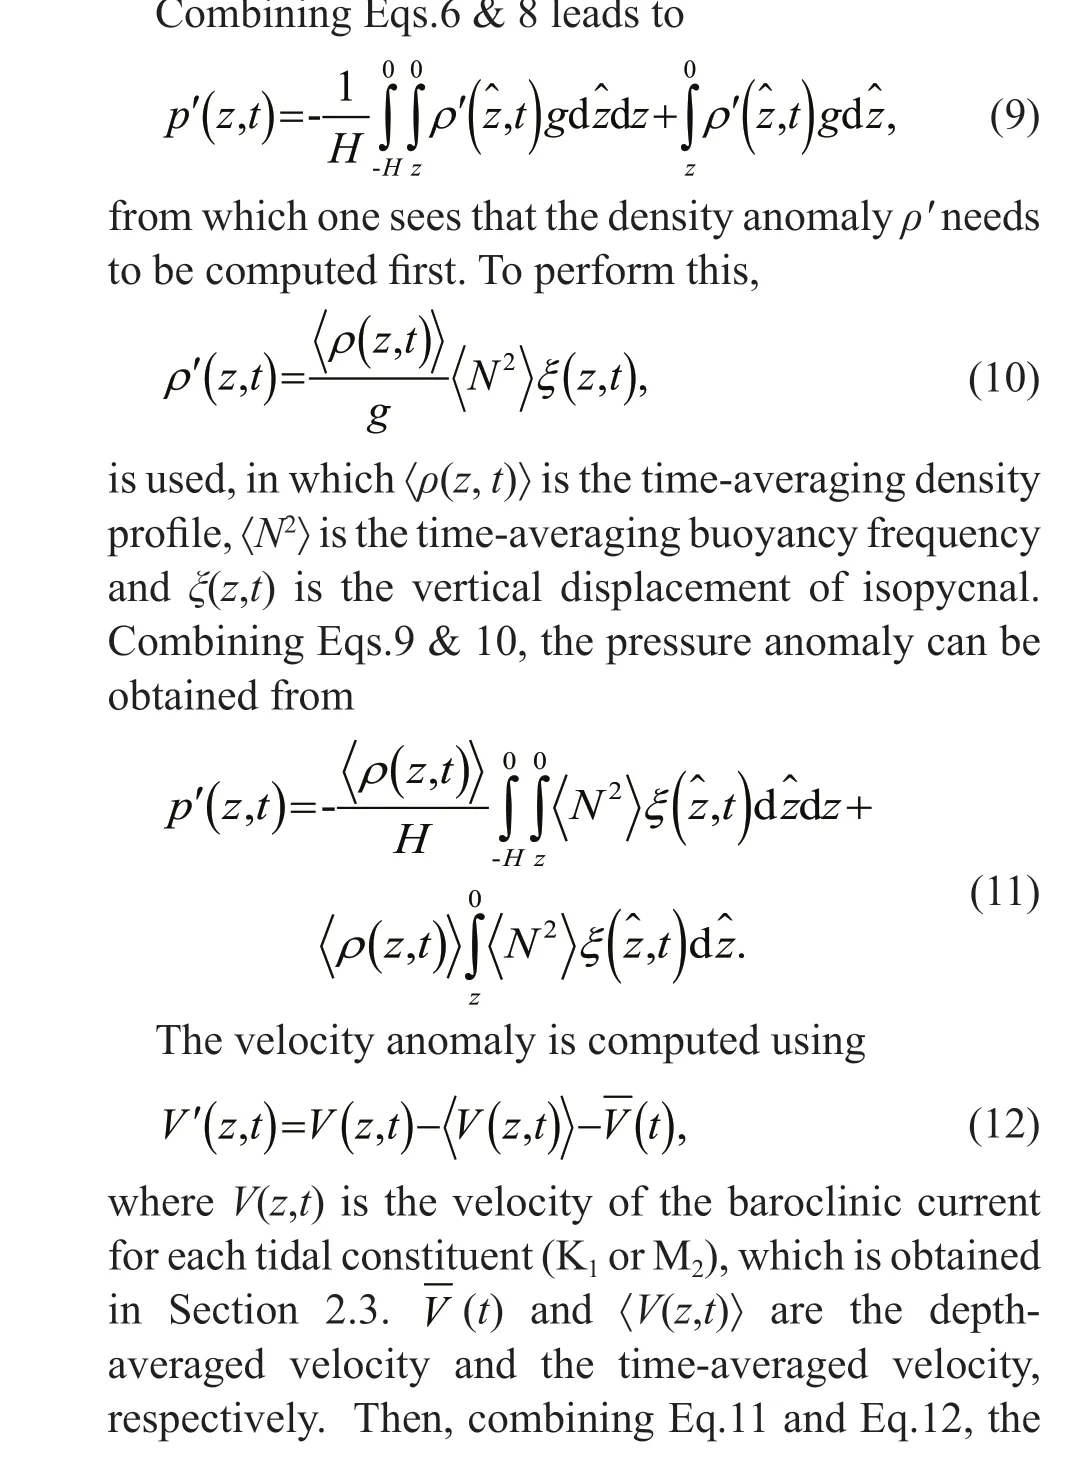
According to Nash et al. (2004), the horizontal energy f lux of the internal tide (or the aforementioned baroclinic tide),FE, can be obtained from the product of the wave-induced pressure anomalyp'and baroclinic velocity anomalyV'=(u',v'), which is
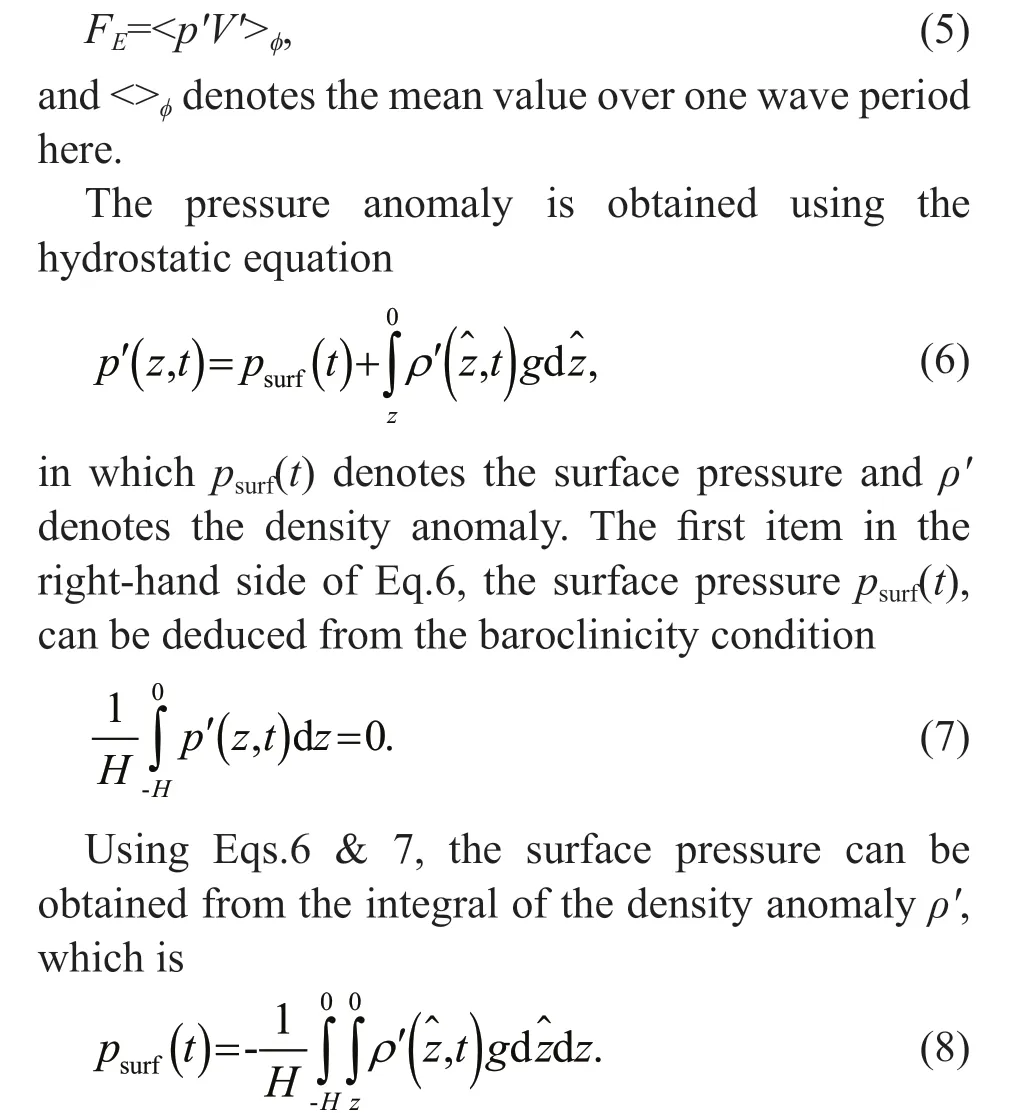
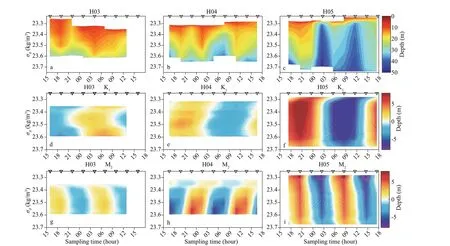
Fig.11 Depth of isopycnals (a-c) and decomposition of isopycnal displacement in the K 1 (d-f) and M 2 (g-i) periods at H03-05

3.3.3.2 Energy f lux of internal tide
The energy f luxes of the K1and M2internal tides were obtained at the three stations based on successive observations in February 2012 (Figs.12-14). The period of the f lux is half that of the tidal constituents,which is consistent with the implication derived from the def inition of the energy f lux. The time series of both the along-shore and cross-shore components reveals the vertically propagating features of the baroclinic tidal phase and energy. The K1tide has a two-layer structure in both the cross-shore and alongshore directions at H03, whereas the M2tide has a three-layer structure. The transition depth of the twolayer K1tide and middle layer with the weak energy f lux of the M2tide are both approximately 20 m,which is consistent with the shift in depth of the f irstmode baroclinic tidal current (Fig.7). The energy f lux of the M2tide varies regularly, while that of the K1tide reveals a downward phase-propagation signal,which requires further investigation. Both the K1and M2tides have intense off shore energy propagation in the upper layer of H03. However, the depth-integrated energy f lux over one period is -0.013 W/m onshore for the K1tide and 0.076 W/m off shore for the M2tide. In the along-shore direction, the net energy f luxes for both tidal components are northeastward.
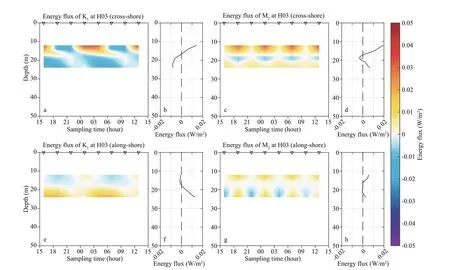
Fig.12 Energy f lux variation of baroclinic K 1 (a, e) and M 2 (c, g) tidal constituents at H03, and the corresponding mean energy f lux prof ile over one period (b, d, f, h)
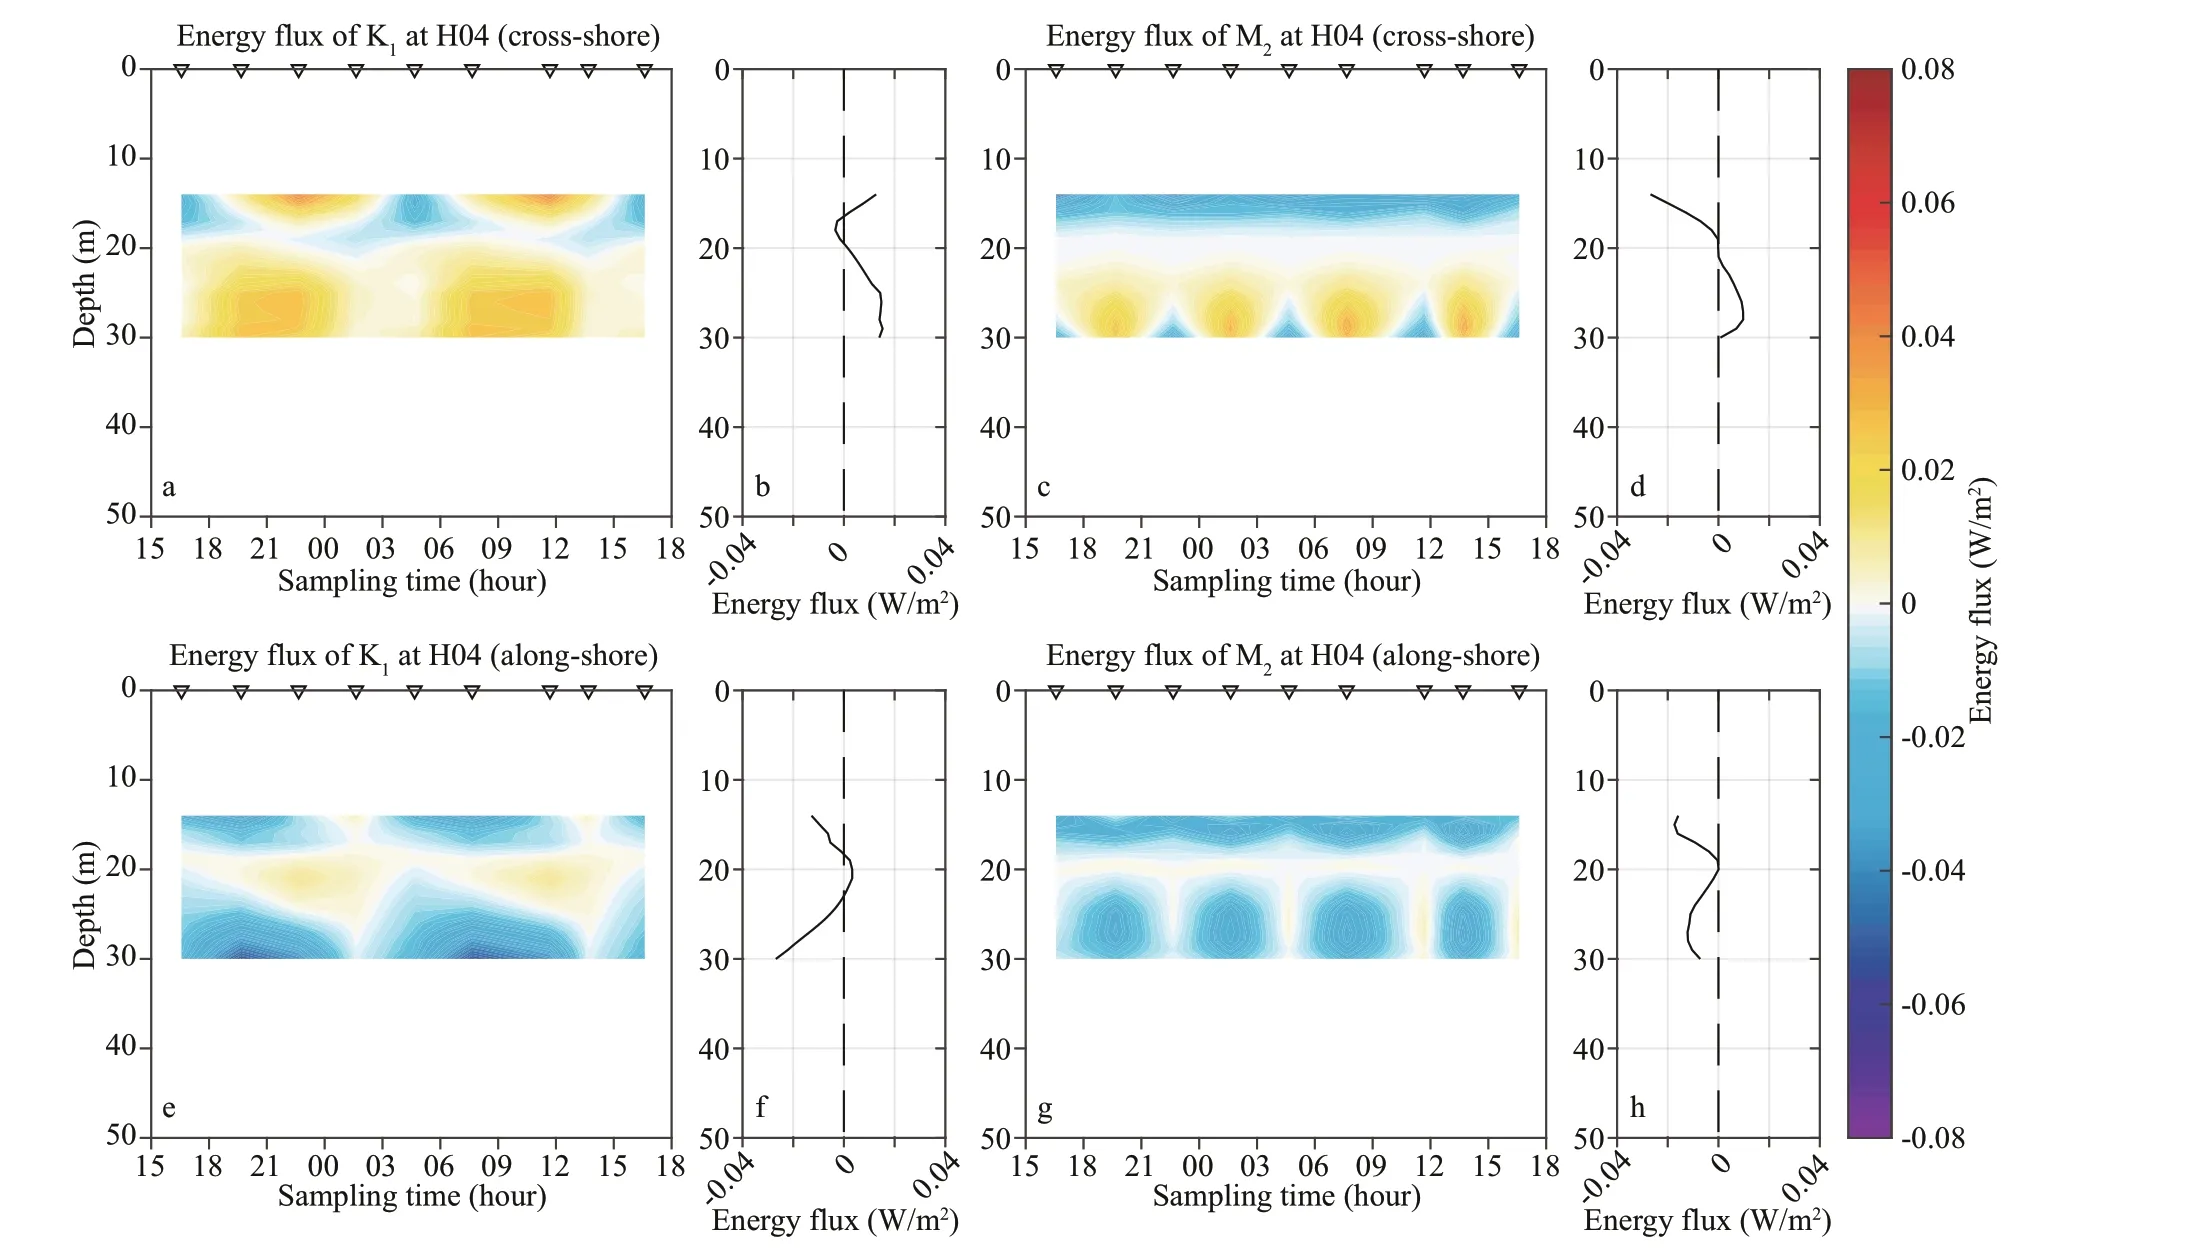
Fig.13 Same as Fig.12 but for H04
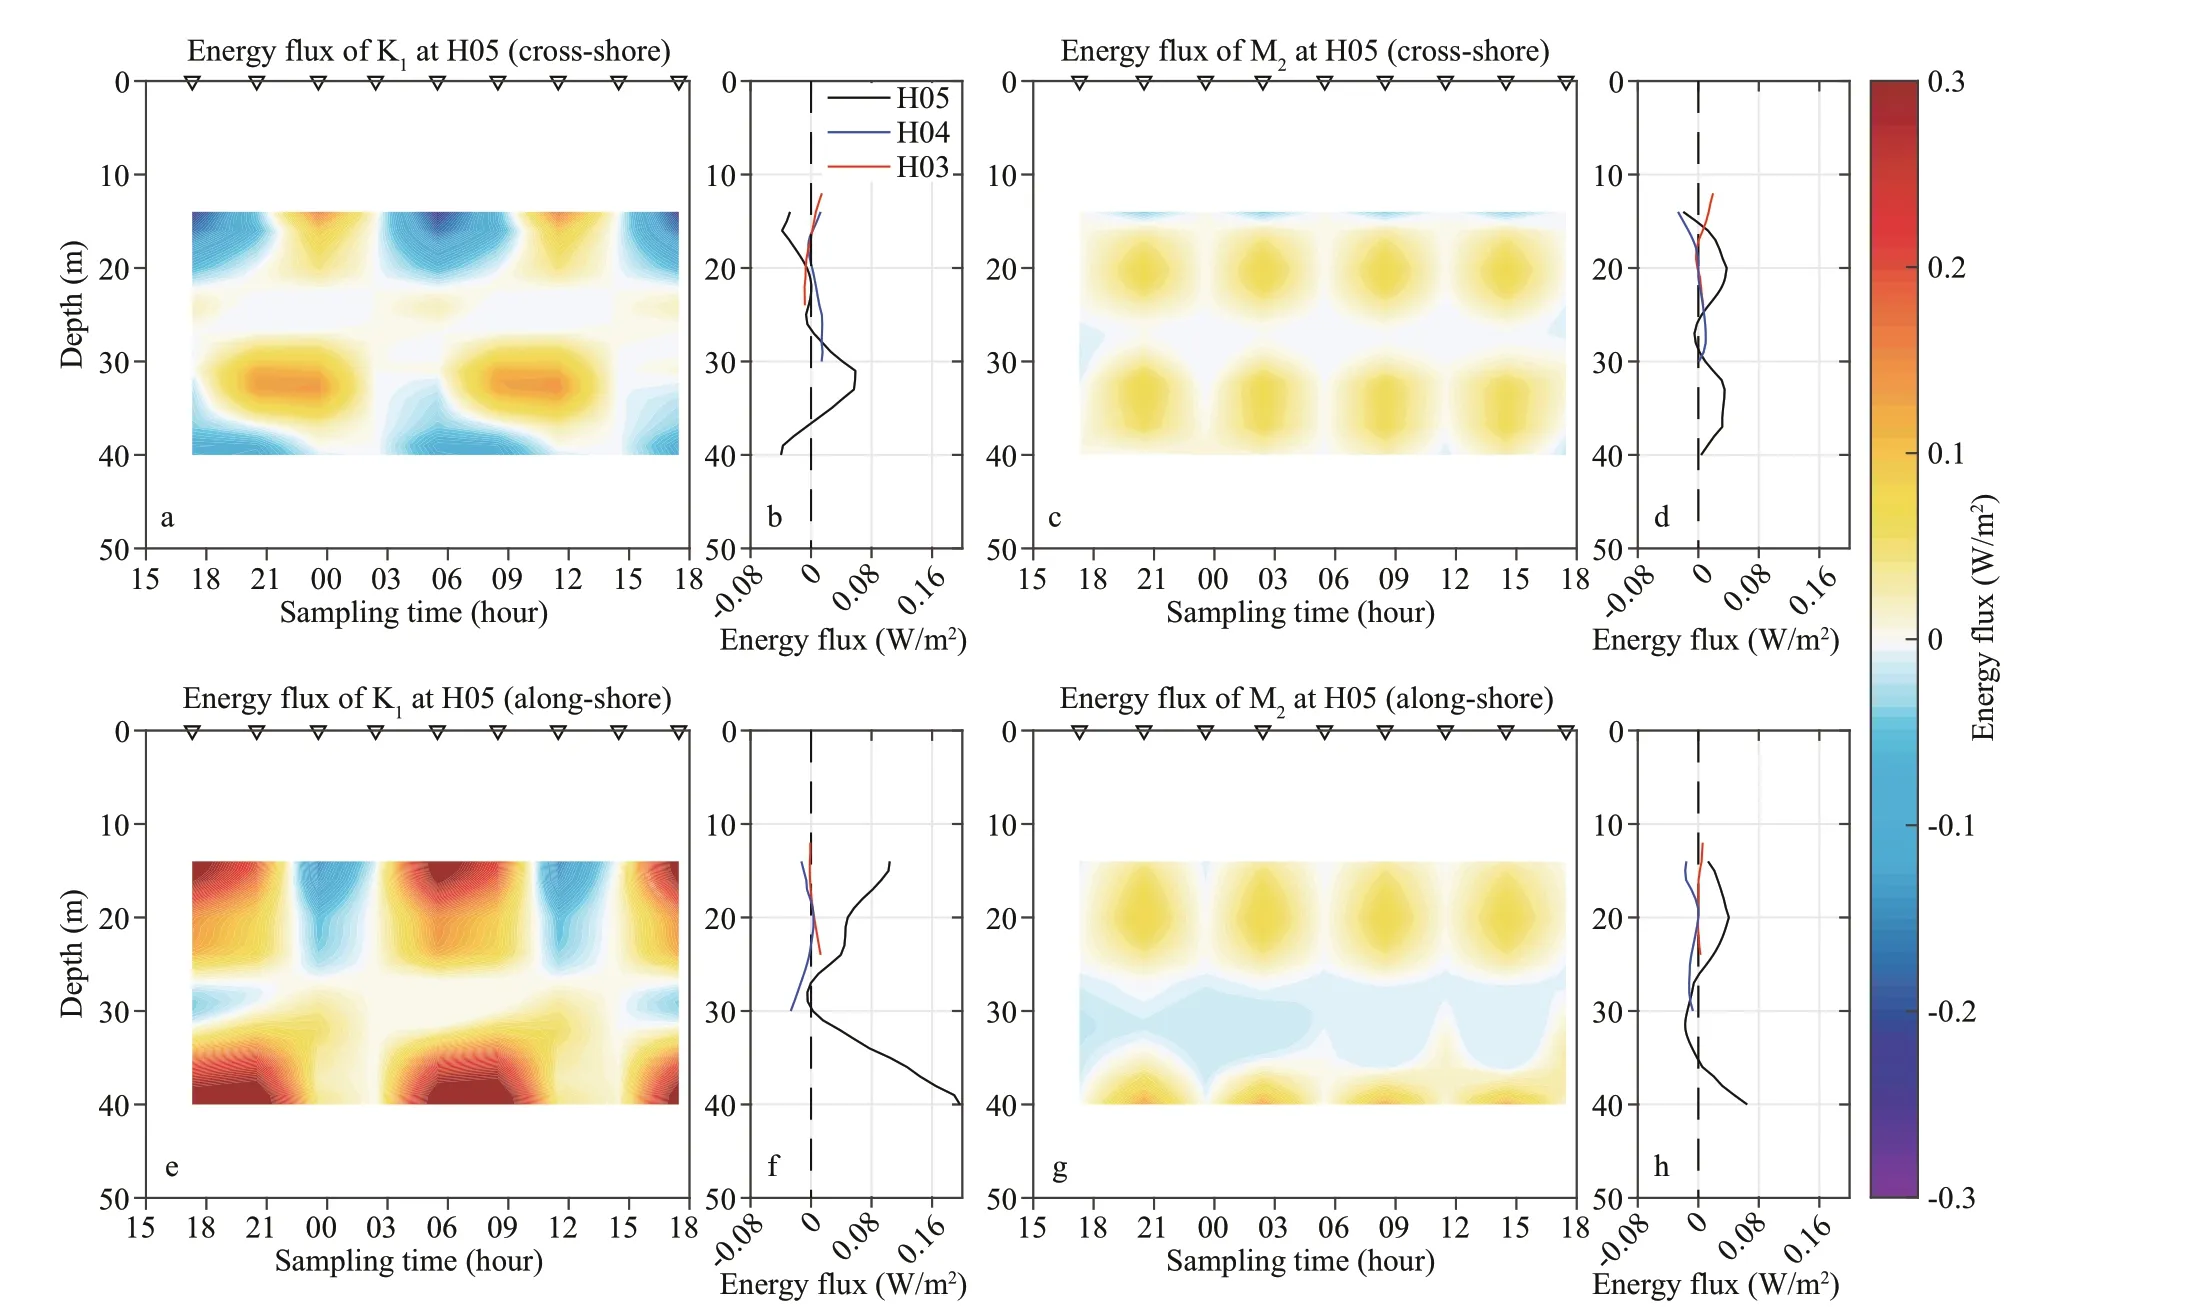
Fig.14 Same as Fig.12 but for H05
The energy f lux at H04 is more intense than that at H03 (note the diff erent scales at the right, Fig.13),with a three-layer structure and a minimum energy f lux at 20 m for both the K1and M2tides. The depth of the minimum f lux was close to the transition depth of the baroclinic tidal modes (Fig.7). The depthintegrated energy f lux over one period is 0.134 W/m off shore for the K1tide and -0.014 W/m onshore for the M2tide. The net f luxes of the two tidal constituents are both southwestward owing to the strong negative values at most depths in the along-shore direction.
At H05, the energy f luxes of both the K1and M2tides are the strongest of the three stations, with multilayer structures (Fig.14). Note that the maximum of the scales at the right is 0.3 W/m. The energy f lux of the K1tide becomes stronger than that of the M2tide at this station, unlike the comparable feature at the other two stations. The energy f lux of the K1tide has a stronger component in the along-shore direction than that in the cross-shore direction, with a depthintegrated northeastward net f lux. The depthintegrated cross-shore f lux of the K1tide over one period is 0.052 W/m off shore, with a complex vertical structure. The M2tidal energy f lux is still regularly periodic, similar to that at the other stations, and the mean f lux is nearly positive at all depths, suggesting a net off shore propagation. The mean f lux is mainly positive in the along-shore direction, except for the weakly negative f lux at 27-35 m, implying a net northeastward f lux. The depth-integrated f lux of the M2tide over one period is 0.471 W/m off shore.Comparing with the energy f lux at H04 and H03 (blue and red curves in Fig.14b, d, f, h), one sees that the energy f lux of both K1and M2tide decreased signif icantly from H05 to H04 above 30 m (the variation below 30 m is unclear because of lacking data at H04), especially for that of the K1tide in the alongshore direction. The energy f luxes at H04 and H03 are close with a slight decrease from H04 to H03.Yan (2015) showed the TPXO simulated barotropic tidal energy f lux of four primary constituents in the northern SCS and revealed that a signif icant portion of the tidal energy propagated westward along the continental slope from the Luzon Strait, a fraction of which veered northwestward towards the east of Hainan Island, where there is an non-negligible barotropic to baroclinic conversion rate. Regarding the variation in energy f lux at the three stations, the prominent decrease in energy f lux from H05 to H03 suggests the possible propagation of energy from the off shore to the inshore and possible dissipation due to bottom friction (Gao, 2013; Yan, 2015).
4 DISCUSSION
4.1 Tidal decomposition method
Regarding the eff ectiveness of the method to estimate the tidal current for the 25-h time series in this study, the least-square method used here is a traditional tidal current analysis method and has been widely and successfully used to derive tidal currents from length-limited observations (Emery and Thomson, 1998; Tian et al., 2006; Byun and Hart,2018). It revealed a performance similar to that of the results using the T-Tide toolbox. We further calculated the kinetic energy of the estimated barotropic current composed of the K1tide and M2tide, with the results revealing that they occupy 98% of the kinetic energy of the raw barotropic current, suggesting that the method is eff ective in grasping the primary signal.
Furthermore, the correlation of determinationR2,and the root mean square (RMS) of the error between the estimated velocity and the observed time series,are checked to evaluate the tidal estimation (Fig.15).The correlation of determinationR2, which is def ined as the ratio of variance explained to total variance,can measure the goodness of f it of the least-square regression curve (Emery and Thomson, 1998).R2is large if the regression is good and vice versa.
It can be seen that for the barotropic current (dots in Fig.15),R2mostly exceeds 0.8 and the RMS errors are below 3 cm/s, except forR2around 0.6 and RMS error around 5 cm/s for the zonal velocity at H04(solid red dots). The results indicate the goodness of f it and low errors. It is therefore regarded that the tidal analysis for the barotropic current is reliable.
For the baroclinic current (lines in Fig.15),R2are generally larger than 0.4 with higher values over 0.7 at depths of vertical mode cores, while low values about 0.2 at depths of mode reversal (Figs.4 & 9). The RMS errors are also mainly lower than 3 cm/s, which is smaller than the amplitudes of the tidal current and the raw current. Some high values over 4 cm/s at the top and bottom layers are probably aff ected by the shallow water constituents, which are not resolved from coarse sampling but smaller compared to the diurnal and semidiurnal components. ThoughR2and the RMS error of the baroclinic current is respectively a little lower and larger than that of the barotropic current, the results of the barotropic current are still reliable especially in the core layers of the vertical modes. Moreover, the barotropical currents occupy more than 63% of the total current and are stronger than the baroclininic currents. The tidal analysis here catches the primary features of the observations.
4.2 Tidal components and spring-neap condition
For the tidal component, the K1and M2tides were used as proxies for diurnal and semidiurnal tides at the successive stations because of the limited sampling frequency. The choice is reasonable because the two components are dominant, as shown in previous studies (Fang, 1986). We checked diff erent pairs of tides (one diurnal tide and one semidiurnal tide) from four primary components (K1, O1, M2, and S2); similar results were derived qualitatively and quantitatively,suggesting that the eff ect of the selection of tide components is negligible. Analysis on a 64-h moored time series at H03 (unpublished data) revealed the dominance of the K1tide and M2tide.
Using the time series of the tide level at Port of Bo’ao from the National Marine Data Information Service (2011), the spring tide occurred on February 7 and February 19 and the neap tide occurred on February 13 and February 25. Suppose that the tide at the successive stations is similar to that at the port, the observation duration (February 23-24) is during the shifting time from spring tide to neap tide. The time series of predicted tidal current near the stations using TPXO model (Egbert and Erofeeva, 2002) is also checked. The spring tide occurred on February 7 and February 20 and the neap tide occurred on February 14 and February 29. Therefore, the results in this research reveal the features of the tidal current near neap tide. Further investigation about the spring-neap cycle is needed based on long-term observations.
4.3 Propagation of the internal tide
There are previous studies showing the long-range westward propagation of the internal K1and M2tide generated at the Luzon Strait based on satellite observations (Zhao, 2014) and numerical modeling(Xu et al., 2016; Yan et al., 2020), which can propagate across the deep basin and arrive at the western continental slope (though it decreases when propagating to the west and is rather small relative to that in the far east), suggesting that the energy f lux of internal tide near the successive stations probably indicates the feature of the internal tide propagated far away from the east. Moreover, Xu et al. (2016)showed remarkable barotropic to baroclinic conversion rate of K1tide along the northern continental slope of South China Sea, and Yan et al.(2020) revealed that the slope region around 200-m depth in the southeast of Hainan Island is generation region of baroclinic M2tide and the barotropic to baroclinic conversion rate along the slope is signif icant in winter, suggesting the possible eff ect from the generated internal tide along the slope on the energy f lux and the westward propagation to the study area.However, this issue needs support of more data and is out of this paper’s scope and will be investigated in the future.
5 CONCLUSION
The tidal current was analyzed using observations from three successive stations northeast of Hainan Island and a moored time series southeast of the island, for which the least-square method and T-Tide toolbox were applied, respectively, to extract the tidal current. The result captured the primary signal of the time series; the K1and M2tides were used as proxies of the diurnal and semidiurnal tides, respectively.
The results reveal that the diurnal tidal current (K1)is comparable to the semidiurnal component (M2) in the north (4-8 cm/s at H03-05); however, the O1tide is dominant (~5 cm/s) and much stronger than the other components (1-2 cm/s) in the south. This leads to an irregular semidiurnal tidal current in the north and an irregular diurnal tidal current in the south. The directions turn from NE-SW at the deeper station(H05) to N-S at the shallower station (H03) for the K1tide and from NW-SE to NE-SW for the M2tides. The velocity vectors of the K1tide rotate clockwise at H03 and H04 and rotate anticlockwise at H05 and the MR site. Meanwhile, the barotropic M2tide reveals a clockwise rotation at H03-05 and anticlockwise at the MR site. The O1tide is dominant at the MR site with an inclination along the isobaths and a nearly rectilinear feature. The residual current has a signif icant westward or northwestward component,which is speculated to be a consequence of veered wind forcing during a wind shift event.
The baroclinic K1tide exhibited a f irst-mode structure at three stations, as dose the M2tide at H03.Higher-mode features are revealed at H04 and H05 for the M2tides. The rotation of velocity vectors varies with depth except for the nearly constant rotation of the M2tide at H05 and the O1tide at the MR site. The K1and M2tides have similar intensities at successive stations, whereas the O1tide is clearly dominant at the MR site. The phase and energy of the internal tides reveal a vertically propagating feature,which is shown both in the velocity f ield and vertical variation of the phase. The result of the decomposition of the isopycnal f luctuation signals shows that the diurnal and semidiurnal isopycnal f luctuations both reachO(5 m) at H03,O(8 m) at H04, andO(10 m) at H05. They also demonstrate little vertical variation,as they are dominated by the barotropic signals, with a prominent K1tide signal at H03 and H05 and an M2tide signal at H04. The time series of both the alongshore and cross-shore components of the horizontal internal tide energy f lux reveal the vertically propagating feature of the phase and energy at the three stations. The energy f lux decreases fromO(0.1 W/m) at H05 toO(0.01 W/m) at H03, implying energy propagation from off shore to inshore.
6 DATA AVAILABILITY STATEMENT
The data at successive stations analyzed during the study are available from the corresponding author upon reasonable request. The mooring data at the MR station were downloaded from the “South China Sea and Adjacent Seas Data Center, National Earth System Science Data Center, National Science &Technology Infrastructure of China” (http://ocean.geodata.cn).
7 ACKNOWLEDGMENT
The authors thank editors and three anonymous reviewers for useful and constructive suggestions on the manuscript. We are also grateful to all the people working for the valuable cruise observations east of Hainan Island in winter 2012.
 Journal of Oceanology and Limnology2022年2期
- Journal of Oceanology and Limnology的其它文章
- Identif ication of Antarctic minke and killer whales with passive acoustic monitoring in Prydz Bay, Antarctica*
- Eff ects of dissolved oxygen and nutrients from the Kuroshio on hypoxia off the Changjiang River estuary*
- Methane in the Yellow Sea and East China Sea: dynamics,distribution, and production*
- Longitudinal genetic analysis of growth-related traits in red swamp crayf ish Procambarus clarkii (Girard)*
- Early life migration and population discrimination of the small yellow croaker Larimichthys polyactis from the Yellow Sea: inferences from otolith Sr/Ca ratios*
- A new oil spill detection algorithm based on Dempster-Shafer evidence theory*
