
Profiling elite male 100-m sprint performance:The role of maximum velocity and relative acceleration
2022-03-24 02:36RobinHealyIanKennyAndrewHarrison
Robin Healy*,Ian C.Kenny,Andrew J.Harrison
a Department of Physical Education and Sport Sciences,University of Limerick,V94 T9PX,Ireland
b Department of Sport and Health Sciences,Athlone Institute of Technology,N37 HD68,Ireland
c Health Research Institute,University of Limerick,Limerick,V94 T9PX,Ireland
Abstract
Keywords: Deceleration;Modelling;Race phases;Reaction time;Split times
1. Introduction
The 100-m sprint can be divided into 3 main phases: the block start with acceleration phase,which is sometimes subdivided into initial acceleration and main acceleration phase (or pick-up); the maximum velocity phase; and the deceleration phase.1-4 Plotting a sprinter’s velocity-distance curve (Fig.1)allows each distinct phase of the 100 m to be identified.Initial acceleration is represented by a rapid increase in velocity,2whereas a more gradual increase in velocity(pick-up phase)is subsequently observed.4,5The maximum velocity phase is characterized by a gradual increase in velocity, which is represented as a relatively flat section of the velocity-distance curve,where the velocity remains close to 100%of maximum velocity (vmax).6Sprinters typically reach their highest speed between 50 m and 80 m,with faster sprinters usually reaching vmaxlater in the race.7-9 During the deceleration phase,sprinters attempt to counteract the inevitable decrease in velocity due to fatigue and maintain the highest velocity possible for the remainder of the race.9This is represented by a gradual decrease in velocity, usually over the final 20 m, and that can be assessed by calculating the percentage of velocity lost(vLoss)relative to vmax.10
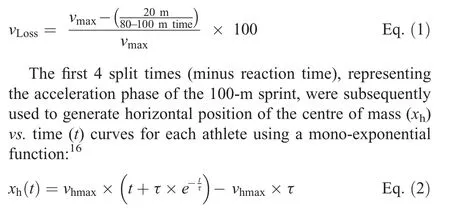
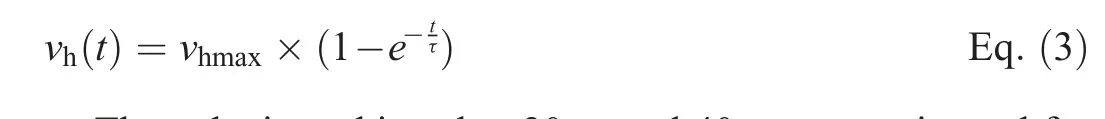
A sprinter’s position-time and velocity-time curves can be modelled throughout the acceleration phase of a sprint by using a mono-exponential function.11-14 This function requires 2 input parameters: the sprinter’s maximal horizontal velocity (vhmax) and the acceleration time constant (t), which is the ratio of vhmaxto the initial horizontal acceleration.13The variable t represents the total delay in overcoming inertia up to the instant maximum velocity is achieved;11thus, its measurement unit is the second.For example,if a sprinter reached vhmaxat 40 m during a sprint with a t value of 1 s,this means that the sprinter would cover this 40-m distance 1 s faster if there were no lag due to inertia(i.e.,no acceleration phase).If t was equal to zero, the sprinter would instantaneously reach maximal velocity without any acceleration phase, which is obviously not possible. Consequently, a more practical description is that t represents an athlete’s relative acceleration ability,with lower values indicating the ability to reach a higher percentage of vmaxmore quickly relative to athletes with a higher t.15Despite the identification of t as a performance factor in sprinting,the specific influence of t on 100-m performance in elite male sprinters has yet to be determined.
Several methods exist for modelling horizontal positiontime and velocity-time from split times using the mono-exponential function. Furusawa et al.11reported a mean difference of 0.079 m between the raw position data of a sprinter, collected at 10 points during a 54.9-m (60-yard)sprint, and the position estimated by the mono-exponential function.Clark et al.15demonstrated that 3 split times recorded at 9.1 m, 18.3 m, and 36.6 m in National Football League(NFL) Combine athletes could be used to generate accurate distance-time,velocity-time,and velocity-distance curves over 36.6 m(40 yards)using the mono-exponential equation.Samozino et al.16demonstrated the validity of a 5 split zone method,where timing gates were set up at 10 m,15 m,20 m,30 m,and 40 m to assess position-time and velocity-time curves in sprinters, and the researchers subsequently used these data to model power and force properties.Furusawa et al.,11Samozino et al.,16and Clark et al.15demonstrated the ability of the mono-exponential function to model position-time and velocity-time curves accurately over short sprints (<55 m). Consequently, accurate derivation of horizontal position-time and velocity-time curves during the acceleration phase of a 100-m sprint with the fewest possible number of split times would be of considerable practical benefit to sprint coaches and researchers alike.
The limited availability of large numbers of world-class athletes is often a problem for researchers seeking to conduct research that informs elite performance. This is understandable,especially in the 100-m sprint,because elite athletes often train in small, highly specialized groups dispersed throughout the world,with sprint coaches who dedicate a significant amount of time and investment in order to provide high-quality coaching services.Using publicly available competition sprint data, usually in the form of sprint split times collected at major events by independent researchers or International Association of Athletics Federations(IAAF)biomechanical research teams,provide a potential solution to this problem. Online, publicly available datasets have been widely used in 100-m sprint research to assess the impact of rule changes,17the effects of wind speed,18age,and sex differences in sprint mechanical properties,9and reaction times,19stride kinematics,8and kinetics and energetics of world-class performers.20-22 Consequently, examination of sprint acceleration and velocity profiles using these data sources has the potential to provide greater insight into world-class sprint performance.
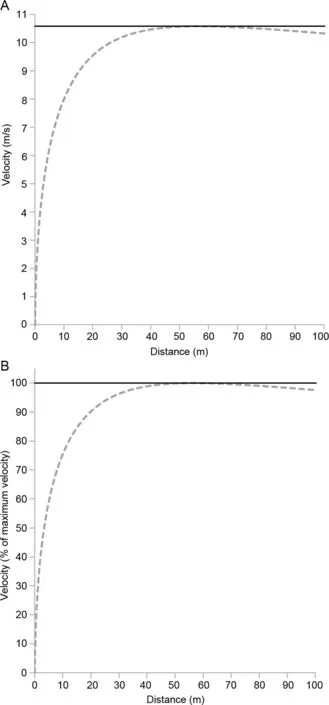
Fig.1. An example of(A)how velocity,in absolute units and(B)as a percentage of maximum velocity,changes throughout a 100-m sprint.In both plots,the broken grey line represents the modelled velocity-distance curves,and the black line represents maximum velocity.A rapid increase followed by a gradual increase in velocity can be observed over the first 40 m. Subsequently, maximum velocity is attained and maintained until the final section of the 100-m race, where velocity begins to decrease.
This study aimed to determine the accuracy of a 4 split time modelling method to generate velocity-time and velocity-distance variables in elite 100-m male sprinters using publicly available sprint data from major international sprint events. A subsequent aim was to assess the roles of key sprint parameters—vmax, t, and vLoss—in 100-m sprint performance and to subsequently assess the role of vmaxin each phase of the 100-m sprint. Finally, this study aimed to compare faster and slower sprinters using modelled and measured race variables.
2. Methods
2.1. Subjects
The data used in this study were obtained from online position-time records taken during major athletic competitions,with 82 male sprint athletes included in the final analysis.Athletes were subsequently divided into tertiles to facilitate further analysis.Tertiles were selected based on 100-m time,with the first and third tertiles considered the faster and slower groups,respectively. Tertiles were used so that there was a clear distinction between the faster and slower groups. This prevented the possibility of border cases (i.e., instances where athletes are only 0.01-0.02 s away from being consider “faster”instead of “slower” or vice versa). The 2017 IAAF scoring tables of athletics were used to score each 100-m sprint time,enabling future comparisons between performances achieved in the current study and performances by female 100-m sprinters or performances in other sprint events (e.g., 60 m and 200 m). Mean § SD 100-m time, anthropometric data, and IAAF points were obtained for all sprinters, faster sprinters,and slower sprinters (Table 1). The collection and analysis of the data in this study was approved by the University of Limerick Research Ethics Committee.
2.2. Data sources
Sprint data were available from IAAF-accredited biomechanics projects and additional research published by research groups utilizing video analysis.In total,data were publicly available for 8 world championships between 1987 and 20171,8,23-28 and 3 Olympic Games between 1988 and 2012.8,29Athletes were included in the analysis only if their entire 100-m data were available,either as 10-m or 20-m split times,and if their reaction time was available via IAAF-approved start information systems.Additionally,video footage of each race was assessed by the primary investigator to ensure that each athlete included in the final analysis completed his 100-m sprint without sustaining an injury or intentionally slowing down before the finish line. Only theathletes’ best performances in all competitions were retained for analysis. The championships, methods employed, split times recorded, and number of athletes retained for the final analysis are described in Table 2. These data were recorded using a mixture of high-speed video measurements (sampling rates:50-250 Hz) and laser analysis (sampling rates: 50-100 Hz),which have been demonstrated to yield comparable results.20,30
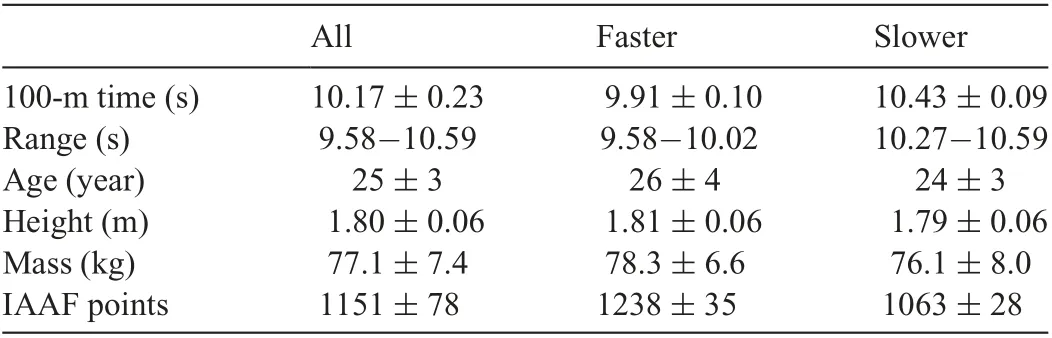
Table 1 Descriptive statistics for all(n=82),faster(n=28),and slower(n=28)sprinters(mean§SD).
2.3. Sprint analysis
To ensure consistency in the analysis,all data were presented in 20-m split times so that 0-20, 20-40, 40-60, 60-80, and 80-100-m data were available for all athletes. The following variables were included in the final analysis based on these raw position-time data: 100-m sprint performance (excluding reaction time),reaction time,and 20-m split times expressed as raw times and as percentages of 100-m time,vmax, and the average velocity achieved over the 0-20 m and 20-40 m sections expressed as a percentage of vmax. The vmaxwas calculated as 20 m divided by the fastest 20-m split time achieved in the race.Additionally, the vLosswas determined as an indicator of the athlete’s ability to maintain maximum velocity during the final 20 m of the race.10The vLosswas calculated as vmaxminus average velocity over the final phase of the race divided by maximum velocity multiplied by 100,or simply:
where vhmaxis the estimated maximum horizontal velocity achieved, t is time, e is the natural exponential, and t is the acceleration time constant. Using Eq. 2 above and the Microsoft Excel (Microsoft Excel; Redmond, Washington DC,USA)solver function,the best estimations for t and vhmaxwere calculated using a least squares approach between the raw position-time data and the modelled position-time data similar to previous investigations.9,16The estimated t values were retained for the final analysis whereas the estimated vhmaxvalues were used only to compare against the raw vmaxvalues,which were retained for the final analysis.
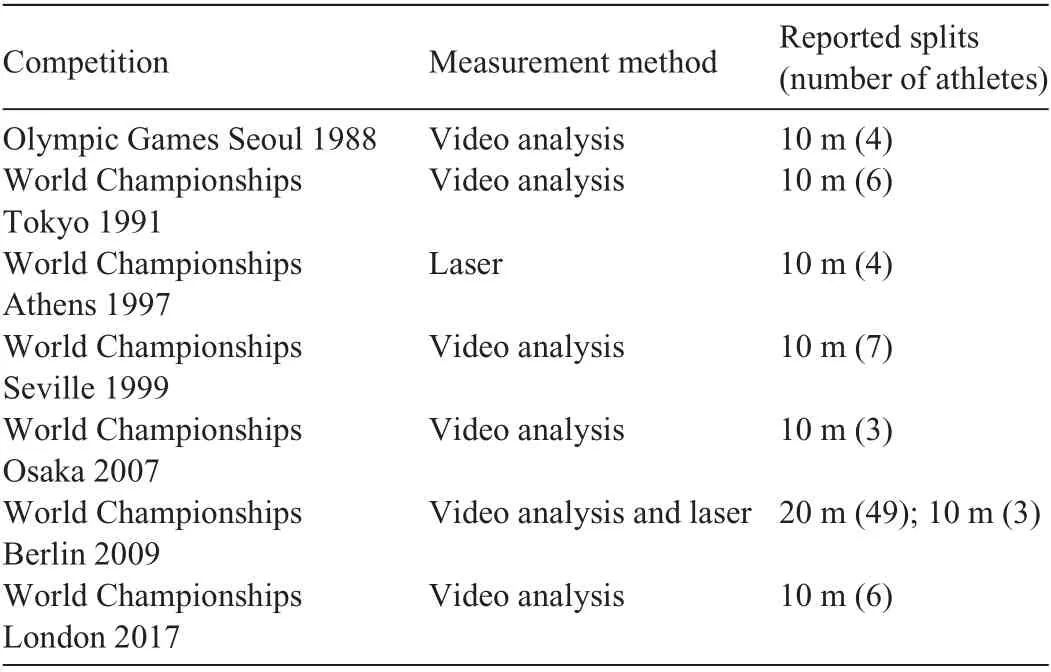
Table 2 Competition sources of sprint data, measurement methods employed, and reported split time intervals
Using the approximated values of vhmaxand t, the velocity of the athlete’s centre of mass vs. time curves could be generated by differentiating Eq.2 with respect to time:
The velocity achieved at 20 m and 40 m was estimated for each athlete by using the generated velocity-time curves and was expressed as a percentage of vmax,which is similar to the work of Clark et al.,15e is the natural exponential.
2.4. Statistical analysis
The accuracy of the 4 split time modelling technique was evaluated through several methods. First, the 4 measured split times used to generate the model(20 m,40 m,60 m,and 80 m)were compared with modelled times(n=82).Second,where available,measured split times at 10 m,30 m,50 m,and 70 m were compared with modelled times(n=33).Finally,measured and modelled average velocities over 0-20 m,20-40 m,40-60 m,and 60-80 m, in addition to vmaxvalues, were compared (n=82).Bland-Altman 95%limits of agreement analysis31and intraclass correlation coefficients(ICCs)(2,1)with 95%confidence intervals(95%CIs)32were used to compare modelled and measured variables.
The normality of the data was assessed by plotting and visually inspecting the shape of the histograms for all variables and by using the Shapiro Wilks test with the a level set at p<0.05.Differences in all sprint measures between faster and slower groups were assessed using independent samples t tests. The Cohen d effect sizes (ES) were calculated and were interpreted as trivial(<0.2), small (0.2-to <0.6), moderate (0.6-to <1.2), large(1.2-to <2), very large (2-to <4), or extremely large (-4)according to the scale proposed by Hopkins et al.33
Relationships between measures were assessed using the Pearson correlation coefficient or the Spearman rank correlation coefficient with 95%CIs.Partial correlations were used to assess the relationships between t and 100-m sprint performance and between vLossand 100-m sprint performance while controlling for vmax. The strengths of the correlations were evaluated as trivial (0-0.09), small (0.10-0.29), moderate(0.30-0.49), large (0.50-0.69), very large (0.70-0.89), near perfect (0.90-0.99), or perfect (1).33All statistical analyses were completed using SPSS (Version 24.0; IBM Corp.Armonk, NY, USA). As multiple t tests and correlations were performed,the familywise error rate was controlled at 0.05 by using a false-discovery rate controlling procedure.34
3. Results
The results of the comparison between measured and modelled variables are given in Table 3. All variables displayed excellent accuracy and close agreement with the raw measures(range of mean bias was -0.2% to 0.2%, and range of ICCs was 0.935 to 0.999) except for the 10-m time, which had a mean bias of 1.6%§1.3%and an ICC of 0.600.
Descriptive statistics (mean § SD), mean differences, and ESs between faster and slower groups are provided in Table 4.The faster group had a significantly faster 100-m sprint performance times (extremely large effect) and shorter reaction times(moderate effect)and were faster over all sections of the 100 m (very large to extremely large effects). Relative to the slower group,the faster group spent a significantly higher percentage of time in the 0-20-m (large effect) and 20-40-m(moderate effect) sections, whereas the slower group spent a significantly higher percentage of time in the 40-60-m (large effect), 60-80-m (small effect) and 80-100-m (moderate effect) sections. No significant difference was found for relative percentage of reaction times.
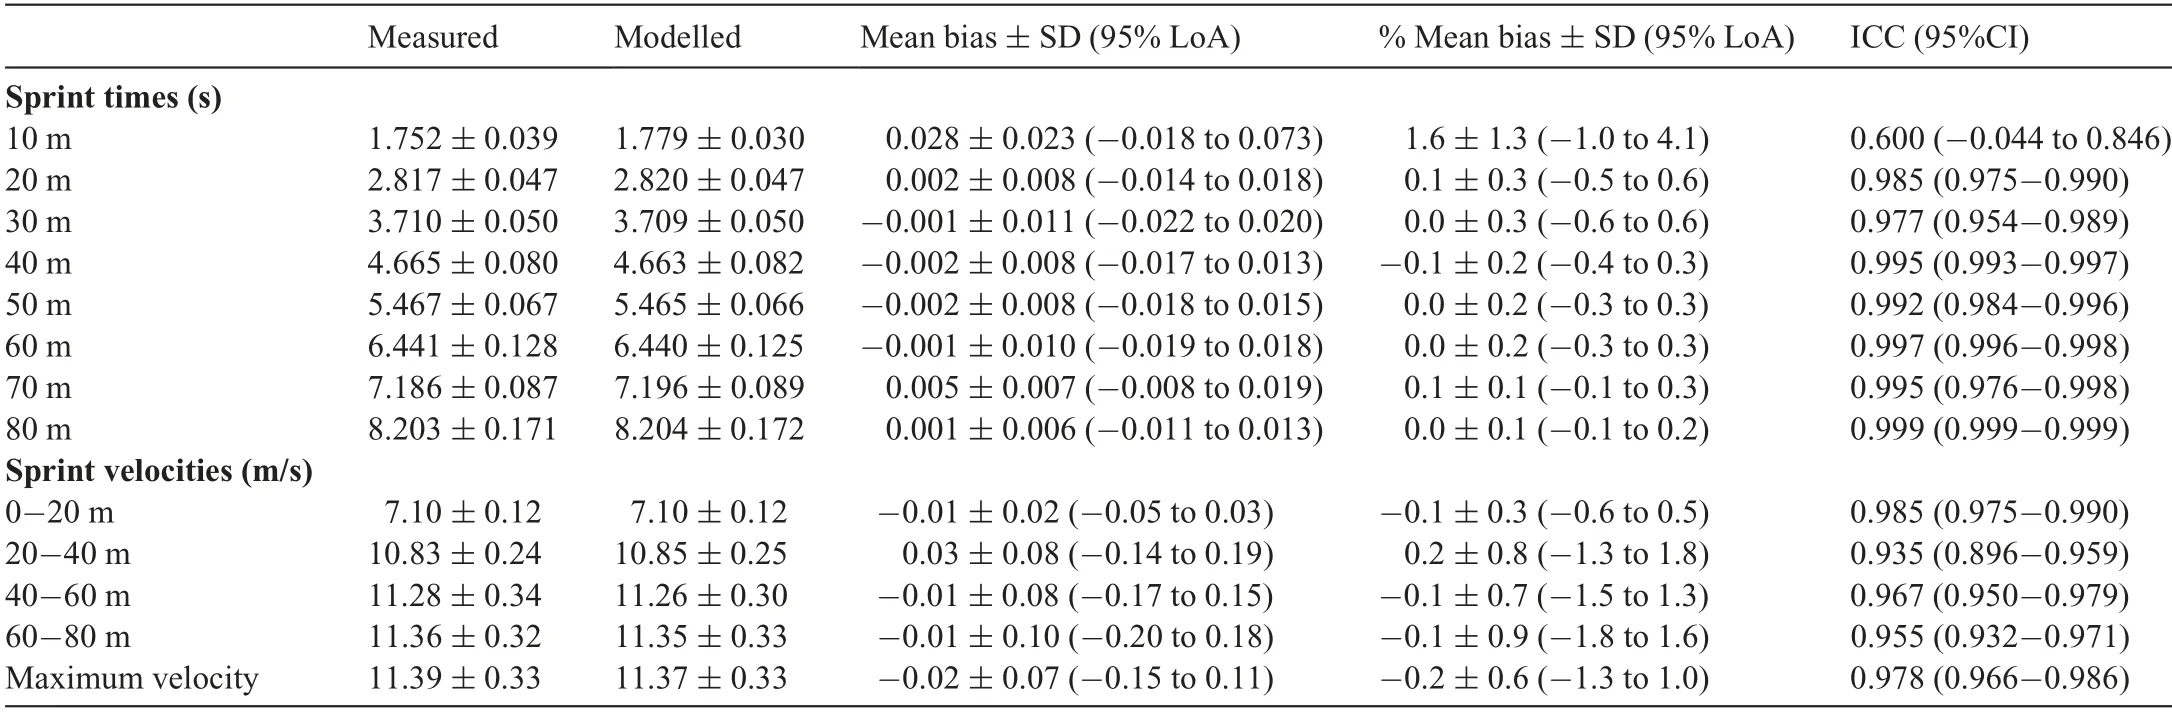
Table 3 Mean§SD results,mean bias§SD with 95%LoA,and single-measure ICC with 95%CI for measured and modelled sprint time and sprint velocities.
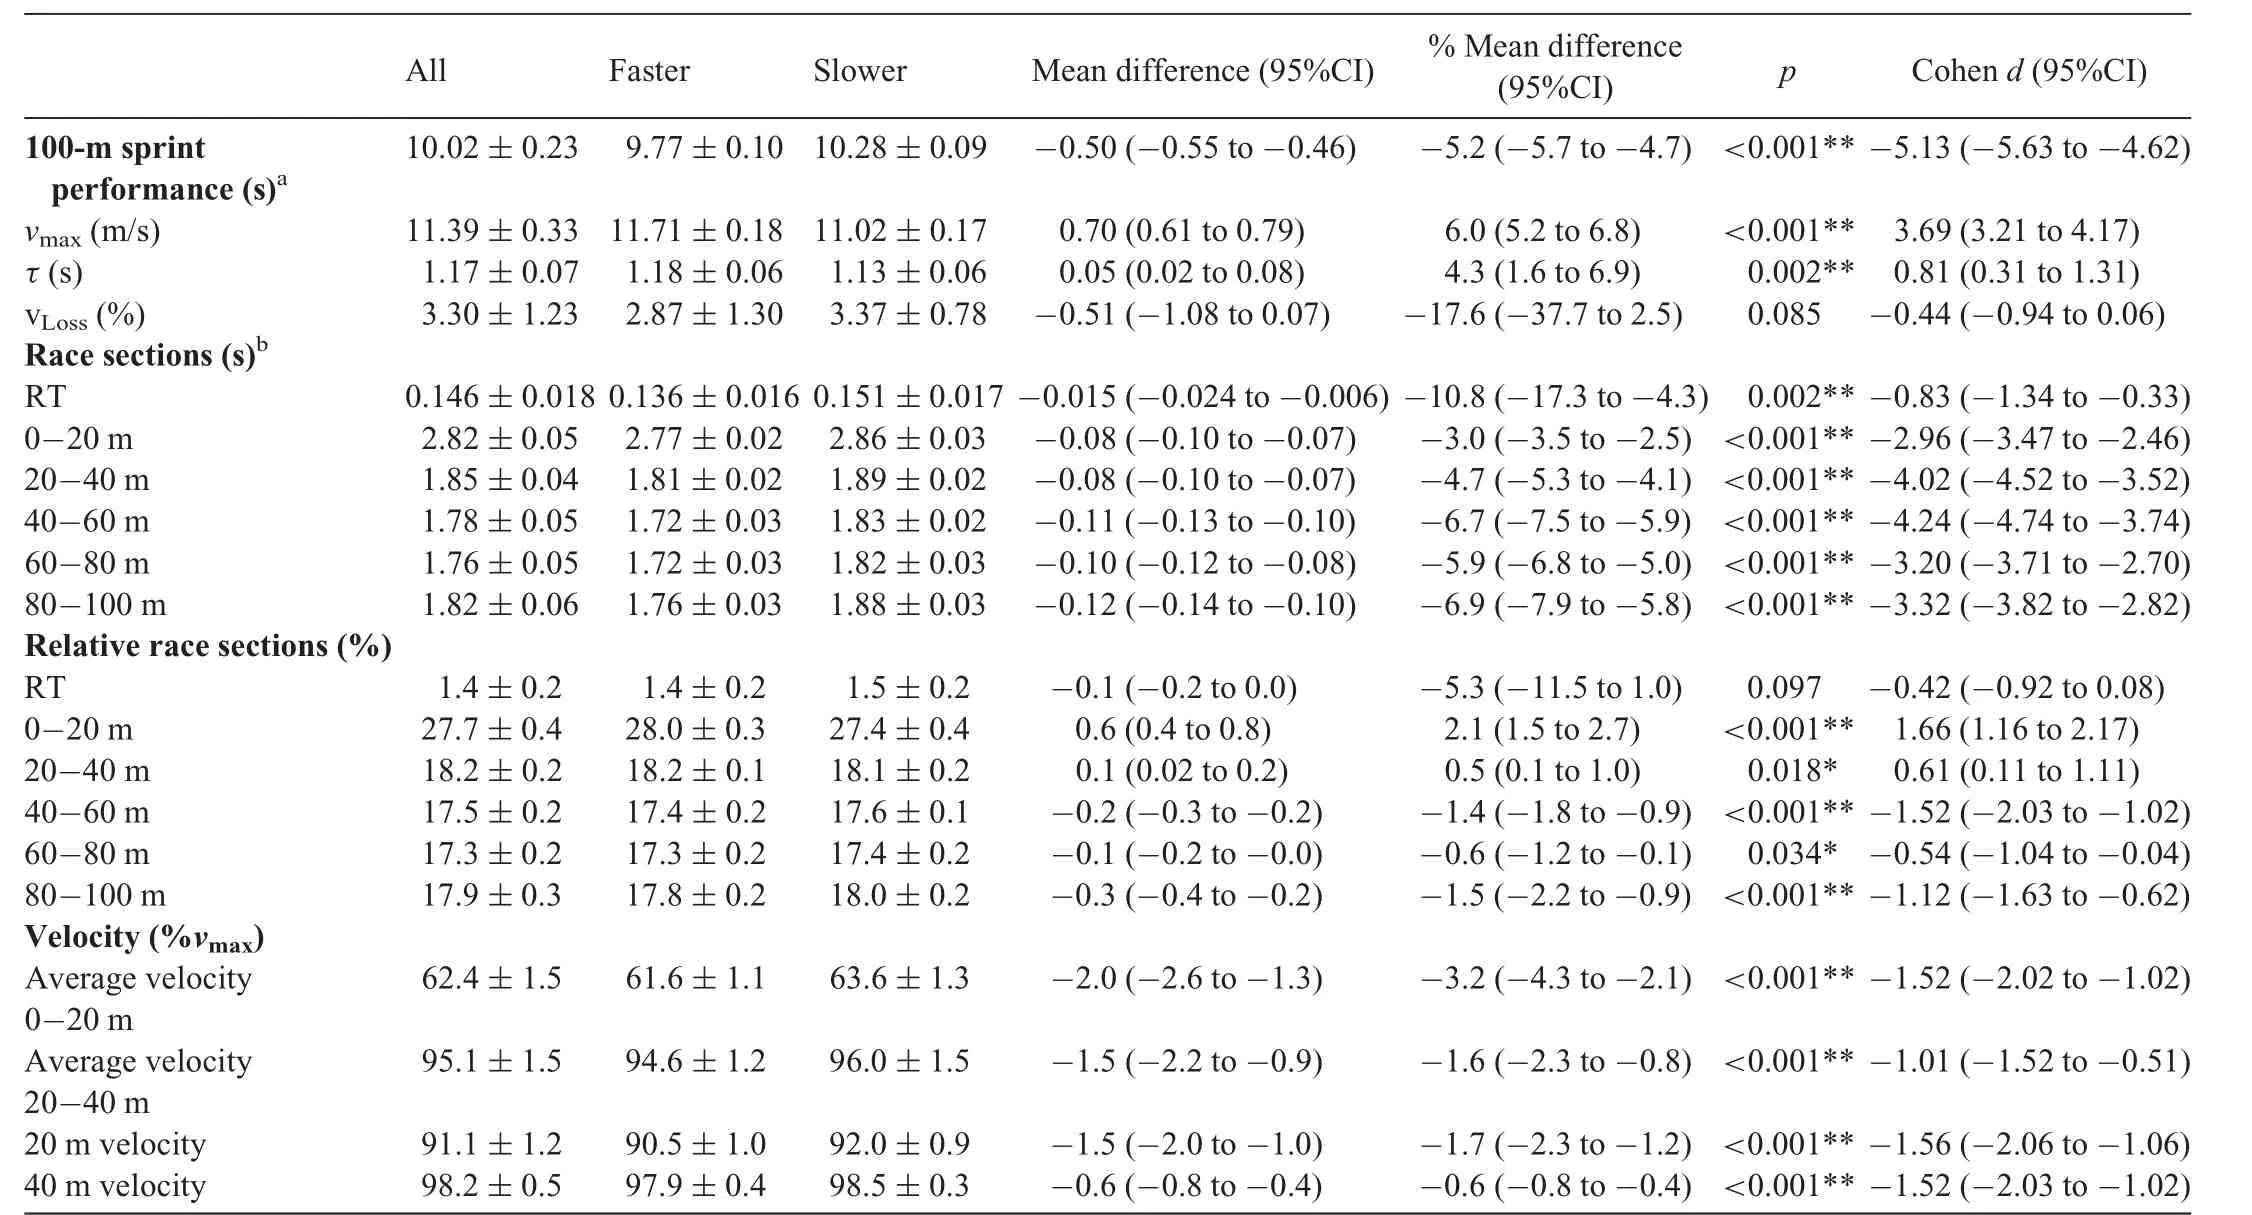
Table 4 Mean § SD for all sprinters (n=82), faster sprinters (n=28), and slower sprinters (n=28), mean difference with 95%CI and Cohen d effect size for all sprint variables.
The faster group also had a significantly higher vmax(very large effect)and significantly lower velocity,as a percentage of vmax,at 20 m and 40 m (large effects) and a significantly lower average velocity,as a percentage of vmax,over the 0-20-m(large effect)and 20-40-m sections(moderate effect).A significantly higher t was found in the faster group(moderate effect),whereas a small effect was found for vLoss,with the faster group displaying lower values;however,this was not significant(p=0.085).
The relationships between vmax,0-20-m,20-40-m,40-60-m,60-80-m, and 80-100-m sprint times are shown in Table 5.All 20-m split times had a significant, near-perfect negative correlation with vmaxexcept for the 0-20-m split time,which had a significantly large negative correlation with vmax.
Scatterplots illustrating the relationship between t,20-m,and 40-m velocity and average velocity over 0-20-m and 20-40-m sections are given in Fig. 2. Significant, near perfect negative correlations were found between t,velocity at 20-m,and 40 m,and average velocity over 0-20 m, whereas a significant, large negative correlation was found between t and average velocity over 20-40 m.
Scatterplots illustrating the relationship between 100-m sprint performance, vmax, t, and vLoss, along with the relationships between vmax,t,and vLoss,are given in Fig.3.Significant negative correlations were found between 100-m sprint performance and vmax(near perfect)and t (moderate).No significant relationship was found between 100-m sprint performance and vLoss. A significant positive correlation was found between vmaxand t(large), whereas no significant relationship was found between vmaxand vLoss.After controlling for vmax,a significant,very large positive correlation was found between 100-m sprint performanceand t(r=0.86,95%CI:0.78-0.91,p<0.001),whereas the correlation between 100-m sprint performance and vLosswas not significant(r=0.14,95%CI:-0.10 to 0.37,p=0.220).

Table 5 Correlations between vmax and 20-m split times.
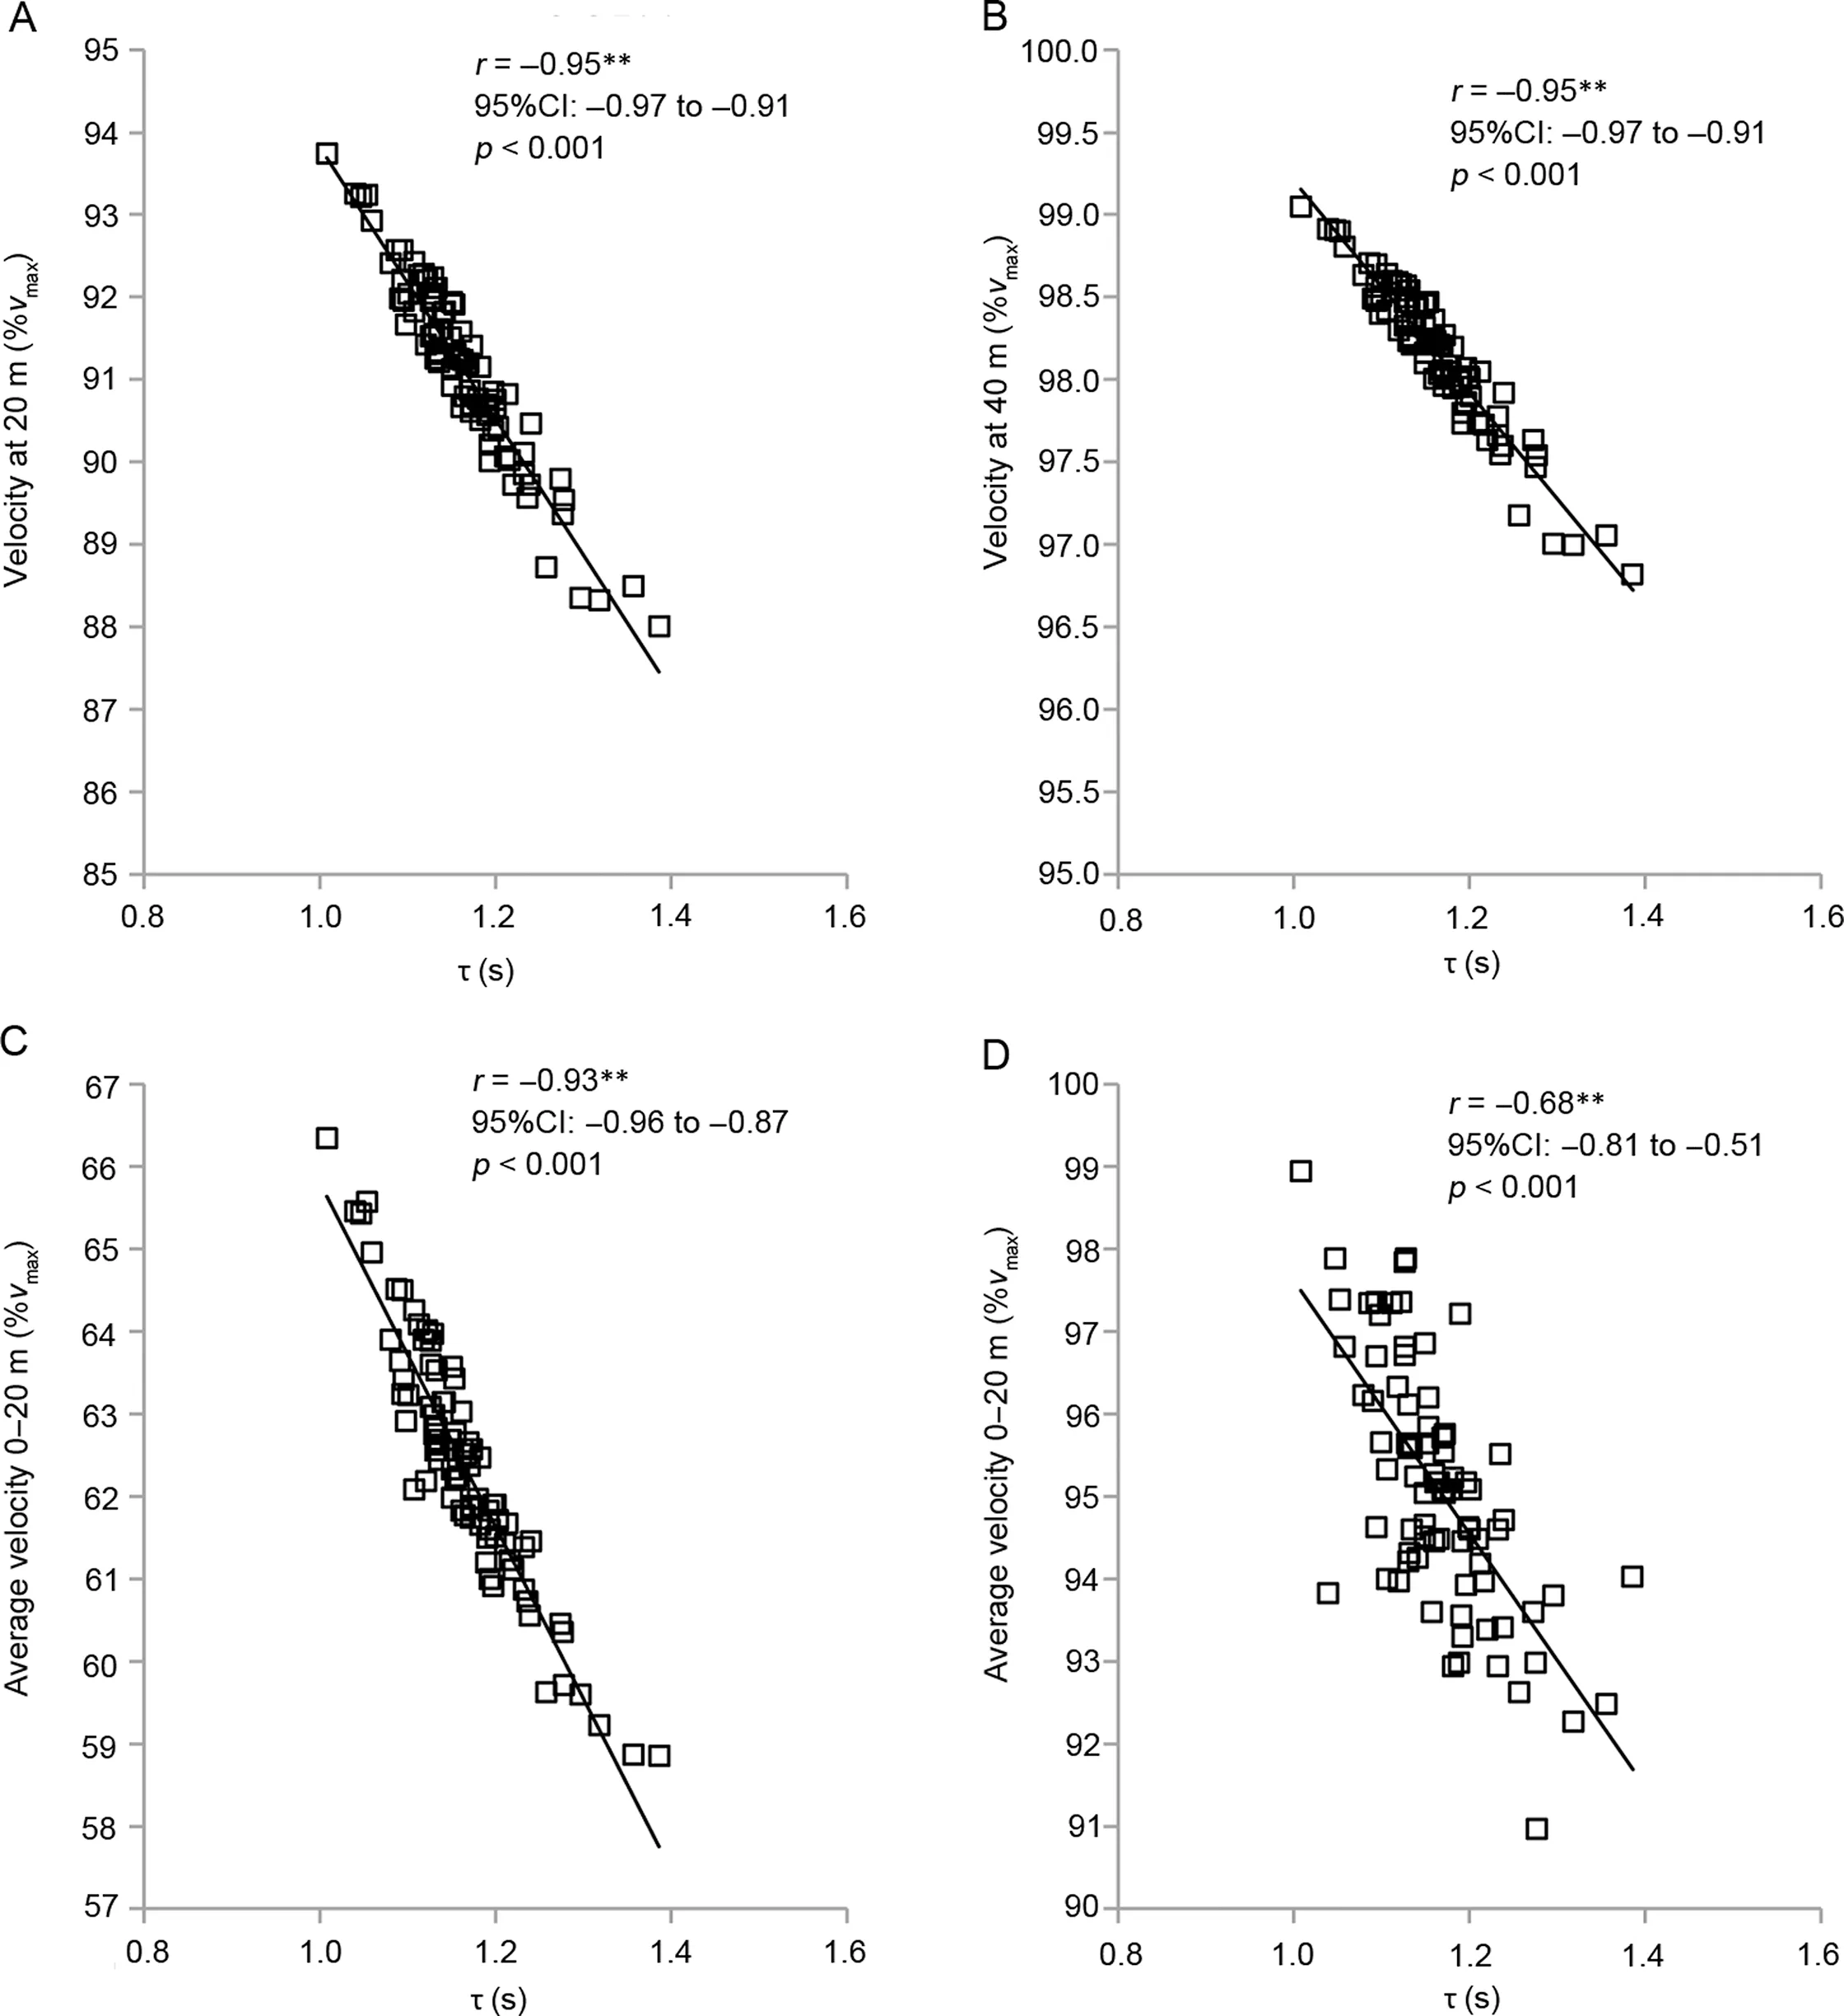
Fig.2. Scatterplots illustrating the associations between t,velocity at(A)20 m,(B)velocity at 40 m, (C)average velocity over 0-20 m,and (D)average velocity over 20-40 m.**p<0.01.TagedEnd
4. Discussion
4.1. Accuracy of the 4 split time modelling method
The results shown in Table 3 suggest that the 4 split time modelling method provided an accurate estimation of sprint times for every 10-m section from 20 m to 80 m, average velocities for each 20-m section (0-20 m, 20-40 m, 40-60 m, and 60-80 m) and vmax(ICCs: 0.935-0.999, mean bias:-0.2% to 0.2%). The curves generated by the modelling method were derived from 2 input parameters, vhmaxand t.Only vhmaxcould be compared to directly measured data(i.e., vmax). To indirectly assess the accuracy of t, sprint times, and velocities that were not directly used to generate the distance-time and velocity-time curves were evaluated.This approach was successful in demonstrating the accuracy of the 4 split time method except for the estimation of the 10-m time (ICC=0.600, mean bias=1.6%). This suggests some uncertainty in the accuracy of velocity estimates over the first 10 m; however, this could not be directly assessed using the available data.
This study used only elite male data; thus, the 4 split time method cannot be assumed to be as accurate for female sprinters or sprinters at lower performance levels. The mono-exponential function can model only the acceleration phase of a sprint;therefore,the accuracy may be affected due to differences in acceleration ability (e.g., time to reach vmax), with elite male sprinters accelerating over a longer distance and for a longer time compared to their female and less skilled counterparts.2,4,7,9,35Future research in female athletes is,therefore,warranted because other split combinations (e.g., 10 m, 20 m, 40 m, and 60 m) may be more appropriate. Additionally, it is recommended that coaches or researchers using the 4 split times modelling method on 100-m sprint data should assess the input(vmax)and output data to confirm the accuracy of the method.
4.2. Differences between faster and slower sprinters
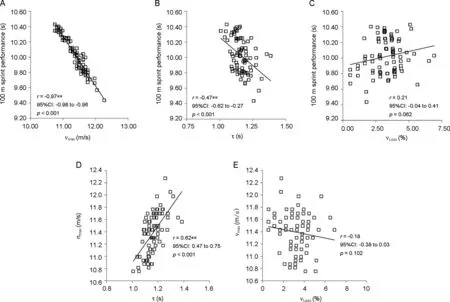
Fig. 3. Scatterplots illustrating the associations between 100-m sprint performance, (A-C) vmax, t, and vLoss and (D-E) the associations between vmax, t, and vLoss.**p<0.01.TagedEnd
Faster sprinters had a significantly higher vmax(6.0%) and a higher t(4.3%)than slower sprinters(Table 4).The difference in vmaxwas considered very large (ES=3.69), whereas the difference in t was considered moderate (ES=0.81). This demonstrates that vmaxwas the most important variable measured in elite 100-m sprinters.The moderate differences in t can likely be explained by the very large difference between groups in vmax.Because t represents the ratio of maximal horizontal velocity to the maximal horizontal acceleration,a higher vmaxwithout a proportional increase in maximal horizontal acceleration would result in a higher ratio and,thus,a higher t.This finding is contrary to the results of Clark et al.,15who found no significant difference in t between NFL Combine athletes with higher vmaxand athletes with lower vmax,even with very large differences in vmax.Maximal horizontal acceleration can be assessed by dividing vmaxby t.Utilizing the mean data reported in Clark et al.,15maximal acceleration values of 12.49 m/s2and 11.07 m/s2were estimated for the faster and slower groups, respectively,representing a 1.41 m/s2(11.3%) mean difference. In contrast,maximal acceleration values of 9.92 § 0.35 m/s2and 9.75 §0.43 m/s2were found for faster and slower sprinters, respectively,in the current study.This represents a mean difference of 0.17 m/s2(1.7%)and was not significant(p=0.105).
A significant moderate difference was found for reaction times, with faster sprinters reacting 10.8% more quickly than slower sprinters (Table 4). This is supported by previous research, which found a significant, weak positive correlation(r=0.292) between reaction times and 100-m sprint time in 674 male sprinters during IAAF athletic world championships.19The faster sprinters were quicker over all 20-m sections; however, the mean differences were larger in the 40-60-m, 60-80-m, and 80-100-m sections (-6.6%,-5.9%, and -6.9%, respectively) relative to the 0-20-m and 20-40-m sections (-3.0% and -4.7%, respectively). This explains why the faster sprinters spent a significantly higher percentage of time in the 0-20-m and 20-40-m sections and a lower percentage of time in the 40-60-m, 60-80-m, and 80-100-m sections compared to the slower sprinters. These differences in absolute and relative times are not surprising because the faster and slower groups were initially created based on 100-m sprint performance times.
The faster group had a 17.6% lower mean vLossthan the slower group,although this difference was not statistically significant (p=0.085) (Table 4). It is worth noting that a larger variance was recorded in the faster group(SD:§1.3%;range:0.6%-5.6%) compared to the slower group (SD: § 0.78%;range: 1.6%-5.2%). Consequently, future research with a larger sample would have greater statistical power to determine whether differences exist. Slawinski et al.9found that world-class male sprinters had a significantly lower loss in relative velocity compared to world-class female sprinters. A potential explanation provided by the authors was that the women in that study reached vmaxearlier and thus had a deceleration phase that was 1.77 s longer than that of the men,which would lead to greater relative fatigue effects in women.9
Faster sprinters reached significantly lower velocities relative to vmaxat 20 m and 40 m and on average over the 0-20-m and 20-40-m sections (Table 4). This is consistent with the difference found for t because lower t values indicate a greater ability to quickly reach a high percentage of vmax.This is well supported by the literature; better sprinters accelerate for longer and so do not achieve the same relative velocities as their slower counterparts.7,35Clark et al.15reported relative velocities of 97.2% § 0.9% at 18.3 m in male NFL Combine athletes,which is considerably higher than the relative velocities reported in the present study at 20 m(91.1%§1.2%).The athletes in the current study achieved higher vmaxvalues(11.37§0.33 m/s vs. 9.08 § 0.62 m/s) compared to the athletes in the study by Clark et al.15Therefore,caution is advised when comparing t values among studies of differing athletic populations.Differences in method-related factors, such as the sprint distance studied (e.g., 36.6 m vs. 80.0 m), will affect t because shorter distances may not be sufficient for some athletes to reach their true vmax. This will result in the underestimation of that athlete’s t.Additionally,the start type(i.e.,block start,standing start,3-point start)will result in different values for initial acceleration,which will subsequently affect t.
4.3. Relationships between sprint variables
The results shown in Table 5 highlight the critical importance of vmaxto each 20-m section of the 100-m sprint, with higher vmaxvalues associated with quicker sprint times.Stronger absolute correlations were found for the 20-40 m, 40-60 m,60-80 m, and 80-100 m sections (r --0.90), but a strong negative correlation was still found for the 0-20 m section(r=-0.57). This suggests that vmaxplays an important role in the initial acceleration phase, which is consistent with research on lower-level male sprinters(mean§SD 100-m personal best(PB): 11.17 § 0.33 s) and athletes in field sports.7,15,36In this study, the mean average 0-20 m velocity as a percentage of vmaxwas 62.4%.A higher vmaxwill,thus,lead to a higher average 0-20 m velocity in absolute units and,thus, quicker 20-m sprint time compared to an athlete with a lower vmax.
The significant correlations presented in Fig.2 indicate that as t values increase, the percentage of vmaxachieved decreases.These findings confirm the accuracy of t,estimated using the 4 split time approach, as an indicator of an athlete’s relative acceleration ability. The relationship between t and average velocity was lower for the 20-40 m section compared to the 0-20 m section (r=-0.68 vs. -0.93, respectively),which suggests that t is a better indicator of relative acceleration ability over the initial 20 m; however, the relationship is still large in the 20-40 m section.
Decreasing vmaxwith no change in initial acceleration will lead to a decrease in t and,thus,a greater relative acceleration ability;however,this change is entirely counterproductive and will lead to slower sprint times overall. Increasing maximal acceleration with no change in vmaxwill lead to a decreased t and, thus, improve an athlete’s relative acceleration ability.This will subsequently enhance overall 100-m sprint performance because athletes will reach higher levels of their vmaxearlier. Consequently, we recommend any consideration of t be made in conjunction with the athlete’s vmax.Sprint,technical, or strength-training methods are needed to develop maximal acceleration or methods that improve the athlete’s technical ability to apply force and,thereby,maintain a higher level of acceleration as a sprint progresses.Promising research using heavy-sled training by male amateur soccer players37has demonstrated improvements in maximal horizontal force,which logically imply improvements in maximal horizontal acceleration; however, such findings in an elite sprinter population have yet to be reported.
The results presented in Fig. 3 are consistent with other research and indicate a significant negative correlation between 100-m sprint performance time and vmax.7,9,10This can be explained by several factors relating to the phases of the 100-m sprint that have already been discussed.Briefly,sprinters with a higher vmaxwill typically reach higher velocities during the acceleration phase and will take longer to reach vmax.Subsequently,a longer acceleration and maximum velocity phase results in a shorter deceleration phase;thus,the decrease in sprint velocity as a result of fatigue is limited.7,9Combined,these factors result in quicker overall 100-m sprint times.
This is the first study to assess the relationship between 100-m sprint performance, t, and vLossin elite male sprinters.A moderate negative correlation was found for t,which indicates that higher t values were related to quicker sprint performance times. This is consistent with the findings of Volkov and Lapin,7who found a large negative correlation(r=-0.52) between 100-m time and t. In Volkov and Lapin’s research,t was derived using a bi-exponential function that included the deceleration phase of a 100-m sprint in the model prediction. This negative relationship between t and performance is counterintuitive because athletes with greater relative acceleration ability would be expected to be quicker over 100 m. However, this can be explained by the significantly large positive correlation found between vmaxand t in the current study. Because higher t values were associated with higher vmaxvalues, and higher vmaxvalues were associated with quicker 100-m sprint performance times, vmaxwas, therefore, a confounding variable.By controlling for vmax, a significant, very large positive correlation was found between t and 100-m sprint performance,suggesting that for athletes with similar vmaxvalues,lower t values were associated with quicker 100-m sprint performances, which is consistent with the conceptual understanding of t.
No significant relationship was found between vmaxand vLossor between 100-m sprint performance and vLoss, even when controlling for vmax. The lack of a significant correlation between vmaxand vLosssuggests that the ability to maintain maximal velocity is independent of an athlete’s maximum speed capabilities.This ability,therefore,requires specific attention in training; however, future research is required to confirm this finding and to assess whether this is consistent in sprinters and team sport players of varying levels of ability.
The 100-m sprint is a multidimensional skill,and as the science underpinning the training and coaching of 100-m sprinters continues to improve, it is likely that success in major championships will require sprinters to excel in all factors assessed in the current study. They include short reaction times, high relative acceleration ability, high vmax, and low vLoss. Each individual athlete will likely have strengths and weaknesses in each of these variables, and they will manifest in terms of technical and physical deficiencies that should be examined in much more depth than has been undertaken in the current study. These weaknesses should be highlighted by sprint coaches and support staff and progressively targeted during an athlete’s long-term development. Coaches are encouraged to use the methods outlined in the current study in conjunction with split times.Although 5 split times were used in the current study,additional splits(i.e.,10 m)would provide even greater information about a sprint;however,only 4 splits are required to model the acceleration phase accurately.Future research should continue to assess the effectiveness of interventions to improve key race variables in both male and female sprinters over a wide range of performance levels.
There were several limitations in the current study that must be acknowledged.First,wind speed was not factored into the current analysis. Although wind speed data were available for all performances (range: -0.8 m/s to 1.2 m/s), performances were not corrected because each 20-m section would have to be adjusted in order to complete the current analysis. This would require additional information (e.g., projected frontal area and coefficient of drag) that was not available. Second, because a field-based technique (i.e., the 4 split time modelling method)was used to derive some of the key variables used in this study(e.g.,t,velocity at 20 m,and velocity at 40 m),the accuracy of this method is dependent on the quality of the input data.Furthermore,the measurement method was not consistent across all data sources because a wide range of instruments was used,which is understandable, given the nature of the data set (i.e., 7 major events taking place between 1988 and 2017).All data were collected by experienced biomechanical teams and researchers,so it is likely that measurement errors were minimal and did not have any considerable effect on the results of the present study.
5. Conclusion
A 4 split time approach can model velocity-time and velocity-distance curves accurately during acceleration in elite male sprinters with 100-m sprint times ranging from 9.58 s to 10.59 s. Faster sprinters displayed higher vmaxand t values than their slower counterparts.Maximum velocity had a strong negative correlation with the 0-20-m time and a near perfect negative correlation with all other 20-m sections and overall 100-m sprint performance time,highlighting the importance of vmaxto a 100-m sprinter.The variable t is a useful indicator of a sprinter’s relevant acceleration ability; a lower t is associated with the ability to achieve a high percentage of vmax,especially over the first 20 m.Furthermore,t should be considered in conjunction only with vmaxbecause a lower t is associated with a quicker 100-m sprint performance only after controlling for vmax. It is not recommended that t values be compared among athletes unless identical procedures are used (e.g.,sprint distance and starting protocol)because these factors will affect the resulting t.Coaches and researchers are encouraged to utilize the current study’s approach to assess key race variables that describe an athlete’s performance capacities, which can subsequently be used to further inform training.
Acknowledgments
The authors thank the Irish Research Council for financially supporting this research. Additionally, the authors acknowledge the hard work of the biomechanical teams and researchers involved in the collection and analysis of sprint data at major international championships, without which this study would not have been possible.
Authors’contributions
RH conceived the study, compiled the data, performed the data analysis, interpreted the data, conducted statistical analyses,and drafted and revised the manuscript;ICK and AJH contributed to data interpretation and helped to draft and revise the manuscript. All authors have read and approved the final version of the manuscript,and agree with the order of presentation of the authors.
Competing interests
The authors declare that they have no competing interests.
 Journal of Sport and Health Science2022年1期
- Journal of Sport and Health Science的其它文章
- Residual force enhancement in human skeletal muscles:A systematic review and meta-analysis
- Sex differences in injury rates in team-sport athletes:A systematic review and meta-regression analysis
- Physical exercises for preventing injuries among adult male football players:A systematic review
- Interference screws vs.suture anchors for isolated medial patellofemoral ligament femoral fixation:A systematic review
- Incidence of injuries in professional snow sports:A systematic review and meta-analysis
- “When you’re down,stay down”:A lesson for all competitive alpine skiers supported by an ACL rupture measured in vivo