Characterization of dissolved organic matter in submarine groundwater from a salt marsh in Chongming Island, China*
Tangrong HE , Fenfen ZHANG ,**, Yali WANG , Xiaogang CHEN , Jinzhou DU ,2
1 State Key Laboratory of Estuarine and Coastal Research, East China Normal University, Shanghai 200241, China
2 Institute of Eco-Chongming (IEC), Shanghai 202162, China
3 Key Laboratory of Coastal Environment and Resources of Zhejiang Province, School of Engineering, Westlake University,Hangzhou 310024, China
Abstract Salt marshes are research hotspots of the carbon cycle in coastal zones because large amounts of atmospheric carbon dioxide is f ixed by salt marshes vegetation and stored in its biomass and soil. Dissolved organic carbon (DOC) in submarine groundwater (well water and pore water) in salt marshes plays an important role in advective exchange between the salt marshes and coastal waters. However, the molecular characteristics of DOC in salt marsh groundwater are poorly understood because of the complex DOC structures and hydrodynamic process. In this study, f luorescent components and refractory DOC (RDOC)in submarine groundwater from a salt marsh (Chongming Island, China) and adjacent coastal water were characterized by f luorescence spectroscopy and nuclear magnetic resonance spectroscopy. The f luorescent components identif ied by parallel factor analysis indicated that humic-like substances dominated the chromophoric dissolved organic matter in the submarine groundwater. The chromophoric dissolved organic matter and dissolved organic matter in the submarine groundwater had non-conservative behaviors because of additions from terrestrial humic substances. The nuclear magnetic resonance spectra indicated that bioactive substances (carbohydrates) contributed only 13.2%-14.8% of the dissolved organic matter in the submarine groundwater but carboxyl-rich alicyclic molecules (CRAMs), the main components of RDOC,contributed 64.5% of the dissolved organic matter. Carbohydrates and CRAMs contributed 16.4% and 61.7%of the dissolved organic matter in the coastal water, similar to the contributions for submarine groundwater.The DOC concentration in submarine groundwater was 386±294 μmol/L, which was signif icantly higher than that in coastal water (91±19 μmol/L). The high DOC concentrations and >60% relative RDOC content suggested that submarine groundwater may be an important source of RDOC to coastal seawater. This information will be helpful for estimating the climate eff ects of salt marsh blue carbon.
Keyword: submarine groundwater; dissolved organic carbon; f luorescence; refractory dissolved organic carbon; salt marsh; Chongming Island
1 INTRODUCTION
Blue carbon ecosystems (mangroves, salt marshes,and seagrass beds) cover only 0.07%-0.22% of the surface of the Earth but contain >50% of the carbon stored in marine sediment because they have high carbon sequestration rates (McLeod et al., 2011;Zhang et al., 2015; Spivak et al., 2019). Some of the sequestered carbon can be transported from marine sediment as dissolved organic carbon (DOC) and used in adjacent coastal ecosystems (Bouillon et al.,2008; Heck et al., 2008). DOC participates in various biogeochemical processes (including providing energy for microbial growth, participating in trace element and nutrient circulation, and aff ecting water transparency and heat exchange (Yamashita and Jaff é,2008; Huang et al., 2017)) and plays an important role in regulating climate change by storing carbon as refractory DOC (RDOC) (Jiao et al., 2010).
Salt marshes are the most widely distributed blue carbon ecosystems. Carbon sequestered in salt marsh wetlands can be transported to coastal seawater through surface water export and subsurface water exchange (i.e., submarine groundwater discharge or porewater exchange) (Liu et al., 2021). It has been suggested that carbon transported through submarine groundwater discharge or pore water exchange is an important source of carbon to off shore water in some coastal ecosystems (Maher et al., 2013; Sadat-Noori et al., 2016; Chen et al., 2018, 2021). The various components of dissolved organic matter (DOM), e.g.,amino acids, carbohydrates, and carboxyl-rich alicyclic molecules (CRAMs), range from bioavailable components with very fast turnovers to long-lived components and play diff erent roles in carbon biogeochemistry (Bauer, 2002; Hansell,2013). Dissolved labile DOC (LDOC) transported in submarine groundwater can be utilized by dinof lagellates in the absence of inorganic nutrients to cause red tide outbreaks (Lee and Kim, 2007). In contrast, CRAMs have residence times of up to thousands of years and are regarded as eff ectively sequestered forms of carbon (Jiao et al., 2018).Studies focused on RDOC such as CRAMs or LDOC such as amino acids and carbohydrates in aquatic ecosystems have been performed (Hertkorn et al.,2006; Jiao et al., 2018), but the characteristics of RDOC and LDOC in submarine groundwater are not well understood due to its own complexity and analytical limitations, which limits our understanding of the carbon cycle in coastal areas.
The structures and sources of DOM in submarine groundwater are usually studied by acquiring UV-vis absorption spectra and three-dimensional excitationemission matrix (3-D EEM) spectra (Chen et al.,2010; Lu et al., 2020). For example, the f luorescence characteristics of shallow water on the Zhejiang coast,determined by UV-vis absorption and 3-D EEM spectroscopy, were found to indicate that submarine groundwater discharges were more likely than rivers to be the most important sources of chromophoric dissolved organic matter (CDOM) in the area (Gao et al., 2010). Chen et al. (2010) analyzed CDOM in groundwater from coastal marshes and wetlands in Florida by 3-D EEM spectroscopy and found that the CDOM was supplied from both the land and sea. In a study using 3-D EEM spectroscopy, the molecular weight and aromaticity of DOM in soil pore water was found to increase during transportation (Jiang et al., 2019). Nuclear magnetic resonance (NMR)spectroscopy can be used to determine the exact chemical structures of the major components of DOM and the contributions of diff erent components to the total DOM (Aluwihare and Repeta, 1999; Hertkorn et al., 2013). In particular, CRAMs (the main components of RDOC) can be quantif ied by high-resolution NMR spectroscopy (Hertkorn et al., 2006; Lechtenfeld et al., 2015).
In this study, the optical properties and molecular compositions of DOM in submarine groundwater from salt marshes on Chongming Island, China, and in coastal water nearby were determined by UV-vis absorption spectroscopy, f luorescence spectroscopy,and NMR spectroscopy. The main aim was to identify the CDOM and DOM components in submarine groundwater and surface water in the salt marsh wetlands. This information will improve our understanding of the biogeochemical cycling of DOM in coastal areas, particularly salt marsh blue carbon ecosystems.
2 MATERIAL AND METHOD
2.1 Study area
Chongming Island is the third largest island in China, which located in the meso-tidal Changjiang(Yangtze) River estuary. The Changjiang River estuary has multi-order bifurcations. The south branch of the Changjiang River, along the south coast of Chongming Island, is dominated by freshwater discharges. The north branch of the Changjiang River,along the north coast of Chongming Island, has saline water intrusions (Zhao et al., 2015). Total runoff in the Changjiang River estuary in December 2017 was 3.93×10⁸m3, which was 4.2% of total annual runoff .Average annual sediment discharge, measured at the Datong hydrological station (30°46′N, 117°37′E),between 2007 and 2017 was 1.27×10¹¹kg (Changjiang Water Resources Commission, 2018). The sediment discharged by the Changjiang River has allowed extensive areas of shoals and tidal f lats to develop.These have been colonized by various types of salt marsh vegetation. Chongming Dongtan National Nature Reserve, on the most eastern part of the Chongming Island shoreline, is the largest and most developed salt marsh wetland on Chongming Island,with a total area of ~4.69×10³hm2. The dominant native vegetation species in the Dongtan National Nature Reserve are herbs (Scirpusmariqueter) in the lower marshes and reeds (Phragmitesaustralis) in the higher marshes (Huang et al., 2007; Gu et al., 2018).
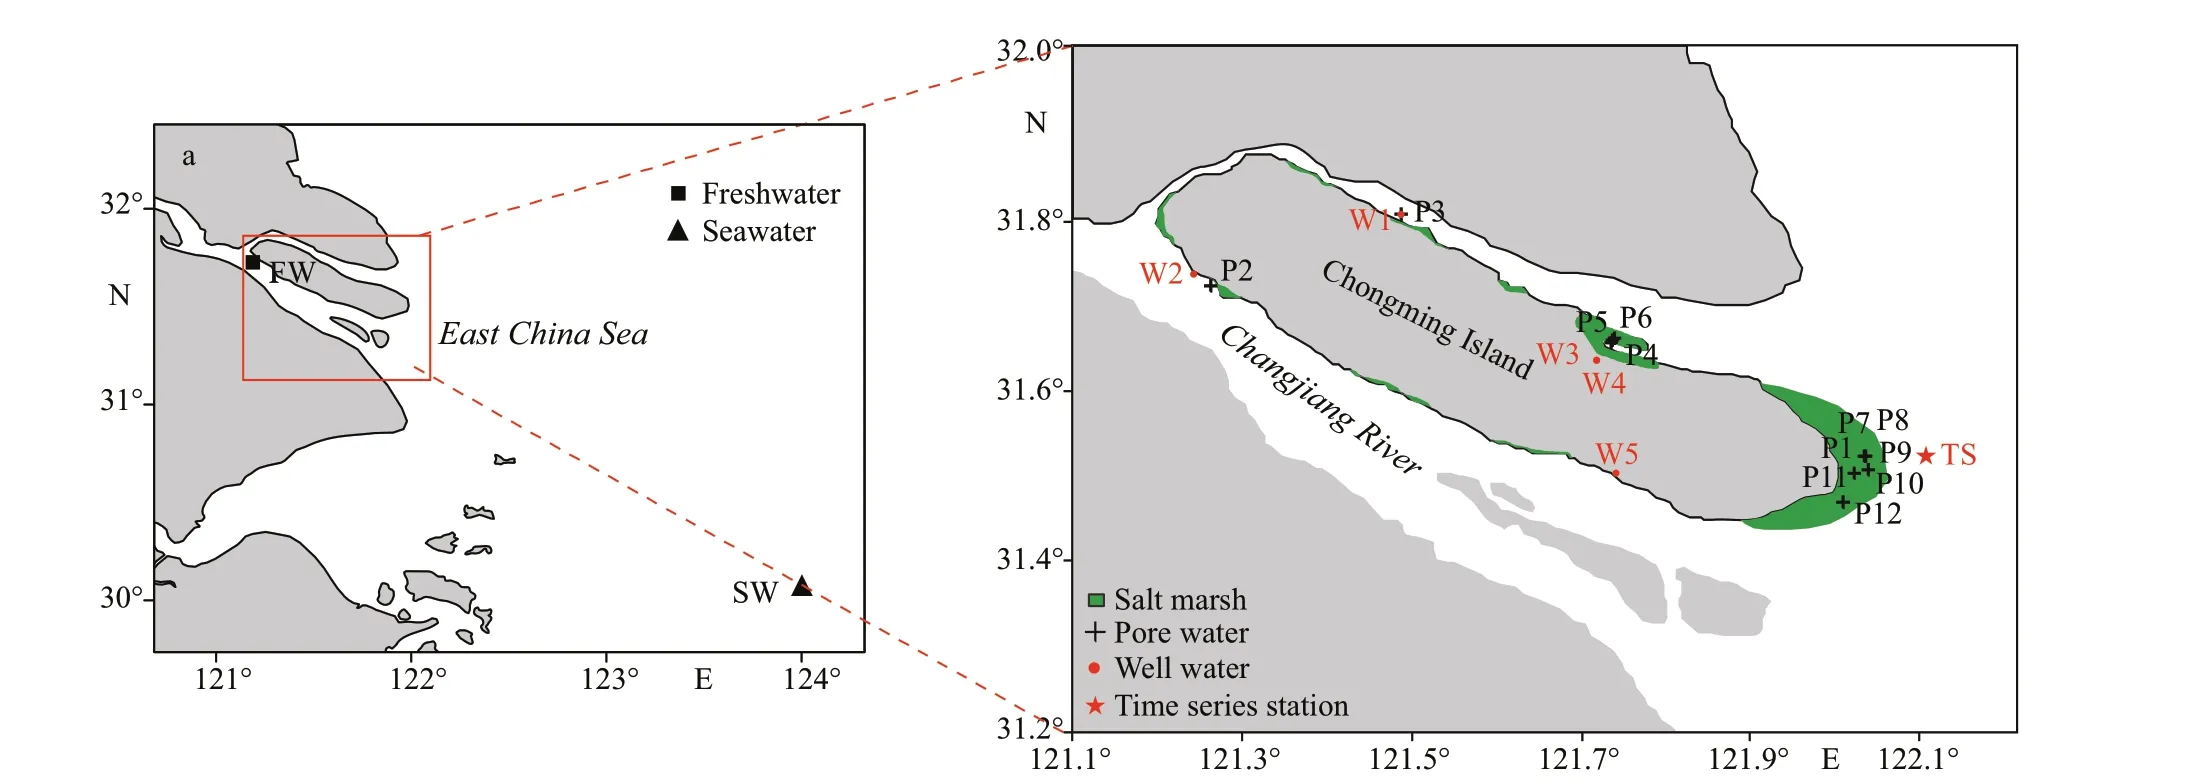
Fig.1 Sampling locations in the study area
2.2 Sampling
The samples were collected during December 2017.In total, 27 DOC samples (seventeen submarine groundwater samples, nine coastal surface water samples, and one seawater sample) and four DOM samples (two submarine groundwater samples, one coastal surface water sample, and one seawater sample)were collected (Fig.1). The seawater sample was collected in February 2017. The submarine groundwater(well water and pore water) samples were collected from coastal wells and salt marshes on Chongming Island. Each pore water sample was collected at low tide using a push-point piezometer and a peristaltic pump. Each well water sample was collected using an organic glass hydrophore (Chen et al., 2018). The coastal surface water samples were collected at threehour intervals over two tide cycles at the time series station (31°28′51″N, 122°3′58″E) using a submersible pump. Freshwater sample collected from near Xuliujing on the Changjiang River estuary (Gao, 2018) was used as the freshwater end member. Seawater sample from the East China Sea was used as the seawater end member. The dissolved oxygen (DO), pH, salinity, and temperature for each sample were determined simultaneously in situ using a multiparameter meter(Multi 3430 WTW, Germany).
Each DOC and CDOM sample was passed through a f ilter immediately after being collected, then the f iltrate was sealed in a pre-combusted (at 450 °C for 5 h) 20-mL glass vial and stored at -20 °C until analysis. Each DOM sample was passed through a f ilter into an acid-cleaned high-density polyethylene bottle and then adjusted to ~pH=2 by adding concentrated HCl (GC grade; Merck, Darmstadt,Germany). Solid-phase extraction (SPE) of DOM was performed following a standard protocol published by Dittmar et al. (2008). Brief ly, a SPE cartridge (PPL, 1 g; Agilent Technologies, Santa Clara, CA, USA) was rinsed with methanol (GC grade; Merck) and then Milli-Q water adjusted to pH=2. The sample was then passed through the SPE cartridge at a f low rate <40 mL/min by applying a vacuum produced using a vacuum pump. DOC concentrations are generally higher in submarine groundwater than surface water, so only 3-5 L of each submarine groundwater sample were extracted, to avoid overloading the SPE cartridge.
2.3 Analytical measurement
The DOC concentrations were determined by performing three-f ive analyses of the sample using a TOC-VCPH analyzer (Shimadzu, Kyoto, Japan) that performed high-temperature catalytic oxidation(Zhang et al., 2019). The coeffi cients of variance were mostly <2%. The absorption spectra of the CDOM samples were acquired using a Cary 100 UV-vis spectrometer (Agilent Technologies) using a wavelength range of 200-800 nm at 1-nm increments(using a 1-cm path-length quartz cuvette). The measurements were baseline-corrected using a spectrum for Milli-Q water. Absorbance at 254 nm was determined and normalized to the DOC concentration to give the SUVA254value, which was considered to indicate aromatic and high-molecular-weight CDOM components (Weishaar et al., 2003).Absorbance at 350 nm (a350) was determined and used to represent the abundance of CDOM, as was the case in previous studies (Helms et al., 2008; Gao et al.,2010; Zhou et al., 2013).

Table 1 Summary of the main f luorescent components identif ied using the parallel factor analysis model
Fluorescence EEM spectra were acquired using a Hitachi F-4500 spectrof luorometer (Hitachi High-Technologies, Tokyo, Japan) with a 1-cm quartz cell.The parameters used to acquire the CDOM f luorescence spectra have been published previously(McKnight et al., 2001; Guéguen et al., 2007). Brief ly,the excitation wavelength range was 220-450 nm at 5-nm intervals, and emission between 230 and 600 nm at 2-nm increments was recorded at a scanning speed of 12 000 nm/min. The excitation and emission bandwidths were both 5 nm. Milli-Q water, analyzed each day, was used as a blank, and the blank spectrum was subtracted from each sample spectrum to calibrate the Raman Eff ect. The f luorescent humif ication index(HIX), which indicates the degree of humif ication of DOM, was calculated by dividing the integrated f luorescence between 434 and 480 nm by the integrated f luorescence between 300 and 346 nm with excitation at 255 nm (Zsolnay et al., 1999). The f luorescent biological index (BIX) was def ined as the ratio between f luorescence at 380 and 430 nm with excitation at 310 nm (Huguet et al., 2009).
The NMR analyses were performed using a method described by Hertkorn et al. (2006) and Zhang (2014).The mean DOC recovery was 40%. Brief ly, 3-5 mg of a freeze-dried SPE-extracted DOM sample were dissolved in deuterated methanol and then analyzed using a Avance DRX 500 NMR spectrometer (Bruker,Billerica, MA, USA) equipped with a 5-mm broadband double-resonance probe at 298 K. A solution-state1H NMR spectrum was acquired by performing 3200 scans using an acquisition time of 3 s. The solvent signal was suppressed using the Bruker PRESAT system during the spectrum collection process. Mestrenova software was used to perform baseline correction and to integrate the spectrum.
2.4 Parallel factor analysis and NMR integration
Each EEM spectrum was modeled by performing parallel factor analysis (PARAFAC) using MATLAB 9.4 software and the DOMFluor toolbox (Stedmon and Bro, 2008), then the modeled components were matched in the OpenFluor database (Tucker congruence values > 0.95; Murphy et al., 2014). The maximum f luorescence of a component was used to represent the f luorescence intensity of the component(in the Raman Unit, RU). The “total f luorescent dissolved organic matter (FDOM)” (∑F) was def ined as the sum of all the PARAFAC components(∑F=∑1nCn). Four f luorescent components were obtained using the PARAFAC models, as shown in Table 1. The four f luorescent components could be divided into two categories, humic-like components(C1, C2, and C3) and a protein-like component (C4).C1 normally represents marine humic substances(Coble, 1996; Kulkarni et al., 2017). C2 is thought to represent allochthonous terrestrial-derived humic substances that are resistant to microbial degradation and optically active refractory DOM with turnover times between 400 and 600 a (Catalá et al., 2015; Li et al., 2015). C3 has been found to be ubiquitous terrestrial/autochthonous fulvic acid f luorophores(Stedmon and Markager, 2005; Yamashita et al.,2010). C4, which has previously been found in estuarine areas, represents freshly produced tryptophan-like DOM composed of lignin-derived phenols and proteins produced by algae or microorganisms in submarine groundwater (Kothawala et al., 2014; Gonçalves-Araujo et al., 2015).
The relative abundances of the four groups of DOM constituents determined from the one-dimensional1H NMR spectra were quantif ied by integrating and normalizing the peak areas (Hertkorn et al., 2006;Lechtenfeld et al., 2015). The residual methanol peakwas excluded during the integration process. All the hydrogen proton resonances came from four components, which were aromatic and alkenyl hydrogen atoms (10-5.3 ppm), carbohydrate hydrogen atoms (4.8-3.1 ppm), heteroatomic aliphatic hydrogen atoms (3.1-1.9 ppm), and aliphatic hydrogen atoms(1.9-0 ppm) (Hertkorn et al., 2006; Lechtenfeld et al.,2015). The CRAM concentration was determined by multiplying the CRAM (1.1-3.1 ppm) abundance by the DOC concentration (Lechtenfeld et al., 2015).
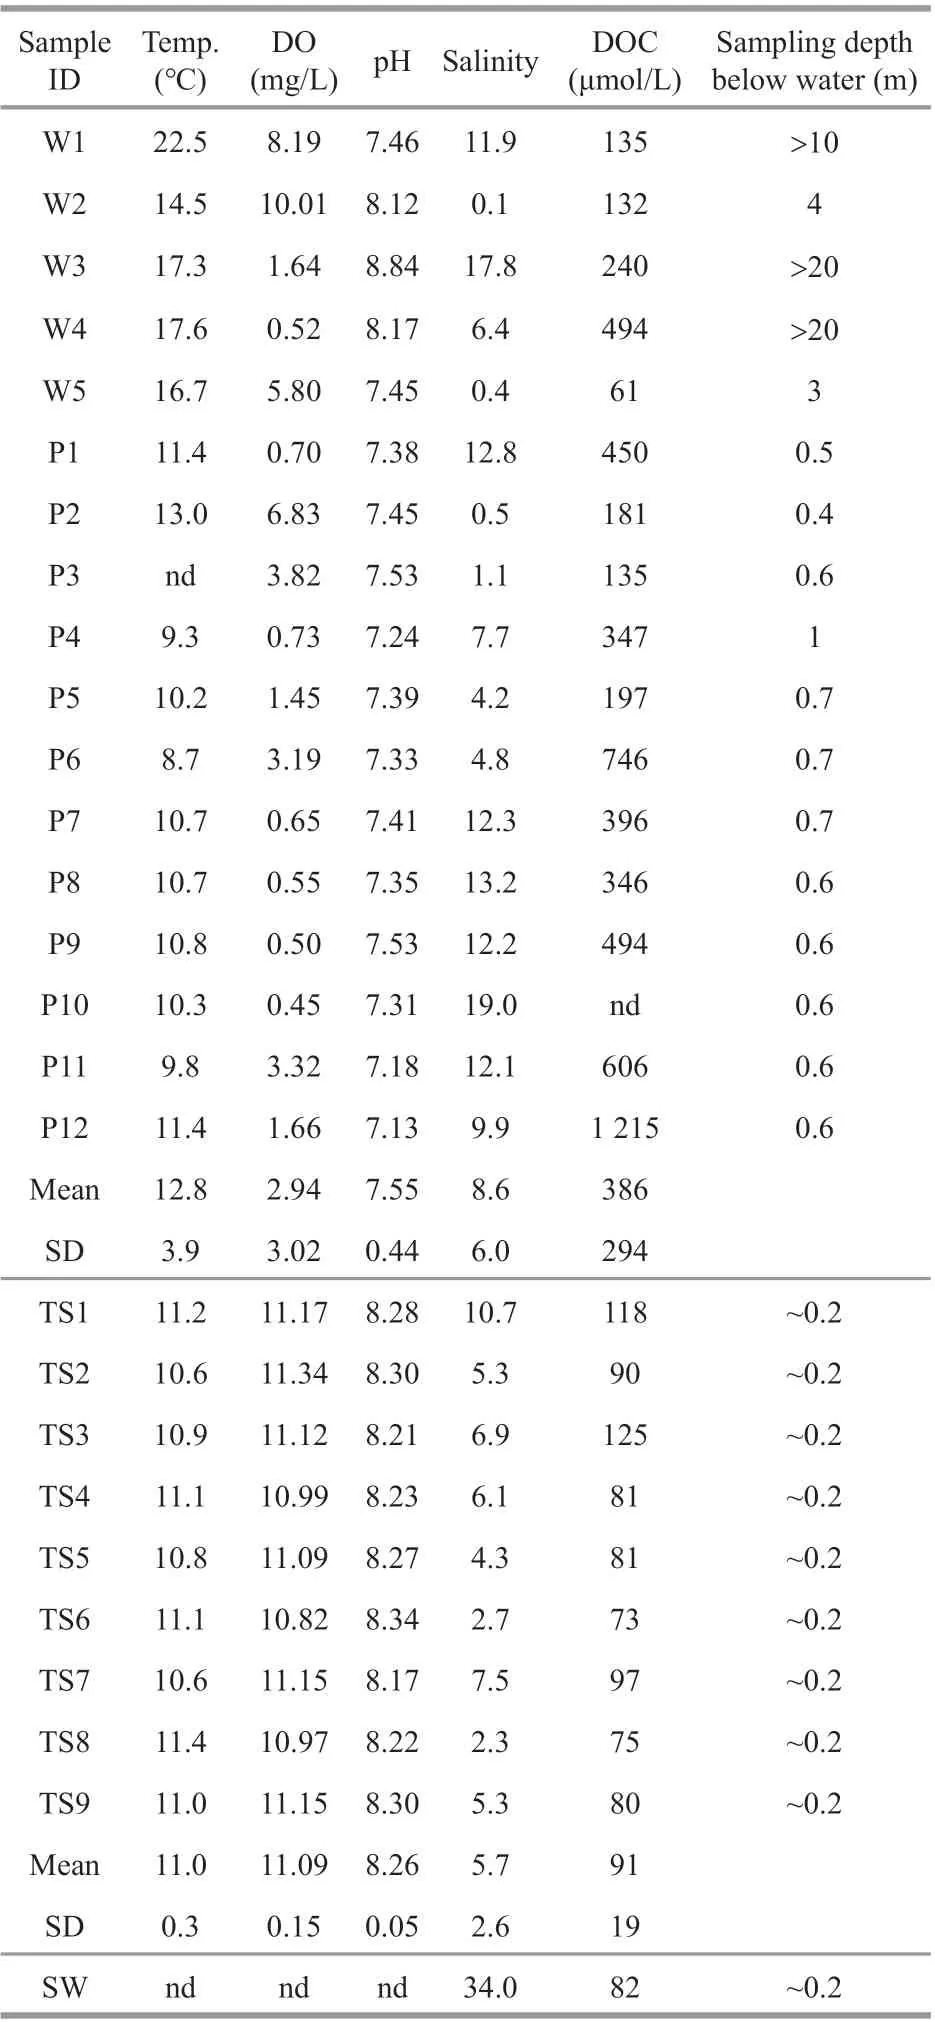
Table 2 Physical and chemical parameters for the waters at the sampling sites on and near Chongming Island

Fig.2 DOC concentration plotted against salinity
2.5 Statistical analysis
Statistical analyses were performed using SPSS 25 software (IBM, Armonk, NY, USA).P<0.05 was regarded as a statistically signif icant result.
3 RESULT AND DISCUSSION
3.1 Water chemistry and optical parameter
3.1.1 Water chemistry
The results of DO, pH, salinity, temperature, and DOC concentrations are shown in Table 2 and Fig.2.The salinities of the submarine groundwater samples from diff erent locations on Chongming Island were diff erent. The south coast of Chongming Island is dominated by freshwater discharges from the Changjiang River, but the north coast is aff ected by saline water. The DOC concentrations in the well water and pore water samples were 61-494 and 135-1 215 μmol/L, respectively. There were signif icant diff erences between the DOC concentrations in the submarine groundwater and coastal water(independent samplest- test,P< 0.05). The mean DOC concentration in the submarine groundwater samples(386 μmol/L) was higher than that in the coastal water samples (91 μmol/L) (Fig.2; Table 2). The DOC concentrations of submarine groundwater from Chongming Island were signif icantly higher(independent samplest-test,P< 0.05) than the concentrations of 24-47 μmol/L previously found in submarine groundwater from a sandy beach at Hwasun Bay (Kim et al., 2013) and were signif icantly lower (independent samplest-test,P< 0.001) than the concentrations of 790-1 910 μmol/L previously found in submarine groundwater from mangroves in the Maowei Sea in the dry season (Chen et al., 2018).
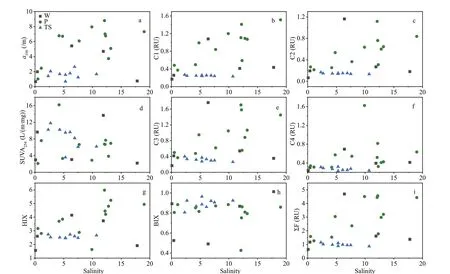
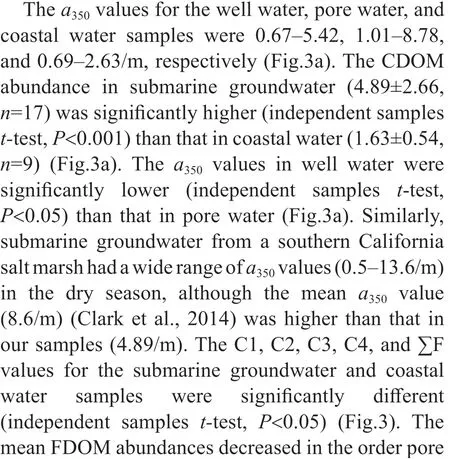
Fig.3 Chemical concentration and composition proxies against the salinity
3.1.2 UV-Vis absorbance and f luorescence
The SUVA254values for the samples are shown in Fig.3d. The SUVA254data indicated that most of the CDOM was highly aromatic ( > 5 L/(m·mg)). No signif icant diff erence was found between the SUVA254values for submarine groundwater and coastal water(independent samplest-test,P> 0.05). The SUVA254values for coastal water decreased as the salinity increased (R=-0.703,P< 0.05). However, no clear correlation was found between the SUVA254values for submarine groundwater and the salinity. This may have been related to the non-conservative behavior of DOC in subterranean estuaries (Chen et al., 2020). It has previously been found that the CDOM spectral properties deviated from the conservative mixing line in the saltwater freshwater mixing zone, indicating that diff erent types of CDOM are supplied by diff erent end members and that CDOM may be supplied through the release of organic matter by sediment or be produced in situ by microorganisms (Lu et al.,2015; Pain et al., 2019).
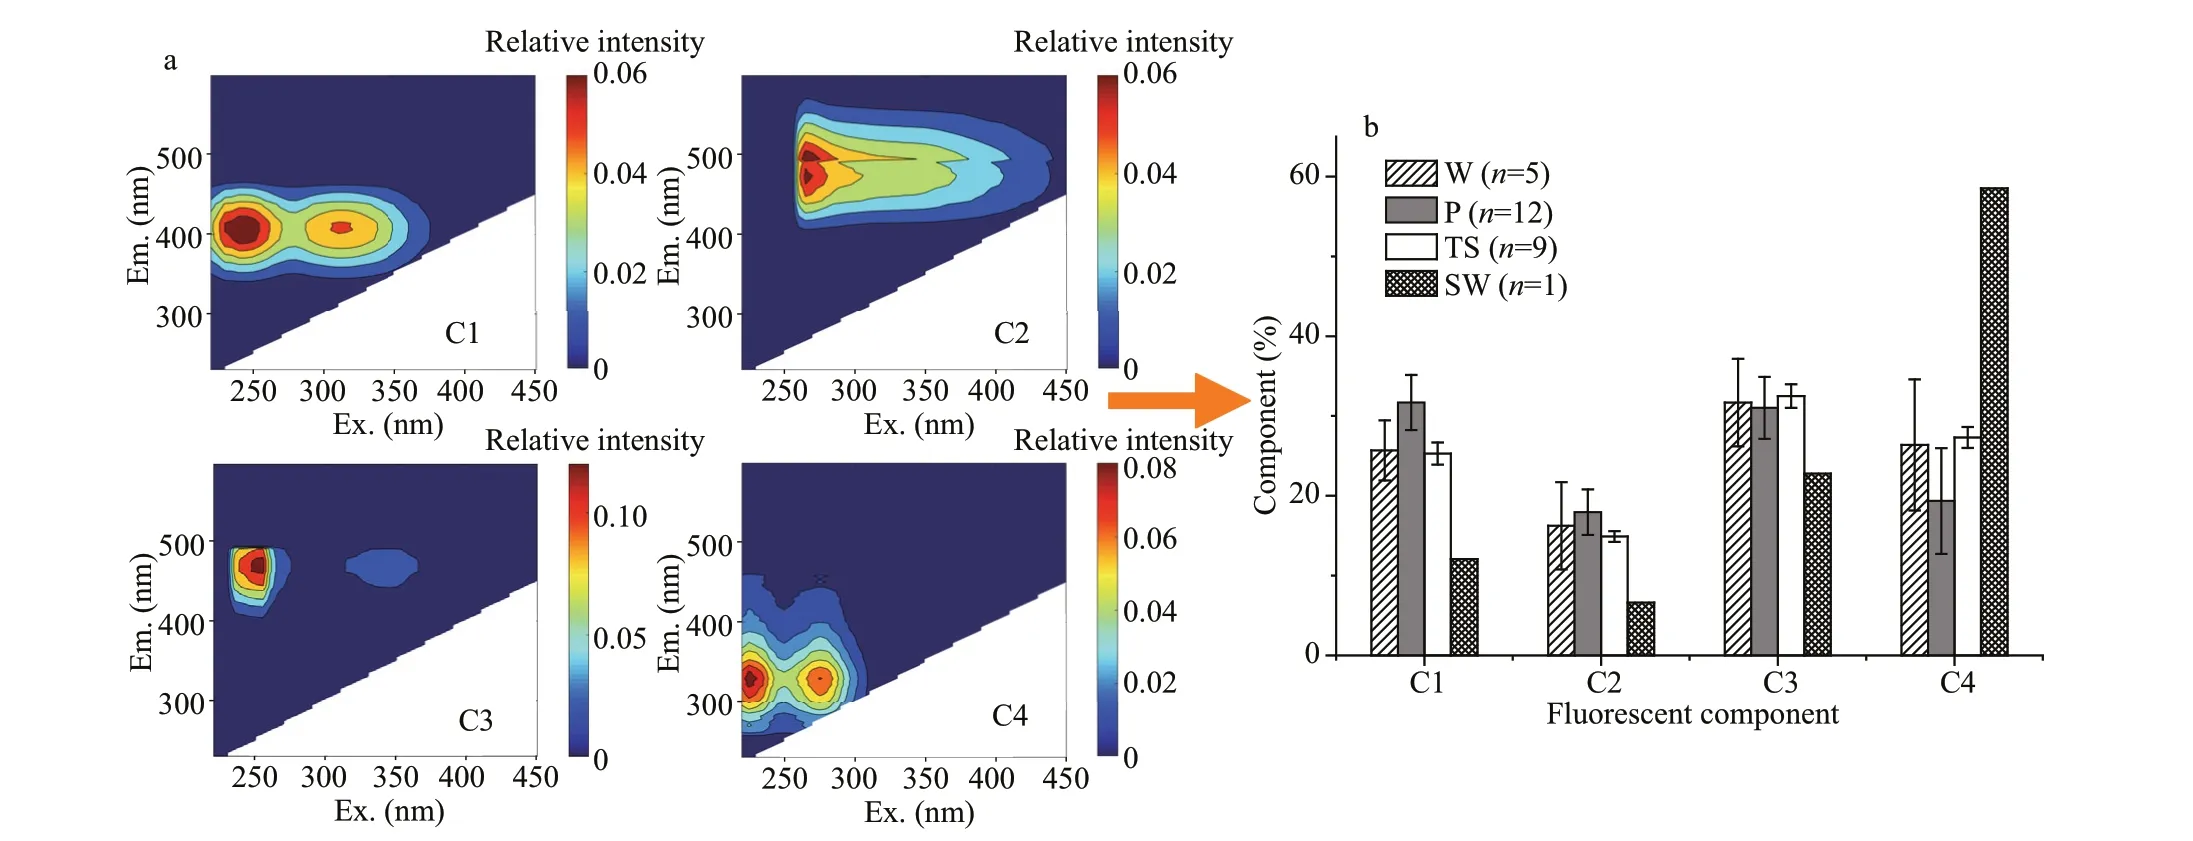
Fig.4 Excitation (Ex.)-emission (Em.) matrix contours for the four f luorescent components (a) and the contributions of the four components to the totals for diff erent samples (b)
The HIX and the BIX values are shown in Fig.3.The HIX value is generally used to indicate the degree of humif ication of CDOM (Zsolnay et al.,1999). A high HIX value ( > 10) indicates strong CDOM humif ication, and a low HIX value ( < 5)indicates autochthonous CDOM (Birdwell and Engel, 2010). It can be seen from Fig.3g that most of the HIX values for submarine groundwater and coastal water were <5, although the HIX values were signif icantly higher (independent samplest-test,P< 0.05) for submarine groundwater (3.62±1.28,n=17) than coastal water (2.58±0.11,n=9). This indicated that autochthonous CDOM was dominant in both submarine groundwater and coastal water.The BIX value is associated with microbially-derived and autochthonous CDOM (Hunt and Ohno, 2007;Wickland et al., 2007). A high BIX value (0.8-1.0)indicates predominantly autochthonous CDOM, and a low BIX value ( < 0.6) indicates little CDOM is produced (Huguet et al., 2009). The BIX values were high for both submarine groundwater (0.79±0.16)and coastal water (0.90±0.05), which agreed well with the HIX values. Degradation of plant detritus and microbial activities may have been the main sources of autogenous CDOM to submarine groundwater (Couturier et al., 2016). Autogenous CDOM may have been supplied to coastal water by algae (Suryaputra et al., 2015).
3.2 Molecular characterization of DOM
3.2.1 3-D EEM
The four f luorescent components and their relative contents are shown in Fig.4. The submarine groundwater CDOM showed strong humic-like f luorescence with high maximum f luorescence values for components C1 and C3, but the coastal water CDOM was dominated by components C3 and C4(Fig.4b). The contributions of humic-like substances(C1, C2, and C3) to total f luorescence for the submarine groundwater samples were 63%-88%(mean 79%,n=17), which were higher than those for coastal water (71%-75%, mean 71%,n=9). The contributions of terrestrial humic-like substances (C2 and C3) to total f luorescence for the submarine groundwater were ~50%, indicating strong supplies of terrestrial humic substances. The contribution of protein-like substances (C4) to total f luorescence for coastal water (27%) was a little higher than that for submarine groundwater (21%). The seawater CDOM was dominated by protein-like components (59%).The submarine groundwater CDOM was generally aff ected both by marine and terrestrial substances, but terrestrial humic substances were dominant. Our results are consistent with the results of a previous study of coastal marshes and wetlands in Florida, in which submarine groundwater CDOM was generally found to be dominated by terrestrial humic-like components (Chen et al., 2010). In other studies,submarine groundwater CDOM was found to be aff ected by marine and terrestrial substances (Seidel et al., 2014, 2015).
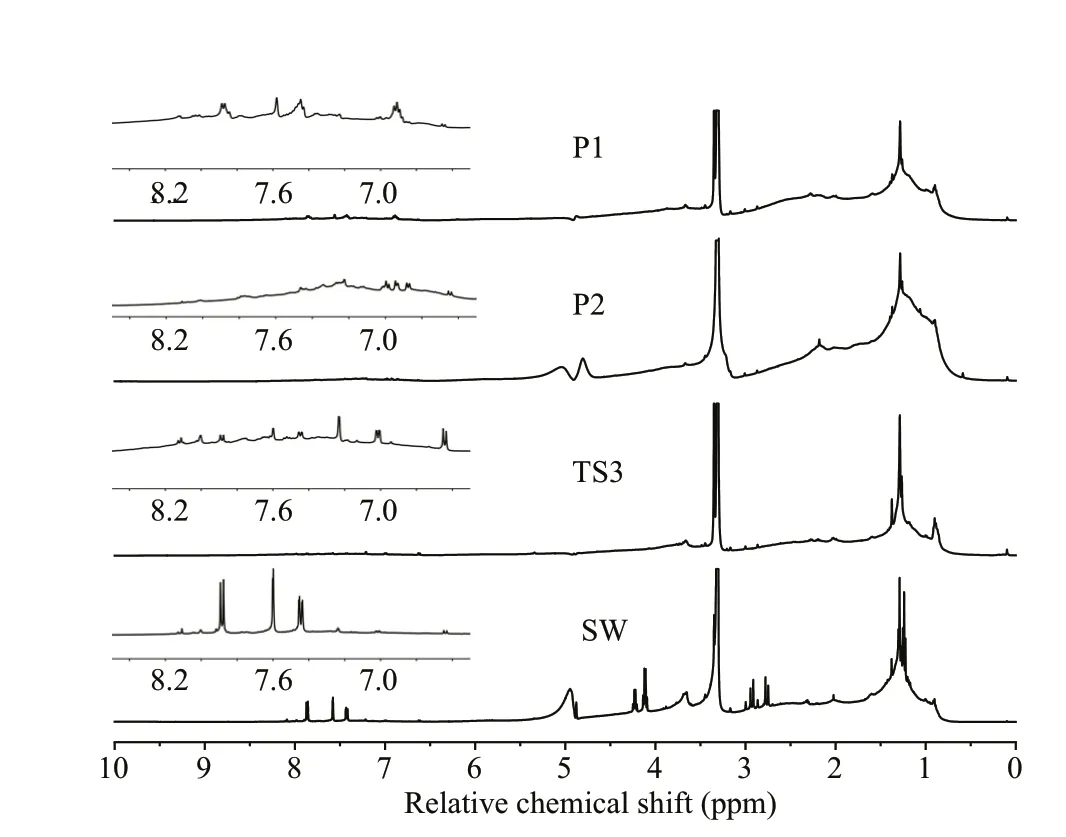
Fig.5 1 H nuclear magnetic resonance spectra for the dissolved organic matter samples
3.2.2 NMR study
The1H NMR spectra used to identify the chemical environments of the protons in the DOM are shown in Fig.5. Resonance at 3.31 ppm was for the solvent.There were four major functional forms of nonexchangeable hydrogen in all of the samples.Prominent resonances between 0.5 ppm and 1.9 ppm indicated hydrogen bound to saturated carbon with heteroatoms three or more bonds away. Resonance between 1.9 ppm and 3.1 ppm indicated heteroatoms two or more bonds away from protons. Resonances between 3.2 ppm and 5.0 ppm indicated hydrogen bound to carbon that was bound to oxygen. Weak resonances were found between 5.0 ppm and 10.0 ppm, suggesting the presence of olef inic and aromatic species (Hertkorn et al., 2006). The1H NMR spectra of the four DOM samples had similar main peaks. However, there were some subtle diff erences between the spectra for the diff erent DOM samples,particularly in the molecular signals in the unsaturated proton region (δH> 5 ppm). Particularly diff erent peaks were found between 6.5 ppm and 8.5 ppm (enlarged in Fig.5). The signals in this range included resonances of amino acid side chains and phenols (McCaul et al.,2011), which may have been substances forming part of f luorescent component C4 (proteins and ligninderived phenols).
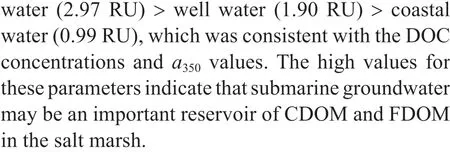
The relative abundances of the four DOM constituents are shown in Fig.6a. The aromatic and olef inic constituents contributed <8% of the total for all samples, which agreed well with the results of previous studies of samples from various aquatic environments (Hertkorn et al., 2006; Lechtenfeld et al., 2015; Wang et al., 2018). However, purely aliphatic substances contributed almost half or more than half (45%-60%) of the1H resonances for all samples, and functionalized aliphatic substances contributed about half as much (23%-30%).Carbohydrates contributed less for the pore water samples (13.2%-14.8%) and coastal water samples(16.4%) than for the seawater samples (22.1%) or seawater from the Atlantic Ocean (20%-23%)(Hertkorn et al., 2013), but the contributions of aliphatic substances decreased in the order pore water> coastal water > seawater. Seidel et al. (2014) found,using ultrahigh-resolution Fourier transform ion cyclotron resonance mass spectrometry, and the tidal f lats act as eff ective biof ilters of labile DOM and bioavailable compounds such as dissolved carbohydrates. The bioavailability of DOM in groundwater has been investigated using bioactive compounds (e.g., amino acids and carbohydrates) in several studies, and relatively low bioavailability has been found for DOM in groundwater (Routh et al.,2001; Chapelle et al., 2009; Peter et al., 2012). The relatively low quantities of dissolved carbohydrates in pore water from subterranean estuaries on Chongming Island indicated that the DOM was weakly bioactive. Small molecules of plant origin in DOM are preferentially consumed by microorganisms and converted into larger molecules of microbial origin in pore water (Roth et al., 2019). In the anoxic intertidal zone of a salt marsh, relatively low carbohydrate concentrations may partly be caused by intense microbial activity.
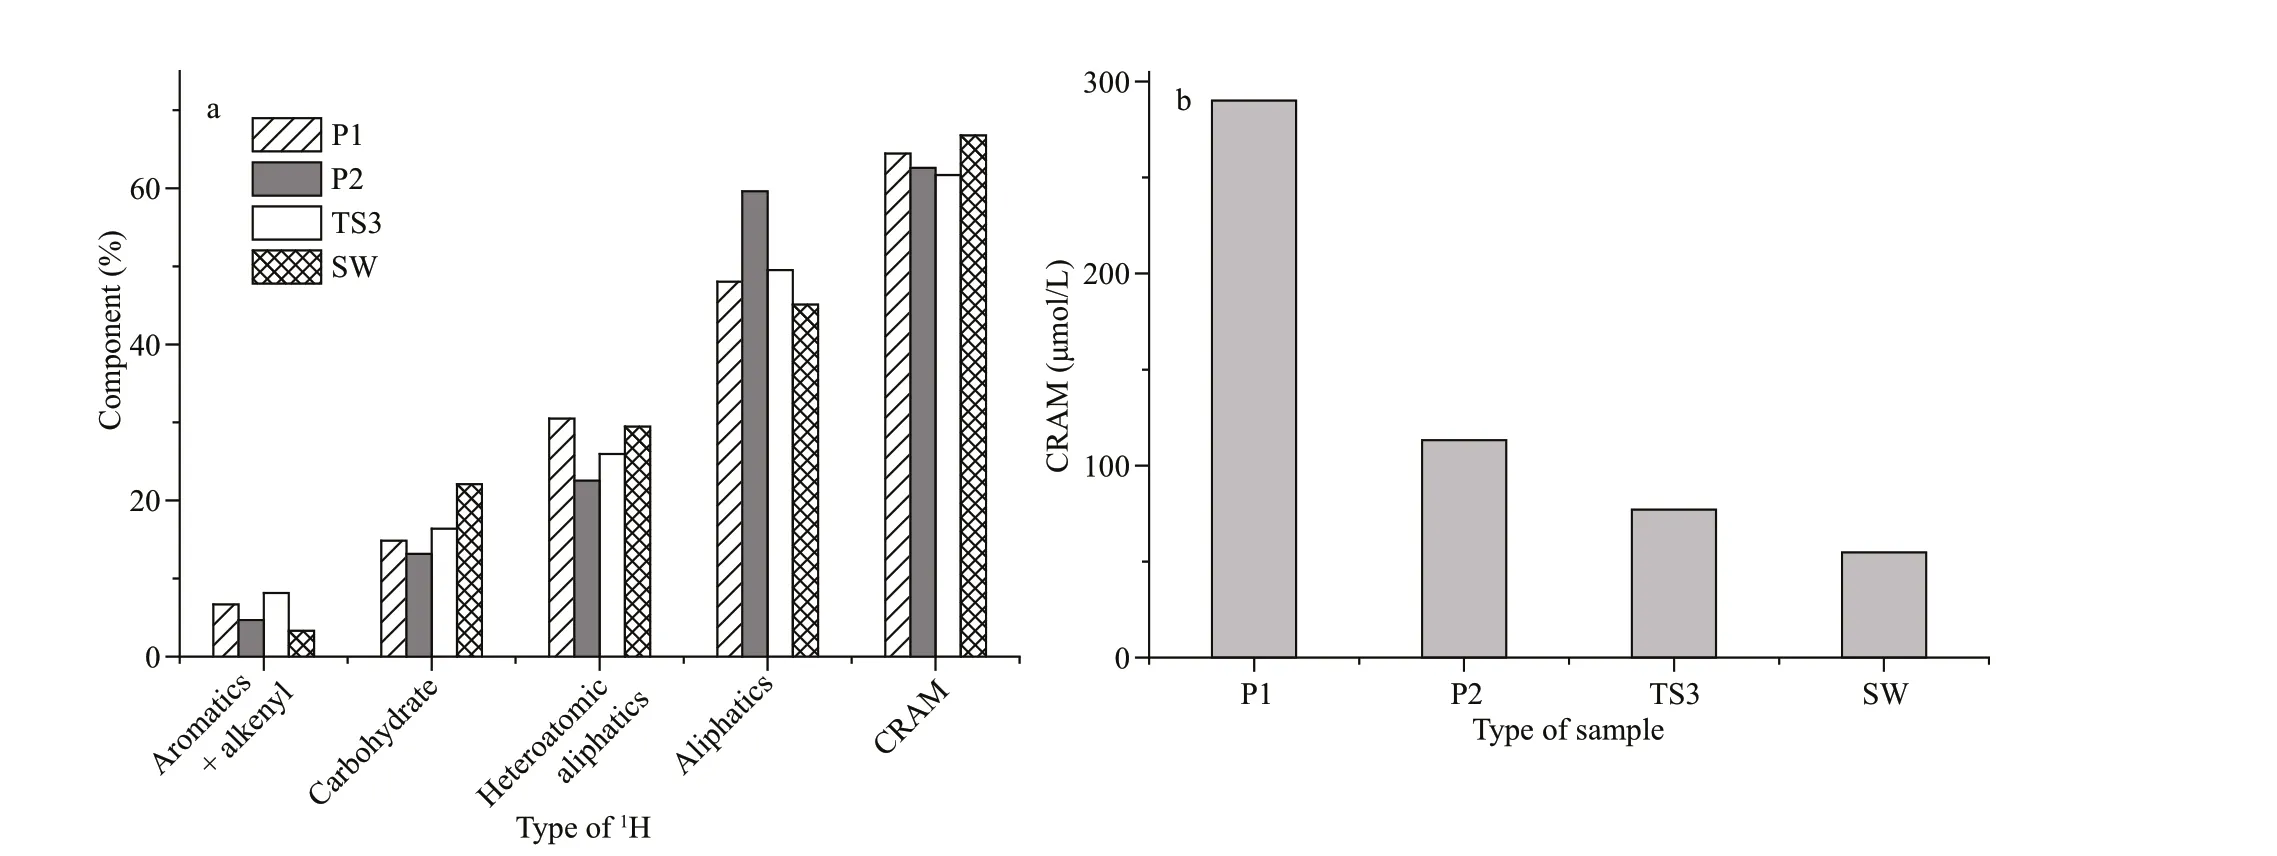
Fig.6 Contributions (%) of the major types of 1 H for the four types of sample (a) and CRAM concentrations in the four types of sample (b)
Species classed as CRAMs are potentially refractory compounds that have been identif ied in DOM from various aquatic environments by multidimensional NMR and ultrahigh-resolution mass spectrometry (Hertkorn et al., 2006; Lam et al.,2007; Lechtenfeld et al., 2015). Prominent amino acid(LDOC) peaks between 1.1 ppm and 3.1 ppm were not found (Fig.5), indicating that amino acids contributed little to the total integrals and signal overlaps (Lechtenfeld et al., 2015). Similar to the1H NMR spectrum of marine DOM, the smooth NMR resonance distribution and extensive signal overlap implies that DOM is dominated by refractory molecules (Hertkorn et al., 2013). It can be seen from Fig.6a that the CRAM contribution was >60% for all samples. The CRAM contributions for the diff erent samples were similar (64.5% for submarine groundwater, 61.7% for coastal water, and 66.8% for seawater), but the CRAM concentration was higher for submarine groundwater than coastal water and seawater (Fig.6b) because of the high DOC concentration in the submarine groundwater. The CRAM contributions for the submarine groundwater were higher than previously found for DOM from freshwater from Lake Ontario (62%) (Lam et al.,2007) and the Penobscot River at Eddington (55%)but lower than for DOM from the Pacif ic Ocean(89%) (Cao et al., 2018). CRAM is a refractory component of DOM that is found in all aquatic ecosystems (Hertkorn et al., 2006; Lam et al., 2007;Cao et al., 2018). The14C age and dominance of CRAM in DOM from the oceans indicated that terrestrial CRAM can be transported to the oceans and accumulate in the marine DOM pool (Cao et al.,2018). Estuaries and intertidal zones may be key to the transportation of terrestrial CRAM to the oceans.
3.3 Implications for coastal carbon processes and carbon sinks
Models of the mixing of freshwater end members and seawater end members have generally been used to study the behaviors of chemicals in estuarine and coastal environments (Santos et al., 2009; Gao et al.,2019; Reithmaier et al., 2021). We assumed that river water from near Xuliujing in the Changjiang River estuary could be used as the freshwater end member and seawater from the East China Sea could be used as the seawater end member in the mixing model. It can be seen from Fig.2 that DOC is supplied in relatively large amounts through subterranean estuaries at salt marshes on Chongming Island because almost all the well water and pore water results were higher than the conservative mixing line.Similar results were found for salt marshes in southern California, and soil pore water was found to be the main CDOM reservoir in the salt marsh (Clark et al.,2014). Submarine groundwater discharges generally transport high DOC concentrations into coastal seas from salt marsh ecosystems such as the Chongming Island subterranean estuary. However, contradictory results have been found in a small number of studies,such as in a study of subterranean estuaries on Jeju Island (a volcanic island), in which DOM and CDOM were found to behave conservatively, perhaps because the submarine groundwater discharge rates were high(14-82 cm/d) (Kim et al., 2013).
High DOC concentrations in submarine groundwater are generally supplied by DOC leaching from sediment (Komada et al., 2004), sewage penetration (Yang et al., 2015), production by benthic algae (Suryaputra et al., 2015), and microbial activity(Couturier et al., 2016) in salt marsh environments.High CDOM abundances in submarine groundwater,particularly of the humic fraction of CDOM and CRAMs in DOM, do aff ect the carbon cycle in coastal areas through subterranean estuarine processes(Coble, 2007; Sadat-Noori et al., 2016; Chen et al.,2018). The humic fraction of CDOM and CRAMs with long turnaround times are proxies for slow cycling and recalcitrant DOM (Cory and Kaplan,2012; Catalá et al., 2015). It would therefore be expected that DOM with a high CRAM content in submarine groundwater would make a strong contribution to the nearshore RDOC pool through submarine groundwater discharges and eventually accumulate in the ocean DOM pool (Fig.7).
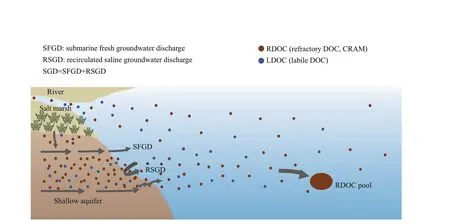
Fig.7 Schematic diagram showing the transportation of RDOC (CRAM) in submarine groundwater discharged through a subterranean estuary
4 CONCLUSION
In the salt marsh subterranean estuaries on the Chongming Island, DOM behaves non-conservatively and is supplied by terrestrial humic substances.Although the CDOM of submarine groundwater is aff ected by both marine and terrestrial substances, the main component is terrestrial humic substances.DOM samples from the submarine groundwater has low carbohydrate contents ( < 20%) and high CRAM contents ( > 60%). The high RDOC concentrations in submarine groundwater indicates that DOM derived from submarine groundwater discharge may make important contributions to the off shore refractory carbon pool. In diff erent seasons, DOM has diff erent properties. The SPE method leads to the relative content of molecules with low molecular weight being underestimated by NMR spectroscopy. Studies with larger time scales and using more advanced characterization techniques should be performed to further improve our understanding of DOM migration and transformation processes in subterranean estuaries.
5 DATA AVAILABILITY STATEMENT
The data that support the f indings of this study are available from the corresponding author upon reasonable request.
6 ACKNOWLEDGMENT
We thank Fule ZHANG and Xueqing YU from SKLEC/ECNU for their kind assistance in the f ield and laboratory. We also acknowledge the Editor-in-Chief Song SUN and two anonymous reviewers for their constructive comments that signif icantly improved the original manuscript.
 Journal of Oceanology and Limnology2022年1期
- Journal of Oceanology and Limnology的其它文章
- The adjoint-based Two Oceans One Sea State Estimate(TOOSSE)*
- Structure and formation of the South Yellow Sea water mass in the spring of 2007*
- Lagrangian eddies in the Northwestern Pacif ic Ocean*
- Seasonal variability in dissolved oxygen in the Bohai Sea,China*
- In-situ experiments reveal mineralization details of porphyry copper deposits
- Chemical composition and Pb(II) binding of dissolved organic matter in a hypersaline lake in China*
