A Security Enhancement Model Based on Switching Edge Strategy in Interdependent Heterogeneous Cyber-Physical Systems
Dandan Zhao,Can Liu,Guangquan Xu,Zhiguo Ding,Hao Peng,4,*,Juan Yu,Jianmin Han
1 Zhejiang Normal University,Jinhua 321004,China
2 Qingdao Huanghai University,Qingdao 266427,China
3 Tianjin University,Tianjin 300350,China
4 Key Laboratory of Intelligent Education Technology and Application of Zhejiang Province,Zhejiang Normal University,Jinhua 321004,China
Abstract: With the advent of cross-domain interconnection, large-scale sensor network systems such as smart grids, smart homes, and intelligent transportation have emerged.These complex network systems often have a CPS (Cyber-Physical System) architecture and are usually composed of multiple interdependent systems.Minimal faults between interdependent networks may cause serious cascading failures between the entire system.Therefore, in this paper,we will explore the robustness detection schemes for interdependent networks.Firstly, by calculating the largest giant connected component in the entire system, the security of interdependent network systems under different attack models is analyzed.Secondly,a comparative analysis of the cascade failure mechanism between interdependent networks under the edge enhancement strategy is carried out.Finally, the simulation results verify the impact of system reliability under different handover edge strategies and show how to choose a better handover strategy to enhance its robustness.The further research work in this paper can also help design how to reduce the interdependence between systems,thereby further optimizing the interdependent network system’s structure to provide practical support for reducing the cascading failures.In the later work,we hope to explore our proposed strategies in the network model of real-world or close to real networks.
Keywords: security enhancement; switching edge strategy; interdependent systems; cyber-physical systems
I.INTRODUCTION
In daily life,a large number of infrastructure systems are interdependent in other systems.These systems depend on other systems to apply oil,power,or complex communication.The power grid systems get coal resources, which are provided by several transportation systems.Transportation systems get the power that is provided by power grid systems.Communication systems control power grid systems.The communication systems get the power that is provided by the power grid systems.Each system needs other systems to supply resources(shown in figure 1).A single system that is not independent of other systems is becoming less and less in our society.Such interdependent systems, as mentioned above, are called Cyber-Physical System(CPS).The CPS is a system that integrates computing,communication,and related-control systems into a physical system[1–6].The power grid system is a typical CPS[7,8].
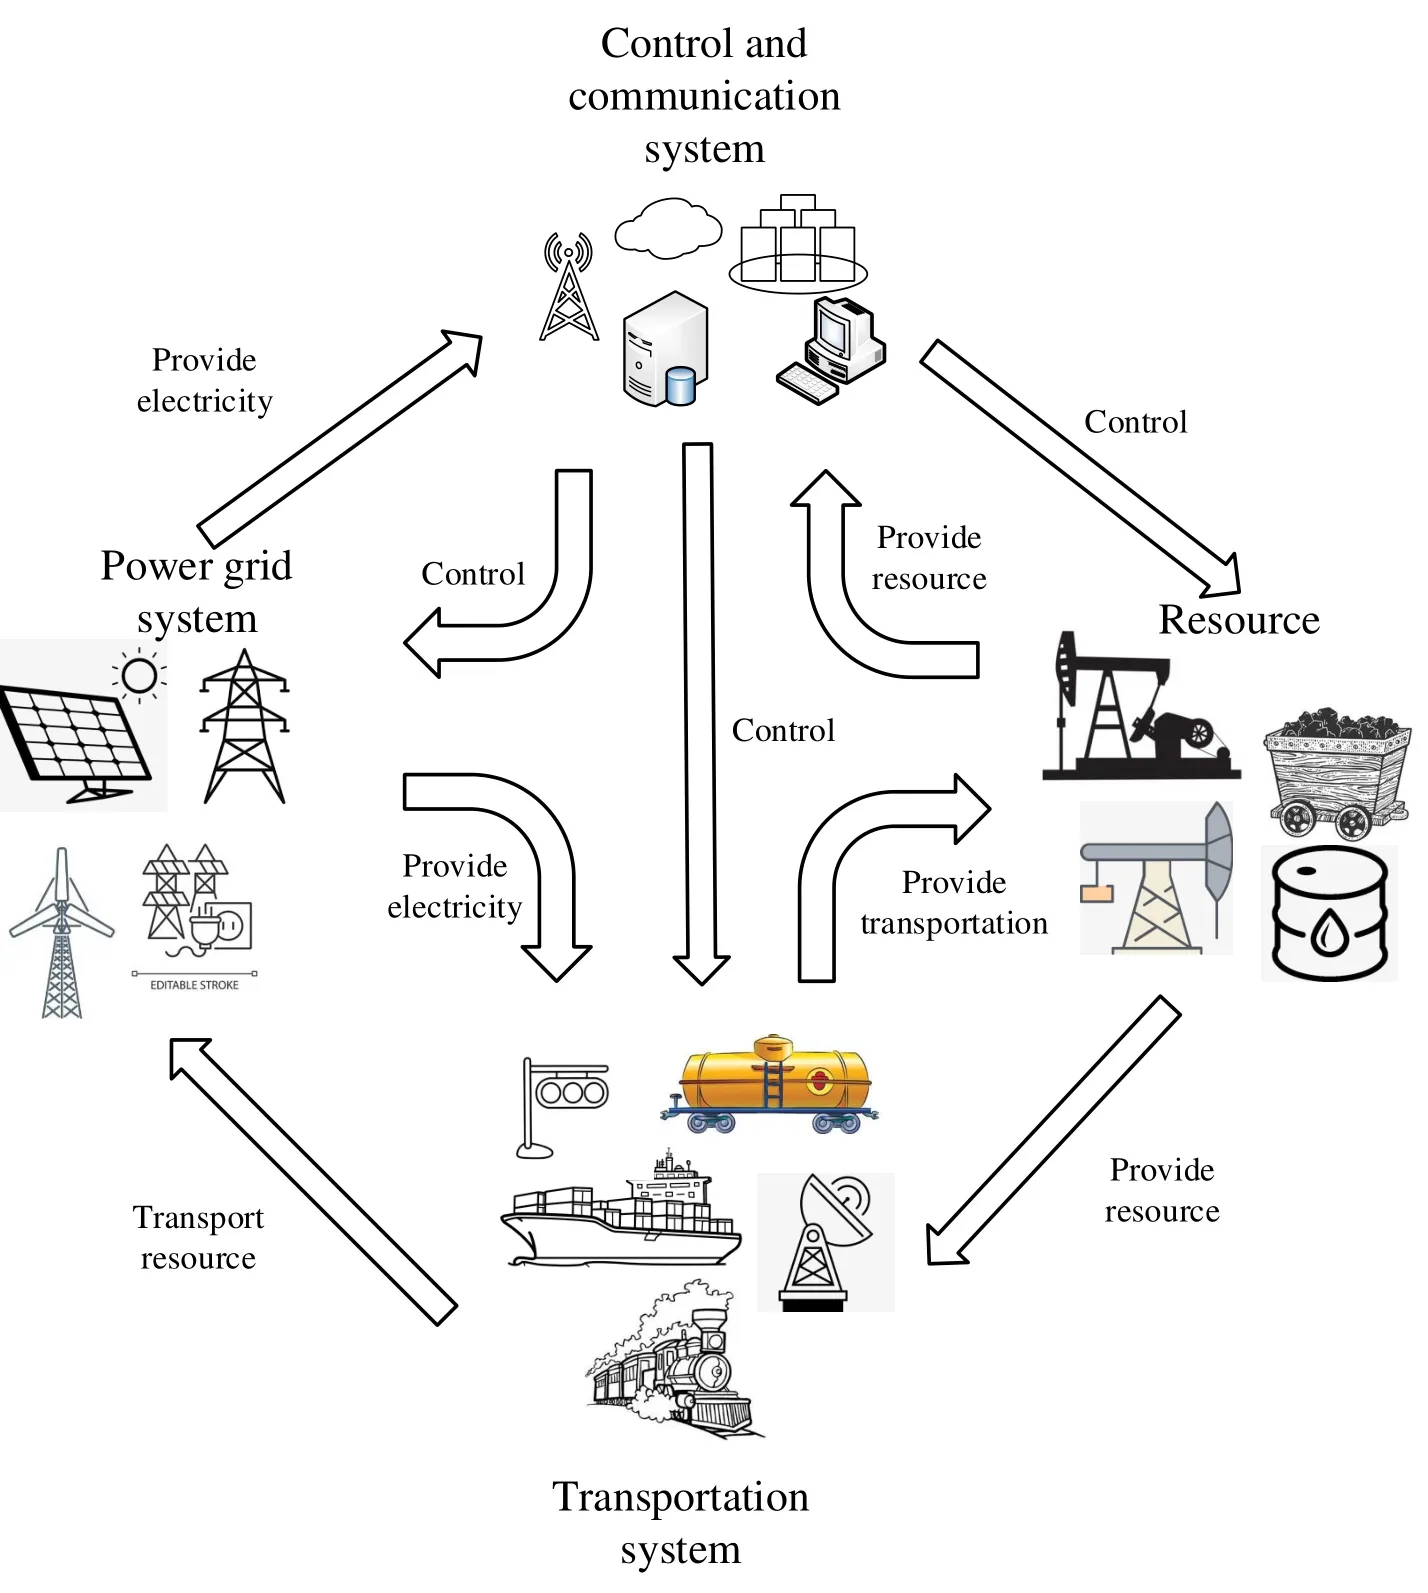
Figure 1. The scenario of large-scale interdependent networks via CPS architecture.
In the above CPSs,the failure of transportation systems will cause the failure of the interdependent power grid system,and the failure of the power grid will further aggravate the failure of transportation systems.The power grid system failure may result in the cascading failures of the communication system.This failure can propagate to more relevant systems.This phenomenon of failures propagating on different interdependent networks is called cascading failures[9–13].The specific cascading failure process will be given later.Small-scale failures in a single network may cause a large-scale cascading failure in the entire CPS.In the worst case, all networks in one CPS are completely collapsed[11,14–18].
On July 13, 2019, large-scale blackouts occurred in Midtown Manhattan and the Upper West Side of New York.Many important places, including Times Square, subway stations, and theaters in the heart of Manhattan,were affected[19].This large-scale power outage caused the collapse of transportation, finance,commerce,and other related systems.The final investigation result of the accident was due to a fire in the transformer.A fire in a small transformer caused such a large-scale power failure.This led to unpredictable economic losses.To reduce such incidents, we must pay attention to the impact of network cascading failure.Therefore, ensuring stability and preventing the large-scale failure of these infrastructures CPS is critical.Improving network reliability can maintain the entire society’s regular operation and reduce unnecessary economic losses and even human lives.In this way, reducing the impact of cascading failure is the direction that many scholars have been working hard on.The regular operation of these CPS guarantees our systematic work, study, and life.To improve the robustness of CPSs,researchers study in several research directions for decades.
In [11, 20], scholars have studied the interdependence between different systems and explored the characteristics of cascading failure propagation in one CPS.Through the mathematical formula’s derivation,each stage of the cascading failure’s mathematical expression is obtained.They first propose metrics to measure one interdependent network’s reliability,and these metrics are widely used in today’s research.
Shao et al.[21] suggest deploying autonomous nodes in the interdependent network to improve the CPS’s robustness.The paper [22, 23] study how to determine the critical nodes in one CPS.It is possible to enhance the robustness of the network by protecting the critical nodes.Scholars add links in the interdependent network to improve the robustness of the CPS [24].In [16], scholars adjust existing interlinks distribution to improve the reliability of interdependent networks.
Scholars implement machine learning results to research the robustness of one CPS in paper [25]and [26].In paper [1, 27, 28], solving fundamental research problems in the CPS by reinforcement learning is efficient.
1.1 Our Contribution
This paper abstracts different CPS devices as indifferent nodes and abstracts the relationship between devices as undirected and unweighted links.We enhance the reliability of one CPS by changing the connection relationship of inter-links.
The main contributions are as follows:
i).We propose further swapping strategies in more representative CPS models.
ii).Through a large number of simulations,we conclude universal reliability enhancement strategies in one certain CPS model.
iii).The newly proposed strategies could wait for better models’reliability.
1.2 Organization
In section II, we introduce the related work.Then,we give the interdependent models and mathematical formulas of cascading failures in section III.In section IV,we provide a detailed description of our swapping strategies.The following section shows the findings of the above simulations.Section VI is the conclusions and future work.
II.LITERATURE REVIEW
With extensive CPS applications in everyday life,scholars make in-depth and extensive research on CPSs.We describe a single complex network as a starting point,followed by introducing an interdependent network and cascading failures in this section.
2.1 Complex Network
All individuals or devices in the CPS are abstracted into nodes, and the relationships between devices are abstracted into undirected and unweighted links.The entire CPS is constructed as a graph.Scholars have found that these graphs have some commonalities through the abstraction of many actual relationships.Therefore,they offer a variety of network models.
Erd¨os-R´enyi network(ER network)was proposed in 1959[18,29].The probability of each node connecting to the rest of the nodes is equal.Thus, ER network degree distribution follows the binomial distribution[29,11].
Scale-free network(SF network) is a skew distribution network[30].The SF network’s degree distribution obeys the power-law distribution which the formula isP(k)∝k−γ.In this formula, the notationP(k) means nodes’ degree distribution andγmeans the power-law exponent[29,11].
2.2 Interdependent Network
In [11], the interdependent network has been systematically and wholly described.Two complex networks construct an interdependent network.The links in a single complex network are called intra-links,and links between two complex networks are interlinks[31,15].
Based on the inter-links connection,the interdependent network models divide into three kinds of models: ‘one-to-one correspondence’, ‘one-to-multiple correspondence’and‘multiple-to-multiple correspondence’ [11, 8, 32, 7].The ‘one-to-one correspondence’ model is the simplest model, and it exists in a minimum area in the real-world.The ‘multiple-tomultiple’is too complicated to simulate,and there are even some unsolved problems [15].At last, ‘one-tomultiple’exists widely in real-world,such as wireless networks[33]and the power grid[7,34].
2.3 Cascading Failures
The cascading failures refer to the small number of nodes failure under a single network leads to the inability of the entire interdependent network nodes[11,15].This is a common and highly influential phenomenon in interdependent networks.
Buldyrev et al.have studied the cascading failures under ‘one-to-one correspondence’ models [11].They gave network status when the cascading failure stopped spreading and the nodes’ normal operating conditions in interdependent networks.When cascading failures stop, these coupled networks must be one of the following two conditions: I.the entire interdependent network is completely collapsed,and no nodes remain;II.cascading failure is no longer propagated,and there are still nodes that can work typically.If one node could operate normally, it must obey the following conditions: I.it has at least one inter-links;II.it just in the giant component.
In figure 2,we give cascading failure processes in an interdependent network.11 and 5 nodes in the original interdependent networks belong to networkAandB.When cascading failures stop, only three nodes and three nodes are these interdependent networks.
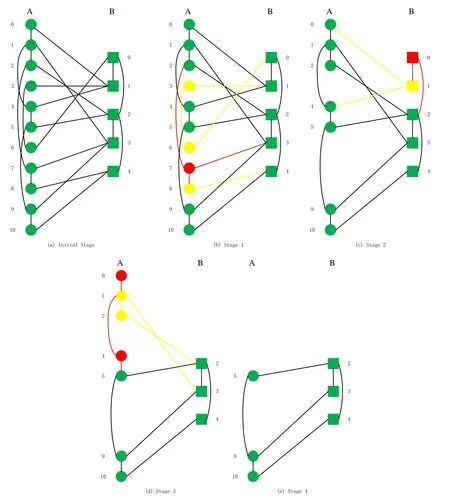
Figure 2. Cascading failures’processes of an interdependent network model.
III.MODEL AND THEORETICAL FORMULAS
Section III can be divided into two parts.One subsection is the description of the interdependent models,which we apply in the following simulations.The next is the formulas for cascading in a‘one-to-one correspondence’ model.Then we deduce the cascading failure principle formulas that fit the’one-to-multiple correspondence’model we built.
3.1 CPS Model
The power grid is a typical cyber-physical system.The CPS can be abstracted into a graph of several networks coupled together.We always feel the interdependent network comprises two networks connected to merely this abstracted graph.This assumption perfects the performance characteristics of an interdependence network while also simplifying the complexity of the experiment[11,15,16,29,35].
In the single network selection of constructing CPS models,we take the ER network and SF network as a single network.These two networks have been extensively explored and used in studies of the interdependent network[11,15,16,29].
Based on the intelligent power grid system’s supply and control situation, we find that a grid station supplies energy support to multiple types of equipment,such as computers,radar,high-speed rail,and so on.In contrast, one power grid station is only controlled by one control equipment,for instance,a computer.The‘one-to-multiple’ model must be an excellent choice to model power grid systems to match the above relationship.
As described in the power grid dependence relationship,we know that the‘one-to-multiple’model is mutual dependence rather than one-to-one, explored in the ‘one-to-one correspondence’ model [11].To examine this model’s reliability in detail and without losing its generality,we set this multiple dependency ratio to a fixed value as 3:1.If the coupling ratio becomes larger,the complexity of the experiment increases exponentially.
3.2 Mathematical Formulas
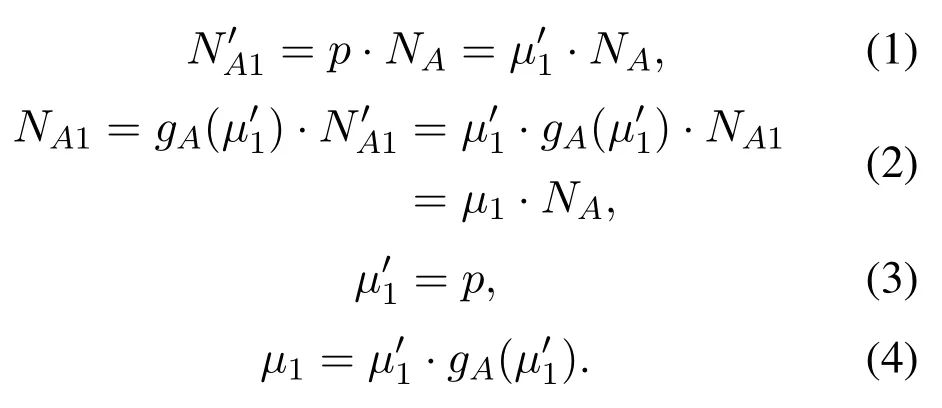
In [11, 36], scholars have derived cascading failures’ mathematical formulas for each stage in ‘oneto-one’ interdependent networks.The interdependent networks are namedAandBto clear cascading failures in interdependent networks.In table 1,we give the meaning of key notations in our formulas.When nodes lose their inter-links, they will be removed.Then, the fraction of the remaining nodes isHowever,these nodes will be failed because they are not in the component and will be removed.The remaining nodes in the network are the normal working nodes.Thus, the fraction of the normal working nodes isNAi(NBi).To be consistent with a large number of existing studies, random attack has happened in the networkAat first.The number of(1−p)NAnodes regards as failed nodes under the attacking.These failed nodes are deleted from interdependent networks.Based on ‘one-to-one correspondence’ cascading failures’ formulas, we can get formulas in the‘one-to-multiple correspondence’with the correspondence ratio at 3:1.Depending on the above setting,the first stage networkAnodes number is:
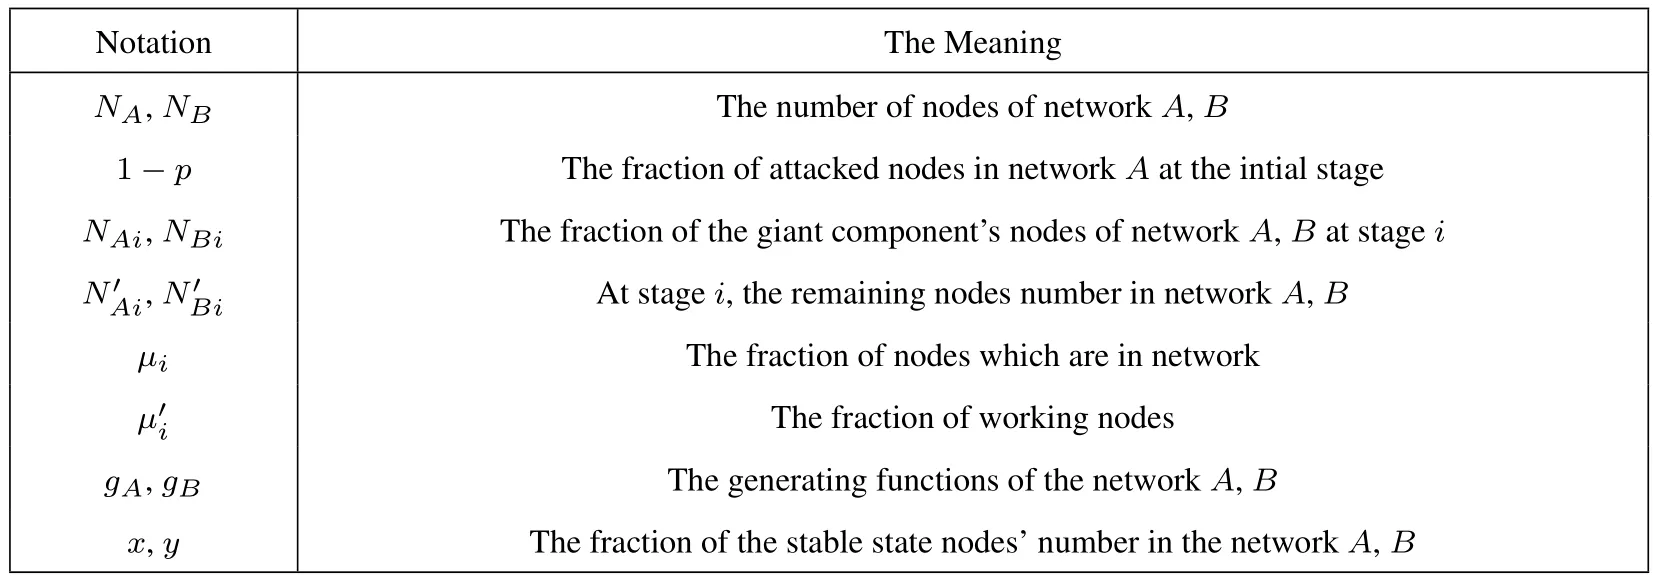
Table 1. The notations in the mathematical formulas.
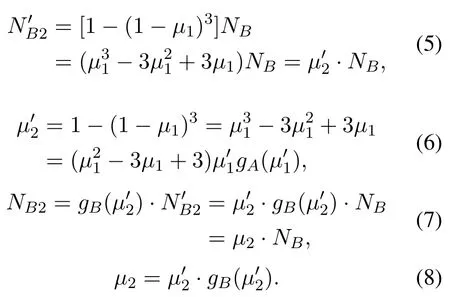
The second stage of the cascading failure occurs in the networkB.Under the two principles that must be met at the same time for the normal working of nodes,the number of nodes in networkBis changed into:
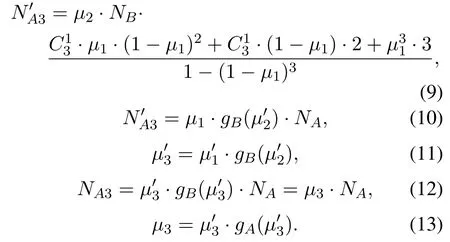
Then,the failed nodes in networkBwill make networkAnodes failed.The number of nodes in the networkAis:
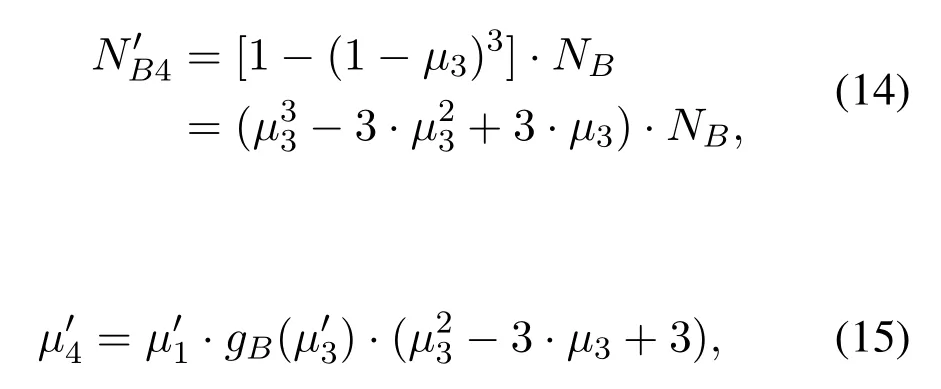
The nodes in networkBwill fail due to the failed nodes in the networkA.The nodes number in networkBwill deduce to:

When the cascading failure stops within an interdependent network, the networkAandBnodes’ numbers will not change anymore.The entire CPS will be in one kind of state condition which we have mentioned in section II.At the final stage,the nodes number in the networkAandBwill satisfy the following formulas:

From the laws shown in formulas(3)and(6),we can deduce the nodes fraction of different stages(shown in table 2).Then,the nodes’fraction in the final stageandare:
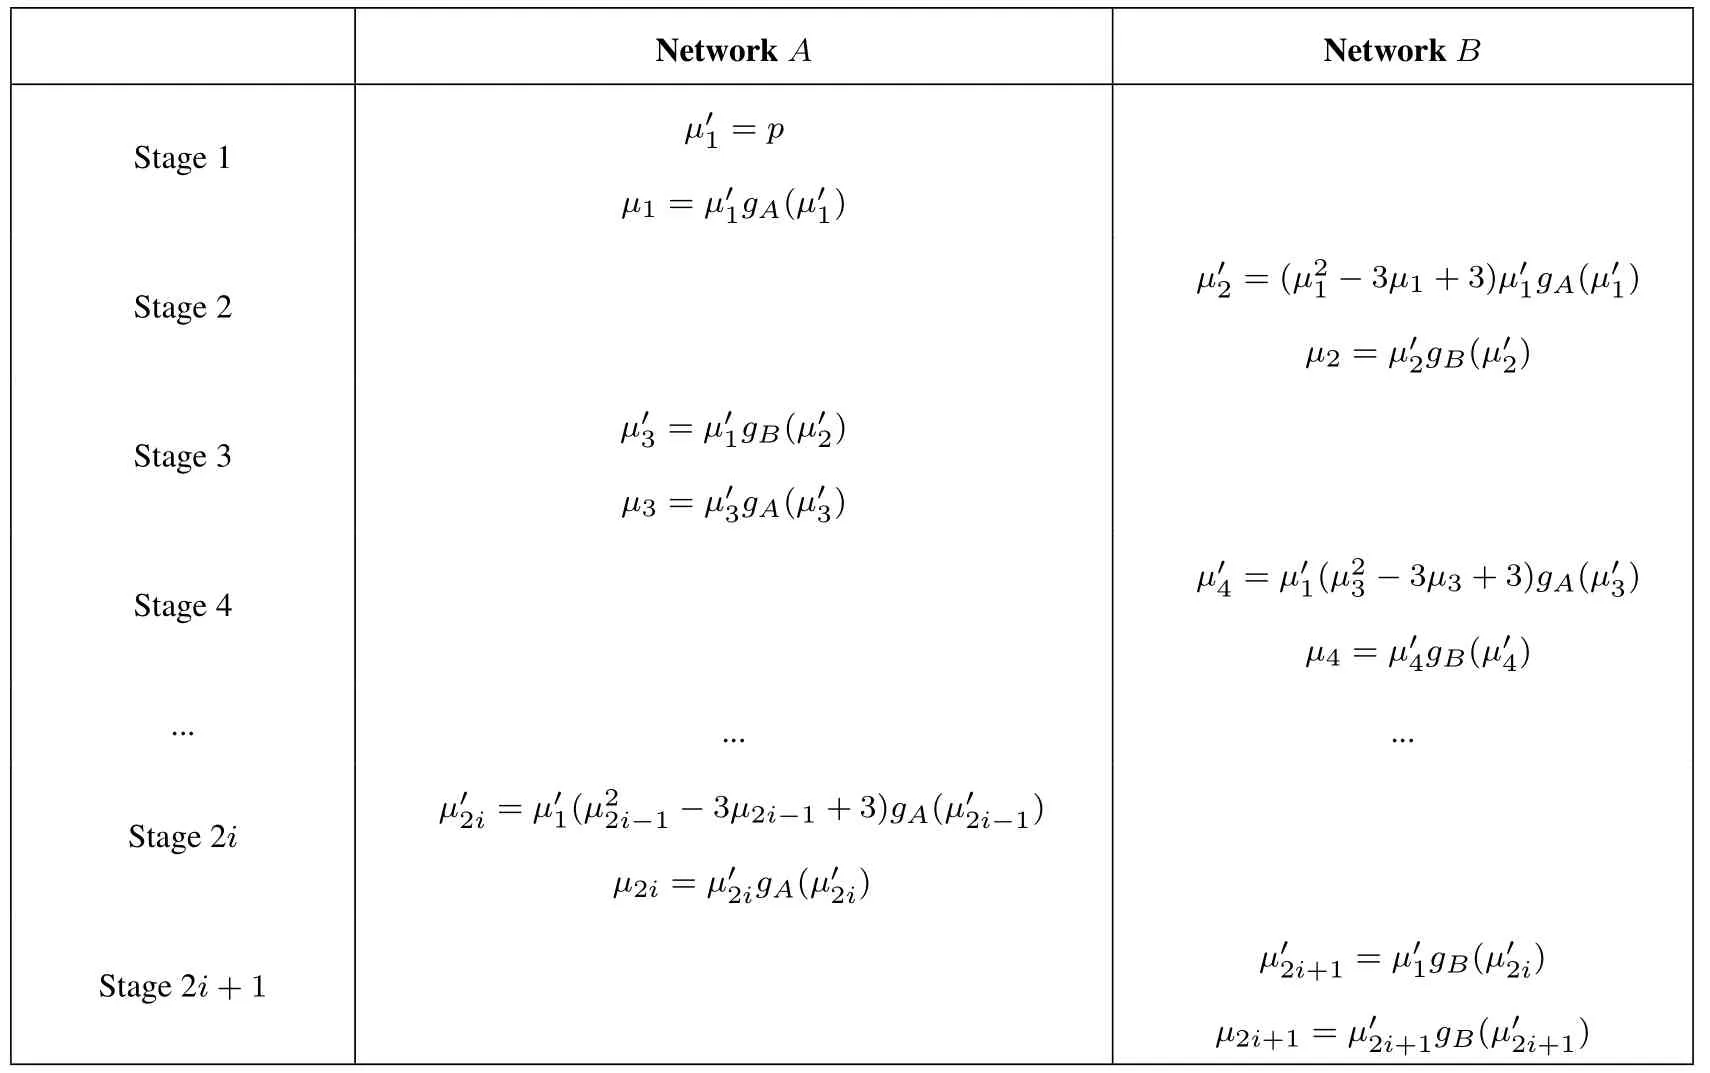
Table 2. The fraction of nodes in the network A and B.

From Eq(19),xis:

IV.METHODS
In [16, 37], we have known that the interdependent network will get better reliability when nodes’ high centrality values connect with the inter-links.Based on this conclusion, we propose three new approaches to improve the CPS’s reliability in this paper.There are two approaches (high betweenness strategy and high eigenvector centrality strategy)that have been applied to the model, and it has been proved that these two approaches have the best influences under different interdependent network structures.Section IV,we briefly introduce these two approaches used in the CPS, and the other three new strategies will be described in detail.
·Strategy 1: High betweenness swapping strategy(HB)
Betweenness centrality determines the importance of the network’s nodes by the shortest paths [38, 39,35].If one node sites on many other nodes’ shortestpaths, it will seem an important node.The betweenness centrality value of the node is:

In this equation,theσijmeans the number of the shortest paths from the nodeito the nodej.The symbolσij(v)means the number of the shortest paths from the nodeito the nodejthrough nodev[29].
HB is swapping an inter-link within nodes with the most significant betweenness values of these two networks.There is perhaps one link of the largest betweenness values node in the networkAbefore this swapping process.However, this inter-link is not linked with the most prominent betweenness values nodes of these two networks.To complete the swapping process, we delete the inter-link with the largest betweenness values node in the networkAfirst.Then,we add one inter-link between nodes, which are the most significant betweenness values of the networkAandB.After this swapping process,one node has four inter-links,and one node has two inter-links.Then,we randomly choose one inter-link from the node,which has four inter-links to delete.Finally,we add one interlinks between two nodes: one has no inter-link, and the other has only two inter-links from networkAandB.The above method will repeat a specific number.These swapping processes will not change the interlinks’number and the coupled relationships ratio.
To give clear swapping inter-links processes, we show the swapping processes in a part of the CPS in figure 3.We assume the nodeA3andB0are the largest betweenness values node in the networkAandB,respectively.As the determination of the HB strategy,there must be one inter-link betweenA3andB0.In the original network,A3has one inter-link withB1.At first,we delete this inter-link.We randomly choose the inter-link between the nodeB0and nodeA2to delete(shown in figure 3 green dotted lines).Finally,we replace the inter-links between nodeA3andB1and nodeA2andB0(shown in figure 3 blue lines).After the above swapping, the inter-links’ number and the coupled relationships ratio are not changed.
·Strategy 2: High eigenvector centrality swapping strategy(HEC)
Each node has at least one neighbor in the entire interdependent network.Eigenvector centrality measures nodes’ importance by considering the importance of this node’s neighbors[40,29,41].This definition is widely used in the real world.The exurbs of the big cities have a relatively important position.The eigenvector centrality is a metric that is considered all network nodes’importance.
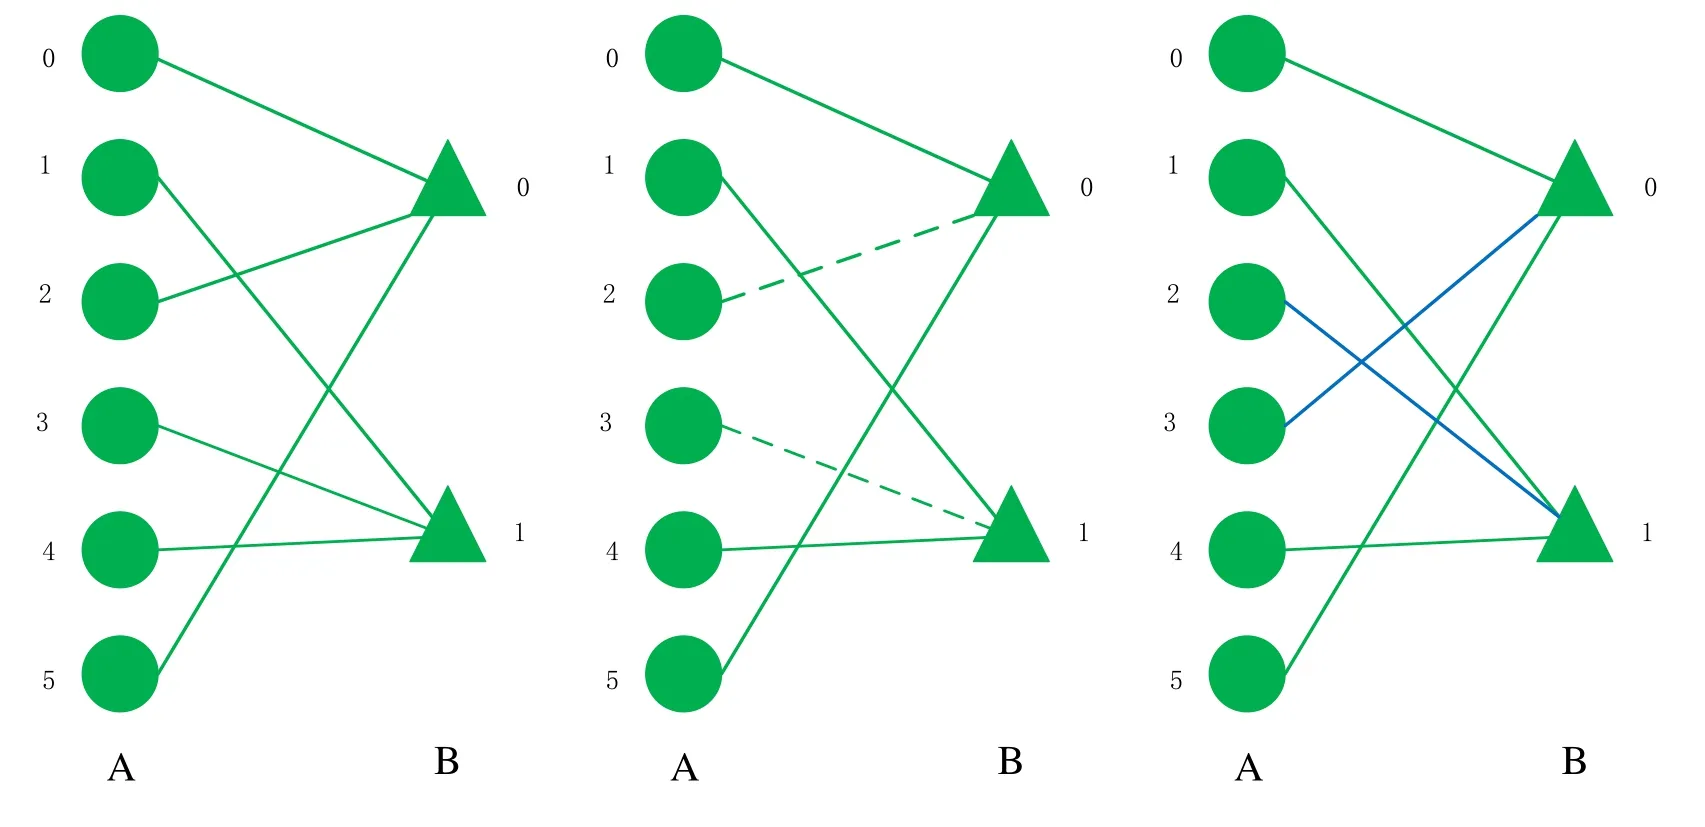
Figure 3. The processes of swapping inter-links.
HEC strategy is swapping an inter-link within two nodes that have the largest eigenvector values.There is perhaps one link of the largest eigenvector values node in the networkAbefore this swapping process.Nevertheless,this inter-link is not linked with the most prominent eigenvector value nodes of these two networks.To complete the swapping process, we delete the inter-link with the largest eigenvector values node in the networkAfirst.Then, we add one inter-link between nodes, the largest eigenvector values of the networkAandB.After this swapping process, one node has four inter-links,and one node has two interlinks.Then, we randomly choose one inter-link from the node,which has four inter-links to delete.Finally,we add one inter-links between two nodes: one has no inter-link,and the other has only two inter-links from networkAandB.The above method will repeat a specific number.These swapping processes will not change the inter-links’ number and the coupled relationships ratio.
·Strategy 3: High K-shell swapping strategy(HK)
One network divides into several sub-layers with a particular structure by nodes’K-shell values.It iteratively deletes nodes in the network in a fixed order and fixes the same batch of deleted nodes as one layer until the nodes in the entire network are deleted [42].The order of deletion is close to the value of the node’s degree.One node has a high K-shell value,which means it is more critical in the network center.
The detailed steps of the high K-shell strategy are getting all nodes’K-shell values at first.There is perhaps one link of the largest K-shell values node in the networkAbefore this swapping process.However,this inter-link is not linked with the largest K-shell values nodes of these two networks.To complete the swapping process,we delete the inter-link with the Kshell values node in the networkAfirst.Then, we add one inter-link between nodes: the K-shell values of the networkAandB.After this swapping process,one node has four inter-links, and one node has two inter-links.Then, we randomly choose one inter-link from the node,which has four inter-links to delete.Finally,we add one inter-links between two nodes: one has no inter-link,and the other has only two inter-links from networkAandB.The above method will repeat a specific number.These swapping processes will not change the inter-links’ number and the coupled relationships ratio.
·Strategy 4: High closeness centrality swapping strategy(HCC)
In one network,many links make up paths between nodes.Closeness centrality refers to the reciprocal of the required path length from one node to other nodes[43–45].If the length of this path is small, the reciprocal of this value is large.If one has a high closeness value,it means that it is close to the other nodes in the entire network and its site in the network’s center position.The nodeicloseness value is:
Take the bird which hangs over the Princess s head, and which by its song sang her into this enchanted sleep--a song which it has had to continue ever since; take it and kill it, and cut its little heart out and burn it to a powder, and then put it into the Princess s mouth; then she will instantly awaken31, and will bestow32 on you her heart and hand, her kingdom and castle, and all her treasures
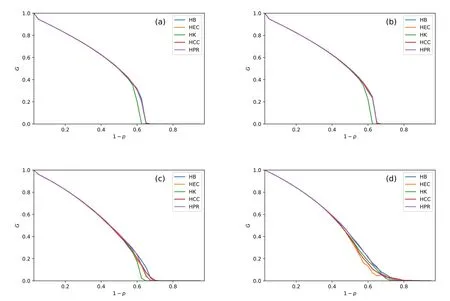
Figure 4. The value of G and pc in the final stage nodes as SL = 20%.Figures (a) (b) (c) and (d) are the result of interdependent networks which are composed of ER-ER, ER-SF, SF-ER, and SF-SF, respectively.HPR and HB get the largest G values in the SF-SF network.HK has the worst performance in improving G and pc in all four subfigures.The maximum value of pc occurs in the SF-SF model(in(d)).

In this formula,d(j,i) means the path length from nodejto nodei.
One time of the process of HCC is getting all nodes’closeness centrality values at first.There is perhaps one link of the largest closeness centrality values node in the networkAbefore this swapping process.Nevertheless, this inter-link is not linked with the most prominent closeness centrality values nodes of these two networks.To complete the swapping process,we delete the inter-link with the network’s closeness centrality values in the networkAfirst.Then,we add one inter-link between nodes:the network’s closeness centrality valuesAandB.After this swapping process,one node has four inter-links, and one node has two inter-links.Then, we randomly choose one inter-link from the node,which has four inter-links to delete.Finally,we add one inter-links between two nodes: one has no inter-link,and the other has only two inter-links from networkAandB.The above method will repeat a specific number.These swapping processes will not change the inter-links’ number and the coupled relationships ratio.
·Strategy 5: High PageRank swapping strategy(HPR)
PageRank algorithm is usually applied in search engines [46, 47].This algorithm’s core is that if many other webpages link a web page, it indicates that this web page is more important, and its PageRank value will be relatively high.If a webpage with a high PageRank value links to another webpage, then the PageRank value of the linked webpage will increase accordingly[48,44].One webpage’s PageRank value is:

Buis the total number of websites connected to nodeu.L(v)means the number of websites linked to nodev.We apply this algorithm in our interdependent network model to get nodes’PageRank value.
The process of one time, HPR is getting all nodes’PageRank values.There is perhaps one link of the largest PageRank value nodes in the networkAbefore this swapping process.Nevertheless, this inter-link is not linked with the largest PageRank values nodes of these two networks.To complete the swapping process, we delete the inter-link with the PageRank values node in the networkAfirst.Then, we add one inter-link between nodes: the PageRank values of the networkAandB.After this swapping process, one node has four inter-links,and one node has two interlinks.Then, we randomly choose one inter-link from the node,which has four inter-links to delete.Finally,we add one inter-links between two nodes: one has no inter-link,and the other has only two inter-links from networkAandB.The above method will repeat a specific number.These swapping processes will not change the inter-links’ number and the coupled relationships ratio.
V.SIMULATION AND ANALYSIS RESULTS
In section V,we give all parameters in our simulation models, and we apply five strategies which we have given detailed swapping processes in section IV.Then,we observe the CPS nodes number in the final stage of cascading failure.Finally, we give the best strategy to enhance reliability in one specific structure CPS model.
5.1 Parameters in Simulation
In section III,we have declared that we use two complex networks to build one CPS model and the coupled ratio is 3:1 in our simulation.There are many parameters to ensure a specific structure in one complex network.
In our paper,we consider the cascading failures are begun by a small number of nodes failing.Thus, the unweighted undirected graph is chosen.The node number of the networkAandBisNA= 15000 andNB= 5000.In an ER network, we define the average degree〈k〉= 4 (this is an important parameter).In one SF network, we determine the parameterγ= 3 and the average degree〈k〉= 4(these are important parameters).The ER and SF networks are the most representative and real-world models among the existing network models.Many scholars have deeply studied these two models.Parameters of these settings refer to the previous research parameter settings.The average degree〈k〉= 4 is the setting that best fits the real-world network.In the SF network,γ= 3 is the most recognized and convincing data in existing experiments.Coupled with the ER and SF networks to couple with, we get four kinds of CPS models with different structures.There is ER coupled ER network,ER coupled SF network,SF coupled ER network,and SF coupled SF network.
In all swapping strategies,the swapping fraction of inter-linksSLmust be determined:

Since the number of inter-links is equal to the nodes number of the networkA, we useNAto represent the inter-links number of our models in Eq (24).NSmeans swapping times in one CPS model.
To measure the impact of CPS reliability under different strategies, we observe the giant component’s size (G) and the system’s ability to resist random attacks(pc).The fraction of the giant component in our model is:

whereis the nodes number of the networkA(B)at the stable state.pcis the value of 1−pwhen theGdecreases to 0.Under the same conditions, the larger the value ofGandpc,the higher the reliability of the CPS model.
5.2 Simulation Steps
We use C++ writing a program to simulate the entire cascading failures in our CPS models and plot the figure betweenGand 1−pby Python:
·We construct two complex networks to represent the networkAandB,which are ER network and SF network.
·The inter-links are randomly coupled between two network nodes,and the inter-links ratio is 3:1.
·In the next, we swap inter-links within different strategies.The relationship between the entire CPS models’ inter-links has changed.The interlinks’ numbers and the coupled ratio have not changed.
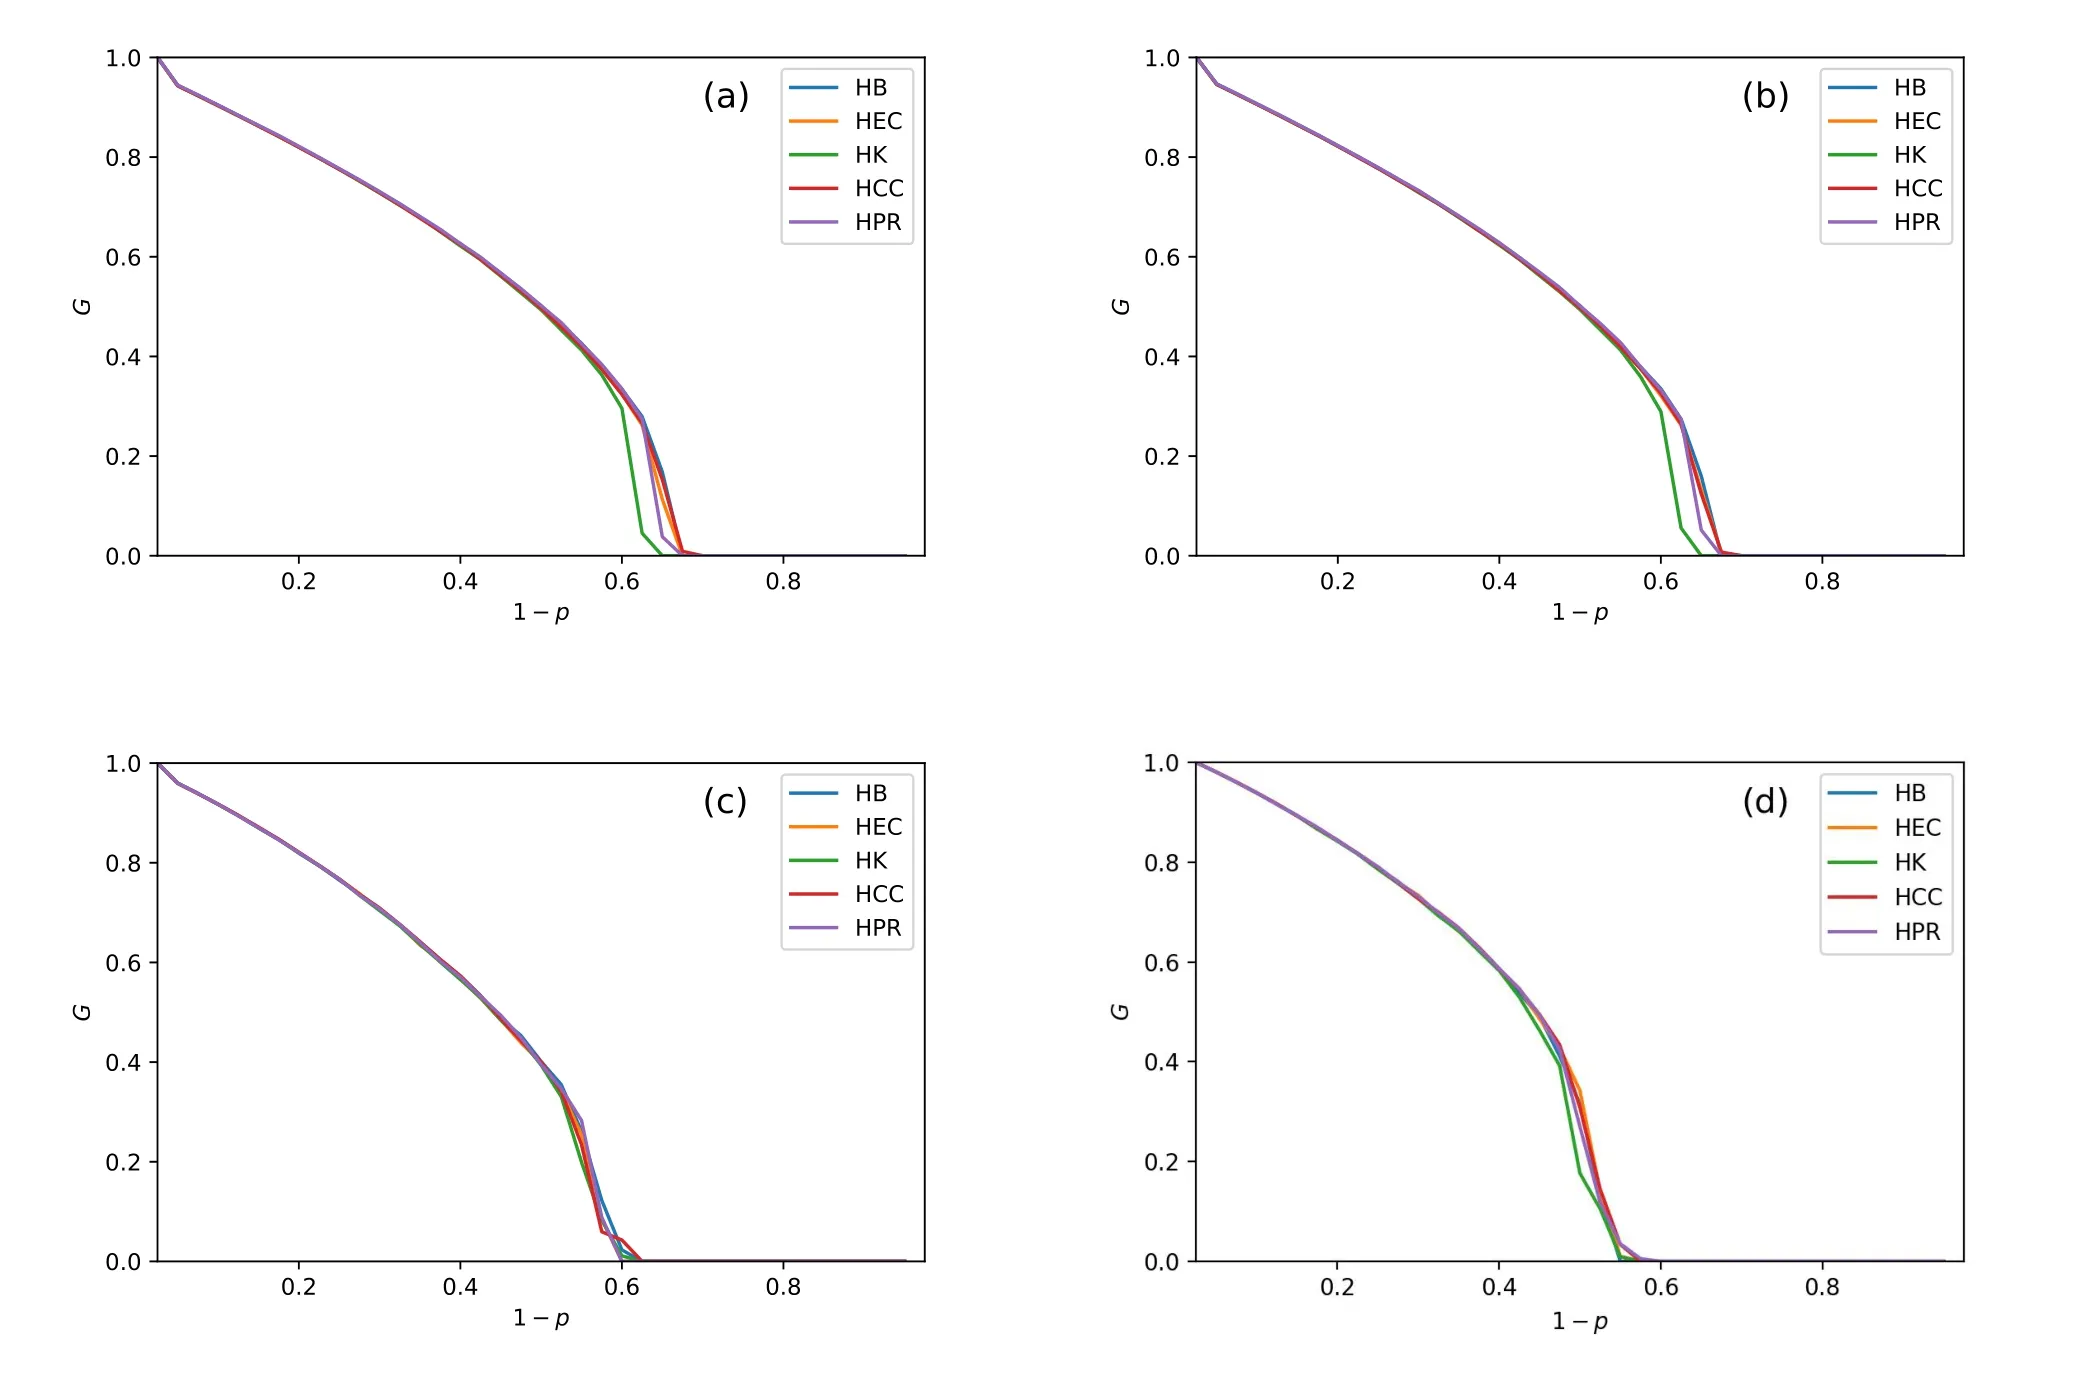
Figure 5. The value of G and pc in the final stage nodes as SL =40%.Figures(a)(b)(c)and(d)are the result of interdependent networks which are composed of ER-ER,ER-SF,SF-ER,and SF-SF,respectively.Unexpectedly,the enhancement of pc and G in SF-ER and SF-SF(in(c)and(d))is worse than in figure 4(c)(d).In(c)and(d),we observe that all strategies are more closed than other figures.In(a)and (b), the pc of HK increases to 0.64 and 0.65 from figure 4(a) and(b).The largest pc value of(a)and(b)are increasing to 0.68 and 0.68 from figure 4(a)and(b).HCC achieves the largest values of G and pc in the ER-ER and ER-SF systems.
·We randomly remove the fraction of 1−pnodes in the networkAas the failed nodes by random attacks.
·The cascading failures propagate between networkAandB.We simulate each cascading stage and record the CPS’s nodes number.
·Plot the relationship figures betweenGand 1−punder different swapping strategies.
The flow chart of the entire simulation process is shown in figure 6.
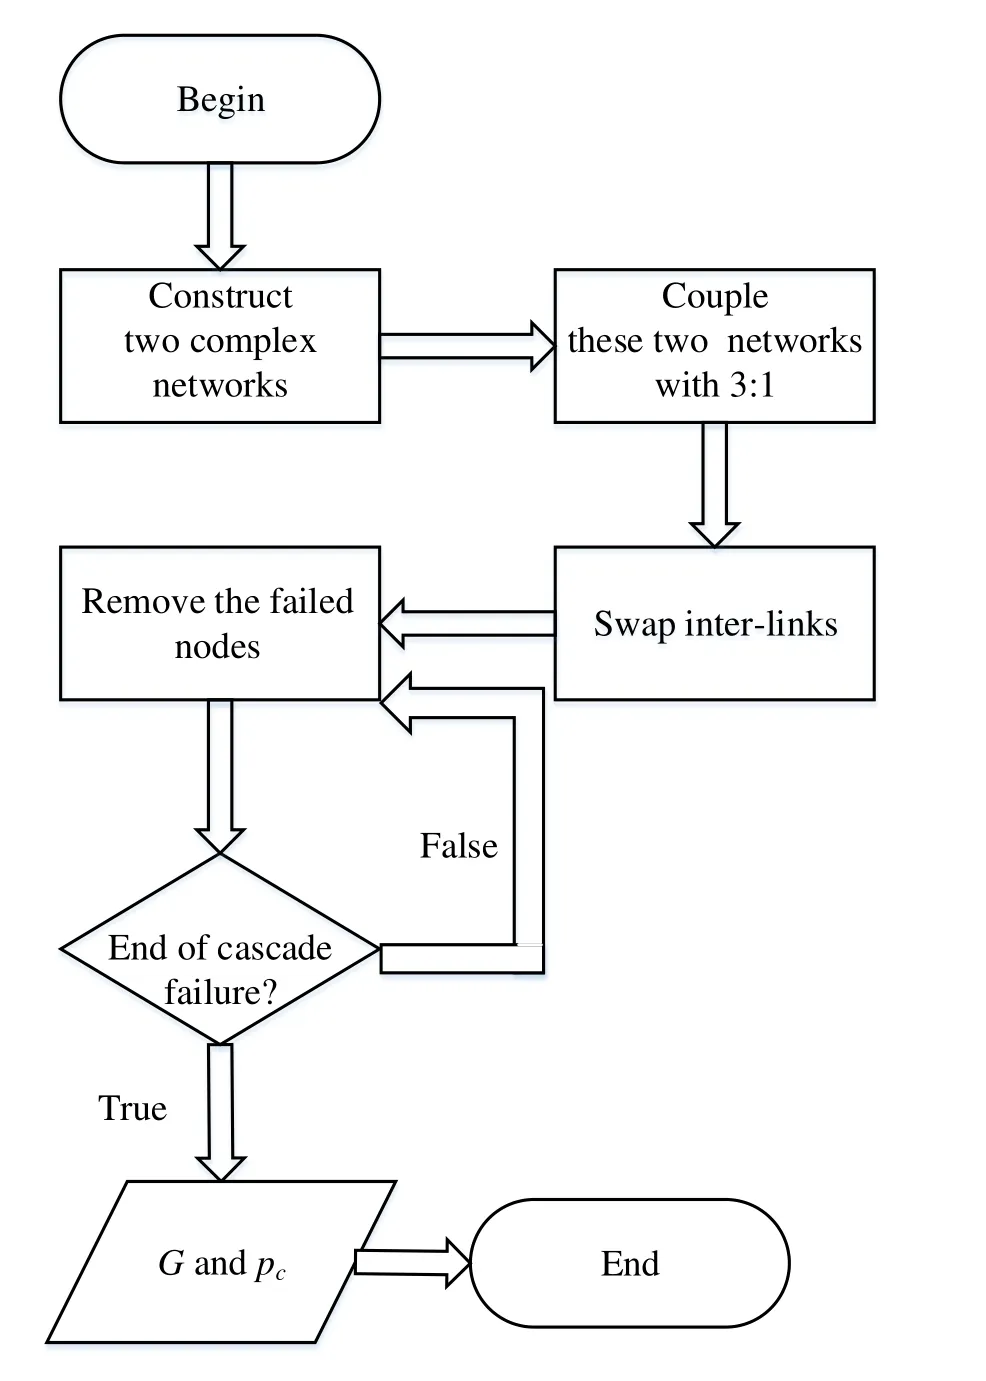
Figure 6. The program flow chart of simulation processes.
5.3 Impact of Different Strategies
To get completed differences between different strategies, we get the value ofSLas 20%,40%,60% and 80%.We plot a diagram which shows the relationship betweenGand 1−p.The curve is the average of 20 times simulation results at one number of 1−p.Figure 4,figure 5,figure 7 and figure 8 are the results ofGandpcwhen the value ofSLis 20%,40%,60%and 80%,respectively.
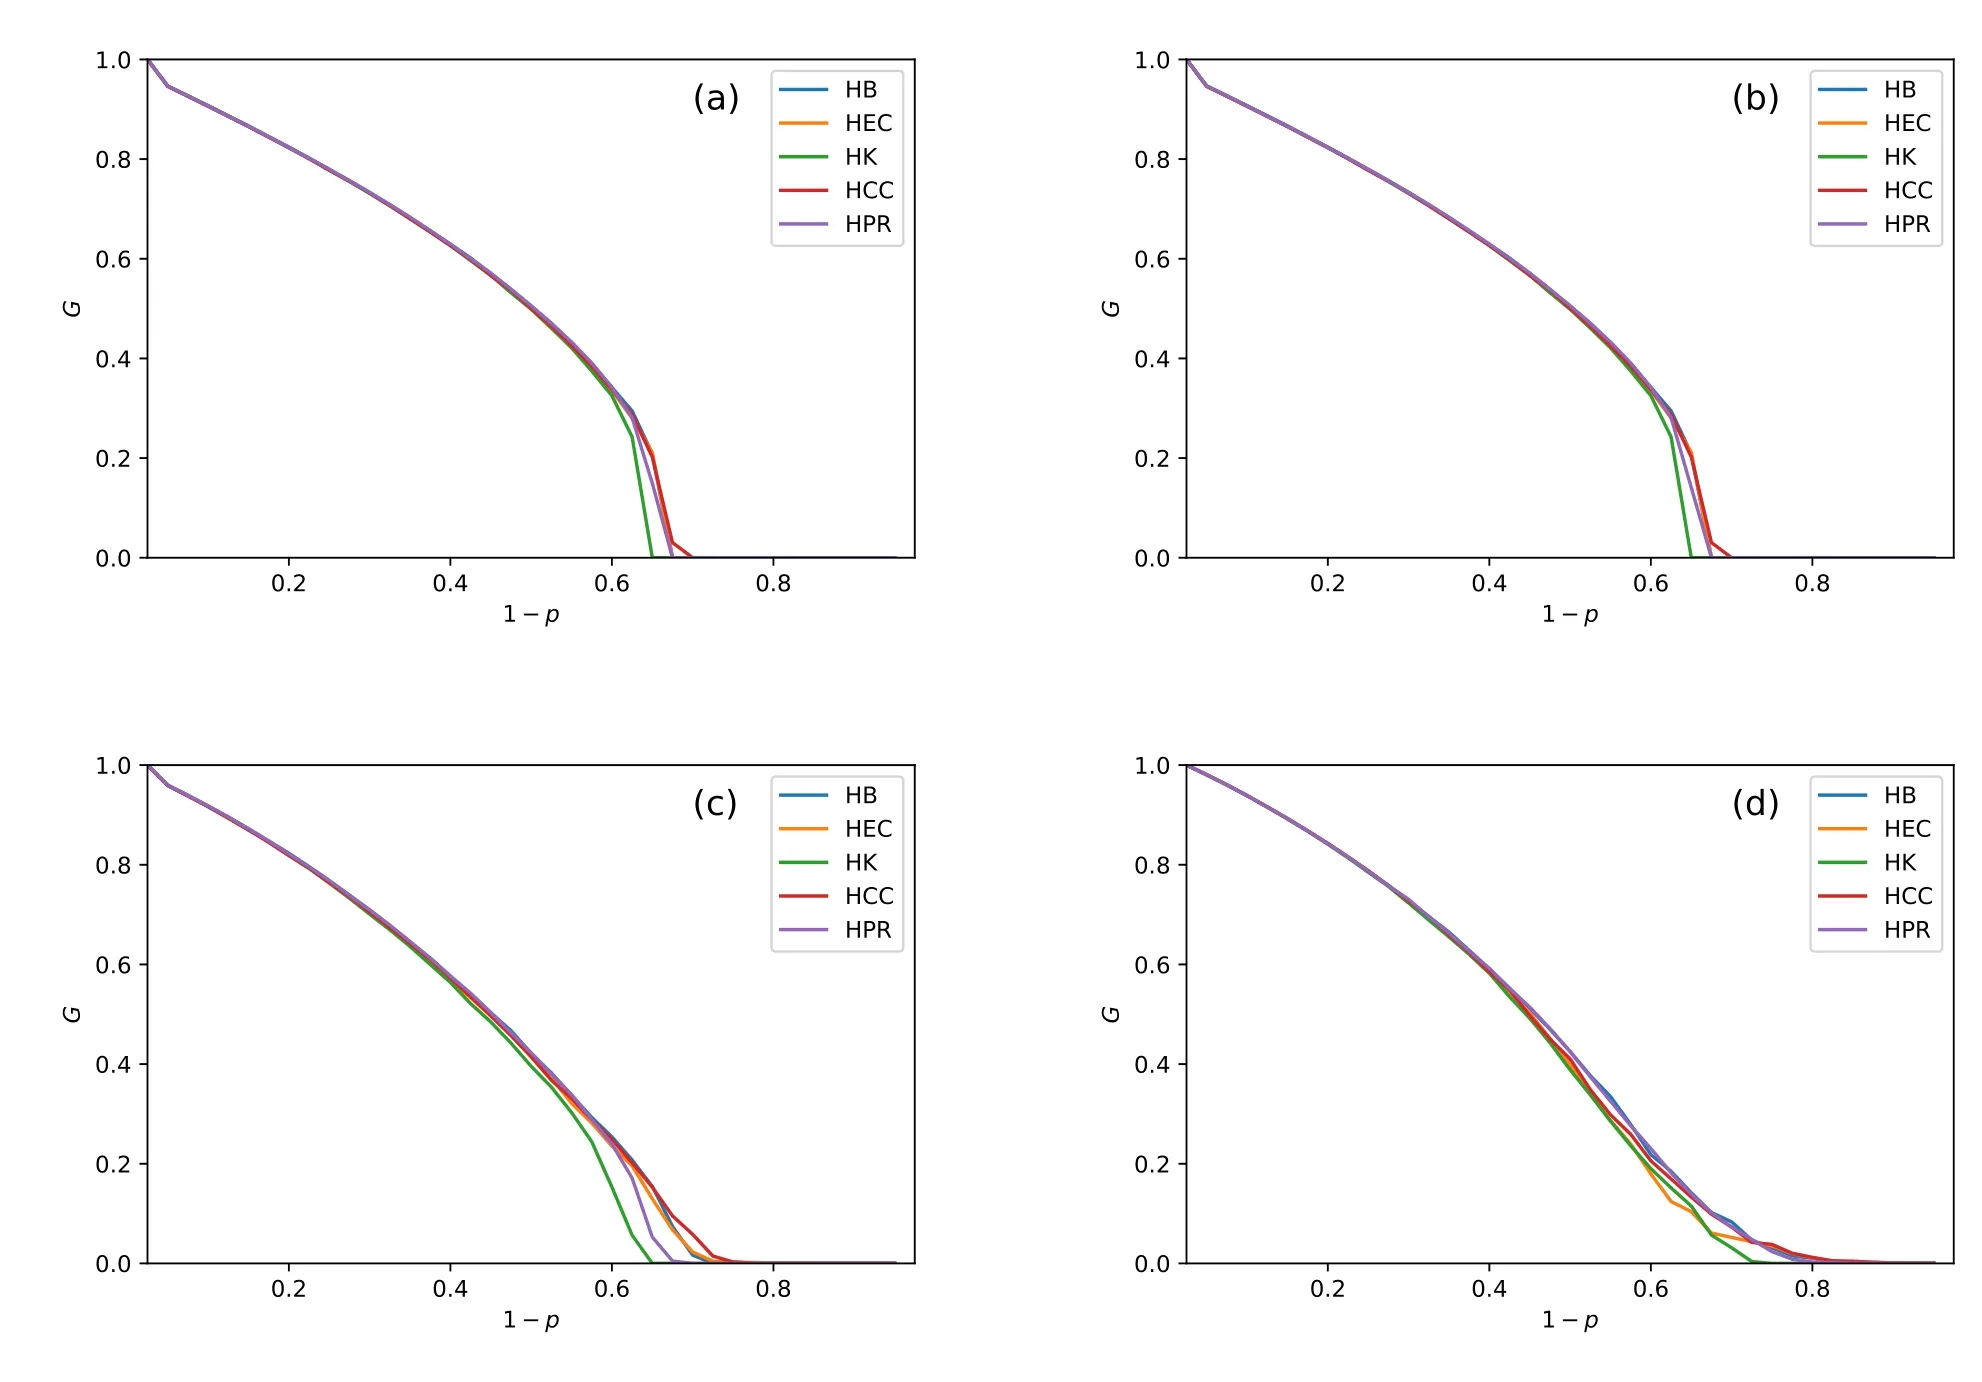
Figure 7. The value of G and pc in the final stage nodes as SL = 60%.Figures (a) (b) (c) and (d) are the result of interdependent networks which are composed of ER-ER,ER-SF,SF-ER,and SF-SF,respectively.HCC achieves the largest G value in the ER-ER,ER-SF and SF-ER system.HPR and HB get the largest G value in the SF-SF network.Gaps of curves in SF-ER and SF-SF are obvious than in figure 5(c)and(d).The biggest values of pc in(a)(b)(c)and(d)are 0.7, 0.68,0.75 and 0.82.The smallest pc values are in HK strategy in(a)(b)(c)and(d)which get 0.64,0.65,0.64 and 0.76.
By comparing the different values ofGandpc, we get the following conclusions:
I.In figure 4 (c) and figure 4 (d), we find that the minimum value ofpcin the SF-ER CPS is 0.62 and in the SF-SF CPS is 0.72.As the value ofSLincreases to 40% (in figure 5 (c) (d)), the minimum value ofpcin SF-ER and SF-SF CPS is decreasing to 0.6 and 0.58.In figure 7 (c) (d) and figure 8(c)(d),the values ofpcare larger than in figure 7 (c) (d) and figure 8 (c) (d).When networkAis a SF network, the values ofpcshow a downward trend underSLfrom 20%to 40%.Thepcvalues of the SF-ER and SF-SF CPS show an increasing trend whenSL >40% in figure 7 (c)(d) and figure 8 (c) (d).This means that when 1−papproaches the pc value,a large number of nodes fail.Similar results appear in the system with only ER network, which indicates that ER network is different from SF network in node connection mode,and it is more prone to large-scale node cascade failure.
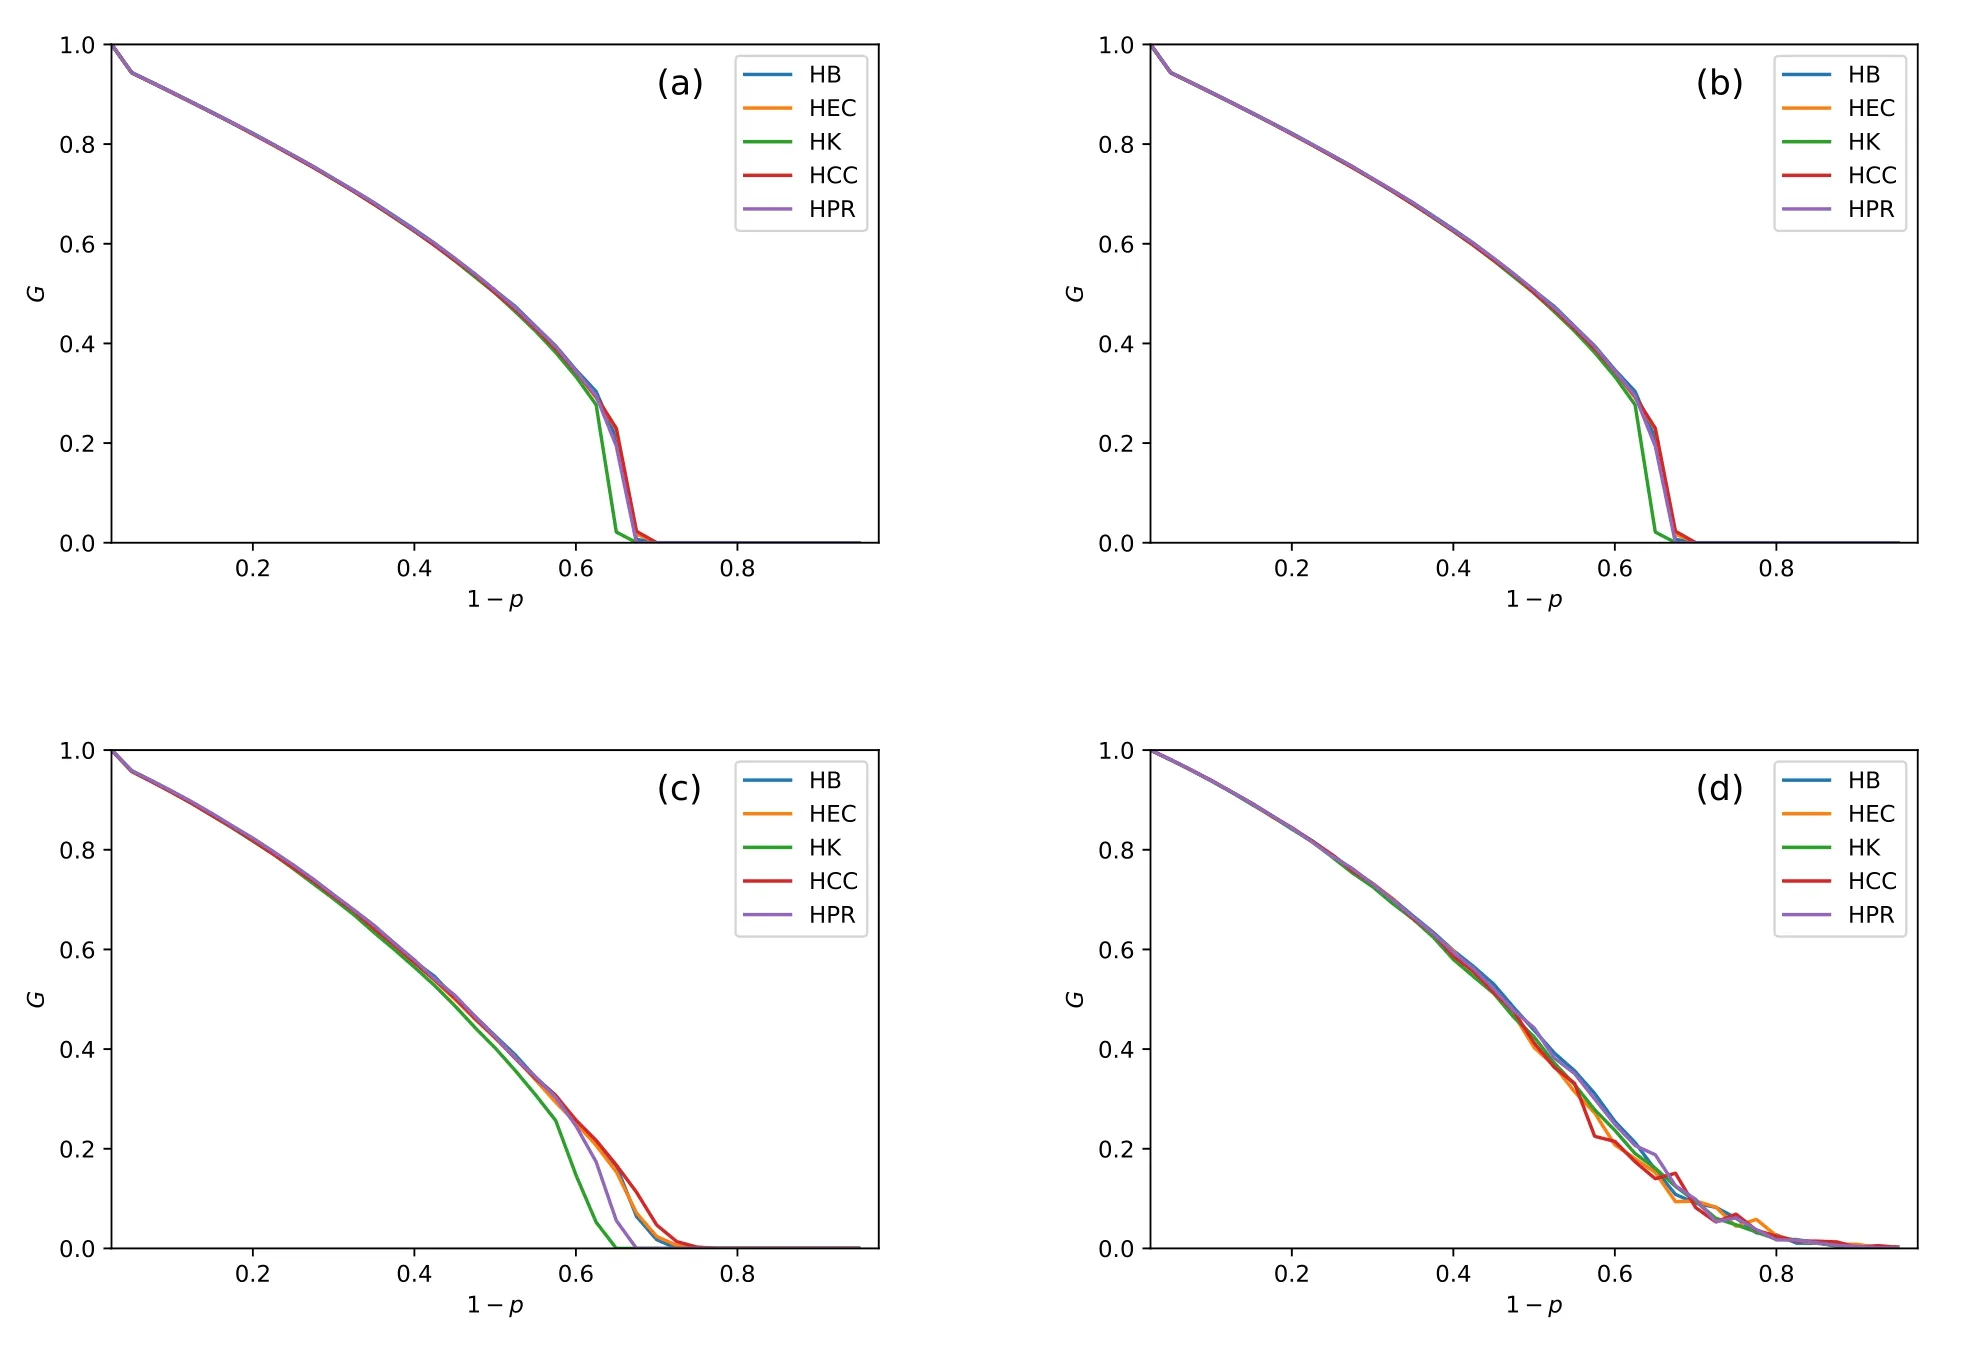
Figure 8. The value of G and pc in the final stage nodes as SL = 80%.These subfigures(a)(b)(c)and(d)are the result of interdependent networks which are composed of the ER-ER, ER-SF, SF-ER, and SF-SF, respectively.HCC achieves the largest G value in the ER-ER,ER-SF and SF-ER system.HPR and HB get the largest G value in the SF-SF network.The biggest values of pc in(a)(b)(c)and(d)are 0.7,0.7,0.78 and 0.88.The smallest pc values are in HK strategy in(a)(b)and(c)which get 0.68,0.68 and 0.64.
II.If networkAis an ER network,the value ofpcis increasing withSLincreases (in figure 4 (a) (b),figure 5 (a) (b), figure 7 (a) (b) and figure 8 (a)(b)).The maximum values ofpcin the ER-ER model and ER-SF model are increasing from 0.63 to 0.7 and from 0.61 to 0.7 whenSLchanges from figure 4 to figure 8.Increasing the ratio of swapping inter-links has a more obvious effect on the reliability of the ER network.
III.As the value ofSLincreases, the difference between theGandpcvalues of different strategies in the ER-SF and SF-ER CPS is gradually obvious.This shows that when the interdependent network is composed of different networks,the CPS has a more significant effect on swapping inter-links of different swapping strategies.With the increase ofSL,nodes with many neighbor nodes are connected.This swapping makes the entire system more reliable.
IV.From figure 4 (d), figure 5 (d), figure 7 (d) and figure 8(d),HPR and HB strategy perform similar enhancements inGvalue.These two strategies makeGlarger than the other strategies whenSLis 20%,40%,60%and 80%.HCC strategy makesGgetting the optimal values in the other three CPS models in allSLvalues.This must be because the SF-SF network connects edges according to PageRank and betweenness, making the entire network’s giant component large enough.Thus,more nodes can be maintained after cascading failures.If a system consists of the ER network,then closeness centrality will connect more components.Different complex network structures cause this phenomenon.
In these four figures (figure 4, figure 5, figure 7 and figure 8),HK strategy makes all CPS models more prone to collapse.
VI.CONCLUSION AND FUTURE WORK
This study of the cyber-physical system is getting more and more attention.Under the previous research,we apply new swapping strategies in different interdependent networks’ models.We find that the high closeness swapping strategy (HCC) is the best strategy in improvingGandpcin a system consists of the ER network through the above simulations.The high PageRank(HPR)and high betweenness strategy(HB)perform the bestGandpcvalues in the SF-SF model.High K-shell strategy (HK) is always the worst strategy of all interdependent models.
We will explore other strategies to get more extensiveGandpcin the subsequent studies.Building new interdependent models to simulate real-world systems is another working direction.
ACKNOWLEDGEMENT
This work was supported in part by the National Natural Science Foundation of China under grant No.62072412,No.61902359,No.61702148,and No.61672468 part by the Opening Project of Shanghai Key Laboratory of Integrated Administration Technologies for Information Security under grant AGK2018001.
- China Communications的其它文章
- A User-Friendly SSVEP-Based BCI Using Imperceptible Phase-Coded Flickers at 60Hz
- Steady-State Visual Evoked Potential(SSVEP)in a New Paradigm Containing Dynamic Fixation Points
- Toward a Neurophysiological Measure of Image Quality Perception Based on Algebraic Topology Analysis
- Transfer Learning Algorithm Design for Feature Transfer Problem in Motor Imagery Brain-computer Interface
- Removal of Ocular Artifacts from Electroencephalo-Graph by Improving Variational Mode Decomposition
- BCI+VR Rehabilitation Design of Closed-Loop Motor Imagery Based on the Degree of Drug Addiction

