A User-Friendly SSVEP-Based BCI Using Imperceptible Phase-Coded Flickers at 60Hz
Lu Jiang,Weihua Pei,Yijun Wang,3,*
1 State Key Laboratory on Integrated Optoelectronics,Institute of Semiconductors,Chinese Academy of Sciences,Beijing 100083,China
2 University of Chinese Academy of Sciences,Beijing 100049,China
3 Chinese Institute for Brain Research,Beijing 102206,China
Abstract: A brain-computer interface (BCI) system based on steady-state visual evoked potentials(SSVEP) was developed by four-class phase-coded stimuli.SSVEPs elicited by flickers at 60Hz, which is higher than the critical fusion frequency (CFF),were compared with those at 15Hz and 30Hz.SSVEP components in electroencephalogram(EEG)were detected using task related component analysis(TRCA)method.Offline analysis with 17 subjects indicated that the highest information transfer rate (ITR) was 29.80±4.65bpm with 0.5s data length for 60Hz and the classification accuracy was 70.07±4.15%.The online BCI system reached an averaged classification accuracy of 87.75±3.50% at 60Hz with 4s, resulting in an ITR of 16.73±1.63bpm.In particular, the maximum ITR for a subject was 80bpm with 0.5s at 60Hz.Although the BCI performance of 60Hz was lower than that of 15Hz and 30Hz, the results of the behavioral test indicated that, with no perception of flicker,the BCI system with 60Hz was more comfortable to use than 15Hz and 30Hz.Correlation analysis revealed that SSVEP with higher signal-to-noise ratio (SNR) corresponded to better classification performance and the improvement in comfortableness was accompanied by a decrease in performance.This study demonstrates the feasibility and potential of a user-friendly SSVEP-based BCI using imperceptible flickers.
Keywords: brain-computer interface; electroencephalogram; steady-state visual evoked potentials;imperceptible flickers; phase coding; task related component analysis
I.INTRODUCTION
Brain computer interfaces (BCIs) enable a new pathway for people to communicate with the outside world[1, 2].BCI-based communication and control technologies provide basic communication capabilities for people with severe muscle diseases [3].For example, Birbaumer et al.published the first BCI for the completely paralyzed in 1999, which controlled the spelling system through slow cortical potentials(SCPs) [4].Nowadays, research on BCI has focused on non-invasive scalp electroencephalogram (EEG)measurements [5].The most commonly used signals in EEG-based BCI systems include the visual evoked potentials(VEPs),P300 event-related potential(ERP),and sensorimotor mu/beta rhythms[3].
Steady-state visual evoked potential (SSVEP), as one major type of VEPs, has been widely used in EEG-based BCIs.SSVEP is evoked by repeated visual stimuli at frequency higher than 6Hz and synchronized with the stimulation frequency [6].SSVEP is generated in the visual cortex, which can be acquired noninvasively with few electrodes located in the occipital region of the scalp [7, 8].SSVEP is less affected by the artifacts caused by blinking and movement[9],and a high signal-to-noise ratio(SNR)can be obtained if SSVEP is analyzed at a sufficiently high frequency resolution [10].In addition, SSVEP-based BCIs require little or no user training because the system relies on natural involuntary responses[11,12].
SSVEP-based BCIs can adopt flickering stimuli in a wide range of frequencies with different performance.The visual stimulus flickers at∼15Hz evoked SSVEPs with the strongest amplitude [8].SSVEP amplitude decreased at higher stimulation frequencies [13–15].The visual stimulus beyond the critical fusion frequency(CFF)can only evoke little brain activity[16].In a BCI,the higher amplitude of SSVEPs makes target detection easier, with higher accuracy and information transfer rate(ITR).Therefore,high-frequency SSVEP BCIs always require longer stimulation time to obtain good performance.For example, Chen et al.compared the performance differences between low and high-frequency 45-target SSVEP-based BCI speller [17].It was found that speller obtained accuracy of 84.1% and ITR of 105 bits/min(bpm) with 2s data length at low-frequency stimulation (7Hz-15.8Hz), while the accuracy was 88.7%and ITR was 61bpm for 4s data length at high-frequency stimulation(35.6-44.4Hz).
Importantly, a high-frequency SSVEP BCI brings users higher comfortableness and security.Studies have shown that when subjects participate in BCI experiments for a long time, obvious flickering stimulation will lead to visual fatigue, which can only be relieved after a period of rest [18].If patients are to use the BCI system for daily communication or assisted movement [19], imperceptible flickering stimuli with high frequency above the CFF can reduce fatigue [20, 21].In addition, visual stimuli with high frequency (>50Hz) are safer for people with photosensitive epilepsy [22], while 15-25 Hz is the most provocative frequency of a photic-or pattern-induced seizure [23].Therefore, it is of great interest to implement a high-frequency SSVEP BCI that can offer higher levels of comfortableness and safety,as well as good performance.
Visual stimulator, which commonly uses lightemitting diode(LED)or liquid crystal display(LCD),plays an important role in the successful implementation of SSVEP-based BCIs [24].LCD monitors are less likely to cause eye fatigue and have more flexibility in setting stimulus parameters such as the size,color, quantity and location of stimulus targets, since the presentation of stimuli depends on software development [25, 26].In addition, frame-based coding method has been well developed to present stable visual stimuli [27].However, if the refresh rate of the monitor is 60 Hz, the maximum flickering frequency is 30 Hz.Therefore, in order to present highfrequency flicker,an LCD monitor with a high refresh rate (e.g., 240 Hz) is required.Furthermore, it is always a challenge to code multiple targets with highfrequency stimuli.Based on SSVEP’s time-locked and phase-locked characteristics for flickering stimulation[28],phase coding can be applied to implement a multi-target SSVEP BCI at an imperceptible flickering frequency at 60Hz.The phase-coded targets can be detected by recognizing the phase of SSVEP synchronized with the stimulus signal.
In this paper, a four-class phase-coded SSVEPbased BCI at 60Hz was implemented, and the differences in SSVEP signal and BCI system performance were compared with 15Hz and 30Hz.Four targets tagged with different phases were presented on an LCD monitor with the refresh rate of 240Hz.The identification of four targets with different phases was realized by a task-related component analysis(TRCA)method and system performance was evaluated by the SNR of SSVEP, classification accuracy and ITR.In addition, this study evaluated the user experience of the proposed SSVEP BCI system by collecting users’feedback of comfortableness and perception of flicker.
II.METHODS AND MATERIALS
2.1 Experimental Environme nt
2.1.1 Subjects
Seventeen healthy subjects (8 males and 9 females,ages 20-28 years,with an averaged age of 25.2 years)took part in the experiment.All subjects had normal or corrected-to-normal vision.Before the experiment,each subject was asked to read and sign an informed consent form approved by the Research Ethics Committee of Chinese Academy of Science.
2.1.2 Apparatus
The visual stimulation was presented on the Alienware AW2518H monitor,which has a 24.5-inch LCD screen with a resolution of 1920×1080 pixels and a refresh rate of 240Hz.The host computer is Dell T5820 graphics workstation with a P4000 graphics card.The stimulus program used the Psychophysics Toolbox[29]in MATLAB(Mathworks, Inc.) to generate and display stimulus images according to the stimulus sequence.The high consistency of visual stimulation waveforms in multiple trials indicated that stable high-frequency stimulation could be presented.
The system diagram of the online BCI system is shown in Figure 1.First, a 240Hz LCD monitor presents four phase-coded stimuli at 60Hz to the subject and sends event triggers (stimulus onset) to the amplifier.At the same time,an EEG system is used to obtain EEG data from the subject,which are transmitted from the amplifier to the computer for data analysis.After that, the classification results will be transmitted to the stimulator and provide auditory feedback(a short click)to the subjects.
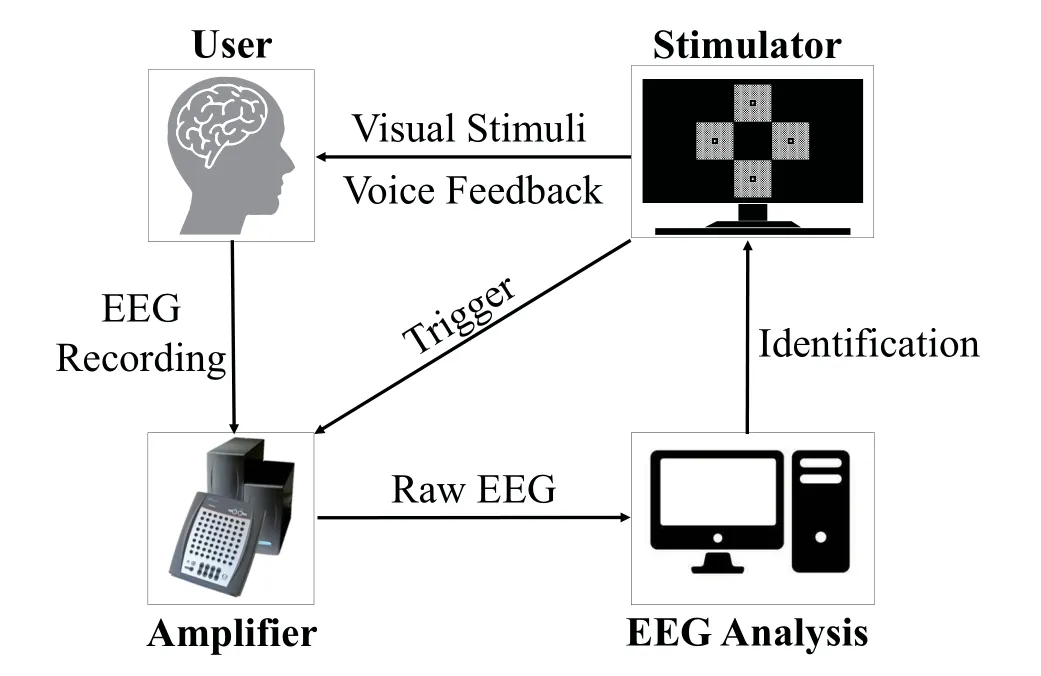
Figure 1. Diagram of an online BCI system.
2.1.3 Visual Stimulus Design
The stimulus interface consisted of four flickering targets on the black background, as shown in Figure 2.Each target adopted the style of checkboard stimulus[30, 31], which consisted of 32×32 small squares of size 10×10 pixels.Any two adjacent squares in each target were pure black and white respectively,and only the white squares flickered during stimulation.At the center of each target was a black square with an arrow used as the subject’s fixation point.
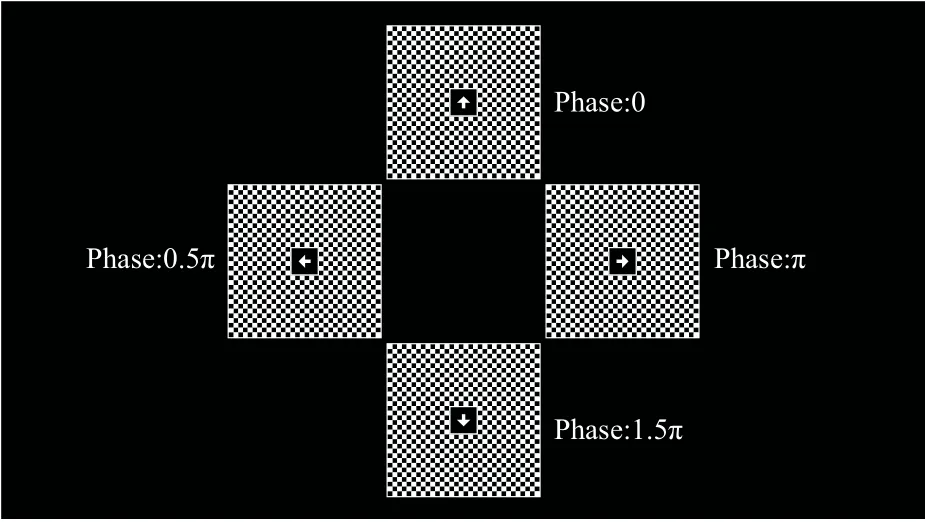
Figure 2. Stimulus interface of the four-class phase-coded SSVEP-BCI.
This study determined the low, medium and high frequency stimuli through behavioral test.10 subjects were asked to look at stimuli of eight frequencies (15Hz, 17Hz, 20Hz, 24Hz, 30Hz, 40Hz, 60Hz,and 120Hz) which were presented simultaneously on the monitor for five seconds and to fill out questionnaires about comfortableness and perception of flicker(see Table 1 and Table 2).As shown in Table 3,15Hz,17Hz and 20Hz stimuli gave people poor comfortableness and strong sense of flicker.24Hz and 30Hz stimuli were only slightly uncomfortable and slightly flickering.The 60Hz and 120Hz stimuli higher than the CFF made people feel comfortable with imperceptible flickers.Therefore, for comparison, this study chose 15Hz, 30Hz and 60Hz as low, medium and high frequency stimuli,respectively.
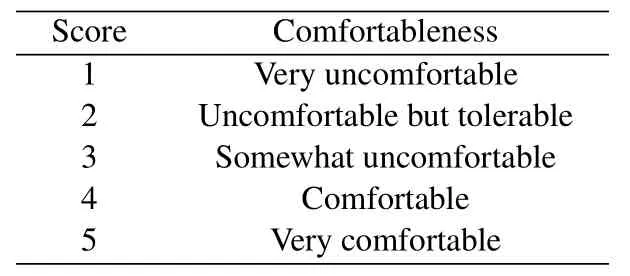
Table 1. Questionnaires about comfortableness.
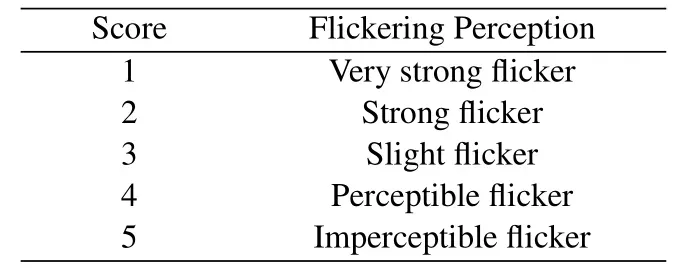
Table 2. Questionnaires about perception of flicker.
This study used a sampled sinusoidal stimulation method[17]to present the visual flickers.Four targets were encoded by four initial phases(0,0.5π,π,1.5π)and flickered simultaneously at each frequency.At the refresh rate of 240Hz, each cycle of 15Hz, 30Hz and 60Hz consisted of 16,8 and 4 frames respectively.The phase difference between the two adjacent phases was 0.5π, corresponding to the shift of 4, 2 and 1 frames respectively in the stimulus signal.
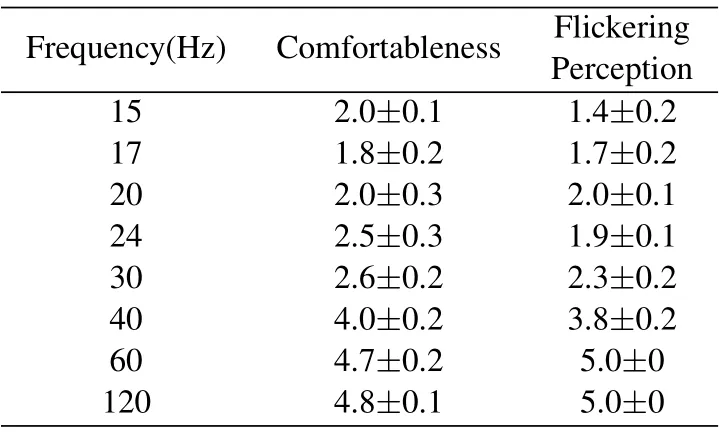
Table 3. The averaged results and standard errors of the behavioral test from 10 subjects before the formal experiment.
2.1.4 EEG Recording
In the experiment, EEG signals were acquired using a Synamps2 system(Neuroscan,Inc.) with nine electrodes (Pz, PO5, PO3, POz, PO4, PO6, O1, Oz, O2)located in the occipital region at a sampling rate of 1000Hz.Electrodes were placed at 10–20 electrode sites.The reference electrode was located on the top of the head and the grounding electrode was located on the forehead.The impedance of each electrode was kept below 10kΩ.The acquisition software used a 50Hz notch filter to eliminate the common power line noise.The stimulus trigger events were sent from the stimulation computer’s parallel port to the amplifier,which was synchronized with the EEG signal.
2.2 Experiment Design
Subjects sat in a comfortable chair in a room with normal lighting and put their heads on a headrest about 70cm from the monitor to minimize the impact of head movements on EEG data recording.This study designed offline and online experiments using cueguided target selection tasks [32] to evaluate the differences in system performance at different stimulus frequencies.The experimental procedure is shown in Figure 3.
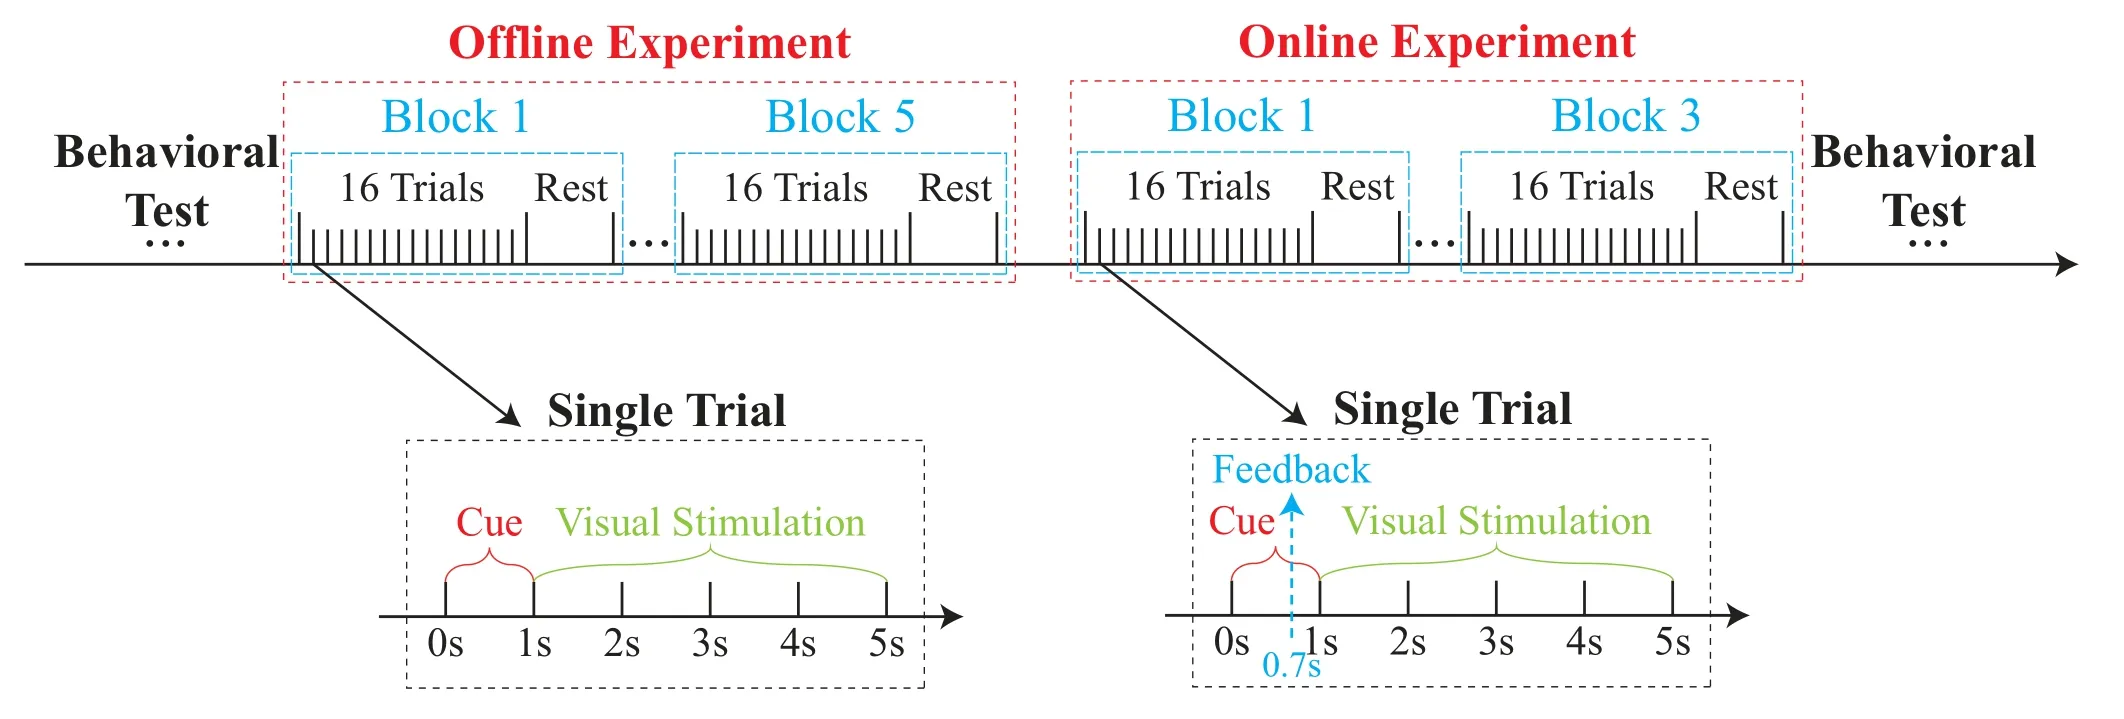
Figure 3. Experimental procedures of offline and online experiments.
In the offline experiment,all subjects completed five blocks of target selection tasks.Each block contained 16 trials, in which four targets were prompted four times in a random order.Each trial lasted five seconds and all stimuli flickered together.Within the first second a red box appeared outside the target as a prompt.Subjects were required to fixate at the fixation point on the arrow in the middle of the target as soon as possible.For the next four seconds, a red triangle appeared below the target and subjects were asked to avoid blinking as much as possible.To reduce the effect of visual fatigue on the experiment,there was enough time(ranged from 2 to 10 minutes)to rest between two blocks.In the online experiment,all subjects completed three blocks of target selection tasks.Different from the offline experiment, the auditory feedback of the classification result for the previous trial was provided to the subjects in real time within the one-second duration of target prompt for the current trial.In summary,for each subject,32 trials of EEG data in each combination of frequency and phase were collected.In addition,subjects took the behavioral test(see subsection 2.1.3)before and after the whole offline and online experiments to show whether the subjective perception will be different after looking at the flickering stimulus for a long time.
2.3 Data Analysis
2.3.1 EEG characteristics
The frequency and phase characteristics of EEG signals were analyzed to determine whether there was a frequency and phase locking relationship between SSVEP and stimuli [33].EEG signal was extracted according to the event trigger generated by the stimulus program.Considering a response delay of 140ms[34], the signal for 4.14s time window was extracted after the stimulus onset and down-sampled to 250Hz,which were then filtered through a narrow-band filter(15Hz: 12-18Hz, 30Hz: 27-33Hz, 60Hz: 57-63Hz)for drawing clean waveforms of the elicited SSVEPs(as shown in subsection 3.1).Besides, the downsampled EEG signals were passed through a high-pass filter (15Hz:>10Hz, 30Hz:>25Hz, 60Hz:>55Hz)for power spectrum analysis.In order to obtain the appropriate frequency resolution, we intercepted the data epochs in [0.14s 4.14s] (time 0 indicated stimulus onset) for fast Fourier transform, and analyzed the frequency characteristics on each harmonic and the phase distribution characteristics on the fundamental frequency.EEG characteristics were obtained by averaging 32 trials of SSVEP signals for each phase.
2.3.2 Classification algorithm
This study realized the classification of four-class phase-coded SSVEP signals using the TRCA [35]method which can maximize repeatability to extract the task related components.EEG signals after downsampling and band-pass filtering were denoted asx(t).According to the TRCA method, the spatial filtersW=[w1,w2,w3,w4],wherewkcorresponding to thekthphase,were obtained.Then,the labeled EEG data of thekthphase were averaged to obtain the template.The unlabeled EEG data Y and templateswere passed through the spatial filters to calculate the two-dimensional correlation coefficientrk,as Eq.(1):

In addition, the filter bank analysis method [34]were used to comprehensively utilize the fundamental frequency and harmonic information of SSVEP to improve the classification accuracy.The frequency band of thenthband-pass filter ranged from(f×n −5)Hz to 100Hz,wherefwas the flickering frequency of the stimulus.Specifically, while six and three band-pass filters for 15Hz and 30Hz were adopted respectively,this study only used one band-pass filter (55-100Hz)for 60Hz data processing, because it had no obvious response at the second harmonic frequency (120Hz).As the amplitude and SNR of SSVEP decreased as the number of harmonics increased,the weight ofnthsubband was defined as Eq.(2):

whereNis the total number of sub-bands(15Hz:N=6,30Hz:N=3,60Hz:N=1),The weighted sum of correlation coefficient values corresponding to all subbands(i.e.was calculated as Eq.(3):

The correlation coefficientwas calculated with the templates of each phase, and the one with the largest correlation coefficient was determined as the target label ofY.
In this study,accuracy and ITR were calculated.Accuracy is defined as the ratio of the number of correctly labeled seletions to the total number of seletions.The ITR in bpm was calculated as Eq.(4):

whereMis the number of targets(4 in this study),Pis the averaged classification accuracy,andTis the averaged time to complete the detection of targets,including the stimulus duration of 4s and the gaze switching and feedback presentation time of 1s.
2.3.3 SNR
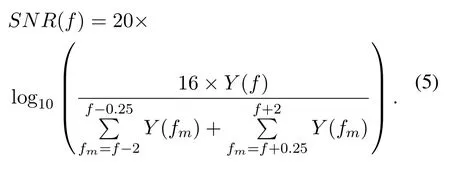
SNR of SSVEP was calculated by EEG signal that had been down-sampled and band-pass filtered.Different from the frequency and phase analysis, we comprehensively considered the characteristics of nine channels of signals passed through the TRCA spatial filter.The SSVEP signals of 32 trials for each phase were averaged,and the data epochs in[0.14s 4.14s](time 0 indicated stimulus onset)were extracted for fast Fourier transform.SNR was defined as the ratio of the signal spectrum amplitudeY(·) at the stimulus frequency f to the mean of background noises at sixteen adjacent frequenciesfmon both sides,as Eq.(5):
2.4 Performance Evaluation
In this paper,SNR of SSVEP,classification accuracy,ITR and behavioral test results were used to evaluate the system performance.First,the SNR of SSVEP signals at 60Hz was compared with those at 15Hz and 30Hz to quantify the differences in EEG characteristics.After that,the classification accuracy and ITR of 5 blocks offline data were estimated by a leave-oneout cross-validation method.Then, the classification accuracy and ITR for the 3 blocks online data were calculated with the TRCA-based template matching method using the offline data.Finally, with the results of the behavioral test,the users’comfortableness and perception of flicker of different frequencies were analyzed.
III.RESULTS
3.1 Stimulus and EEG Characteristics
The waveforms of the flickering signals are illustrated in Figure 4a.Compared with Figure 4b, the frequency and phase information of target stimulus were accurately coded into the SSVEP signals [33] at the Oz electrode.In addition, the amplitude spectrum of SSVEPs exhibited significant peaks at each harmonic for all phases within 100Hz,and the amplitude at harmonic frequency decreased as the frequency increased.As shown in Figure 4c, the averaged amplitude of SSVEPs across four phases was 0.23uV at 60Hz for the 60Hz stimuli.The mean amplitude was 2.04uV at 15Hz, 0.84uV at 30Hz (second harmonic),0.80uV at 45Hz(third harmonic)and 0.29uV at 60Hz(fourth harmonic) for the 15Hz stimuli.Regarding the 30Hz stimuli, the mean amplitude was 1.03uV at 30Hz and 0.51uV at 60Hz (second harmonic).The scatter diagrams of complex EEG spectra in Figure 4d indicate that 15Hz, 30Hz and 60Hz stimulus signals elicited robust SSVEPs with precise frequency and separable phases.For the 60Hz stimuli,the individual difference in the phase of SSVEP is shown in Figure 5.The phases were separable for most subjects, except for S13 and S17 with poor classification accuracy.
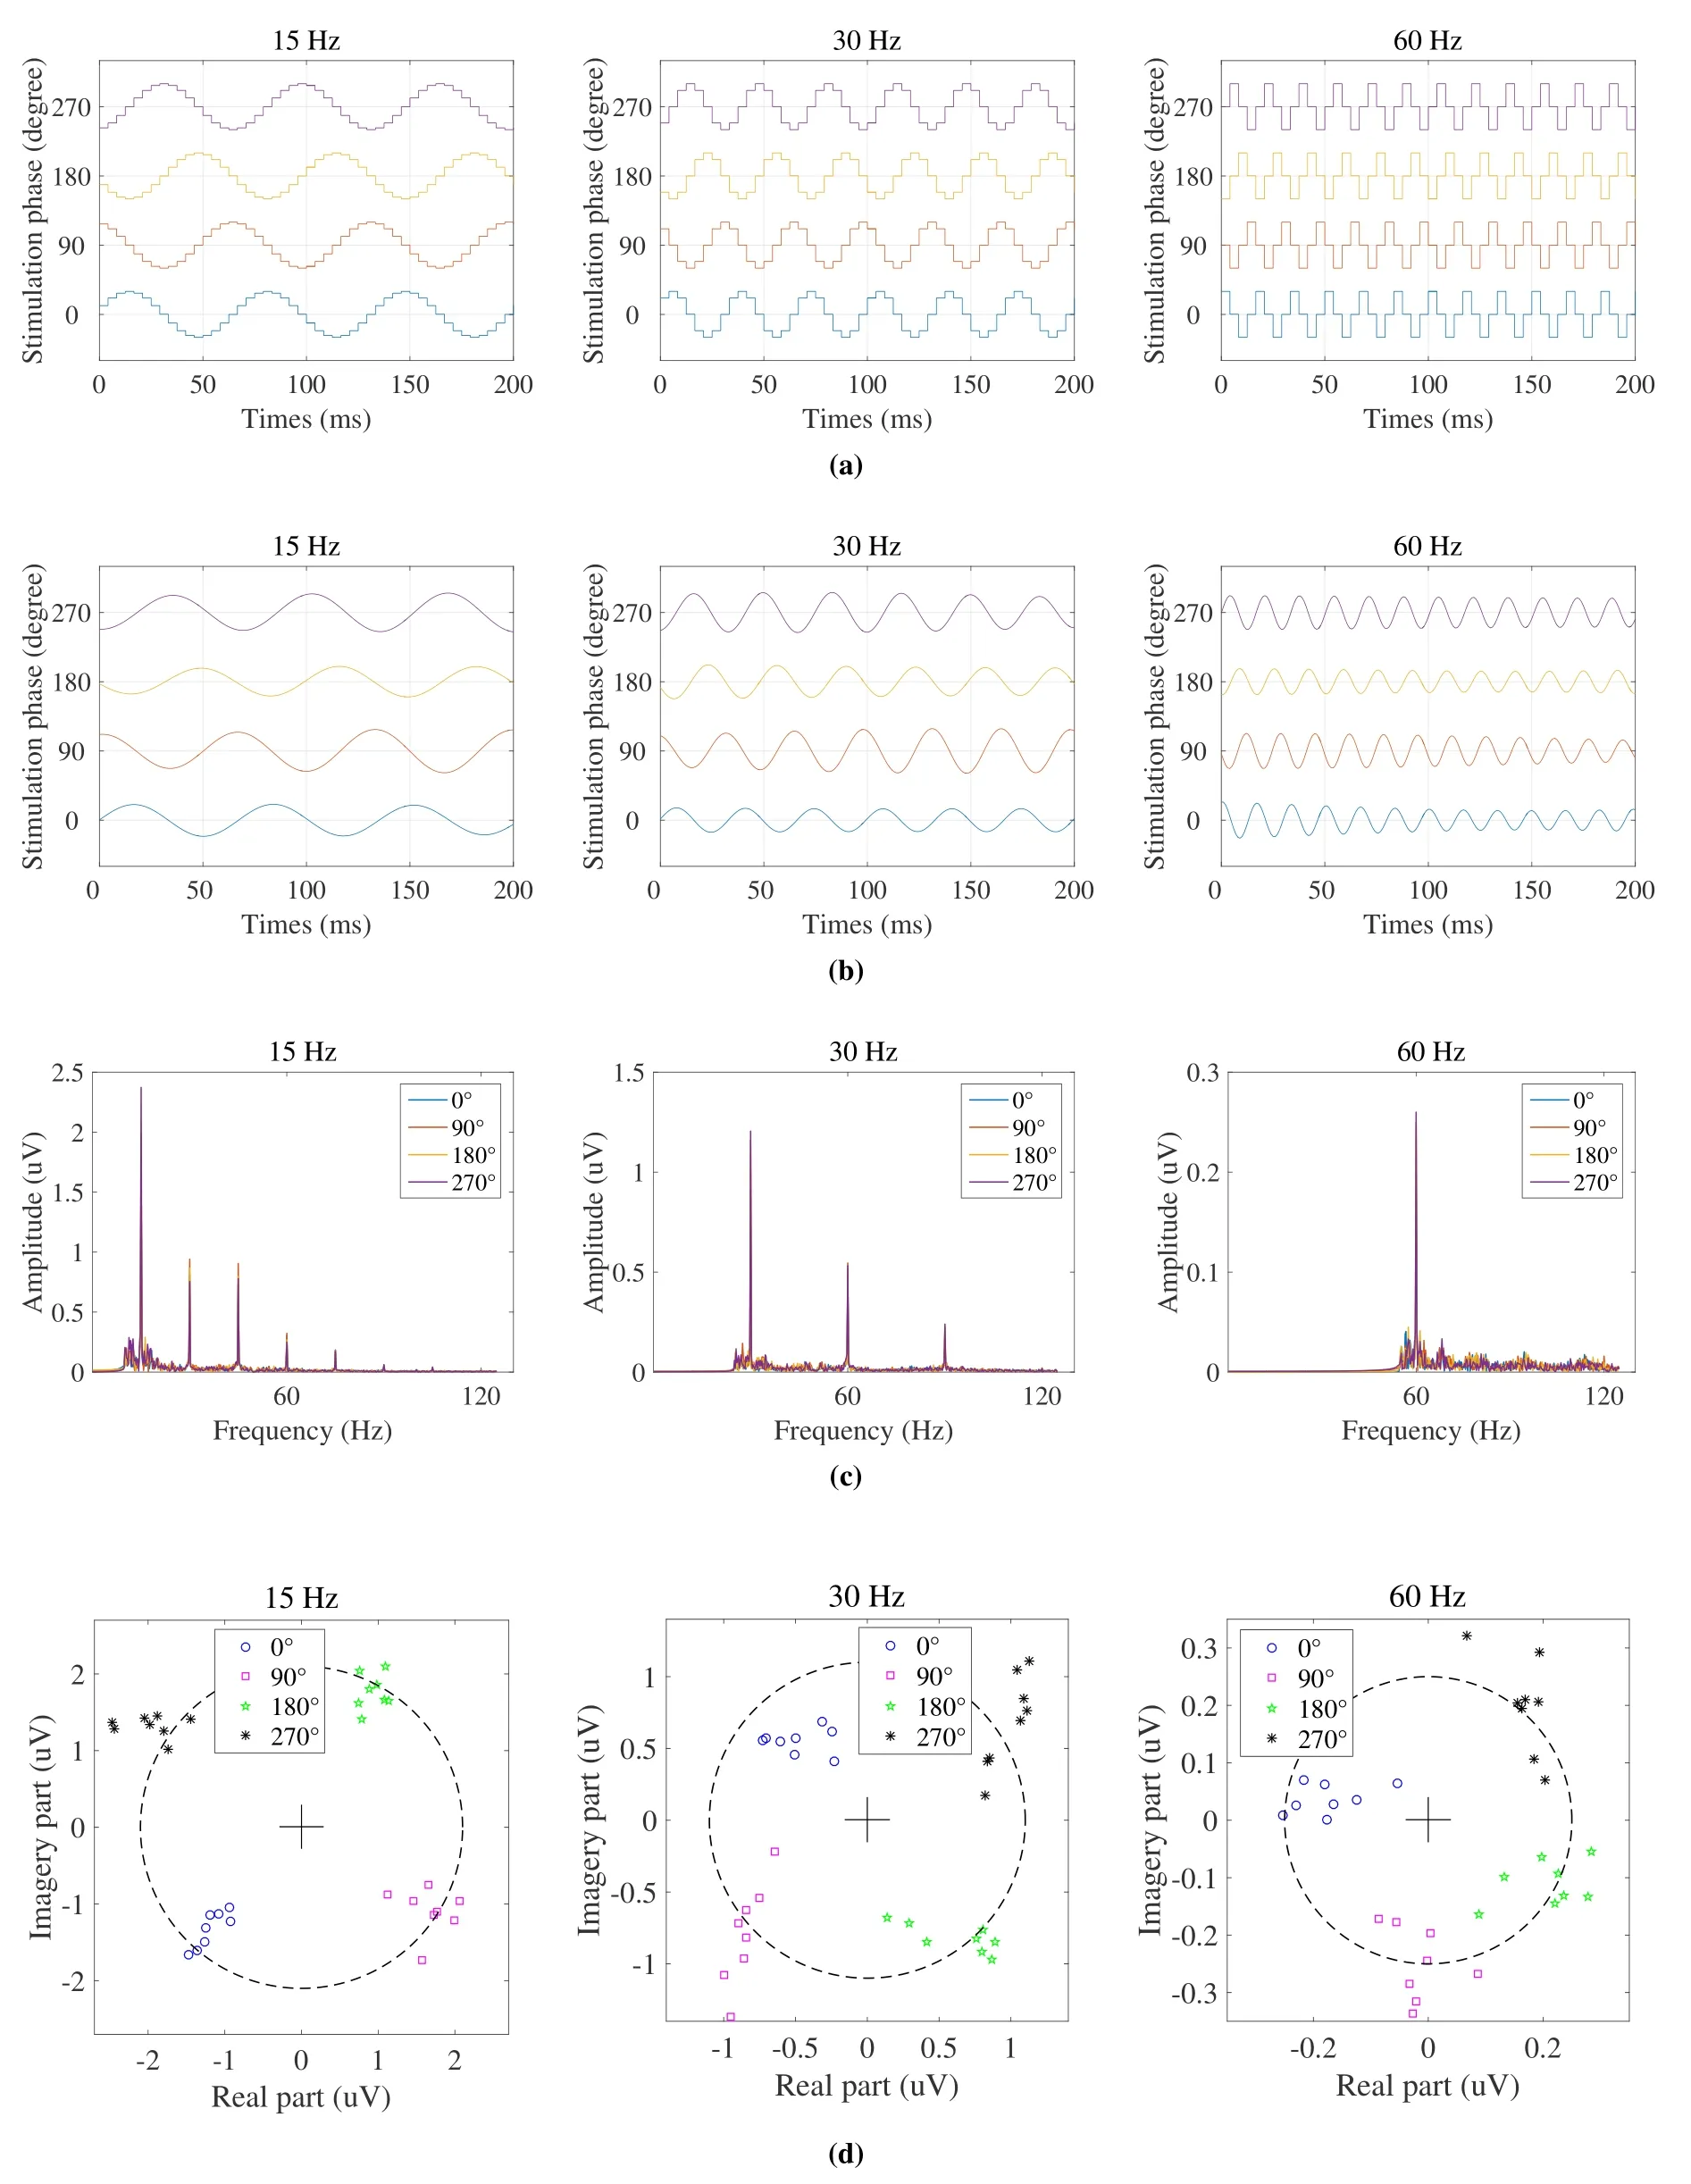
Figure 4. Phase coded(a)stimulus signals,(b)elicited SSVEPs,(c)amplitude spectra,and(d)scatter diagram of complex EEG spectra corresponding to 15Hz,30Hz and 60Hz stimuli respectively for one subject(S2)at the Oz electrode.
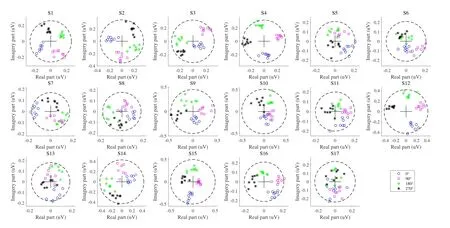
Figure 5. Scatter diagram of complex EEG spectra at 60Hz stimuli for each subject.
3.2 SNR of SSVEP
Figure 6 shows the SNRs of three frequencies averaged across four phases for each subject.The averaged SNR across subjects was 19.65±1.50dB at 60Hz, 25.18±2.08dB at 15Hz and 23.61±2.52dB at 30Hz.Moreover, the highest SNR of 31.90 dB (S9)was achieved at 60Hz, whereas the highest SNRs of 39.89dB (S7) and 44.81dB (S7) were achieved at 15Hz and 30Hz respectively.In particular, the SNR of 14 subjects at 15Hz was higher than 60Hz, with the largest difference of 25.52dB (S13).Paired ttests indicate that there was a significant difference in SNR between 15Hz and 60Hz (p <0.05).However, only 9 subjects had a higher SNR at 15Hz than 30Hz,and 10 subjects had a lower SNR at 60Hz than 30Hz.Paired t-tests indicate that the difference between 15Hz and 30Hz or 30Hz and 60Hz was not significant(p>0.05).These results suggest that SNR of high-frequency SSVEP is significantly lower than that of low-frequency SSVEP,but the relationship between frequency and SNR is different across subjects.
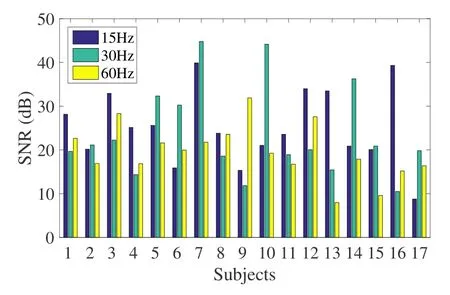
Figure 6. SNR of SSVEPs at 15Hz,30Hz and 60Hz stimuli for each subject.
3.3 Classification Accuracy and ITR
Figure 7 shows the averaged classification accuracy and ITR for all subjects using different data lengths(from 0.5s to 4s with a step of 0.5s) in the offline experiment, while the data epochs were extracted from 0.14s after stimulus onset.With the increased data length, classification accuracy increased while ITR decreased.ITR was the highest at 0.5s(60Hz: 29.80±4.65bpm, 15Hz: 74.00±2.71bpm,30Hz: 72.34±2.20bpm), with the lowest accuracy(60Hz: 70.07±4.15%, 15Hz: 97.65±1.37%, 30Hz:97.28±0.89%).The accuracy reached the highest at 4s (60Hz: 89.63±3.17%, 15Hz: 99.78±0.16%,30Hz: 99.41±0.44%), leading to lower ITR (60Hz:17.71±1.59bpm, 15Hz: 23.77±0.16bpm, 30Hz:23.48±0.36bpm).In addition, the accuracy and ITR of high-frequency stimulation were always lower than those of low-frequency and medium-frequency stimuli, and paired t-tests show that the differences were significant(p<0.05).
Regarding the 60Hz stimuli, there were clear individual differences in classification accuracy and ITR,as shown in Figure 8.For example, the accuracy of subject S9 was 95% with 0.5s data length, which resulted in an ITR of 65.37bpm.At the data length of 4s,the accuracy of five subjects(S2,S4,S6,S9,S12)achieved 100%,leading to an ITR of 24bpm.The lowest classification accuracy was 55%(S13)with 4s data length,which was higher than the chance level(25%).
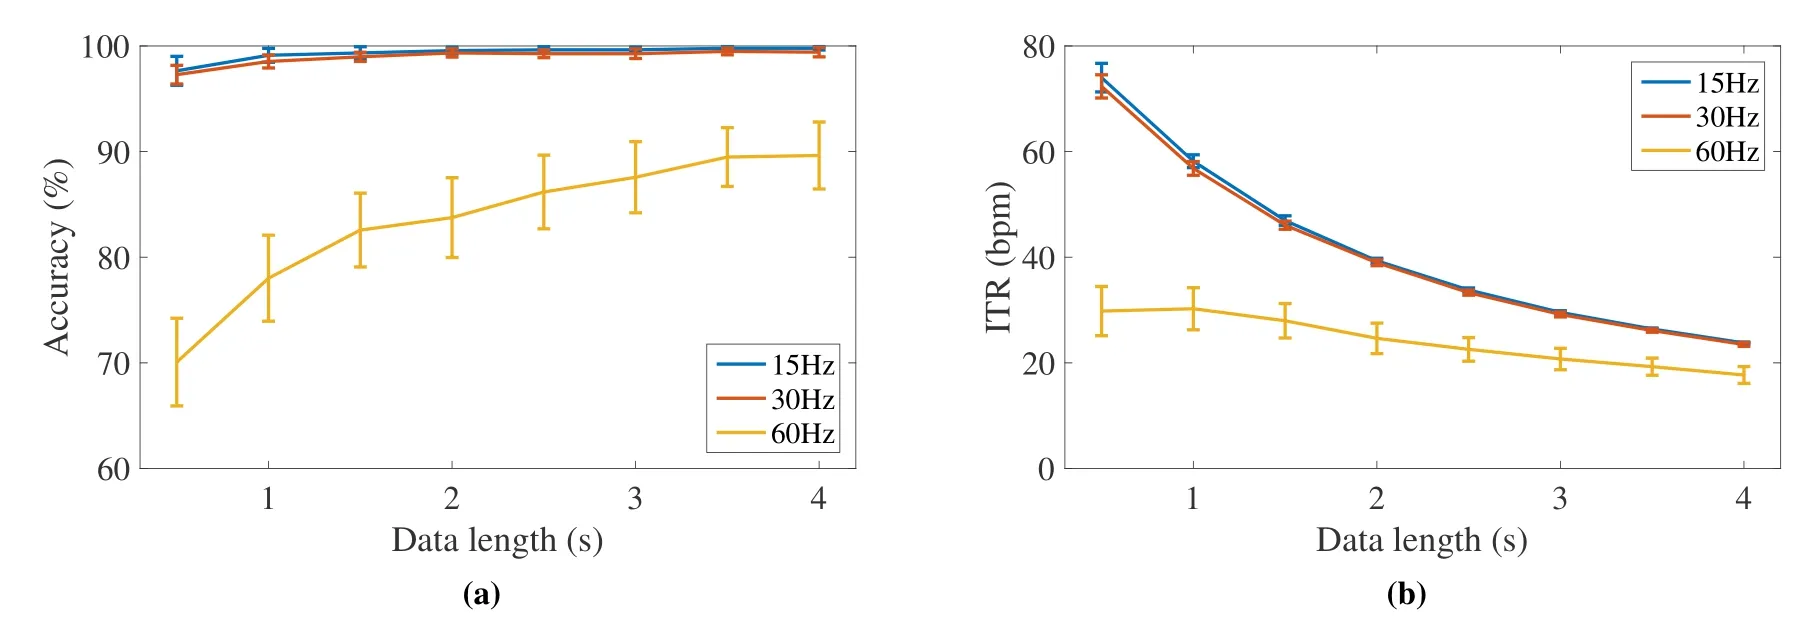
Figure 7. (a)Classification accuracy and(b)ITR with different data lengths(from 0.5s to 4s with a step of 0.5s)in the offline experiment.The error bars represent standard errors.
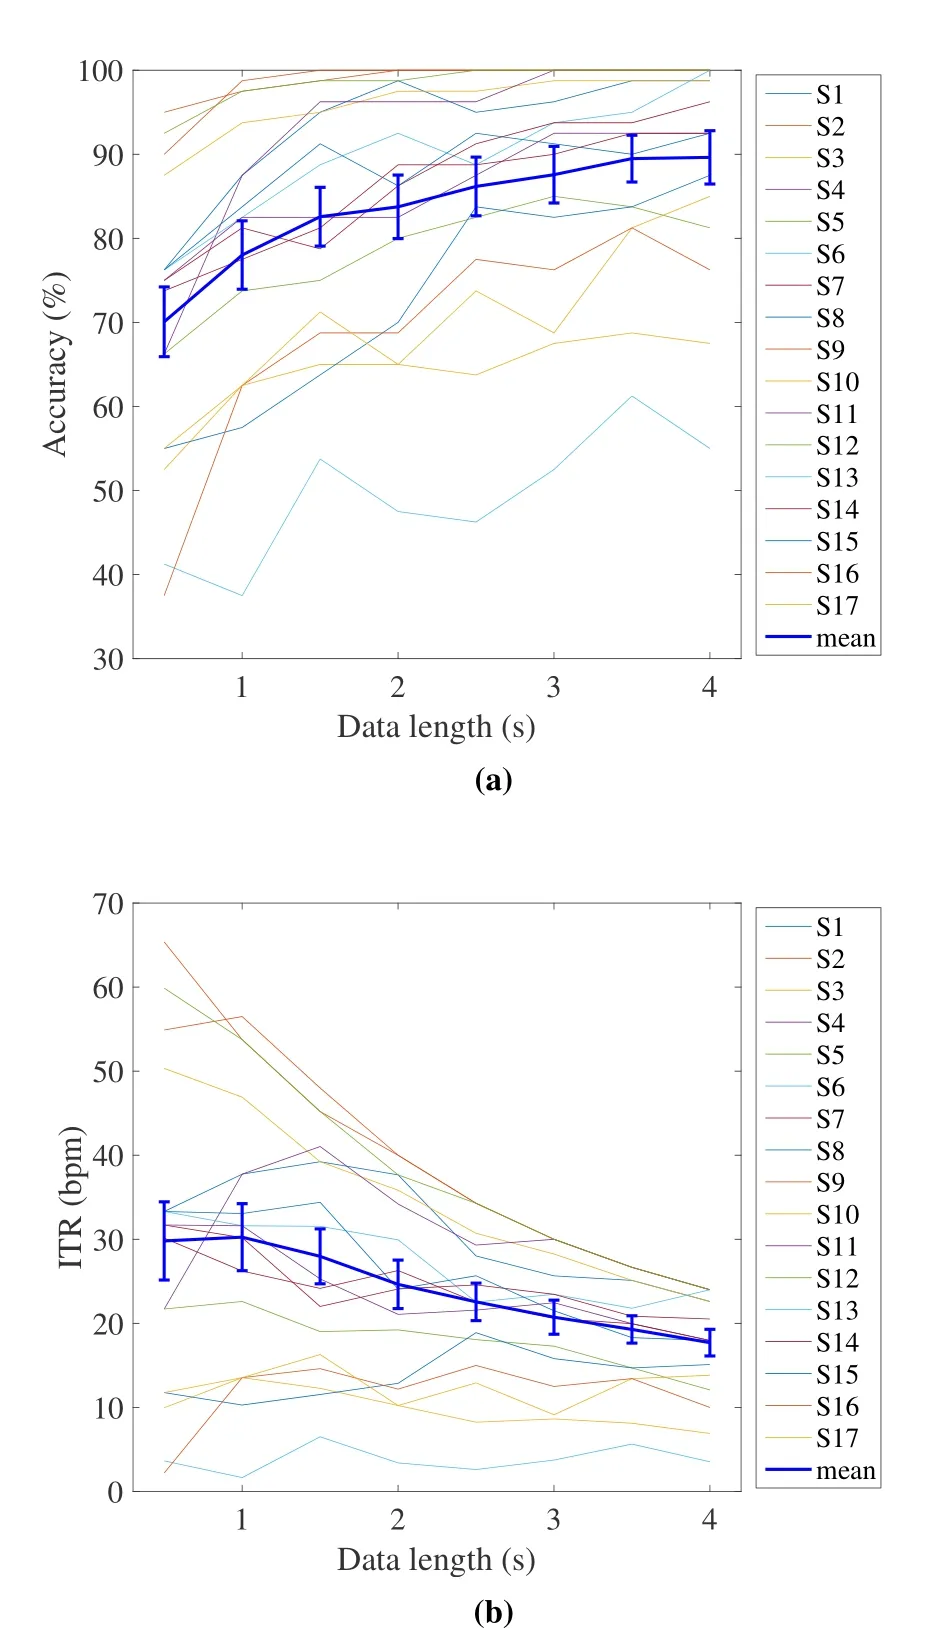
Figure 8. (a)Classification accuracy and(b)ITR at 60Hz stimuli for each subject in the offline experiment.The error bars represent standard errors.
Figure 9 shows the averaged classification accuracy and ITR for all subjects in the online experiment, and the overall variation trend was similar to that of the offline experiment.ITR reached the highest (60Hz: 30.14±5.34bpm, 15Hz:73.68±2.89bpm, 30Hz: 70.31±3.65bpm) with a data length of 0.5s, with the lowest accuracy(60Hz: 69.73±4.30%, 15Hz: 97.43±1.38%, 30Hz:95.83±1.84%).The accuracy was the highest at 4s data length (60Hz: 87.75±3.50%, 15Hz:99.88±0.12%, 30Hz: 98.04±1.02%), resulting in the lowest ITR (60Hz: 16.73±1.63bpm, 15Hz:23.87±0.13bpm, 30Hz: 22.51±0.74bpm).Paired t-tests show that the accuracy and ITR of highfrequency stimulation were also significantly lower than those of low-frequency and medium-frequency stimulation(p<0.05).
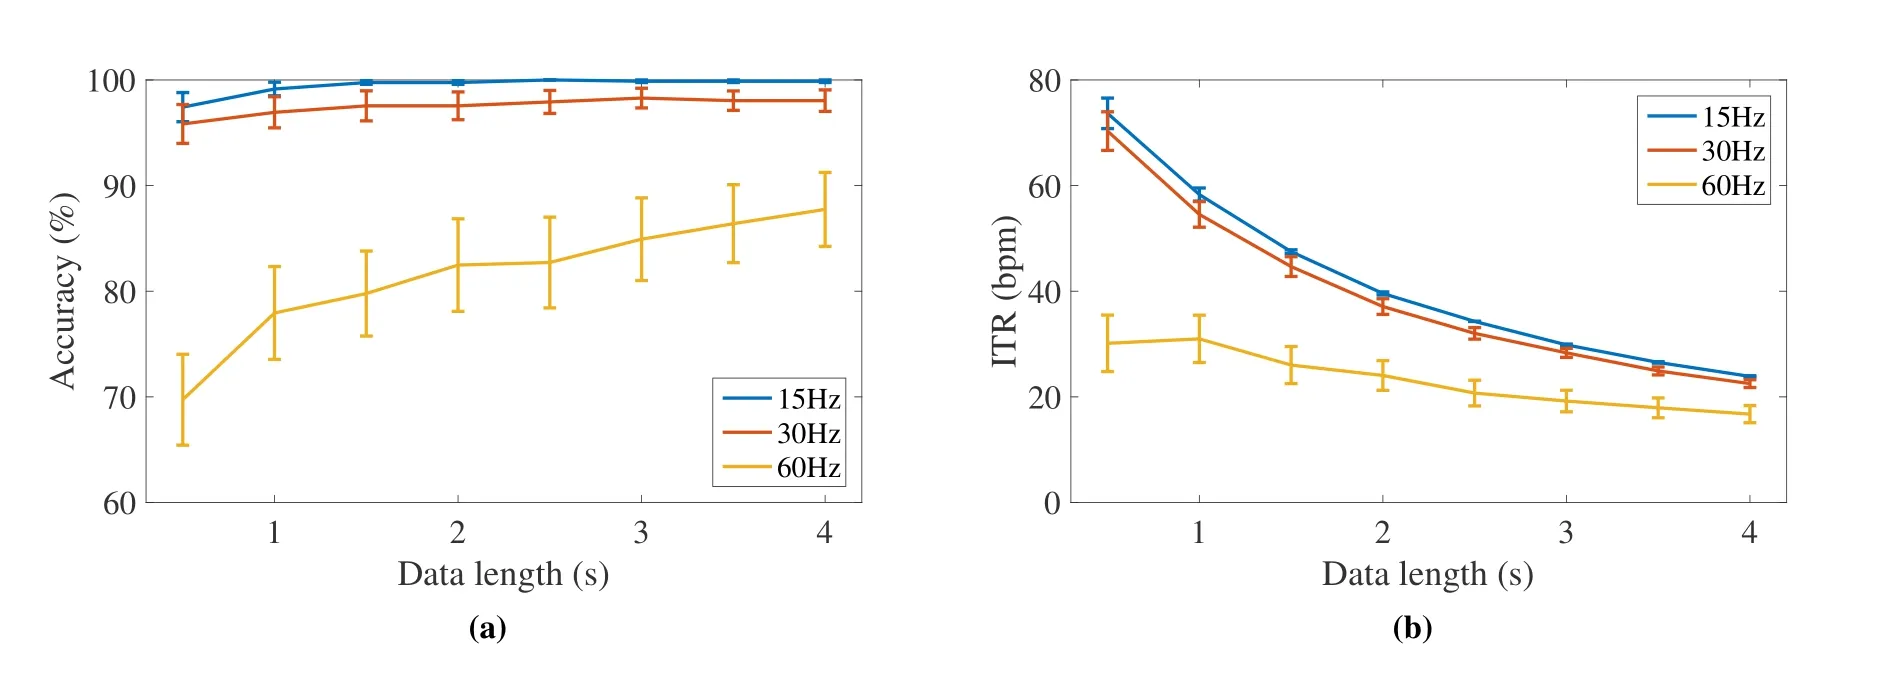
Figure 9. (a)Classification accuracy and(b)ITR with different data lengths(from 0.5s to 4s with a step of 0.5s)in the online experiment.The error bars represent standard errors.
For the 60Hz stimuli, the differences in classification accuracy and ITR among different subjects were also significant, as shown in Figure 10.For example,the maximum ITR was 80bpm when the data length was 0.5s, with the classification accuracy of 100%(S3).At the data length of 4s, three subjects(S2, S8,S12)obtained an accuracy of 100%,leading to an ITR of 24bpm.While the lowest classification accuracy was 52.08%(S13),and only three subjects had classification accuracy lower than 80%.
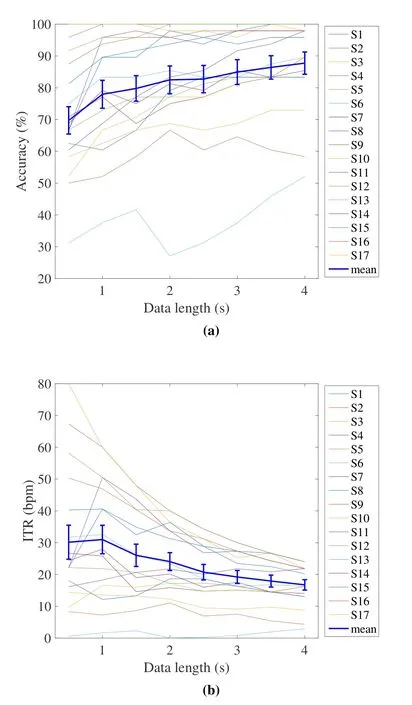
Figure 10. (a)Classification accuracy and(b)ITR at 60Hz stimuli for each subject in the online experiment.The error bars represent standard errors.
These results reveal that the classification accuracy of 60Hz is lower than 15Hz and 30Hz, but it is much higher than the chance level.Even for 60Hz,the phase-coded SSVEPs can be reliably detected by the TRCA method based on the individual template.Moreover,the differences across subjects also make it possible to optimize the parameters in the algorithm to further improve BCI performance.
3.4 Behavioral Test Results
Table 4 shows the averaged scores of comfortableness and perception of flicker from all subjects before and after the experiment.Regarding the comfortableness,the high-frequency stimulation made subjects feel more comfortable than low-frequency and mediumfrequency stimulation, and the comfortableness score reached the highest at 60Hz (before the experiment:4.47±0.12, after the experiment: 4.41±0.15).Paired t-tests show no significant difference in comfortableness scores before and after the experiment (p >0.05).On the other hand, the perception of flicker of the high-frequency stimulus was significantly lower than that of low-frequency and medium-frequency stimuli.Only a few subjects reported that the flickers were perceptible by 60Hz and 120Hz stimuli(before the experiment: 4.88±0.08 at 60Hz, 4.88±0.08 at 120Hz; after the experiment: 4.94±0.06 at 60Hz,5.00±0 at 120Hz).Paired t-tests indicate the scores of perception of flicker showed no significant difference before and after the experiment(p >0.05)except for 30Hz and 40Hz (p <0.05), and the flickering feeling was weakened after the experiment.It indicates that the subjects’ sensitivity to flickers decreases after a period of visual stimulation.Based on the above results, the 60Hz SSVEP BCI is more comfortable to use due to the finding that 60Hz flickers are generally imperceptible.

Table 4. The averaged results and standard errors of the behavioral test from 17 subjects before and after the experiment.
3.5 Correlation Analysis
The above analysis suggests that there are significant differences in SNR and classification accuracy between individual subjects.This study further analyzes the correlation of SNR and classification accuracy to determine whether subjects with higher SNR could achieve higher accuracy.To avoid the saturation of the classification accuracy, the data length of 15Hz and 30Hz was 0.2s, and that of 60Hz was 4s.Figure 11 shows the relationship between SNR and classification accuracy at three frequencies respectively.There was a significant positive correlation between SNR and classification accuracy at 60Hz(60Hz:r= 0.63,p<0.05),while the positive correlations at 15Hz and 30Hz were not significant(15Hz:r=0.44,p>0.05,30Hz:r= 0.54,p >0.05).These results indicate that higher SNRs correspond to higher accuracy and it is more evident at 60Hz.
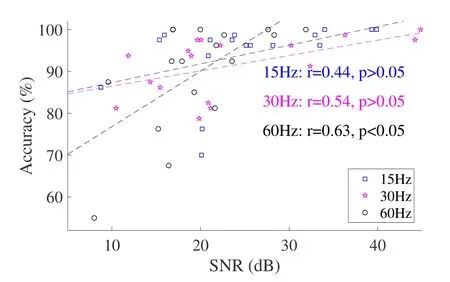
Figure 11. Correlation between SNR and classification accuracy at 15Hz,30Hz and 60Hz.Each sample corresponds to a subject.The dotted lines represent the results of linear regression.
Although high-frequency visual stimuli brings better comfortableness and lower flicker sensation for each subject, the classification accuracy is significantly lower.Therefore, this study explores whether the correlation between subjective perception and objective classification performance is significant.Figure 12 shows the relationship between the score and classification accuracy at the data length of 0.2s.The results of correlation analysis show that there was a significant negative correlation between each score and accuracy (before the experiment:r=−0.63 for comfortableness andr=−0.72 for perception of flicker, after the experiment:r=−0.62 for comfortableness andr=−0.68 for perception of flicker,p <0.05 for all cases).These results indicate that the improvement of comfortableness of BCI is inevitably accompanied by the degradation of system performance.This study tried to achieve a balance between them by using imperceptible flickers.
IV.DISCUSSION
The SSVEP BCI systems at 15Hz and 30Hz achieved high classification accuracy compared with other existing low-frequency and medium-frequency SSVEP BCIs, but ITR was relatively low due to the use of only four targets.For instance, Bin et al.designed a frequency-coded SSVEP BCI system with six targets(6.7Hz to 15Hz)and achieved classification accuracy of 95.3%and an ITR of 58bpm at the data length of 2s [5].Nakanishi et al.implemented an SSVEP BCI based on frequency-phase modulation (JFPM)method, in which 32 targets were flickering at different frequencies (8-15Hz) and 4 phases, respectively[33].The classification accuracy was 91.35% within 1s,and ITR reached 166.91bpm due to the large number of targets.For the medium-frequency SSVEP BCI,Lee et al.used LEDs to present eight targets with 31.25Hz and 45° phase difference between any adjacent targets[28].The averaged accuracy and ITR were 93.14%and 28.29bpm.The online BCI system developed in this study achieved high classification accuracy at the data length of 0.5s (15Hz: 97.43±1.38%,30Hz:95.83±1.84%)with ITRs of 73.68±2.89bpm at 15Hz and 70.31±3.65bpm at 30Hz.
Compared with other existing high-frequency SSVEP BCI systems, the system developed in this study achieved high classification accuracy and ITR with imperceptible flicker at 60Hz.For example,Alexandre et al.used a high-frequency (40-45Hz)SSVEP BCI to implement a hands-free menu navigation system with five-class in a virtual scene[36].The study found that the identification time was shorter when using full amplitude stimulation, resulting in a higher ITR of 15.7bpm.In contrast, the ITR under a lower amplitude stimulus was 13.6bpm, but subjects preferred to use this type of BCI with undetectable flicker.Chen et al.implemented a 45-target SSVEP-based BCI speller and the accuracy was 88.7%and ITR was 61bpm for 4s stimulation time at high-frequency stimulation (35.6-44.4Hz) [17].The online system developed in this study allowed subjects to use the SSVEP BCI at 60Hz in a more comfortable situation without flickering sensation.The averaged accuracy of 17 subjects achieved 87.75±3.50%at the data length of 4s,leading to an ITR of 16.73±1.63bpm.In particular, one subject achieved 100% accuracy with data length of 0.5s and ITR was up to 80bpm.
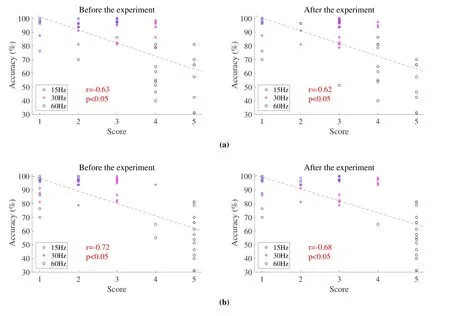
Figure 12. Correlation between classification accuracy and score of(a)comfortableness and(b)perception of flicker.Each sample corresponds to a subject.The red dotted lines represent the results of linear regression.
This study proved the feasibility of using 60Hz stimulus with imperceptible flicker to implement an SSVEP BCI,but there is still room for improvement in system performance.First of all,limited by the refresh rate of 240Hz, the minimum frequency for consistent presentation of imperceptible flicker is 60Hz.However,it can only present four phases stimulus at most,which is one of the reasons for the low ITR[24].There are ways to increase the number of targets.For example, a monitor with higher refresh rate (e.g., 360Hz)can be used to present more frequencies or phases,so as to realize hybrid frequency and phase coding methods.Second,data length and accuracy also affect ITR.In order to obtain high accuracy at 60Hz, the length of data was fixed at 4s,which can be shortened to improve the ITR.Moreover,due to the significant difference in classification accuracy between subjects, parameters of the TRCA algorithm (e.g., the frequency band of the filters and the time of visual delay)can be optimized for each subject to shorten the target identification time [34].In addition, due to the low amplitude of SSVEP at high frequency,other algorithms can also be explored to improve SNR and facilitate the detection and classification of SSVEPs.Finally,the flickering sensation of visual stimulation can be reduced by other approaches.For example, Chien et al.found that the visual stimulation composed of R/G or R/B at the frequency of 32Hz and 40Hz would not cause annoying flickering sensations, and the detection accuracy could reach more than 90%[37].By addressing these problems, the high-frequency SSVEP BCI with imperceptible flickers can be further improved and be potential for more practical applications.
V.CONCLUSION
This study developed an SSVEP-based BCI system that can stably present four phase-coded stimuli at 60Hz on an LCD monitor with a refresh rate of 240Hz.BCI performance and user experience were quantitatively compared with stimuli at 15Hz and 30Hz.The results showed that 60Hz, 15Hz and 30Hz stimulus signals can elicit SSVEPs with precise frequencies and separable phases.The SNR of SSVEPs evoked by high-frequency stimulus was significantly different from that of lower frequencies(19.65±1.50dB at 60Hz,25.18±2.08dB at 15Hz,23.61±2.52dB at 30Hz).With the TRCA method used for target identification, the online BCI system achieved an averaged accuracy of 87.75±3.50%and an averaged ITR of 16.73±1.63bpm at 60Hz with the data length of 4s.They were significantly lower than the averaged accuracy and ITR yielded by low-frequency and medium-frequency(99.88±0.12%and 23.87±0.13bpm at 15Hz, 98.04±1.02% and 22.51±0.74bpm at 30Hz).Further offline analysis with the data from the online experiment showed that the maximum ITR reached 80 bpm at 60Hz when the data length was 0.5s, with the classification accuracy of 100% (S3).The results of behavioral test indicated that, by adopting imperceptible flickers, the 60Hz SSVEP BCI system was more comfortable than the 15Hz and 30Hz BCI systems.
ACKNOWLEDGEMENT
This work was supported by the National Key R&D Program of China under grant 2017YFA0205903,the National Natural Science Foundation of China under grant 62071447, the Beijing Science and Technology Program under grant Z201100004420015,and the Strategic Priority Research Program of Chinese Academy of Science under grant XDB32040200.
- China Communications的其它文章
- Steady-State Visual Evoked Potential(SSVEP)in a New Paradigm Containing Dynamic Fixation Points
- Toward a Neurophysiological Measure of Image Quality Perception Based on Algebraic Topology Analysis
- Transfer Learning Algorithm Design for Feature Transfer Problem in Motor Imagery Brain-computer Interface
- Removal of Ocular Artifacts from Electroencephalo-Graph by Improving Variational Mode Decomposition
- BCI+VR Rehabilitation Design of Closed-Loop Motor Imagery Based on the Degree of Drug Addiction
- E3GCAPS:Efficient EEG-Based Multi-Capsule Framework with Dynamic Attention for Cross-Subject Cognitive State Detection

