Steady-State Visual Evoked Potential(SSVEP)in a New Paradigm Containing Dynamic Fixation Points
Yuang Li,Yong Ge,Xuefei Zhong,Xiong Zhang
School of Electronic Science&Engineering,Southeast University,Nanjing 210096,China
Abstract: Steady-state visual evoked potential(SSVEP)has become a powerful tool for Brain Computer Interface (BCI) because of its high signal-tonoise ratio, high information transmission rate,and minimal user training.At present,the edge information of each region cannot be identified in spatial coding based on SSVEP-BCI technology, and the user experience is poor.To solve this problem, this paper designed a new paradigm to explore the relationship between the fixation point position of continuous sliding and the correlation coefficient ratio in the dualfrequency case.Firstly, the standard sinusoidal signal was employed to simulate the Electroencephalogram (EEG) signal, which verified the reliability of characterizing the amplitude variation of test signal by correlation coefficient.Then, the relationship between the amplitude response of SSVEP and the distance between the fixation point and the stimulus in the horizontal direction was tested by Canonical Correlation Analysis (CCA) and Filter bank CCA (FBCCA).Finally,the experimental data were offline analyzed under the condition of continuous sliding of the fixation point.It is feasible and reasonable to detect the amplitude change of frequency component in SSVEP by utilizing the spatial coding method in this paper to improve the extraction accuracy of spatial information.
Keywords:SSVEP;spatial-coding; dual-stimulation;correlation coefficient ratio
I.INTRODUCTION
In recent years,the development trend of Brain Computer Interface (BCI) has been on the rise.It establishes an alternative direct connection communication system for humans between the brain and external devices without passing through the normal pathways of peripheral nerve and muscles[1].
As one of the main types of BCI methods, Steady State Visual Evoked Potentials(SSVEP)has a shorter response time (100ms) than other types of EEG signals, such as Motor Imaging (MI) and Event-Related Potentials(ERP),which makes it close to the communication rate that humans are accustomed to.In the current BCI research, the advantages of SSVEP are obvious, such as minimal user training, high signalto-noise ratio, high information transmission rate,and high recognition and classification accuracy rate,which make it obtain a positive feedback effect at the application level[2].
At present,the corresponding target and visual stimulus frequency were adopted in most of the existing multi-target positioning study.For example, a 60-target hybrid BCI spelling device with better performance than single mode is constructed by combining the information of hand Electromyography(EMG)and SSVEP[3].Xu et al.developed a high-speed hybrid BCI system,which trades off between the number of targets,accuracy and target selection time.108 targets were quickly and accurately identified with parallel P300 and SSVEP [4].Ge et al.developed a new dual-frequency offset coding method to label 48 targets.Unlike previous studies, this method weighs the relationship between the number of SSVEP targets and available frequency band[5].In addition,utilizing SSVEP and Mu features induced by multi-commands of flashing upper limb motion video to classify the patterns after combination,which is a novel method to increase the number of targets without losing accuracy[6].However,since most of the current researches focus on the mid-low frequency stimulation frequency band,that is,more obvious visual stimulation needs to be provided in the application,which is likely to cause visual fatigue and visual discomfort for users.At the same time,in real application scenarios,such as smart home applications combined with augmented reality[7–9], corresponding customized items are required as stimulus targets, which greatly increases the cost of application and brings new challenges to the popularization of BCI in smart home.Moreover, since in some applications,such as BCI speller[10,11],more frequency is demanded to code the target for achieving the target location function in SSVEP-BCI system.However,the frequency band of human response to visual stimulation is limited.How to locate multitarget based on limited frequency number has become an urgent problem.Regarding to the limitations of frequency coding,a large number of electrophysiological studies on VEPs and SSVEPs lateralization support the concept of spatial coding BCI.EEG signals from 8 channels near the occipital region were used for feature extraction.EEG was divided into two symmetric groups, with bilateral scintillation stimuli located on the left and right retina of each eye.To ensure that the scintillation frequency region can be projected to the contralateral occipital region, this method increases the number of targets by combining frequency information with spatial information [12].On this basis,the feasibility of single-stimulus and multi-objective BCI has been effectively proved by decoding visual spatial information and visual eccentricity information[13].Related application scenarios are gradually increasing,such as game navigation in two-dimensional scene of computer[14].However,in the case of only one stimulus, the encoding of spatial information can only be implemented in the vicinity of the stimulus.For targets with large distance stimulus,the classification accuracy is significantly reduced[15].Therefore,the combination of multiple stimuli is used to realize the decoding of visual spatial information to expand the spatial range in some researches [16].The disadvantage of this method is that the edges of each spatial region cannot be distinguished.
At the same time, in real life, the practical application based on SSVEP-BCI system is developing in the direction of simplicity, convenience and portability.For example,Omid et al.designed a portable BCI system,which can be effectively operated in Intensive Care Unit (ICU) with a wearable EEG cap and Android application on mobile devices as a visual stimulation and data processing module [17].There are some studies on how to develop lightweight and wearable EEG devices for ear insertion with high information transmission rate and accuracy [18, 19].Moreover, Kim et al.verified the feasibility of embedding top-down SSVEP stimulation into holographic lens for the automation of equipment control in Internet of Things space[20].
Based on the above researches, contraposing to the development trend of previous researches, too many stimulation targets result in various difficulties to carry out portable processing.In addition,direct attention to the stimulation area is easy to cause user visual discomfort.At the same time, the existing spatial information decoding method cannot identify the edge of each spatial area and the target cannot be selected continuously.In this regard,two stimulation frequencies and multiple sliding fixation points are adopted in this paper.It is found that the approximate range of gaze points can be located by analyzing the change trend of the correlation coefficient ratio of the two frequencies incomponents in the case of multi-target and dual-frequency,which provides the possibility for the future realization of vision in a small range or even precise positioning on the screen and plans to utilize the BCI to realize the continuous operation similar to the mouse.
II.MATERIALS AND METHODS
2.1 Subjects
There are two parts of subjects in this offline experiment.Experiment 1 included 12 healthy subjects with normal or corrected visual acuity(eight males and four females,aged 22–29 years old,with an average age of 25).In experiment 2,three healthy subjects(one male and two females) with normal vision or corrected to normal vision.All of them had some experience with SSVEP-based BCI experiments.Each subject participated in the experiment voluntarily.Each subject was informed the purpose, content and precautions of the experiment in advance, and signed his or her written informed consent of the experiment.
2.2 Data Acquisition
EEG data were acquired using Neuracle system at sampling rate of 1000 Hz.The trigger signal in the input EEG system was applied to mark the specific location of the cross.In experiment 1,the trigger signal at the moment when the cross appeared was recorded to the EEG system, and in Experiment 2, the continuous sliding cross was presented at the leftmost or right-most moment between the two stimulus blocks as the trigger signal input to the EEG system.The equipment mainly includes EEGCap8-SSVEP electrode cap,power supply,amplifier and Neuracle EEG Recorder.Eight dry electrodes(PO5,PO3,POz,PO4,O1, Oz and O2) were used to record SSVEP signals in parietal bone and occipital area.The two reference electrodes were placed behind the ears.The electrode position distribution is shown in Figure 1.In order to enhance the conductivity of the electrode, the skin of the subjects was wetted with saline before the experiment, and the impedance value of all the conduction channels was kept below 5kΩ.
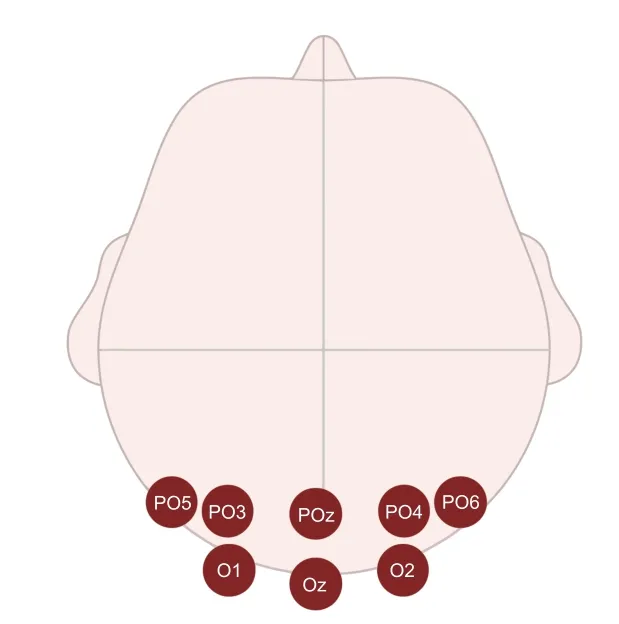
Figure 1. EEG electrode position distribution map.
2.3 Visual Stimulation
Taking into account the traditional frequency division method, that is, the method of using black and white frames to set the frequency, which is limited to the screen refresh rate of the computer display,that is,the stimulus frequency can only choosef=R/N(where R is the screen refresh rate and N is a positive integer).For example, the stimulus frequency is 12 Hz,which is 12 white frames and 12 black frames per second, for a total of 24 frames.In this paper, we used a novel sampled sinusoidal stimulation method [21]to alleviate the eye fatigue of the subjects by gradually changing the gray value of each frame from 0 to 255.Generally,the screen brightness can be adjusting by the stimulus sequenceS(n,f,ϕ)corresponding to frequencyfand phaseϕ,as shown in Eq.(1).

wheresin()generates a sine wave,nis the frame index andRis the screen refresh rate.The dynamic range ofS(n,f,ϕ)is from 0 to 1,and the corresponding brightness increases gradually from black to white.One advantage of this method is that any phase and half of the screen refresh rate of any frequency stimulation can be obtained.
2.4 Experimental Procedures
In this paper, two experimental paradigms are implemented and developed by Psychophysics Toolbox Version 3 (PTB-3) in MATLAB [22].Stimuli were presented on a 21.5-inch LCD screen with a resolution of 1920×1080 pixels and a refresh rate of 60 Hz at a viewing distance of approximately 60 cm.The schematic diagram of visual stimulation interface in experimental paradigm 1 is shown in Figure 2(a).Fixation point F3 is located in the center of the display screen,and other fixation points are evenly distributed on both sides of F3 with a spacing of 150 pixels.A 15Hz stimulus square of 400×400 pixels is located on the right of F3 with a horizontal spacing of 400 pixels.Fixation points appeared successively from F1 to F5, and each time was 6 seconds.The participants underwent 14 trials,with one trial per gaze point during the experiment.The visual stimulus interface of experimental paradigm 2 is shown in Figure 2(b).Stimuli were presented within a 300×300 pixels square,the horizontal distances between two stimuli were 400 pixels.The fixation point slides back and forth continuously and uniformly on the horizontal line between the two squares,its movement track is shown in the blue dotted line and the blue arrow indicates the direction of motion in Figure 2(b).The starting position is the cross of the left stimulus block.One round trip is 12 seconds.Subjects were asked to gaze at the cross and moved their eyes with it.Furthermore, the subjects were asked to sit in a comfortable chair in a dimly lit soundproof room and avoid blink and body movement as much as possible during the stimulation period.
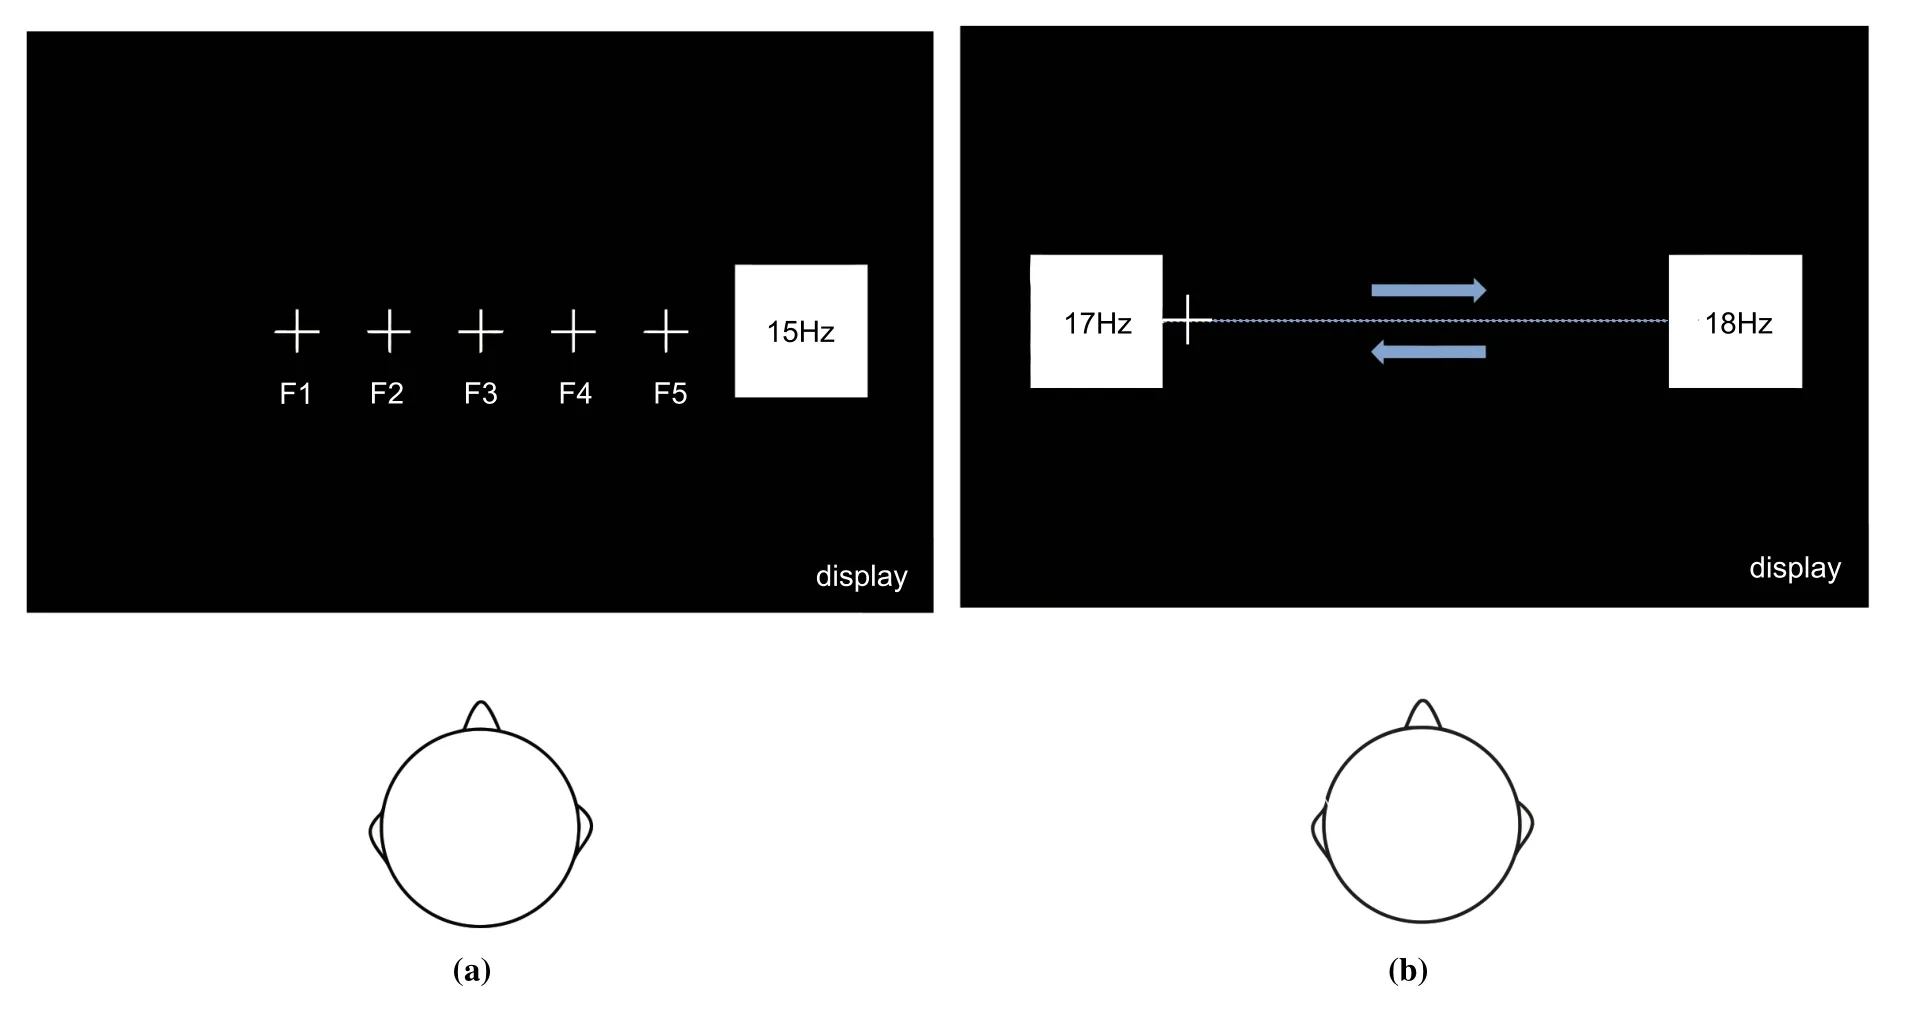
Figure 2. Visual stimulation interface schematic.
2.5 Simulation Signal
When being stimulated by a fixed frequency,the visual cortex of human brain will produce a continuous sinusoidal waveform response with the same fundamental frequency and higher harmonic frequency components of the stimulus frequency, which is SSVEP, and the characteristic of this frequency following is the rhythm assimilation of SSVEP.In this paper, three kinds of simulation signals were designed to simulate the EEG signals under the condition of dual stimulation in order to predict the rationality of experimental paradigm and data analysis.
The first signal is a series of signalsXtest1with the sampling rate of 1 000 Hz and the time length of 2 s.The amplitude change of the signal is as follows:
wheref1is 17 Hz,f2is 18 Hz,Ais the amplitude value of the 17 Hz component in the pre-set signalXtest1,Achanges linearly from 0.05 to 0.95 with 0.05-degree,tis a time series.To be closer to reality,the second signal is the signalXtest2with the sampling rate of 1000 Hz and the time length of 2 s superimposed on a Gaussian white noise.

wherenoisyis Gaussian white noise.The third signal is a series of signalsXtest3with the sampling rate of 1 000 Hz and the time length of 2 s.The amplitude change of the signal is as follows:
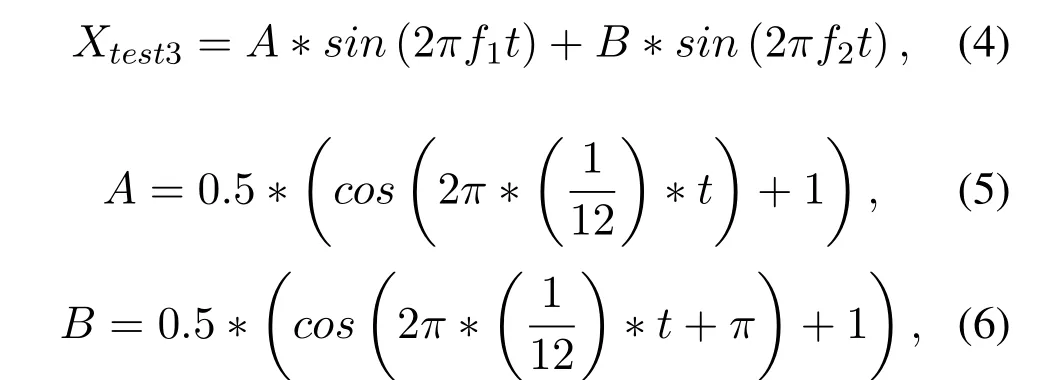
wheref1is 17 Hz,f2is 18 Hz,Ais the amplitude value of the 17 Hz component in the pre-set signalXtest3,Bis the amplitude value of the 18 Hz component in the pre-set signalXtest3, and the amplitude values are both sinusoidal changes with a period of 12 s.And the amplitude values of the 17 Hz and 18 Hz components change alternately,andtis a time series.Moreover,this paper employed a sliding window analysis with a time window of 2 s and a moving step of 0.2 s in the spectrum analysis of the third signal.
2.6 Data Analysis
As a weak and easily disturbed non-stationary signal,the original EEG collected through the electrode will be mixed with some noise and artifact components inevitably, mainly including power frequency interference noise and some physiological signal noise from internal human organs,such as EMG artifact,ECG artifact, and eye electrical artifact.Therefore, the EEG signal was preprocessed before analysis.Firstly, to reduce the computation and memory costs, all data epochs were down-sampled to 250 Hz and band-pass filtered from 49 to 51 Hz to remove the external highfrequency noise and power frequency interference.Canonical Correlation Analysis(CCA)and Filter bank CCA algorithms are used for analysis.For the former,band pass filtering of 10-30 Hz is used first, and then the analysis is carried out.For the latter, filter banks are used to divide the frequency bands of SSVEP components into 7 equally spaced sub-bands.The details are as follows.
2.6.1 Canonical Correlation Analysis (CCA)-Based Method
Canonical Correlation Analysis (CCA) has been widely used in SSVEP-based BCI for frequency classification due to its effectiveness and robustness [23,24].CCA is a multivariate statistical method that infers information from the cross-covariance matrix.The correlation of the two sets of variables is simplified to the correlation of two variables by finding the linear combination of two sets of variables.Moreover, more obvious advantages of CCA are presented in multi-channel analysis, namely, more channel information is contained and feature extraction of visual evoked potentials is more effective.Supposing two sets of variablesXandY,the EEG multichannel dataXare set as
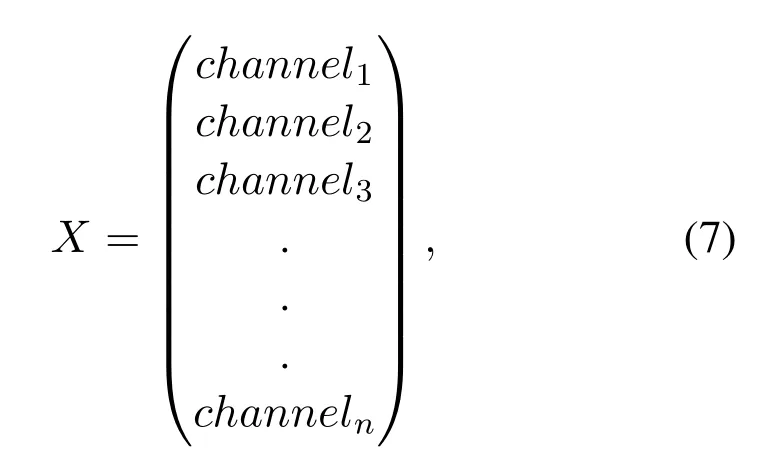
wherenis different channel numbers.The sinecosine reference signalsYiare set as
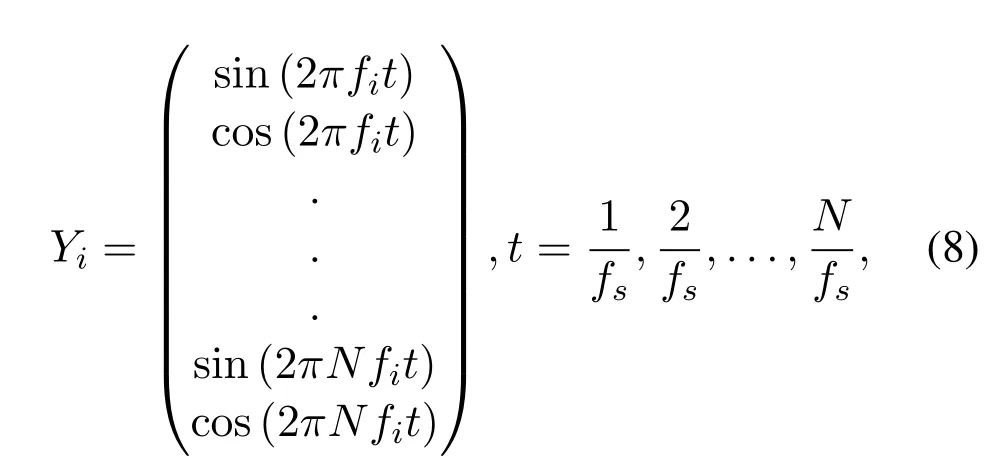
wherefiis theith stimulus frequency,Nis the harmonic order offi,fsis the sampling rate.CCA seeks a pair of weight vectorsWxandWyfor two sets of multidimensional variablesXandYto maximize the correlation between linear combinationsx=WxTXandy=WyTYby solving the following problem:

whereVis variance andCis covariance.ρis recognized as

2.6.2 Filter bank CCA-Based Method
Because the SSVEP signal is composed of brain responses at frequencies identical, harmonics and subharmonics.Harmonic components can also provide useful information for frequency detection and improve the accuracy of frequency detection, which has been demonstrated in previous studies[25].However,the frequency identification algorithm based on CCA only considers the fundamental frequency information.Therefore,the pre-processing method of decomposing SSVEP signals into multiple subbands,namelythe method of filter bank canonical correlation analysis (FBCCA)[26], has been widely used in the development of BCI and effectively improves the frequency detection accuracy of SSVEPs.The FBCCA method consists of three major procedures: (1)The design of filter bank: the original EEG signalXis filtered byNsubband filter, and decomposed intoNsubbandXSB1,...,XSBN.(2) Conduct CCA processing between each subband and the reference signal respectively, and calculate the maximum canonical correlation coefficient of each subband.For the frequency components of each sub-band, the weighted sum of squares of correlation coefficients at different frequencies is calculated as

where the weighting functionq(n),which can correct different frequency components is defined as

where a is 1.25, b is 0.25.(3) The most relevant frequency is obtained by the weighted correlation coefficientcorresponding to theMstimulus frequencies as

III.RESULTS AND DISCUSSIONS
3.1 Signal Simulation and Algorithm Validation
According to the apparent periodicity and rhythmic assimilation of the SSVEP signal,a series of 17 Hz and 18 Hz sinusoidal signalsXtest1with different amplitudes of 2 s duration were used to simulate the two frequency components of the SSVEP signal under ideal conditions to compare the accuracy of the FFT and CCA algorithms for analyzing signal amplitude variations.Table 1 shows the results obtained from FFT and CCA for ideal signalsXtest1of 2 seconds with different amplitudes of 17 Hz and 18 Hz components.

Table 1. the analysis results of ideal signal Xtest1 by FFT and CCA.
As shown in Table 1,it could be concluded that the amplitudes of the 17Hz and 18Hz frequency components obtained by FFT analysis were exactly the same as the preset amplitude values.Although the amplitude and correlation coefficient calculated by CCA ofXtest1were not identical with the preset amplitude value of the two components, the size relationship of the amplitude and correlation coefficient between 17 Hz and 18 Hz components was consistent with that of the preset two-component amplitudes and the amplitude ratio and the correlation coefficient ratio of the two components were completely the same as the preset amplitude ratio.
Obviously, in the ideal case of noiselessness, since the preset ratio of 17Hz and 18Hz amplitudes inXtest1signal, the amplitude ratio of two components obtained by FFT,the ratio of correlation coefficient and the amplitude from CCA were completely identical,both methods could accurately characterize the amplitude ratio relationship of the corresponding components of the test signal.
Figure 3 shows the spectrogram of FFT and CCA of signalXtest2obtained by superimposing Gaussian white noise on two ideal signalsXtest1with different amplitudes of 17 Hz and 18 Hz components.According to Figure 3(a-b) and Figure 3(c-d), the amplitude values of 17 Hz and 18 Hz components are far greater than the amplitude values of the superimposed interfering signals near these two frequencies.Furthermore,through the comparison between Figure 3(a) and Figure 3(b), the comparison between Figure 3(c) and Figure 3(d) shows that the noise amplitude value near the 17,18 Hz frequency obtained by CCA method is smaller than that obtained by FFT.
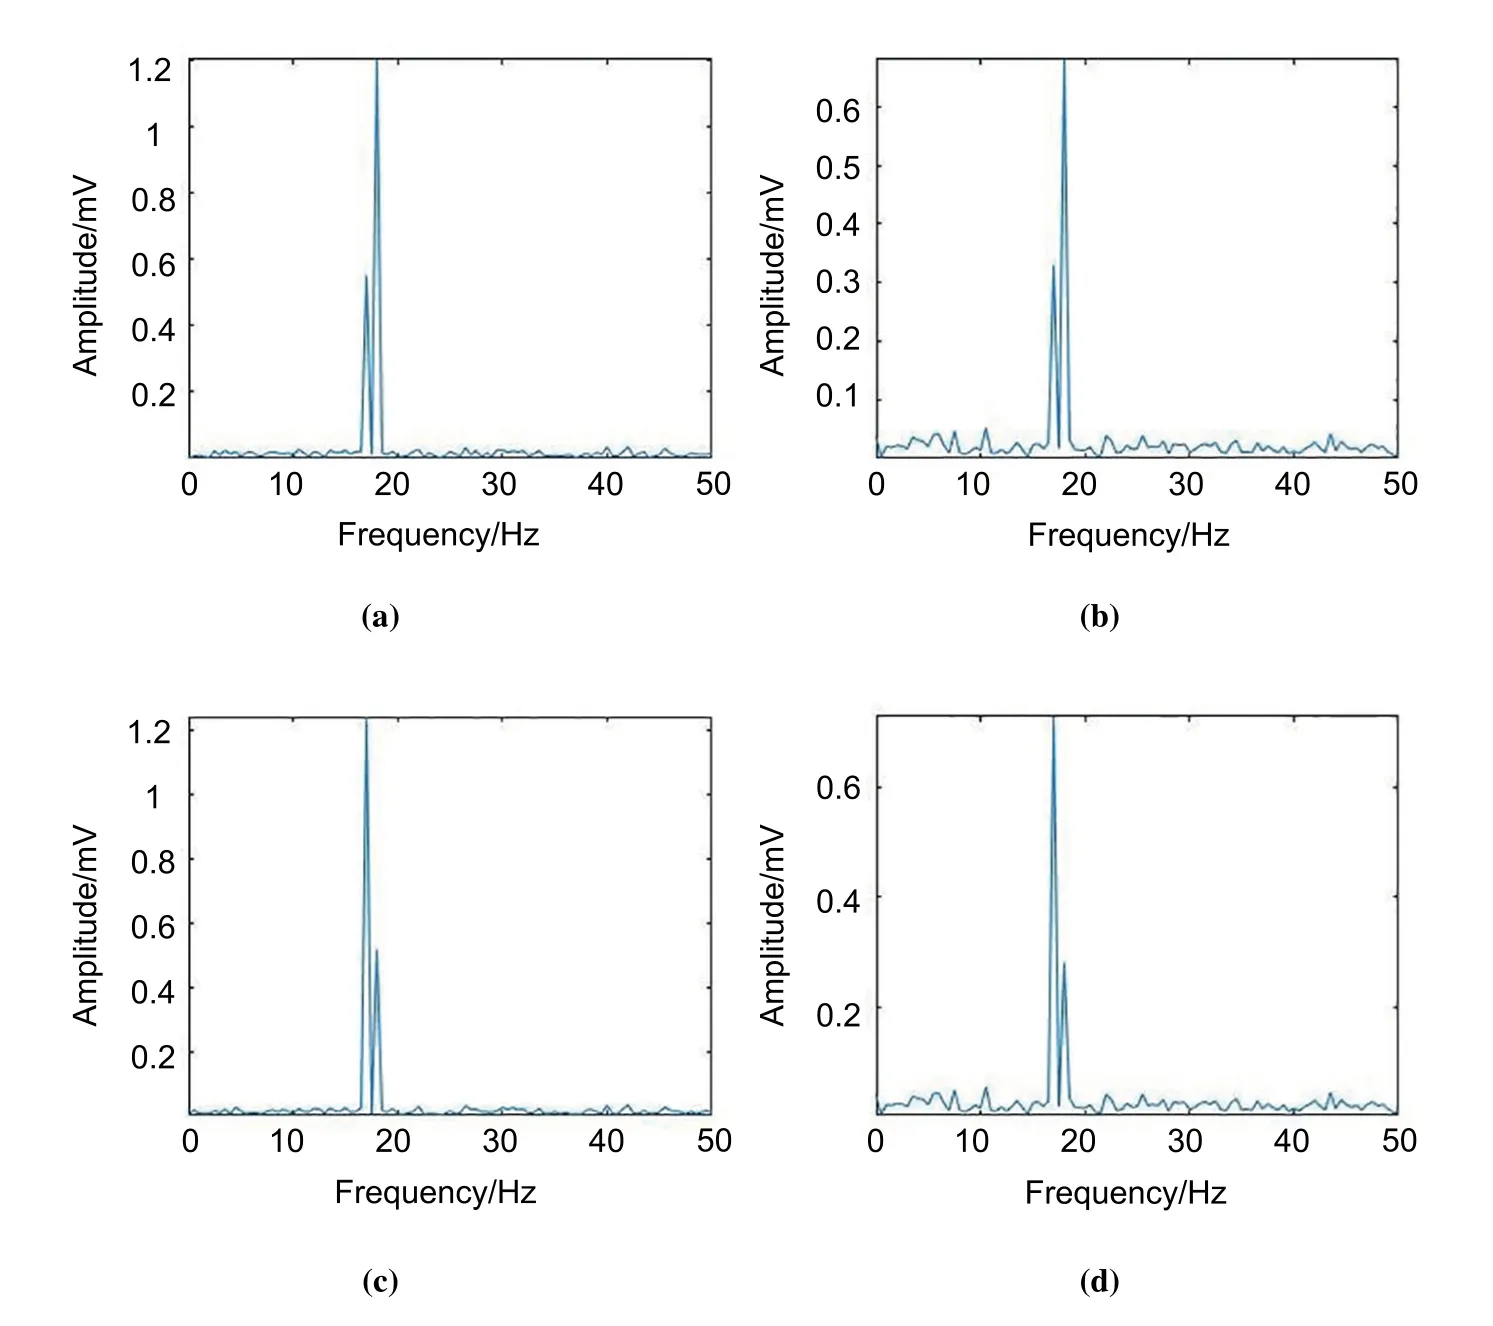
Figure 3. (a)Frequency spectrum obtained by CCA analysis of Xtest2 with amplitude values of 0.3 and 0.7 for 17 Hz and 18 Hz components respectively after superposition of Gaussian white noise.(b) Frequency spectrum obtained by FFT of Xtest2 with amplitude values of 0.3 and 0.7 of 17 Hz and 18 Hz components after superposition of Gaussian white noise.(c) Frequency spectrum obtained by CCA analysis of Xtest2 with amplitude values of 0.7 and 0.3 for 17 Hz and 18 Hz components respectively after superposition of Gaussian white noise.(d) Frequency spectrum obtained by FFT of Xtest2 with amplitude values of 0.7 and 0.3 of 17 Hz and 18 Hz components after superposition of Gaussian white noise.
In consequence, within a certain range of noise,CCA algorithm has good anti-noise performance,which can improve the signal-to-noise ratio ofXtest2signals,and accurate extraction of the magnitude relationship of two required frequency components in the EEG signals mixed with noise.To find out which variable can represent the amplitude change of two frequency components in the simulation signals,a series of noise-containing sinusoidal signalsXtest2with different amplitudes of 17 Hz and 18 Hz components in 2 seconds were analyzed by CCA.Figure 4 presents the comparison between the analysis results of the signalXtest2and the preset amplitude and amplitude ratio,whichXtest2was generated by superposition of Gaussian white noise.It was obvious from Figure 4 that the amplitude and correlation coefficient obtained by CCA had the same change tendency with the preset component amplitude value.Different from the analysis results of ideal signalXtest1in Table 1,the variation curve of the ratio ofρf17andρf18acquired fromXtest2was not identical as the amplitude ratio of signal preset exactly,but the growth trend was the same.In addition, the increment speeds of the two curved lines were of dissimilarity,and the growth rate slowed down when the correlation coefficient was relatively large.In comparison to the change of single variable such as correlation coefficient or amplitude,the correlative coefficient ratio and the amplitude ratio curves of 17 Hz and 18 Hz components ofXtest2were in better agreement with the variation curve of the preset amplitude proportion of theXtest2signal.Therefore,the ratio of the correlation coefficient obtained by CCA algorithm or the amplitude ratio in the spectrum of the comprehensive signalxcould be directly and accurately reflected in the variation of the amplitude of the 17 Hz and 18 Hz signal components in the test signal.
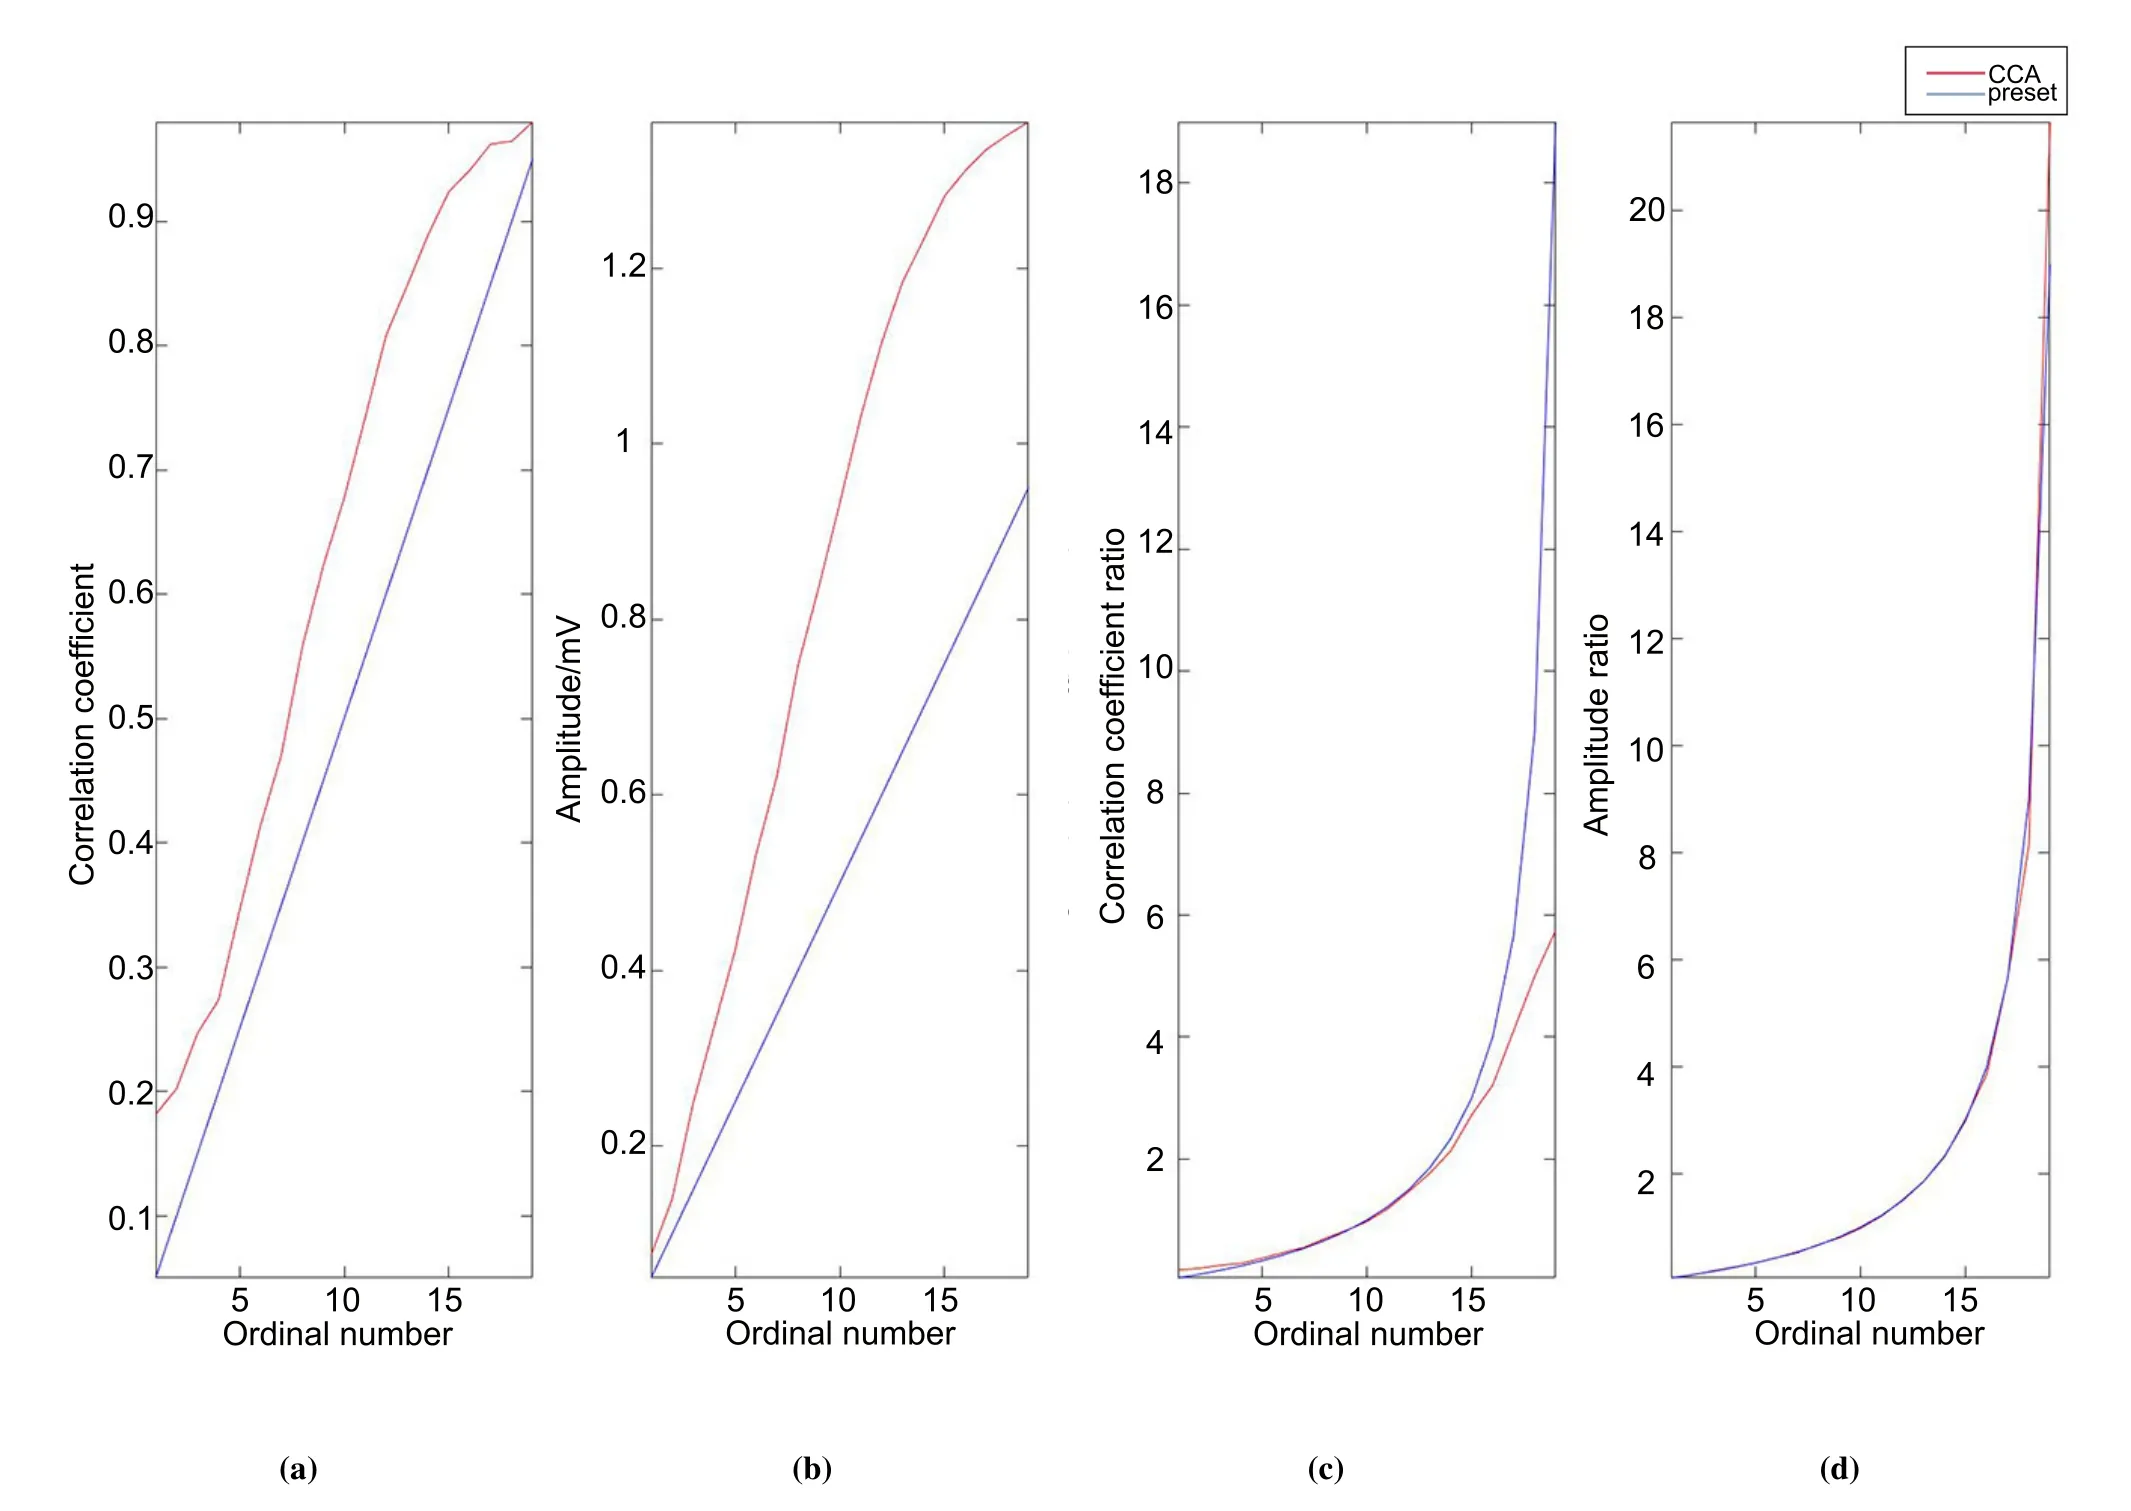
Figure 4. Comparison of CCA results of Xtest2 after adding Gaussian white noise and setting values,(a)the change curve of amplitude of ρf17 (red line)and preset 17 Hz component in Xtest2(blue line),(b)the change curve of amplitude of 17 Hz component through spectrum analysis(red line)and preset 17 Hz component(blue line),(c)the preset amplitude ratio(blue line)and the ratio of ρf17 and ρf18(red line),(d)the preset amplitude ratio(blue line)and the amplitude ratio of 17 Hz and 18 Hz components in Xtest2 (red line).
Subsequently, the feasibility of CCA was further verified by using the 60-second signalXtest3with sinusoidal amplitude,which had a data length of 60000.Different from the signals with constant amplitude ofXtest1andXtest2, as shown in Figure 5, sinusoidal variations with a period of 12s were presented in the amplitudes of the two components of the signalXtest3.Figure 6 demonstrates the curves of the amplitude of 17 Hz and 18 Hz through moving window frequency spectrum analysis ofXtest3with sampling rate of 1000 Hz,ρf17andρf18gained by CCA and the amplitude ratio and correlation coefficient ratio.The Figure 6 indicated that with the sliding of time window, both coefficient of correlation and the amplitude changes of 17 Hz and 18 Hz components were alternating sine curves, and the variation periodicity was 12 seconds,which was consistent with the preset amplitude change period.Likewise, the ratio of related coefficient and the amplitude ratio illustrated a periodic change of first increasing and then decreasing, which was also consistent with the 12-second period of preset amplitude ratio change.
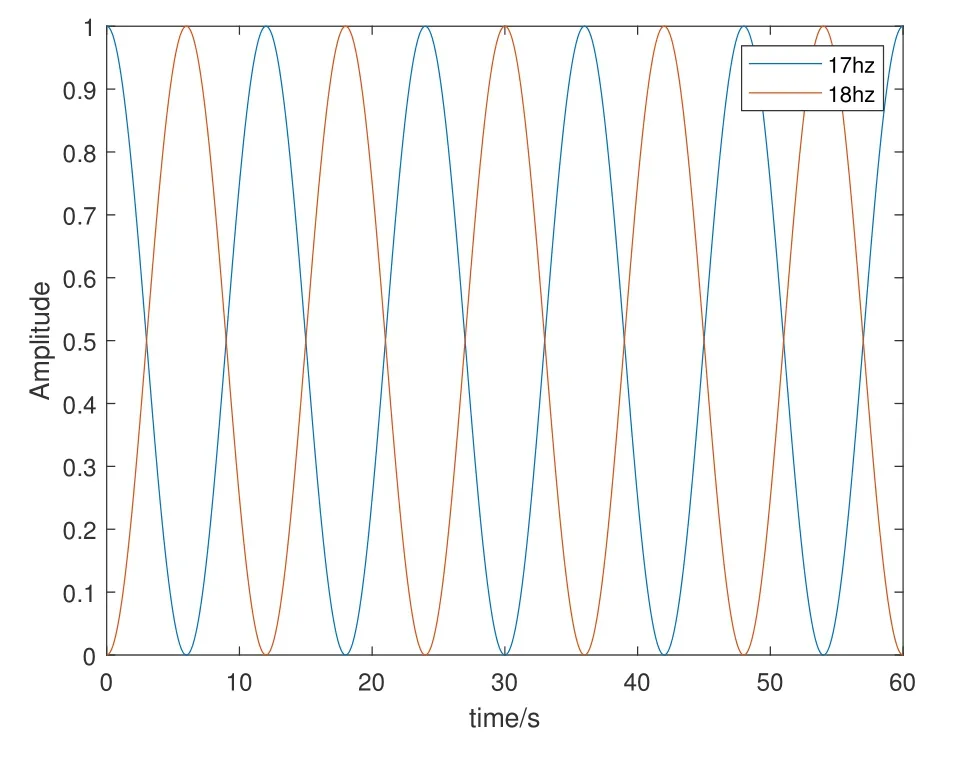
Figure 5. The amplitude variation of 17 Hz and 18 Hz components in 60-second simulation signal Xtest3 with sinusoidal amplitude variation.
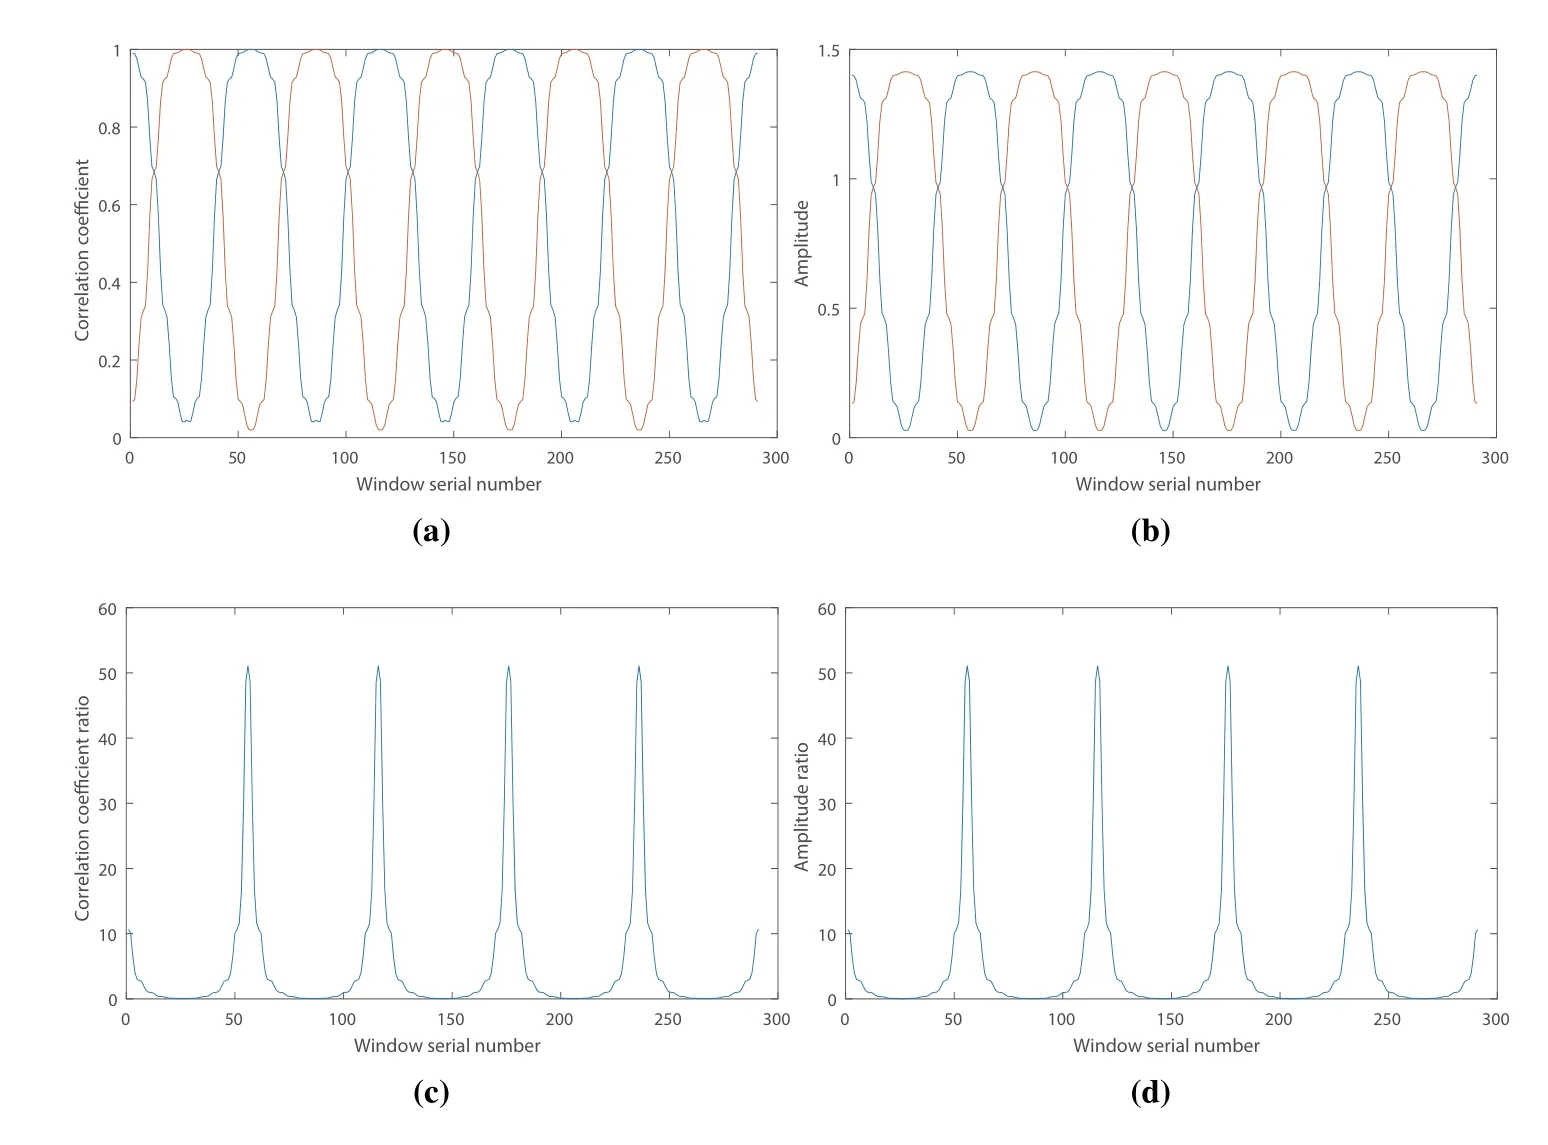
Figure 6. CCA analysis results of continuous noise-free signal Xtest3 (a)the change of correlation coefficient.The blue curve shows the variety of ρf17 from CCA of test signal and reference signal Yf17, the red curve represents the change of amplitude of ρf18 by CCA of test signal and the reference signal Yf18,(b)the amplitude variation.The blue curve implies the change of amplitude of 17 Hz component in test signal,the red curve represents the change of amplitude of 18 Hz signal in test signal,(c)the change of two correlation coefficient ratio,(d)the change of amplitude ratio of 17 Hz and 18 Hz component in test signal.
Accordingly, these results lead to the inescapable conclusion that in the 2-second sliding window spectrum analysis, whether in the light of the alternating change trend of the amplitude value, and the correlation coefficient, or from the variation curve of the amplitude value ratio and the correlation coefficient ratio could intuitively reflect the changing process of the two-component amplitude value of the signal to be measured.
Through the spectral analysis of a series of 2-second sine signalsXtest1with different amplitudes of frequency components and sinusoidal signalsXtest2with Gaussian white noise,it was evident from these figures that both FFT and CCA could accurately represent the amplitude changes of the frequency components in the signal.By contrast, CCA had higher signal-to-noise ratio for the amplitude variation of frequency components that need to be extracted from the detected signal, and had higher performance of signal feature extraction than the FFT.As discussed above,it was discovered that whether the correlation coefficients obtained by CCA of two sinusoidal signalsXtest1andXtest2with constant amplitude of two frequency components, or the correlation coefficient from CCA of 60-second signalXtest3with alternating amplitude of two frequency components through sliding window,the continuous variation of the amplitude of the frequency component in the signal could be effectively expressed.
3.2 Results and Discussion of Experiment 1
When the stimulus flickers in different spatial positions of the field of vision, SSVEP responses were significantly different.This change of SSVEP response caused by spatial information difference could be characterized by correlation coefficient.Figure 7 shows off-line data analysis of a representative experiment paradigm 1.It could be estimated from Figure 7 that, in the first four trials, as the fixation point moved in the horizontal direction towards the stimulus with the scintillation frequency of 15 Hz, namely,as the gaze point moved from F2 to F5, the 15 Hz component amplitude of SSVEP gained by CCA and FBCCA and its average value in each trial monotonically increased, and reached the maximum at the eye fixation point F5 closest to the scintillation stimulus.Furthermore, the SSVEP signal amplitude and correlation coefficientρf15would appear an abrupt decline when the position of the fixation point moved away rapidly from F5 to F1.Then, under the condition of no rest, the second round of trials began.Remarkably, as the fixation point jumped from position F1 to F5 in sequence again,the 15 Hz component amplitude of SSVEP calculated by both CCA and FBCCA and its average value during each fixation point trial still increased monotonously, but the increasing rate showed a relatively slow trend compared with the previous stage.In addition,with the increase of the number of trial rounds, the difference between the maximum and minimum of the average correlation coefficientρf15in the third round of the trials, that is, the range,is less than the range of the average correlation coefficientρf15in the second round of trials.It was probable that visual fatigue caused by long-term experiments brought about this phenomenon.Compared with Figure 7(a) and Figure 7(b), in the third round of trials without rest,the average value ofρf15represented by the magenta line obtained by FBCCA still maintained a monotonic increase in the third round of trials.However, the monotonically increasing trend of the average value in CCA was no longer obvious,and even the average value decreases slightly when the cross appears at F4.
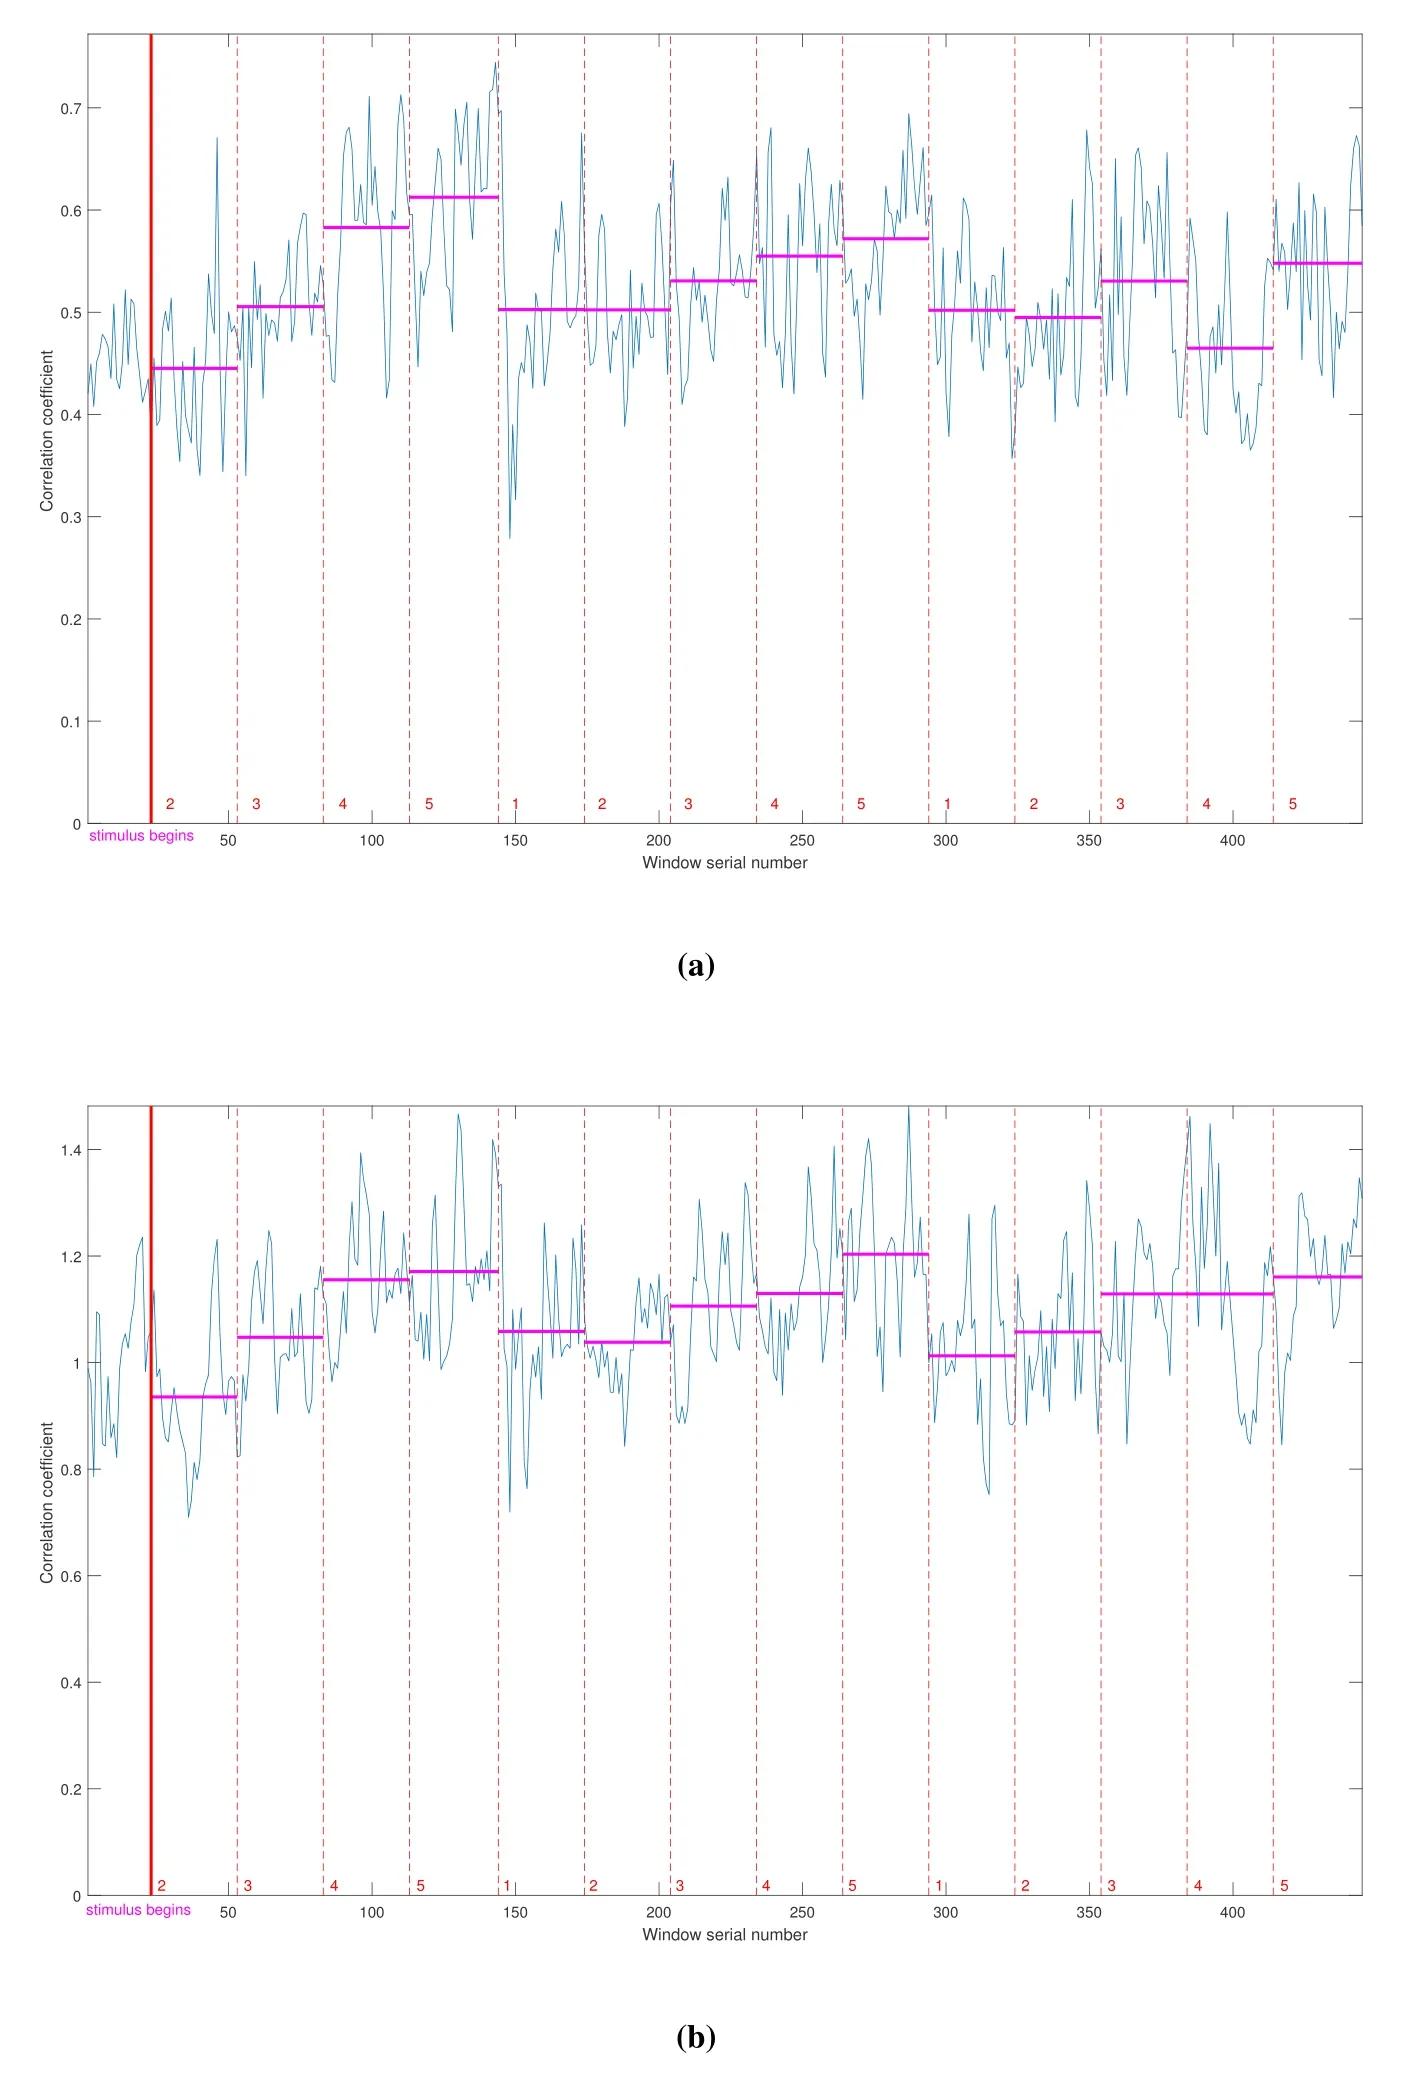
Figure 7. Variation in the amplitude of the 15 Hz component of the SSVEP signal for subjects in each trail.The red vertical line represents the beginning of the stimulus,and the red dashed line indicates the moment when the cross begins to appear at a different location,.The red corner mark at the bottom right corner of each line represents the location of the cross,that is,the location of the fixation at the trial.The magenta horizontal line represents the mean value of the data in the trial.(a)The change of ρf15 and the mean value of ρf15 by CCA for each trial.(b)The change of ρf15 and the mean value of ρf15 by FBCCA for each trial.
Consequently, these findings of Experiment 1 were of significance to further explain from the perspective of the change of the correlation coefficient by CCA and FBCCA of the corresponding components that the amplitude of SSVEP was related to the distance between the fixation point and the horizontal direction of stimuli as previously described [27], and it was found in this experiment that when the distance between the fixation point and the horizontal direction of stimuli was rather large,the change of SSVEP amplitude would have a prompt and evident response.It was worth noting that in contrast to CCA, FBCCA was more stable for detecting the changes of the corresponding frequency components in SSVEP.This also provided the possibility of locating the fixation point through two flicker stimuli from both theoretical and experimental aspects.
3.3 Results and Discussion of Experiment 2
In Experiment 1,the fixation point was a step change of discontinuous change.In order to locate the fixation point more precisely and improve the information transmission rate and the speed of positioning analysis,the position of fixation point in Experiment 2 was a continuous change;in other words,the fixation point moved back and forth between the two squares with flicker frequency of 17 Hz and 18 Hz continuously and smoothly.The size of the stimulus area was 300×300 pixels,and the distance between the two stimulus centers was 400 pixels.Figure 8 shows the SSVEP spectrum at the left and right regions between the two stimuli.In the SSVEP spectrum,it was pretty clear that 17 Hz was the main frequency and the amplitude of 18 Hz was significantly less than 17 Hz in the left region,while the fixation point was in the right side, 18 Hz was the main frequency and the amplitude of 17 Hz was dramatically less than 18 Hz.As a result, it was necessary to compare the size relationship of the 17 Hz and 18 Hz components in the SSVEP signal to quickly
and accurately determine information of the position where the fixation point was located.
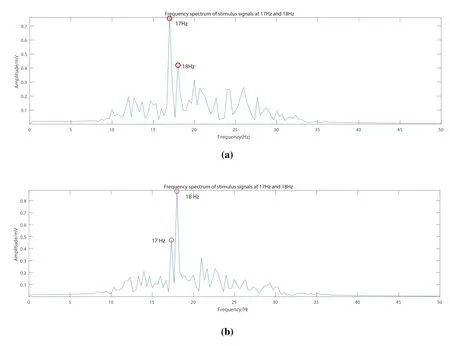
Figure 8. Spectrum of SSVEP signals from off-line data of subjects’gaze points at different locations,(a)at left side near 17 Hz stimulus,(b)at right area near 18 Hz stimulus.
Figure 9 and Figure 10 represent the off-line analysis results of the SSVEP signal of a representative participant who observed continuous moving fixation points.It could be seen that the correlation coefficientsρf17,ρf18of EEG signals collected in the experiment did not fluctuate significantly before the stimulation began.The correlation coefficientρf17of the SSVEP signal showed an overall change from large to small,whileρf18showed a change from small to large when the subject’s eyes followed the gaze point from the 17Hz stimulus to the 18Hz stimulus continuously after stimulus onset; During the movement of the fixation point from 18 Hz to 17 Hz flicker stimulus,ρf18gradually decreased, andρf17became progressively larger.In brief,the trend of correlation coefficient between two components was roughly opposite.Correspondingly, ρf17reached the extreme maximum and ρf18of SSVEP signal reached the extreme minimum value after the fixation point moves to 17 Hz stimulation.Almost every time the fixation point moves to 18 Hz stimulus,the correlation coefficient ρf18of the SSVEP signal basically reached the maximum value,and ρf17reached the minimum value.By comparing Figure 9 and Figure 10, it could be found that at the same time, the difference between ρf17and ρf18obtained by FBCCA was larger than that from CCA.Similarly, there was a more significant negative correlation between the changes of the correlation coefficients of the two components derived from FBCCA.Therefore, the tendency of correlation coefficient of frequency components in SSVEP obtained by FBCCA analysis was more significant than that of CCA.
Figure 11 shows the analysis results of SSVEP signal through CCA and FBCCA of a representative participant who observed the continuous moving fixation point.In the off-line analysis of the subjects’data,the correlation coefficient ratioby CCA and FBCCA analysis did not change significantly before the stimulation of experimental paradigm 2.When the stimulus began to flicker and the subjects ’ attention began to move from the flicker squares of two frequencies, it could be observed from Figure 11 that,on the whole,the correlation coefficient ratiosobtained by CCA and FBCCA analysis of SSVEP signals had nearly the same trend.In the trials with more concentrated attention, with the fixation point sliding from 18 Hz to 17 Hz,the correlation coefficient ratiomonotonically increased until the fixation point moved to 17 Hz, and the ratio reached the maximum.After that,the correlation coefficient ratioreduced gradually as the fixation point returned from 17 Hz to 18 Hz stimulus until the ratio reached the minimum when the fixation point followed the cross moving to the 18 Hz stimulus.With the continuous accumulation of experimental time, the gradual disbanding of attention and the augmentation of fatigue sleepiness, the trend of the two ratios that increased initially and then decreased would be weakened,and the peak value of the two ratios also showed the tendency to reduce.
In contrast to Figure 9 and Figure 10, Figure 11 showed a better shape curve based on the ratio of the correlation coefficientsρf17andρf18from CCA and FBCCA analysis that the periodic variations ofdue to changes in spatial information in Figure 11 were more pronounced than that in Figure 9 and Figure 10.Through the comparison of the two curves in Figure 11, it could be inferred that the maximum values in the curves obtained by FBCCA analysis were much larger than the maximum values obtained by CCA,and the minimum values in the curves obtained by FBCCA analysis were generally slightly smaller than the minimum values obtained by CCA.From these results, it was interesting to note that the correlation coefficient ratioof the two frequency components in SSVEP analyzed by FBCCA could get larger range and reveal more evident periodicity caused by the movement of the line of sight back and forth with the fixation point.
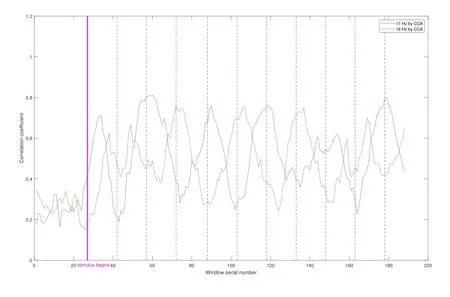
Figure 9. The results of CCA analysis showed that the blue line and the red line represented the correlation coefficient changes of 17Hz and 18Hz components in SSVEP obtained by CCA analysis,respectively.The red line marked the beginning of the stimulus.The blue line and the red line represented the moment when the fixation point moved to the square of the flicker frequency of 17Hz and 18Hz.
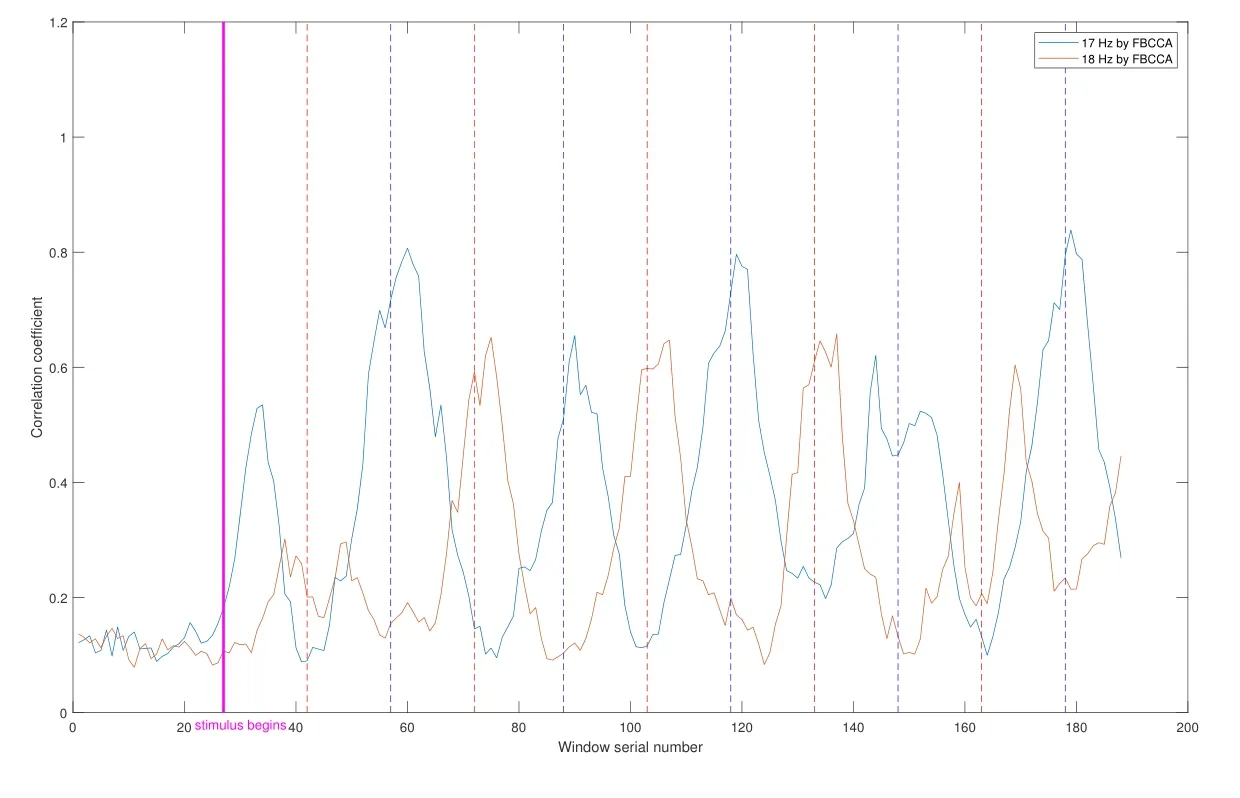
Figure 10.Results of the subject’s FBCCA analysis,the solid blue and red lines indicate the change in correlation coefficients corresponding to the 17Hz and 18Hz components of the SSVEP derived from the FBCCA analysis,respectively,the rose red solid line marks the moment of stimulus onset, the blue dashed line and the red dotted line indicate the moment when the gaze point moves to the square with flicker frequencies of 17Hz and 18Hz.
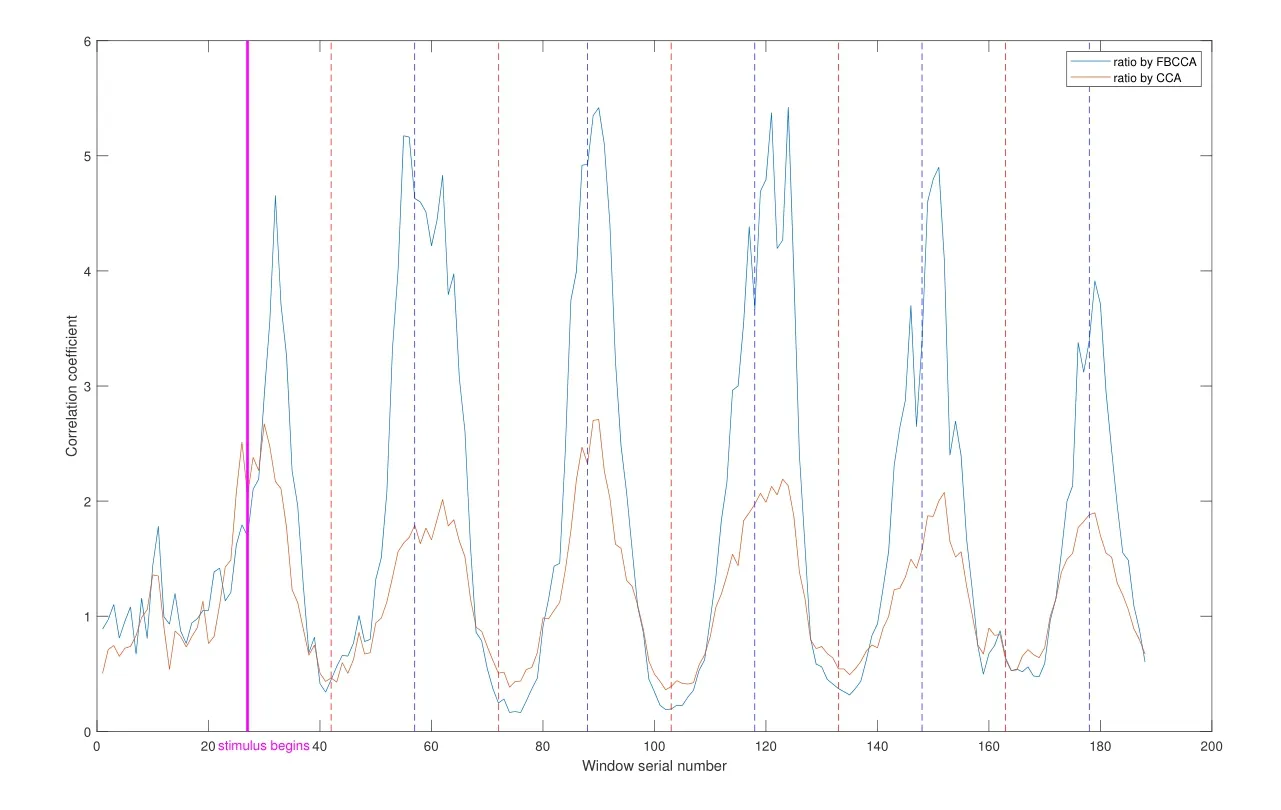
Figure 11.The results of off-line data FBCCA analysis showed that the red real line and the blue real line represented the correlation coefficient ratiochanges of 17 Hz and 18 Hz obtained by CCA and FBCCA respectively.The magenta real line marked the beginning of the stimulus, and the blue virtual line and the red virtual line represented the time when the fixation point moved to the flicker stimulus with 17 Hz and 18 Hz.
The frequency component in SSVEP includes not only the fundamental frequency that is the same as the stimulation frequency,but also the high-order harmonics and sub-harmonics.These harmonic components can provide effective information for identifying SSVEP.FBCCA divides the signal into different subband components through the filter bank,and then the characteristic information contained in the harmonic component is extracted through the weighted square summation, which is more conducive to identifying the amplitude change of SSVEP at the corresponding frequency.Therefore,when analyzing offline data,FBCCA and CCA show better accuracy than FFT in detecting signal amplitude variation, and effectively improve the signal to noise ratio.In addition, with the continuous movement of the fixation point in the horizontal direction, the correlation coefficientsρf17andρf18obtained by FBCCA increase and decrease alternately more significantly, and the change of this spatial position is more regularly reflected in the ratio ofρf17andρf18.Thus,the correlation coefficient ratio of SSVEP with fixation point smooth movement analyzed by FBCCA may be able to distinguish the movement information of the fixation point in a smaller distance to achieve accurate positioning on the screen.
IV.CONCLUSION
As an innovative way of human-computer interaction,brain-computer interface can directly and quickly convert the brain activity signals into the corresponding control instructions of the controlled terminal equipment.In recent years, the focus of BCI development has begun to shift from theoretical research to practical application.SSVEP has the characteristics of simple signal recording,high signal-to-noise ratio and less training times, so the brain-computer interface system based on SSVEP has attracted the attention of a large number of research institutions.In this paper,both the correlation coefficient and the correlation coefficient ratio can characterize the relative change of the amplitudes of the two frequency components in the test SSVEP signal, which was preliminarily verified by investigating the simulation signals under ideal conditions and noisy conditions.Combined with the CCA and FBCCA analysis of SSVEP signals at different distances in the horizontal direction,it was further proved that the amplitude of SSVEP was related to the distance between the fixation point and the stimulus in this study and was found that there was a rapid and obvious response to the change of SSVEP amplitude when the fixation point moved a long distance.At the same time, the amplitude of SSVEP increased with the decrease of the distance between the fixation point and the stimulus,whether the fixation movement was discontinuous or continuous.More importantly,since the existing spatially-coded visual BCI cannot identify the edge of each spatial region, this research had made valuable contributions in this field through this new experimental paradigm designed.In the case of dual-frequency, by collecting the EEG data of the subjects when gazing at the continuous sliding fixation points between the two stimuli, the relationship between the continuous spatial location variation of the fixation points and the correlation coefficients of the two frequency components was explored,presenting a promising aspect of accurate fixation point positioning.Without the need for large-scale screen to provide stimulus,it provides the possibility for the realization of highly integrated embedded BCI system,reduces the volume of the BCI system, and improves the practicability and portability of the BCI system.Besides, due to the decrease in the number of stimuli and the absence of direct eye stimulation,the degree of eye stimulation was greatly reduced,and the sense of use and comfort of participants were improved.In the future,there are still some assignments that needs to be further investigated.The current work is in the stage of off-line data analysis,and it is necessary to develop a new BCI system based on this new paradigm and realize real-time positioning of fixation points by online SSVEP analysis,which makes it possible to realize the continuous operation similar to the mouse through the BCI on the screen.Obtaining the accuracy and information transmission rate of the system to demonstrate the feasibility of BCI system is indeed the direction of our subsequent research.Moreover, this topic will be intensively studied to explore the mathematical relationship between the correlation coefficient ratio of the frequency components of the SSVEP and the fixation position,which can be expressed by formulas to improve the universality of the localization algorithm and the effect of target recognition.
- China Communications的其它文章
- A User-Friendly SSVEP-Based BCI Using Imperceptible Phase-Coded Flickers at 60Hz
- Toward a Neurophysiological Measure of Image Quality Perception Based on Algebraic Topology Analysis
- Transfer Learning Algorithm Design for Feature Transfer Problem in Motor Imagery Brain-computer Interface
- Removal of Ocular Artifacts from Electroencephalo-Graph by Improving Variational Mode Decomposition
- BCI+VR Rehabilitation Design of Closed-Loop Motor Imagery Based on the Degree of Drug Addiction
- E3GCAPS:Efficient EEG-Based Multi-Capsule Framework with Dynamic Attention for Cross-Subject Cognitive State Detection

