
The relationships between step count and all-cause mortality and cardiovascular events:A dose-response meta-analysis
2022-01-20 07:00MingxinShengJunyueYngMinBoTinzhiChenRuixueCiZhngHonglingChenMinqiLiuXueyuWuBowenZhngYitingLiuJinqinCho
Mingxin Sheng,Junyue Yng,Min Bo,Tinzhi Chen,Ruixue Ci,N Zhng,Hongling Chen,Minqi Liu,Xueyu Wu,Bowen Zhng,Yiting Liu,Jinqin Cho,*
a Key Laboratory of Environmental Medicine Engineering of Ministry of Education,Department of Epidemiology and Biostatistics,School of Public Health,Southeast University,Nanjing 210009,China
b Department of Health Policy and Management,School of Public Health,Peking University,Beijing 100191,China
Abstract
Keywords: All-cause death;Cardiovascular disease;Daily steps;Dose-response;Healthy lifestyle;Primary prevention
1. Introduction
The health benefits of physical activity(PA)among individuals of all ages, fitness levels, and socio-demographic groups are well-documented.1-3Walking, which is central to promoting PA and public health, is free, requires no special training, and can be practiced almost anywhere.4In addition, the number of steps taken can now be recorded by most smartphones or other portable devices, making the personalization of public health information a sustainable behavior. The emergence and use of self-monitoring equipment are increasing. The number of daily steps taken as the target of PA for the general population is becoming more and more important, making it an essential supplement to the current public health guidelines.5
A goal of 10,000 steps per day is widely advocated, but there is little evidence to support this goal,6given that data from prospective mortality studies are incomplete. Walking has been associated with a reduced incidence of all causes of death and of cardiovascular risk factors.7-9However,most studies dealing with the benefits of life expectancy associated with walking are constrained by the use of selfdeclared indicators of daily steps and walking time or have failed to quantify the dose-response relationship between step count and the subsequent reduction in risk of all-cause mortality.10,11
Several recent prospective research studies have used device-based methods, such as accelerometers, to evaluate associations between steps per day and mortality or cardiovascular disease (CVD) and reduce the bias associated with self-reporting.12-15However, the majority of these studies are statistically inadequate due to their relatively short follow-up time and the low number of participants.16
We performed a meta-analysis to explore the relationships between step count and all-cause mortality and CVD.In particular, dose-response relationships between different numbers of daily steps(low,medium,and high)and all-cause mortality and CVD were examined.
2. Methods
A review was carried out under the MOOSE(Meta-analysis of Observational Studies in Epidemiology) guidelines.17The review protocol is registered with the PROSPERO database(CRD42020221539).
2.1. Search strategy
We performed a literature search (up to July 9, 2021) of the Cochrane Central Register of Controlled Trials (CENTRAL), EMBASE, OVID, PubMed, Scopus, and Web of Science databases for studies examining the association between daily steps and the risk of all-cause mortality and cardiovascular events. PubMed search terms were(“cardiovascular disease” OR “cardiovascular events” OR“heart disease”OR“cerebrovascular accident”OR“angina”OR “stroke” OR “myocardial infarction” OR “heart infarction”OR“ischemic heart disease”OR“Mortality”OR“cause of death” OR “all-cause mortality” OR “all-cause death” OR “death”) AND (“cohort” OR “prospective” OR“trial” OR “clinical trial” OR “follow-up”) AND (“step count”OR“steps per day”OR“daily steps”).Similar search terms were used for other electronic databases(Supplementary File 1). In addition, references to relevant original articles were reviewed, and articles were investigated to determine other relevant studies. We only considered English-language publications.
2.2. Study selection
Studies were included in our meta-analysis if they satisfied the following criteria:the study design was prospective or was a clinical trial (only when the outcomes were cardiovascular events);the exposure of interest was daily step count;the outcome was all-cause mortality, CVD, coronary heart disease,or stroke; and the investigators reported relative risk (RR),hazard ratio, or odds ratio (OR) with 95% confidence interval(95%CI) for at least 3 quantitative categories of step count.Because the primary prevention of CVD was central to our work (as opposed to secondary prevention), we excluded studies if participants were not recruited from a general population in good health (i.e., people with diabetes were excluded).Reviews,editorials,non-human studies,and letters with insufficient information were also excluded. Additionally, we excluded studies associated with other exposures and diseases.If the study populations had been reported on more than once,the results of studies with a more extended follow-up period were used.
2.3. Data extraction and quality assessment
Two of the authors of our study(MS and JY)carried out the data extraction separately through a standard extraction form.The following information was obtained for each study:authors,year of publication,study name,study location,years of followup,sample size(number of participants and incident cases),participants’ characteristics (age and sex), endpoints (death, CVD,or both), outcomes ascertainment, wearable devices (pedometer or accelerometer), step count categories, covariates adjusted in the multivariable analysis, and RRs (95%CI) for all categories of step count. When there were several adjustment models in the studies, those reflected the maximum extent of adjustment for potentially confounding variables were extracted.
To assess potential dose-response relationships, we extracted the median step count in each category, as well as the number of cases and participants.If the number of participants and cases was not reported, the corresponding authors were contacted to obtain the data.
We conducted the quality assessment following the Newcastle-Ottawa Quality Assessment scale.18Scores ranged from 0 to 9 points, with higher scores suggesting better quality of the study. Newcastle-Ottawa Quality Assessment scale scores of 0-3, 4-6, and 7-9 were considered low, medium, and high quality,respectively.
2.4. Statistical analysis
In our meta-analysis,the RRs and 95%CI were considered as the effect size for all studies, and hazard ratios were deemed equivalent to RRs.19If necessary, an OR was converted to RR using the following formula: RR=OR/((1-P0)+(P0× OR)),where P0is the incidence of the outcome of interest in the nonexposed group.20All gender-stratified findings were treated as 2 separate reports. Articles with more than 1 outcome (e.g., allcause mortality and CVD)were also treated as individual reports and included in the corresponding analyses. If the number of cases in each category was unavailable in 1 study and the authors did not respond to our query,we used the method used by Bekkering et al.21to provide approximate data.
Owing to the distinct cut-off points for step count categories in different articles,we computed an RR with a 95%CI for an increment of 1000 steps per day for the step count for each study on all-cause mortality and an increment of 500 steps per day for the step count for each study on CVD. We used the methods described by Greenland and Longnecker22and Orsini et al.23to calculate the trend from the correlated estimates for log RR across categories of step count.
The group with the lowest number of daily steps was considered the reference category in most studies.When the reference category was not the lowest, we used the methodology proposed by Hamling and his collaborators24to convert the risk estimates.The median or mean step count in each category was assigned to the corresponding RR for each study. The midpoint of the upper and lower bounds was considered the dose for each category if the median or mean steps per category were unavailable. When the highest category was openended,the midpoint of the category was set at 1.5 times of the lower limit.25The log RR, along with the step count for the reference category,was set to 0(corresponding to an RR of 1).We subtracted the midpoint step count of this category from the midpoint step count of all other categories. A weighted regression was then applied initially when the exposure was at the baseline with a 0 log RR.The regression was weighted by the opposite variance of the log RR for each category.26
We included reports with 3 or more quantitative categories of low or high daily steps in dose-response analyses.A restricted cubic spline model consisting of 3 nodes at 10%,50%,and 90%percentiles of the distribution was used to examine the potential dose-response relationships between step count and all causes of mortality and cardiovascular events.27,28The Wald test calculated a p value for curve linearity or nonlinearity to test the null hypothesis that the coefficient of the second spline is equal to 0.We rejected the null hypothesis (p ≤0.05) and concluded that there were grounds for believing that there was a nonlinear relationship. The generalized least squares method22was used to estimate the trend of the combined dose-response data where there were few observations.
The Cochran Q test and the I2statistic allowed us to estimate the heterogeneity of the studies.29A significant level of a p value of ≤0.05 confirmed the heterogeneity.The I2statistic describes the percentage of total variation in point estimates that may be attributed to heterogeneity.For I2,low,moderate,and high I2values were considered as 25%,50%,and 75%,respectively.29,30We used a fixed-effect model (Mantel-Haenszel method) where heterogeneity was negligible and a randomized-effect model(DerSimonian-Laird method) where heterogeneity was significant.31Forest plots and funnel plots were used to examine the overall effect and evaluate publication bias,respectively.Egger’s test was calculated for the symmetry of the funnel plot.
All statistical analyses were performed with Stata Version 16 (StataCorp LLC, College Station, TX, USA), and all tests were two-sided with a significance level of 0.05.The equations of the dose-response relationships were fitted by OriginPro 2021(OriginLab,Northampton,PA,USA).
3. Results
3.1. Literature search
The search strategy identified 9673 potentially relevant search results, with 23 publications meeting the inclusion criteria. We have outlined the process of determining the included studies in Fig.1.After evaluating the complete texts,we included 16 publications in our final meta-analysis. Of these, 4 were conference abstracts.Among these 16 publications,12 studies provided statistical effects relevant to the meta-analyses on all-cause mortality,5 studies provided statistical effects relevant to the meta-analyses on CVD;and 1 article contained 2 outcomes:all-cause death and cardiovascular events(Supplementary File 2).
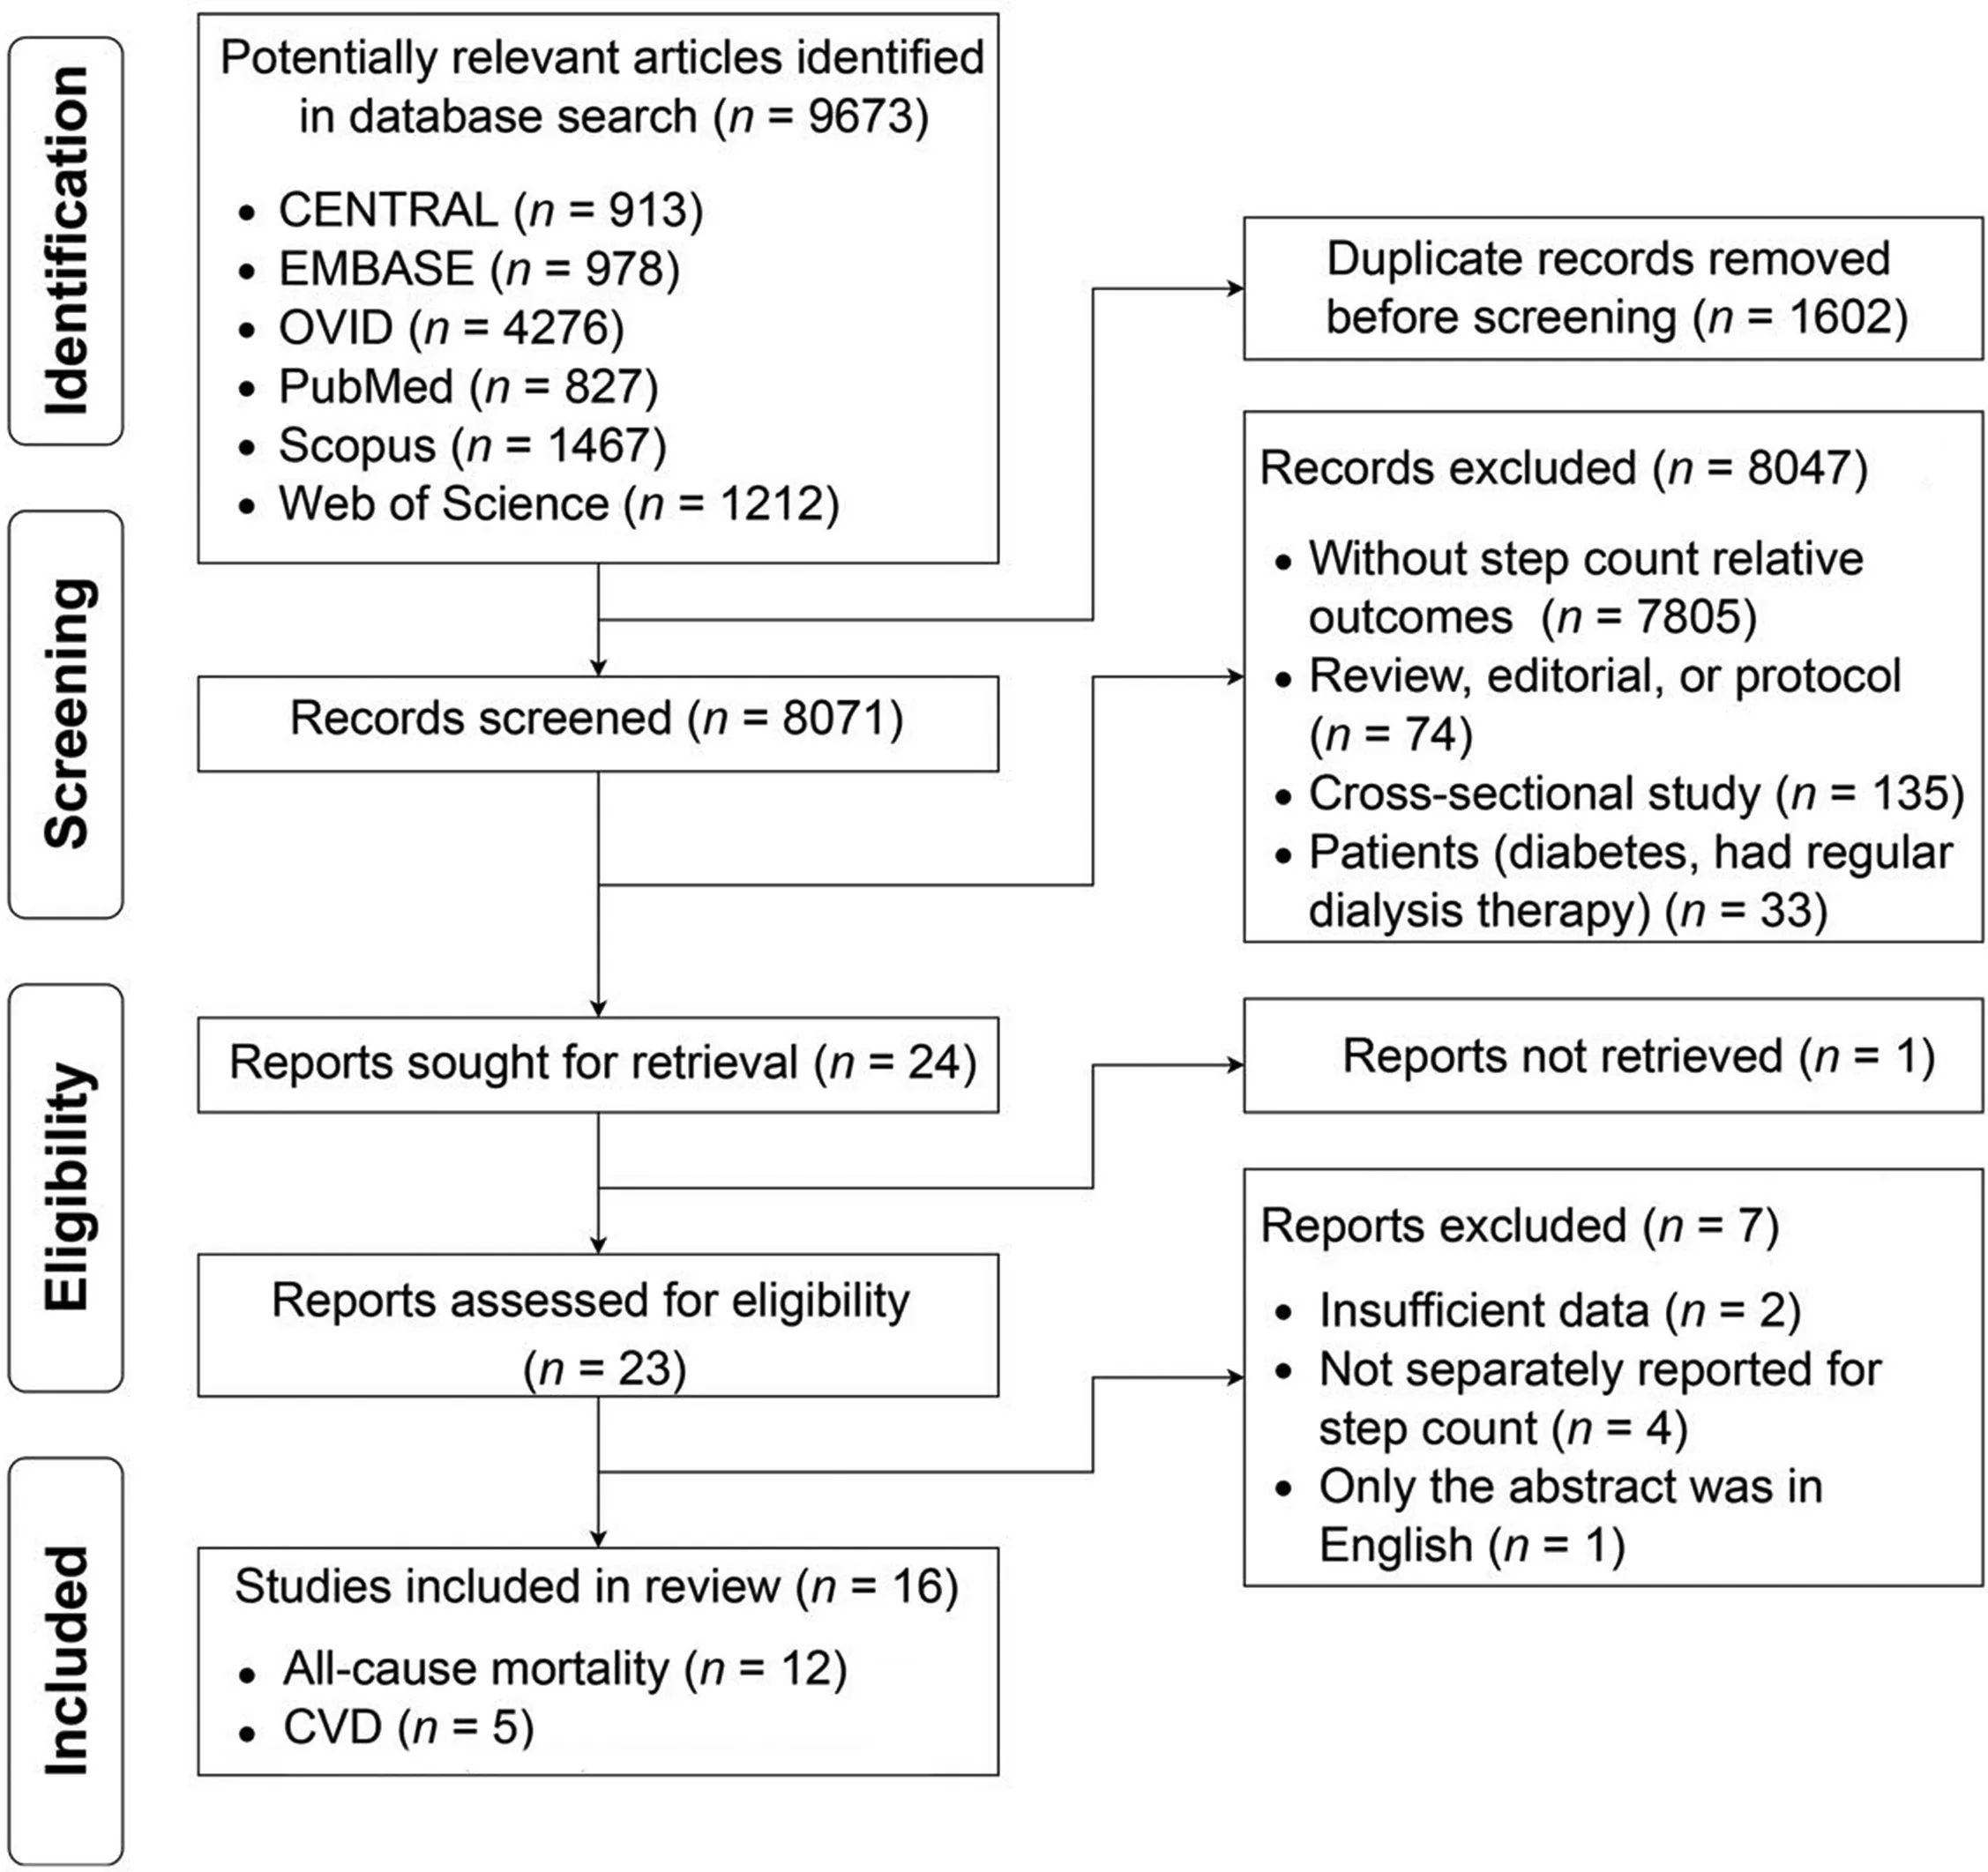
Fig.1. Flow diagram of literature search and study selection.CENTRAL=Cochrane Central Register of Controlled Trials;CVD=cardiovascular disease.
3.2. Study characteristics
The characteristics of the studies are summarized in Supplementary Tables 1 and 2. Sample sizes varied from 213 to 95,974, with a total of 147,344 participants, including 5434 cases of all-cause deaths and 1082 cases of CVD. Follow-up periods ranged between 2.7 and 10.1 years.Of these 16 publications, most were conducted in the United Kingdom (n=5) and the United States(n=5),with the rest from Europe(n=2),Japan(n=2), and Australia (n=2). In the studies, a wearable device(pedometer or accelerometer) was used to measure the number of steps per day. Study quality measured by the Newcastle-Ottawa Quality Assessment scale score was generally good; 15 studies(93.75%)scored of 7 or more.
3.3. Step count and risk of all-cause mortality
Twelve studies12-14,32-40included a total of 132,674 participants, with 5434 deaths. The relationship between RR of step count and risk of all-cause mortality was 0.87 (95%CI:0.84-0.91), with moderate heterogeneity (I2=68.0%,p=0.000, Supplementary Fig.1). A 1000-step increment was associated with a 23%decreased risk of all-cause mortality.
Ten cohort studies12-14,32-35,37-39were included in the dose-response analysis of daily steps and risk of all-cause mortality, including 130,209 participants with 5141 cases. In the meta-analysis comparing the highest and lowest categories of step count,these studies showed that there was a significant impact on overall all-cause mortality risk estimates (summary RR=0.31,95%CI:0.23-0.42,Supplementary Fig.2).Using a restricted cubic splines model, we observed a nonlinear dose-response association between step count and all-cause death (Wald test: pnonlinearity<0.05, Fig. 2). The equation between step count (x) and the RR of all-cause death (y) was y=1.0051+(-1.15616E-4)×x+(3.10971E-9) ×x2.Compared with the first quartile (4228 steps/day), the second quartile(6893 steps/day)had a 21.60%lower risk for all causes of death. The third quartile (9188 steps/day) had a 36.65%lower risk of all-cause death than the first quartile.
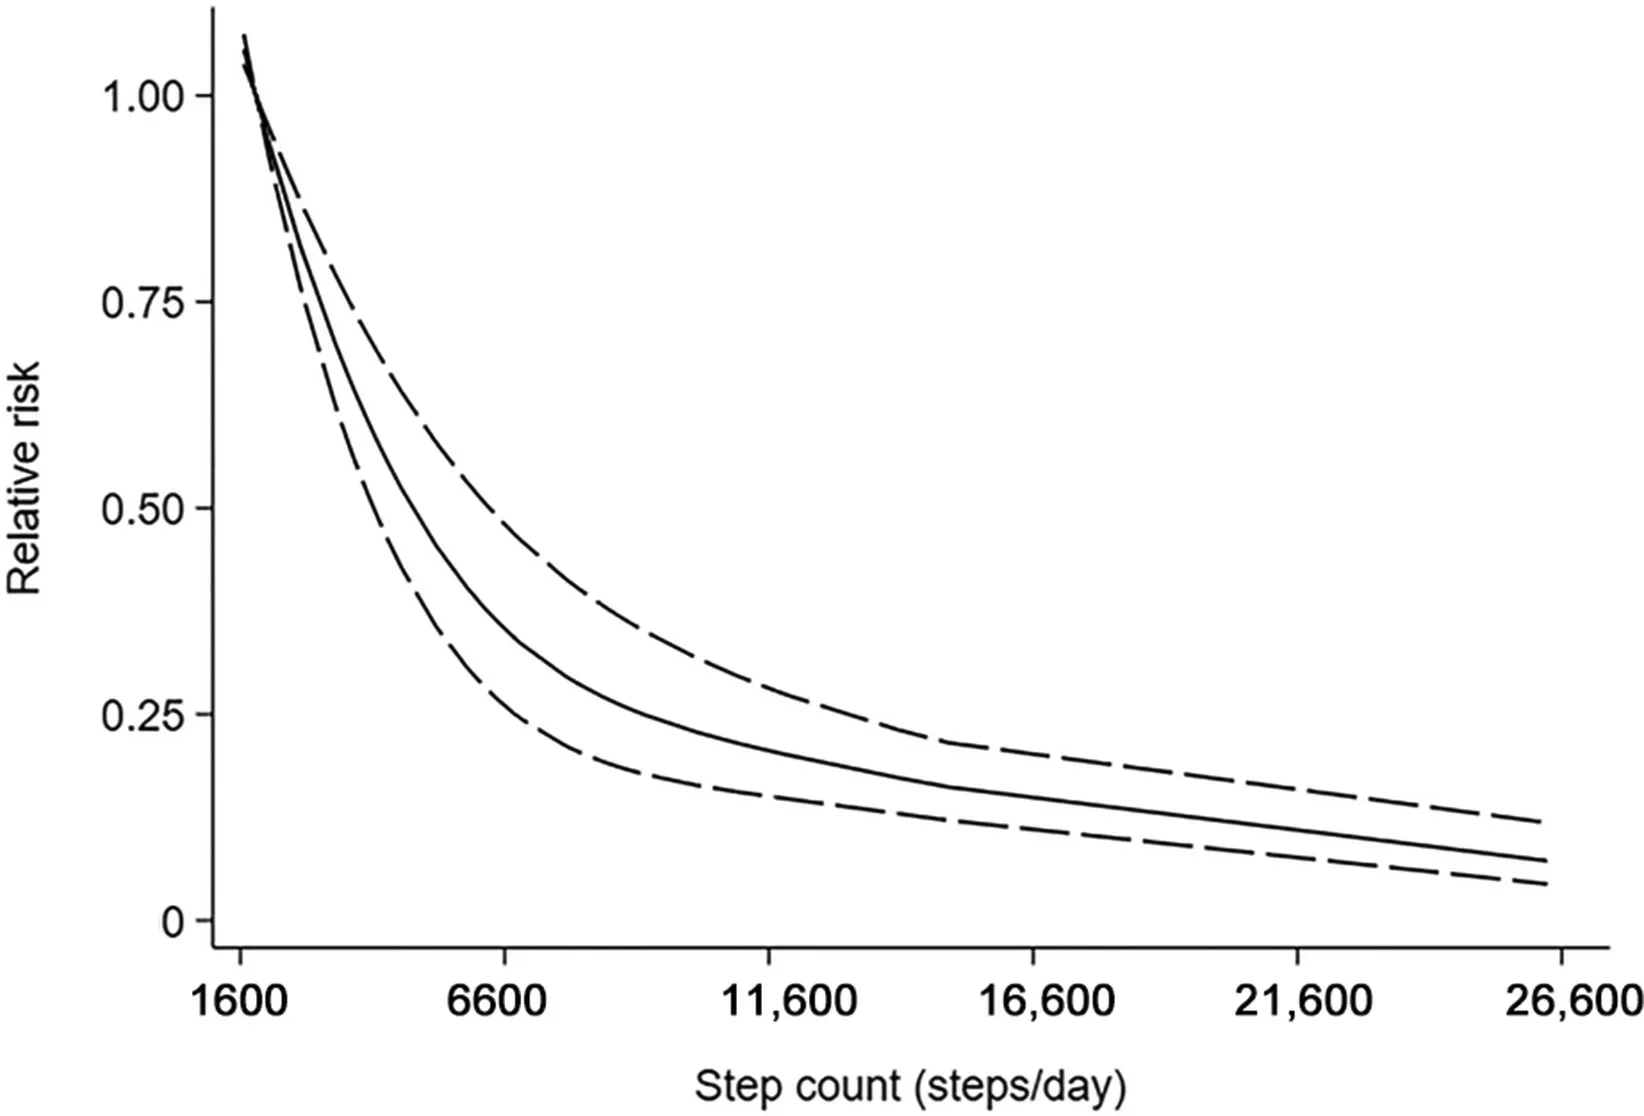
Fig .2. Nonlinear dose-response analyses of step count and risk of all-cause mortality.
3.4. Step count and risk of CVD
Five studies15,32,41-43included a total of 14,670 participants with 1082 cases.The pooled RR of CVD for a 500-step increment in step count was 0.94(95%CI:0.91-0.97),with high heterogeneity (I2=79.6%, p=0.001, Supplementary Fig. 3). For every 500 steps increased per day,the risk of CVD was 6%lower.
Four studies15,32,41,42were included in the dose-response analysis of daily steps and risk of CVD. These 4 studies had 13,080 participants with 848 cases.The combined RR for high risk vs.low risk was 0.41(95%CI:0.25-0.67)(Supplementary Fig. 4). A nonlinear dose-response association was observed using a restricted cubic splines model for the association between step count and CVD (Wald test: pnonlinearity<0.05).The equation for step count (x) and the RR of CVD (y) was y=1.1983+(-1.61761E-4)×x +(6.5835E-9)× x2(Fig. 3). Compared to the first quartile (3742 steps/day), the second quartile (5500 steps/day) had a 17.74% lower CVD risk. The third quartile (9500 steps/day) had a 42.94% lower CVD risk than the first quartile.
3.5. Subgroup,publication bias,and sensitivity analyses
Subgroup analyses were conducted to test the robustness of the results and investigate between-study heterogeneity. Supplementary Table 3 presents the results for the various subgroups.
There was no substantial change in the association between daily steps and risk in subgroups in the analyses of all-cause mortality.Heterogeneity was not indicated in the stratification of studies with different wearable devices (pA=0.948, pB=0.196,Fig.4),and the summarized RRs for a 1000-step increment per day were 0.94 (95%CI: 0.91-0.97; n=3) and 0.85(95%CI: 0.83-0.88; n=9) for pedometer and accelerometer,respectively. Moreover, when we restricted the analyses to accelerometer-based studies, a nonlinear dose-response association was observed (pnonlinearity<0.05, Supplementary Fig.5).The equation for step count(x)and the RR of mortality(y)was y=1.28009+(-2.06545E-4)×x+(9.2862E-9) ×x2.Compared with the first quartile(4183 steps/day),the second quartile (6862 steps/day) presented a 27.86% decreased risk of allcause death. The third quartile (8959 steps/day) had a 40.36%lower risk of all-cause mortality than the first quartile. When we restricted the analyses to pedometer-based studies, a linear dose-response association was observed (plinearity< 0.05,Supplementary Fig.6).A 1000-step increment was associated with an 11%decreased risk of all-cause mortality.
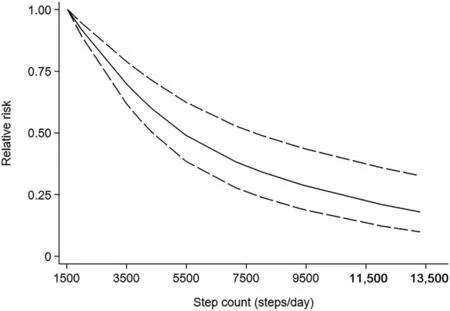
Fig.3. Nonlinear dose-response analyses of step count and risk of cardiovascular disease.
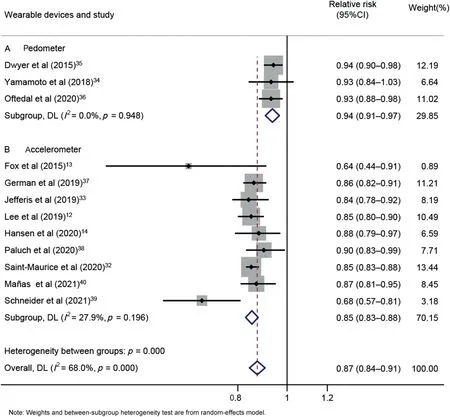
Fig.4. Forest plot of step count and risk of all-cause mortality per 1000-step increment,subgroup analyses of wearable devices:(A)pedometer or(B)accelerometer.95%CI=95%confidence interval;DL=DerSimonian-Laird estimate.
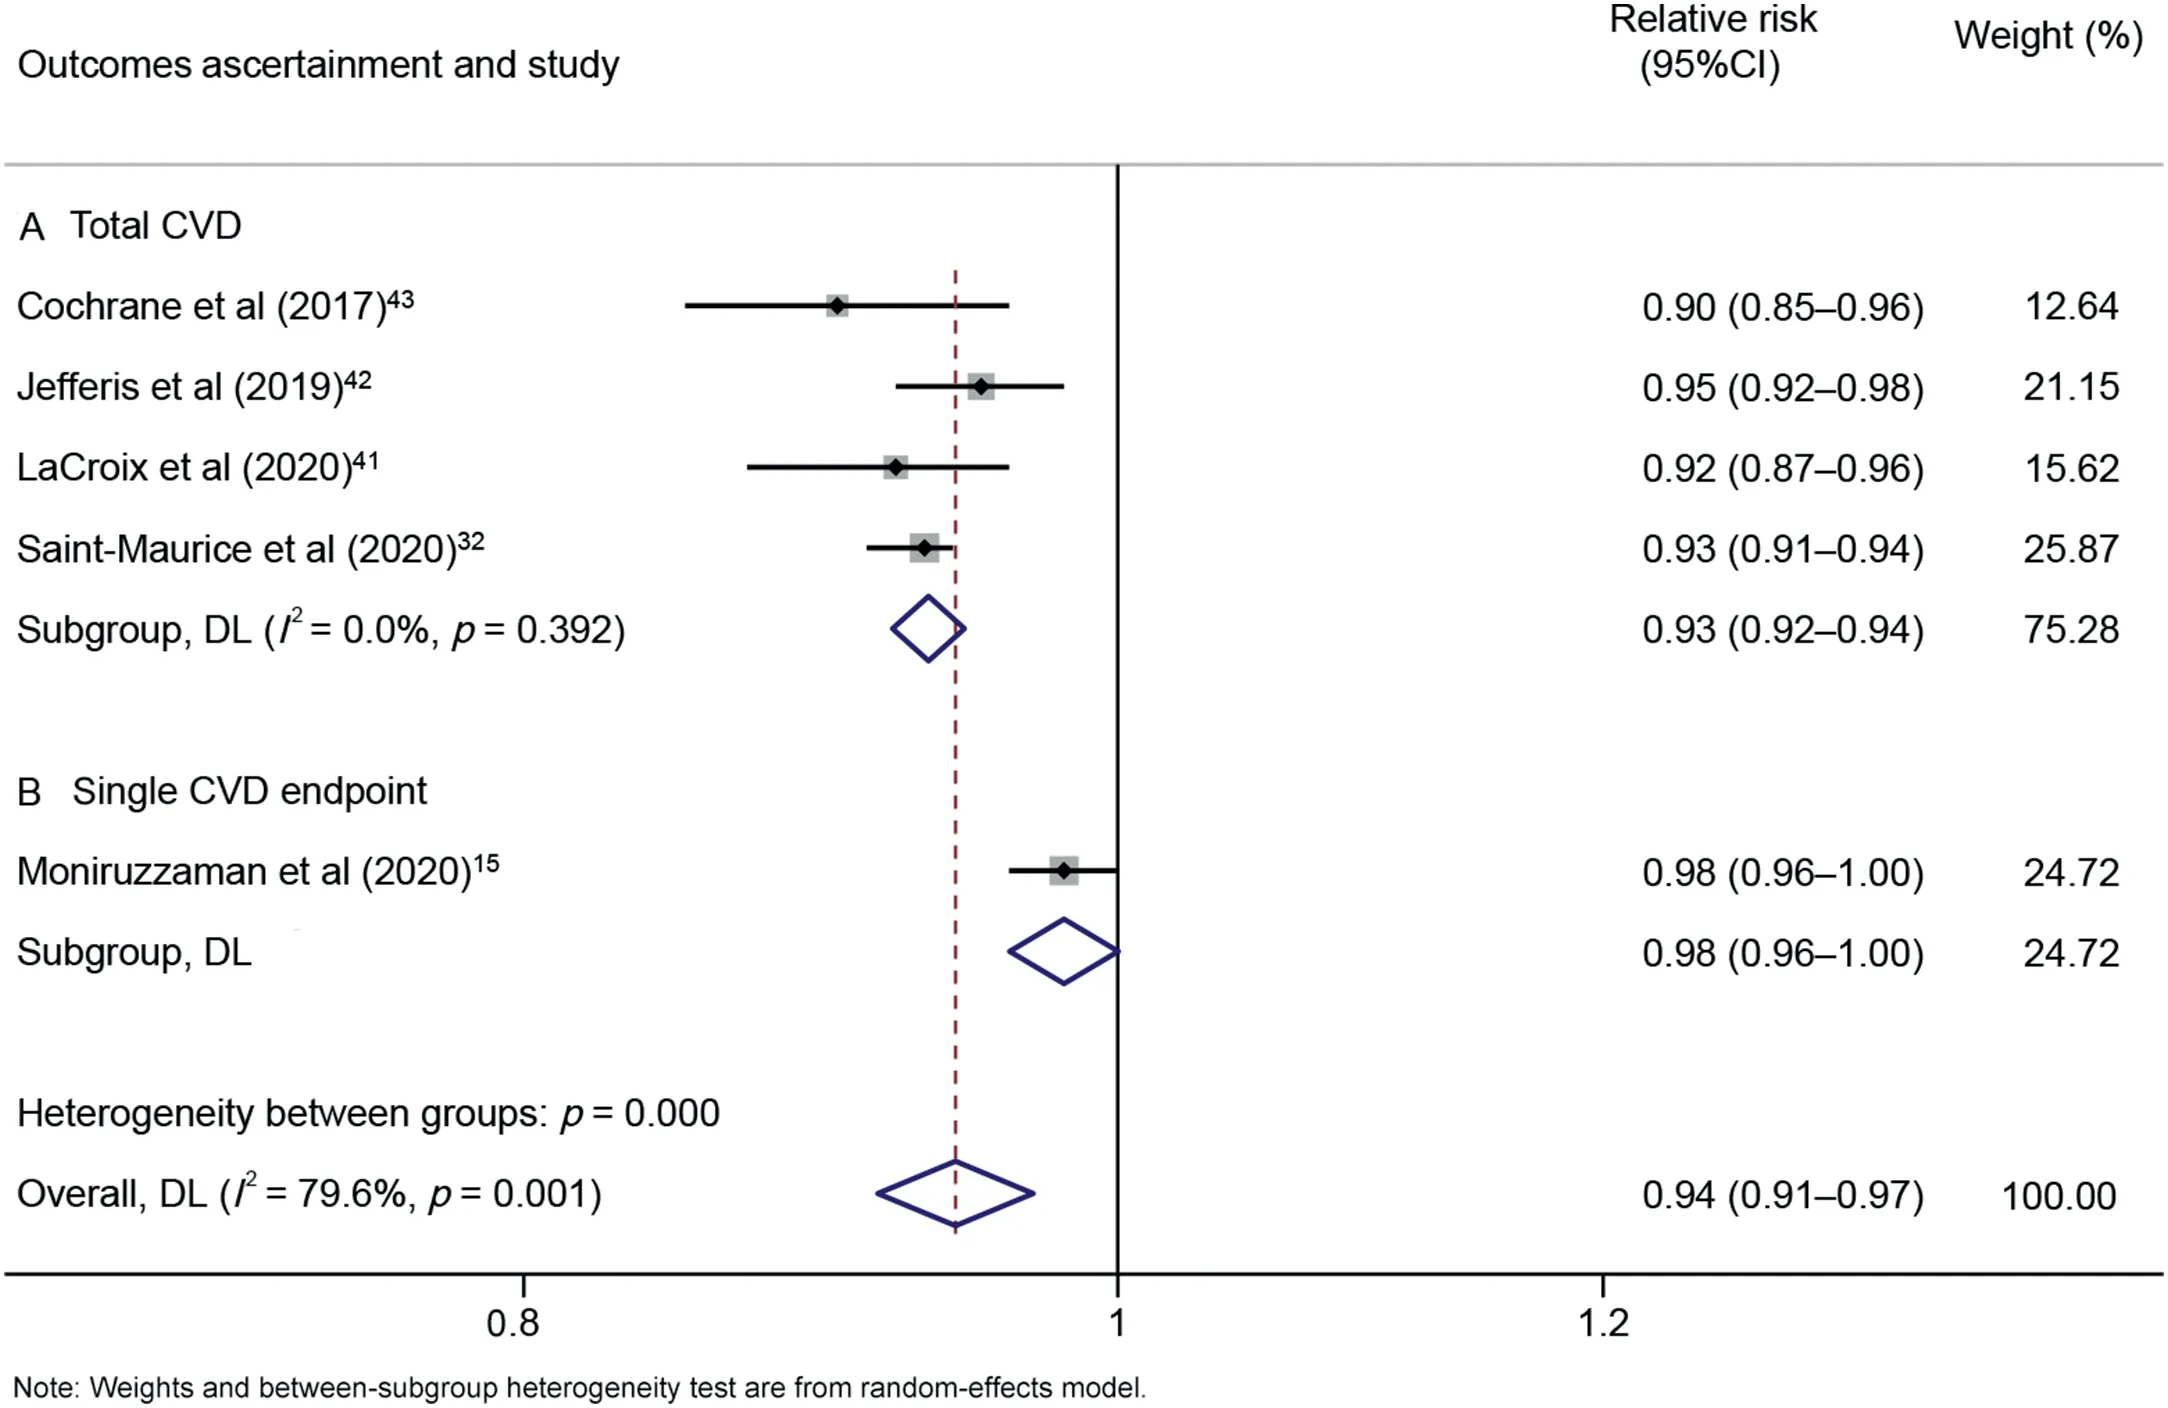
Fig.5. Forest plot of step count and risk of cardiovascular disease per 500-step increment,subgroup analyses of outcomes:(A)total CVD or(B)single CVD endpoint.95%CI=95%confidence interval;CVD=cardiovascular disease;DL=DerSimonian-Laird estimate.
In the CVD analyses, the associations between step count and risk were not substantially changed in subgroups. There was little indication of heterogeneity when the studies were stratified according to endpoints (pA=0.392, Fig. 5). The overall RRs for 500-step increments in steps per day were 0.93(95%CI: 0.92-0.94; n=4) for total CVD. In addition, when we restricted the analyses to accelerometer-based studies, a nonlinear dose-response association was observed(pnonlinearity< 0.05, Supplementary Fig. 7). The equation for step count (x) and the RR of CVD (y) was y=1.20277+(-1.76382E-4)×x+(9.07419E-9)×x2. Compared with the first quartile (3500 steps/day), the third quartile (9500 steps/day) had a 35.05% lower risk of cardiovascular events.When we restricted the analyses to pedometer-based studies,only a single study was available,and the limited observations were not sufficient for a dose-response analysis.
For studies of all-cause mortality,neither the Begg test nor the Egger test for publication bias reached significance(pBegg=0.537, pEgger=0.483, Supplementary Fig. 8). We repeated the dose-response analyses with a fixed-effect model to further confirm the robustness of the results. The pooled estimates were consistent for daily steps and the risk of allcause mortality and cardiovascular events.Sensitivity analyses omitting 1 study at a time did not substantially affect the overall results(Supplementary Figs.9 and 10).
4. Discussion
Our meta-analysis identified significant associations between step count and risk of all-cause mortality and cardiovascular events. A 1000-step increment of steps per day was associated with 23% decreased risk of all-cause mortality(summary RR=0.87,95%CI:0.84-0.91).For every 500 steps increased per day, the risk of CVD was 6% lower (overall RR=0.94,95%CI:0.91-0.97).There was evidence of nonlinear dose-response relationships between step count and risk of all-cause mortality and CVD (p=0.002 and p=0.014 for nonlinearity, respectively). Compared to the first quartile, the third quartile presented a 36.65% lower all-cause mortality risk and a 42.95% lower risk of cardiovascular events. Our findings on the associations between daily steps and all-cause mortality and cardiovascular events contribute to crucial public health recommendations.
4.1. Results in relation to other studies
For every 1000-step increment of steps per day, the decreased risk of all-cause mortality was twice as high as that observed for adults in the United States and was 13% lower than that in the population sample from the United Kingdom.13,38For every 500-step increment of steps per day, the decreased risk of CVD was about 5% lower than the value observed among older adults in the LIFE (Lifestyle Interventions and Independence for Elders)study.43One potential reason for the difference between studies is that accuracy can vary from one step-counting device to another.44In fact, step counts can vary between devices by 20%or more.45However,even with known differences among devices,the Pearson correlation coefficients for the free-living condition revealed significant associations between step counts among different devices(r=0.80,p <0.001).46,47
Our subgroup analyses suggested that different wearable devices used for step assessment (pedometers and accelerometers)gave rise to significant heterogeneity(Supplementary Table 3 and Supplementary Fig.4).Although exceedingly useful for epidemiological evaluation,pedometers are often unable to store data in the device’s memory and require participants to complete step logs.44Accelerometers, as more innovative devices, have demonstrated incredible reliability and validity for step-counting, though this hinges on where they are placed (usually waist-worn) and the model of the accelerometer.48Although accelerometers have been shown to measure steps during various activities accurately, they are not wholly infallible; 67 m/min seems to be the minimum speed required for accurate step-counting.47Step counts measured by accelerometers were mainly used as an indicator in the studies included in our meta-analysis, so the differences among devices should be considered when analyzing our results.46
Our study demonstrated a nonlinear dose-response relationship between additional steps per day and the risks of all-cause mortality and cardiovascular events. When restricting our analyses to accelerometer-based studies,we found that the third quartile had a 40.36%lower risk of all-cause mortality and a 35.05% lower risk of a cardiovascular events than the first quartile.Lower risks of allcause mortality and CVD in higher step count were also observed in studies conducted in Japan and the United States.12,15,34Due to the small number of people with elevated levels of steps per day,wide confidence intervals were observed in this part of the dose-response curve for CVD(Supplementary Fig.7),which warrants a conservative interpretation.When we restricted the analyses to pedometer-based studies,a 1000-step increment was associated with an 11% decrease in the risk of all-cause mortality. This reduced risk is about 4% higher than the value observed in older Australians.36Information was limited and insufficient for analyzing the relationship between pedometer-measured steps and CVD.Our results need to be interpreted with caution due to the small number of pedometer-based studies.Overall,our findings broaden an earlier systematic review of associations between daily steps and all-cause mortality and CVD in that our results reduce the uncertainty of the impact estimates given our use of a much broader and more heterogeneous sample.49
Research-grade motion sensors,such as pedometers and accelerometers, are often cumbersome and difficult to apply. Consequently,within the array of trackers,consumer-grade PA trackers(e.g., Fitbit, Polar, Garmin, Apple Watch Sport) may become the preferred self-monitoring measurement option for personal health motivation. Consumer-grade activity trackers have been highly accurate for measuring average daily step count and, to a lesser extent, actual activity duration compared to research-grade reference devices.50However, certain issues (e.g., walking speeds,device positioning,and gait)need to be addressed if the use of consumer-grade activity trackers continues to grow.There is no scientific way to match step data from different wearable devices;thus,further research is needed.
Most available PA metrics (such as step count) have failed to be translated into meaningful, personal, and scientifically proven physiological measures for the mainstream user.51The Cardiac Exercise Research Group has developed a personalized PA metric, called Personal Activity Intelligence,with the intention of making it easier to quantify how much PA per week is needed to reduce the risk of premature mortality from non-communicable diseases.51,52The HUNT Fitness Study (an acronym for the Norwegian name: Helseundersøkelsen i Nord-Trøndelag) has shown that obtaining 100 or more of Personal Activity Intelligence was associated with a significantly lower risk for CVD mortality.Participants in the study who did not achieve 100 or more of Personal Activity Intelligence had an increased risk of dying regardless of meeting the recommendation of 10,000 steps per day.52One possible reason may be that PA is associated with benefits across a wide range of outcomes,of which perhaps the most important is improvement in cardiorespiratory fitness.53Higher levels of cardiorespiratory fitness are associated with a lower risk of CVD.54,55The specific association of step count with cardiorespiratory fitness needs to be explored in further studies.
In the studies included in our meta-analysis, the placement of accelerometers were on the waist, hip,and wrist. However,the term“waist”usually included the hip.56-58When we stratified studies by the placement of the accelerometer,heterogeneity was not indicated in the group who wore accelerometers on their waist and hips(p=0.703).The pooled RRs for studies with waist- or hip-worn accelerometers was 0.86 (95%CI:0.84-0.87; n=8), and the pooled RRs for studies with wristworn acceleromenters was 0.68 (95%CI: 0.57-0.81; n=1).This may be consistent with other studies in that accelerometers perform better when placed on the waist than when placed on the wrist.48The reason for the decreased RR in wrist-worn accelerometers may be that when placed on the wrist, more steps are recorded (likely due to extraneous arm movements)than when the accelerometer is placed on the waist. The stepdetection algorithm developed for the waist location does not seem to work as well as the algorithm developed for the wrist location.59However, our results for this aspect of the metaanalysis need to be interpreted with caution due to the small number of studies involving wrist-worn accelerometers.
Our subgroup analyses for CVD showed no indication of heterogeneity when studies were stratified by the endpoint of CVD(total CVD or single cardiovascular event). A 7% lower risk of total CVD was observed. It suggests that our findings should be interpreted in the stratification of the total cardiovascular events,rather than a single CVD(e.g.,only stroke in this study).
The designs of the studies included in our meta-analysis were observational by nature. Therefore, it is impossible to rule out reverse causation(e.g.,that the number of daily steps might be low due to illness or poor health). To address this issue, some studies adjusted the final model for relevant prevalent chronic conditions at baseline and started follow-up 1 or 2 years after baseline.12,14,33-36,42Subgroup analyses demonstrated that there was no potential source of heterogeneity from the adjustment(Supplementary Table 3). This may suggest that our findings are not attributable to reverse causation bias.
Given that the age group of the study population varied considerably and the duration of follow-up differed from study to study,we did not analyze age-stratified subgroups.Studies that concentrate on step counts and variable outcomes among different age groups should be conducted in the future.
4.2. Strengths and limitations
There are many strengths in our meta-analysis. The studies included in our meta-analysis used prospective designs and clinical trials and step count was measured using wearable devices.Therefore, the differential misclassification of step count attributable to recall bias has been minimized. The majority of studies included were of comparatively high quality. Device-based step-by-day measurements are less subject to the bias typically associated with self-reporting.Based on recommended study protocols for accelerometer-wear length and time,60heterogeneity among studies has been considerably reduced by applying a common and standard definition of wear duration (7days), inclusion criteria, and valid wear-time definitions defined as 10 h/day(studies with accelerometer only).Moreover,we explained the dose-response association between the number of steps and risks of all-cause death and CVD.
We also recognize that there are several limitations to our study. First, most of the participants in the included studies were adults from developed countries and had higher socioeconomic status, thus limiting generalizability beyond these populations.It is unclear to what extent our results are generalizable in relation to racial/ethnic minorities or low- and middle-income individuals or settings.Second,all the data we analyzed from the included studies combined the results for men and women and included gender adjustment. Therefore,different-sex associations have been excluded; however, the findings from the 2 studies that treated men and women separately were consistent, suggesting that the associations we observed are similar for both sexes.12,33Third,most studies in our analysis included only adults who were at least 40 years of age, with only 1 study reporting on adults who were at least 18 years old.35Thus, it is not clear whether the results from our meta-analysis apply to youth. Fourth,the interpretation of associations with step count assessed by different devices(pedometers or accelerometers)in the included studies is challenging due to variations in data collected from different devices. Steps per day must be a rigorously validated metric,harmonized across multiple step-counting devices. Therefore,for all-cause death, we restricted the analyses to the accelerometer-based studies. Nevertheless, the results from recently published studies remain the best available evidence for assessing the longitudinal effect of step count on premature death and cardiovascular events.
4.3. Implications and future research
Our findings can inform future policy development in that they report on the associations between daily steps and reductions in the risks of premature death and cardiovascular events.They also highlight the importance in future research of accurate step-counting and the need to harmonize step data from different wearable devices.
We only examined associations of step count with all-cause mortality and CVD in developed countries and among populations having higher socio-economic status.Therefore,the data on the associations between the number of steps,as determined by device-based assessment, and mortality and CVD in lowand middle-income countries are currently very limited.Future additional work will be required to determine the associations between step count and cause-specific death and other chronic illnesses for populations of different ages and from different socio-economic groups.
5. Conclusion
The results from our meta-analysis suggest inverse associations, with nonlinear dose-response patterns, between higher step count and risk of premature death and cardiovascular events in middle-aged and older adults.
Acknowledgments
The project was funded by National Natural Science Foundation (NSFC 81872711) and the Fundamental Research Funds for the Central Universities(2242021S40011)of China.The authors thank Dr. Lina Wang and Dr. Xiaojin Yu of the Department of Epidemiology and Biostatistics of Southeast University for their advice on dose-response meta-analysis.The authors also thank the reviewers and editors for their valuable comments on the manuscript.
Authors’contributions
MS conceived the study, searched the databases, checked the studies according to the eligibility criteria and exclusion criteria,extracted and analyzed the data,and drafted the article;JY and RC conceived the study, provided advice on meta-analysis methodology, and contributed to reviewing and revising the article; TC searched the databases; MB and XW extracted quantitative data from some articles and contributed to writing,reviewing,and revising the essay; NZ, ML, BZ, HC, and YL critically reviewed and revised the article for important intellectual content; JC, as the guarantor,conceived the study,had full access to all the data,and took responsibility for the integrity of the data and the accuracy of the data analysis.All authors have read and approved the final version of the manuscript,and agree with the order of presentation of the authors.
Competing interests
The authors declare that they have no competing interests.
Supplementary materials
Supplementary material associated with this article can be found in the online version at doi:10.1016/j.jshs.2021.09.004.
 Journal of Sport and Health Science2021年6期
- Journal of Sport and Health Science的其它文章
- The association of grip strength with cardiovascular diseases and all-cause mortality in people with hypertension:Findings from the Prospective Urban Rural Epidemiology China Study
- Cardiorespiratory fitness measured with cardiopulmonary exercise testing and mortality in patients with cardiovascular disease:A systematic review and meta-analysis
- IGF1-PI3K-induced physiological cardiac hypertrophy:Implications for new heart failure therapies,biomarkers,and predicting cardiotoxicity
- The epigenetic landscape of exercise in cardiac health and disease
- Exploring the impact of COVID-19 on the movement behaviors of children and youth:A scoping review of evidence after the first year
- No independent associations between physical activity and clinical outcomes among hospitalized patients with moderate to severe COVID-19